Embed Size (px)
Citation preview
211
How Do We GatherEvidence of Validity Basedon a Test’s RelationshipsWith External Criteria?
CHAPTER 8
After completing your study of this chapter, you should be able to do the following:
• Identify evidence of validity of a test based on its relationships to external criteria (criterion-related validity), and describe two methods for obtaining this evidence.
• Read and interpret validity studies.• Discuss how restriction of range occurs and its consequences.• Describe the differences between evidence of validity based on test content and evidence
based on relationships with other variables.• Describe the difference between reliability and validity.• Define and give examples of objective and subjective criteria, and explain why criteria must
be reliable and valid.• Calculate a validity coefficient and the coefficient of determination, and conduct a test of
significance for the validity coefficient.• Explain the concept of regression, calculate and interpret a linear regression formula, and
interpret a multiple regression formula.
CHAPTER 8: HOW DOWE GATHER EVIDENCE OF VALIDITY BASED ON A TEST’SRELATIONSHIPS WITH EXTERNAL CRITERIA?
“The graduate school I’m applying to says they won’t accept anyone who scores less than 1,000on the GRE. How did they decide that 1,000 is the magic number?”
“Before we married, my fiancé and I went to a premarital counselor. She gave us a test that pre-dicted how happy our marriage would be.”
“My company uses a test for hiring salespeople to work as telemarketers. The test is designed forpeople selling life insurance and automobiles. Is this a good test for hiring telemarketers?”
Have you ever wondered how psychological tests really work? How can we be comfortable using anindividual’s answers to test questions to make decisions about hiring him for a job or admittingher to college? Can mental disorders really be diagnosed using scores on standard questionnaires?
Psychologists who use tests for decision making are constantly asking these questions and others likethem. When psychologists use test scores for making decisions that affect individual lives, they as well asthe public want substantial evidence that the correct decisions are being made.
This chapter describes the processes that psychologists use to ensure that tests perform properly whenthey are used for making predictions and decisions. We begin by discussing the concept of validity evi-dence based on a test’s relationships to other variables, specifically external criteria. As we discussed inChapter 7, this evidence has traditionally been called criterion-related validity. We also discuss theimportance of selecting a valid criterion measure, how to evaluate validity coefficients, and the statisti-cal processes that provide evidence that a test can be used for making predictions.
What Is Evidence of Validity Basedon Test-Criteria Relationships?
In Chapter 7, we introduced you to the concept of evidence of validity based on a test’s relationship withother variables. We said that one method for obtaining evidence is to investigate how well the test scorescorrelate with observed behaviors or events.When test scores correlate with specific behaviors, attitudes,or events, we can confirm that there is evidence of validity. In other words, the test scores may be usedto predict those specific behaviors, attitudes, or events. But as you recall from Chapter 7, we cannot usesuch evidence to make an overall statement that the test is valid. We also said that this evidence has tra-ditionally been referred to as criterion-related validity (a term that we use occasionally in this chapter asit is still widely used by testing practitioners).
For example, when you apply for a job, you might be asked to take a test that is designed to predicthow well you will perform on the job. If the job is clerical and the test really predicts how well you willperform on the job, your test score should be related to your skill in performing clerical duties such asword processing and filing. To provide evidence that the test predicts clerical performance, psychologistscorrelate test scores for a large number of people with another measure of their performance on clericaltasks, such as supervisor ratings. The measure of performance that we correlate with test scores is calledthe criterion. And if higher test scores are associated with higher performance ratings, then we can saythat the test has demonstrated evidence of validity based on the relationship between these two variables.In more traditional usage people say that the test has demonstrated criterion-related validity.
212——SECTION II: PSYCHOMETRIC PRINCIPLES
Educators use admissions tests to forecast how successful an applicant will be in college or graduateschool. The SAT and the Graduate Record Examination (GRE) are examples of admissions tests used bycolleges. The criterion of success in college is often the student’s first-year grade point average (GPA).
In a clinical setting, psychologists often use tests to diagnose mental disorders. In this case, the crite-rion is the diagnoses made by several psychologists or psychiatrists independent of the test. Researchersthen correlate the diagnoses with the test scores to establish evidence of validity.
Methods for Providing Evidence of ValidityBased on Test-Criteria Relationships
As you also recall from Chapter 7, there are two methods for demonstrating evidence of validity basedon test-criterion relationships: predictive and concurrent. This section defines and gives examples ofeach method.
The Predictive Method
When it is important to show a relationship between test scores and a future behavior, researchers usethe predictive method to establish evidence of validity. In this case, a large group of people take the test(the predictor), and their scores are held for a predetermined time interval. When the time interval haselapsed, researchers collect a measure of some behavior, for example, a rating or other measure of per-formance, on the same people (the criterion). Then researchers correlate the test scores with the criterionscores. If the test scores and the criterion scores have a strong relationship, we say the test has demon-strated predictive evidence of validity.
Researchers at Brigham Young University used the predictive method to demonstrate evidence ofvalidity of the PREParation for Marriage Questionnaire (PREP-M). For Your Information Box 8.1describes the study they conducted.
Psychologists might use the predictive method in an organizational setting to establish evidence ofvalidity for an employment test. To do so, they administer an employment test (predictor) to candidatesfor a job. Researchers file test scores in a secure place, and the company does not use the scores for mak-ing hiring decisions. The company makes hiring decisions based on other criteria such as interviews ordifferent tests. After a predetermined time interval, usually three to six months, supervisors evaluate thenew hires on how well they perform the job (the criterion). To determine whether the test scores predictthe candidates who were successful and unsuccessful, researchers correlate the test scores with the ratingsof job performance. The resulting correlation coefficient is called the validity coefficient, a statistic usedto infer the strength of the evidence of validity that the test scores might demonstrate in predicting jobperformance.
To get the best measure of validity, everyone who took the test would need to be hired so that all testscores could be correlated with a measure of job performance. It is desirable to get the widest range oftest scores possible (including the very low ones) to understand fully how all the test scores relate to jobperformance.
Gathering evidence of predictive validity can present problems for some organizations because it isimportant that everyone who took the test is also measured on the criterion. Some organizations might
Chapter 8: How Do We Gather Evidence of Validity Based on a Test’s Relationships With External Criteria?——213

FOR YOUR INFORMATION BOX 8.1
Evidence of Validity Based on Test-Criteria Relationshipsof a Premarital Assessment Instrument
In 1991, researchers at Brigham Young University (Holman, Larson, & Harmer, 1994) conducted a study to deter-mine the evidence of validity based on test-criteria relationships of the PREParation for Marriage Questionnaire(PREP-M; Holman, Busby, & Larson, 1989). Counselors use the PREP-M with engaged couples who are partici-pating in premarital courses or counseling. The PREP-M has 206 questions that provide information on couples’shared values, readiness for marriage, background, and home environment. The researchers contacted 103 mar-ried couples who had taken the PREP-M a year earlier as engaged couples and asked them about their maritalsatisfaction and stability.
The researchers predicted that those couples who had high scores on the PREP-M would express high satis-faction with their marriages. The researchers used two criteria to test their hypothesis. First, they drew questionsfrom the Marital Comparison Level Index (Sabatelli, 1984) and the Marital Instability Scale (Booth, Johnson, &Edwards, 1983) to construct a criterion that measured each couple’s level of marital satisfaction and marital sta-bility. The questionnaire showed an internal consistency of .83. The researchers also classified each couple aseither “married satisfied,” “married dissatisfied,” or “canceled/delayed” and as either “married stable,” “marriedunstable,” or “canceled/delayed.” These classifications provided a second criterion.
The researchers correlated the cou-ples’ scores on the PREP-M with theirscores on the criterion questionnaire.The husbands’ scores on the PREP-Mcorrelated at .44 (p < .01) with ques-tions on marital satisfaction and at .34(p < .01) with questions on marital sta-bility. The wives’ scores on the PREP-Mwere correlated with the same ques-tions at .25 (p < .01) and .20 (p < .05),respectively. These correlations showthat PREP-M is a moderate to strongpredictor of marital satisfaction andstability—good evidence of the validityof the PREP-M. (Later in this chapter,we discuss the size of correlation coef-ficients needed to establish evidence ofvalidity.)
In addition, the researchers compared the mean scores of those husbands and wives classified as married sat-isfied, married dissatisfied, or canceled/delayed and those classified as married stable, married unstable, or can-celed/delayed. As predicted, those who were married satisfied or married stable scored higher on the PREP-M thandid those in the other two respective categories. In practical terms, these analyses show that counselors can usescores on the PREP-M to make predictions about how satisfying and stable a marriage will be.
F Y I
not be able to hire everyone who applies regardless of qualifications, and there are usually more appli-cants than available positions, so not all applicants can be hired. Also, organizations frequently will beusing some other selection tool such as an interview to make hiring decisions, and typically, only peoplewho do well on the interview will be hired. Therefore, predictive studies in organizations may only haveaccess to the scores of a portion of the candidates for the job. Because those actually hired are likely to
214——SECTION II: PSYCHOMETRIC PRINCIPLES
be the higher performers, a restriction of range in the distribution of test scores is created. In otherwords, if the test is a valid predictor of job performance and the other selections tools that are used tomake a hiring decision are also valid predictors, then people with lower scores on the test will be lesslikely to be hired. This causes the range of test scores to be reduced or restricted to those who scored rel-atively higher. Because a validity study conducted on these data will not have access to the full range oftest scores, the validity coefficient calculated only from this restricted group is likely to be lower than ifall candidates had been hired and included in the study.
Think of it like this: The worst case of restricted range would be if everyone obtained exactly the samescore on the test (similar to what would happen if you hired only those people who made a perfect scoreon the test). If this situation occurred, the correlation between the test scores and any other criteriawould be zero. As you can see, if the test scores do not vary from person to person, high performers andlower performers would all have the same test score. We cannot distinguish high performers from lowperformers when everybody gets the same score, and therefore these test scores cannot be predictive ofjob performance. Using the full range of test scores enables you to obtain a more accurate validity coef-ficient, which usually will be higher than the coefficient you obtained using the restricted range of scores.Fortunately, the correlation coefficient can be statistically adjusted for restriction of range, which, whenused properly, can provide a corrected estimate of the validity coefficient of the employment test in theunrestricted population.
These problems exist in educational and clinical settings as well because individuals might not beadmitted to an institution or might leave during the predictive study. For Your Information Box 8.2describes a validation study that might have failed to find evidence of validity because of a flawed design.
The Concurrent Method
The method of demonstrating concurrent evidence of validity based on test-criteria relationships isan alternative to the predictive method that we discussed earlier in this chapter. In the concurrentmethod, test administration and criterion measurement happen at approximately the same time. Thismethod does not involve prediction. Instead, it provides information about the present and the statusquo (Cascio, 1991). A study by Watson and colleagues (1996), described in For Your Information Box 8.3,is a good example of a concurrent validity study.
The concurrent method involves administering two measures, the test and a second measure of theattribute, to the same group of individuals at as close to the same point in time as possible. For example,the test might be a paper-and-pencil measure of American literature, and the second measure might be agrade in an American literature course. Usually, the first measure is the test being validated, and the crite-rion is another type of measure of performance such as a rating, grade, or diagnosis. It is very importantthat the criterion test itself be reliable and valid (we discuss this further later in this chapter). Theresearchers then correlate the scores on the two measures. If the scores correlate, the test scores demonstrateevidence of validity.
In organizational settings, researchers often use concurrent studies as alternatives to predictive stud-ies because of the difficulties of using a predictive design that we discussed earlier. In this setting, theprocess is to administer the test to employees currently in the position for which the test is being con-sidered as a selection tool and then to collect criterion data on the same people (such as performanceappraisal data). In some cases, the criterion data are specifically designed to be used in the concurrentstudy, while in other cases recent, existing data are used. Then the test scores are correlated with the cri-terion data and the validity coefficient is calculated.
Chapter 8: How Do We Gather Evidence of Validity Based on a Test’s Relationships With External Criteria?——215

216——SECTION II: PSYCHOMETRIC PRINCIPLES
FOR YOUR INFORMATION BOX 8.2
Did Restriction of Range Decrease the Validity Coefficient?
Does a student’s academic self-concept—how the student views himself or herself in the role of a student—affectthe student’s academic performance? Michael and Smith (1976) developed the Dimensions of Self-Concept(DOSC), a self-concept measure that emphasizes school-related activities and that has five subscales that mea-sure level of aspiration, anxiety, academic interest and satisfaction, leadership and initiative, and identificationversus alienation.
Researchers at the University of Southern California (Gribbons, Tobey, & Michael, 1995) examined the evi-dence of validity based on test-criteria relationships of the DOSC by correlating DOSC test scores with gradepoint average (GPA). They selected 176 new undergraduates from two programs for students considered at riskfor academic difficulties. The students came from a variety of ethnic backgrounds, and 57% were men.
At the beginning of the semester, the researchers administered the DOSC to the students following theguidelines described in the DOSC manual (Michael, Smith, & Michael, 1989). At the end of the semester,they obtained each student’s first-semester GPA from university records. When they analyzed the data for evi-dence of reliability and validity, the DOSC showed high internal consistency, but scores on the DOSC didnot predict GPA.
Did something go wrong? One conclusion is that self-concept as measured by the DOSC is unrelated to GPA.However, if the study or the measures were somehow flawed, the predictive evidence of validity of the DOSCmight have gone undetected. The researchers suggested that perhaps academic self-concept lacks stability duringstudents’ first semester. Although the internal reliability of the DOSC was established, the researchers did not mea-sure the test–retest method reliability of the test. Therefore, this possibility cannot be ruled out. The researchers alsosuggested that GPA might be an unreliable criterion.
Could restriction of range have caused the validity of the DOSC to go undetected? This is a distinct possibil-ity for two reasons. First, for this study the researchers chose only those students who were at risk for experienc-ing academic difficulties. Because the unrestricted population of students also contains those who are expectedto succeed, the researchers might have restricted the range of both the test and the criterion. Second, the studentsin the study enrolled in programs to help them become successful academically. Therefore, participating in theprograms might have enhanced the students’ academic self-concept.
This study demonstrates two pitfalls that researchers designing predictive studies must avoid. Researchers mustbe careful to include in their studies participants who represent the entire possible range of performance on boththe test and the criterion. In addition, they must design predictive studies so that participants are unlikely tochange over the course of the study in ways that affect the abilities or traits that are being measured.
F Y I
Barrett, Phillips, and Alexander (1981) compared the two methods for determining evidence of valid-ity based on predictor-criteria relationships in an organizational setting using cognitive ability tests.They found that the two methods provide similar results.
How Validity Differs From Reliability
As you recall from Chapter 6, reliability refers to the consistency of test results and derives fromtwo factors: reliability within the test (internal consistency) and reliability across time (test–retestreliability). The reliability coefficient provides a quantitative estimate of a test’s consistency of mea-surement. A yardstick, for example, is a reliable or consistent measuring instrument because each
time it measures an item it gives the same answer. In addition, a yardstick is an appropriate measurefor measuring distance, and therefore we can say the yardstick has validity as a distance measure. Onthe other hand, a yardstick is not a valid measure of intelligence. There is no relation between heightand intelligence, and therefore we would not use a yardstick to predict IQ. This example demon-strates the principle that reliability and validity are two separate issues. A psychological test mightbe reliable but not valid, as in the case of the yardstick trying to predict intelligence. Reliability is acharacteristic of the test itself, and validity depends on the inferences that are going to be made fromthe test scores.
While reliability and validity are different concepts, there is a relationship between them when itcomes to gathering evidence of validity through test-criterion relationships. Mathematically, the squareroot of the reliability of a test will set the upper limit of the validity coefficient of a test. So if a test has arelatively low reliability of .64, the maximum correlation that the test could have with any criteria is .8.The point is that while a test can be reliable but not valid for a particular use, a test cannot be valid forany use if the scores are very unreliable.
Chapter 8: How Do We Gather Evidence of Validity Based on a Test’s Relationships With External Criteria?——217
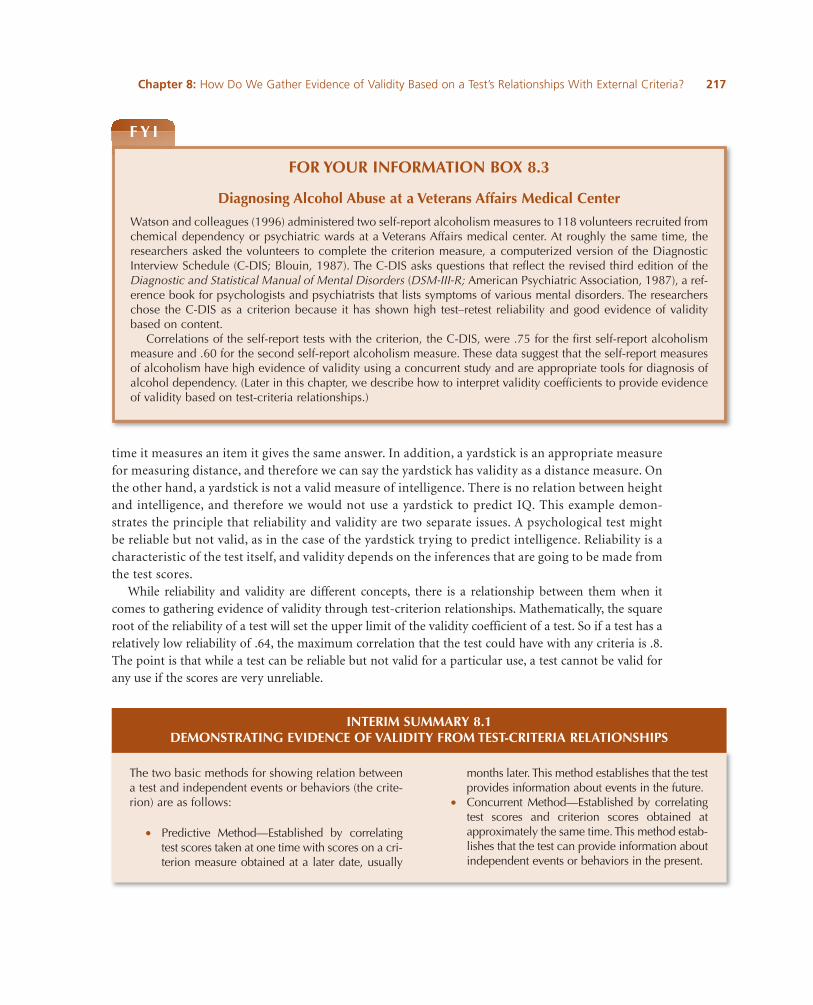
FOR YOUR INFORMATION BOX 8.3
Diagnosing Alcohol Abuse at a Veterans Affairs Medical Center
Watson and colleagues (1996) administered two self-report alcoholism measures to 118 volunteers recruited fromchemical dependency or psychiatric wards at a Veterans Affairs medical center. At roughly the same time, theresearchers asked the volunteers to complete the criterion measure, a computerized version of the DiagnosticInterview Schedule (C-DIS; Blouin, 1987). The C-DIS asks questions that reflect the revised third edition of theDiagnostic and Statistical Manual of Mental Disorders (DSM-III-R; American Psychiatric Association, 1987), a ref-erence book for psychologists and psychiatrists that lists symptoms of various mental disorders. The researcherschose the C-DIS as a criterion because it has shown high test–retest reliability and good evidence of validitybased on content.
Correlations of the self-report tests with the criterion, the C-DIS, were .75 for the first self-report alcoholismmeasure and .60 for the second self-report alcoholism measure. These data suggest that the self-report measuresof alcoholism have high evidence of validity using a concurrent study and are appropriate tools for diagnosis ofalcohol dependency. (Later in this chapter, we describe how to interpret validity coefficients to provide evidenceof validity based on test-criteria relationships.)
F Y I
INTERIM SUMMARY 8.1DEMONSTRATING EVIDENCE OF VALIDITY FROM TEST-CRITERIA RELATIONSHIPS
The two basic methods for showing relation betweena test and independent events or behaviors (the crite-rion) are as follows:
• Predictive Method—Established by correlatingtest scores taken at one time with scores on a cri-terion measure obtained at a later date, usually
months later. This method establishes that the testprovides information about events in the future.
• Concurrent Method—Established by correlatingtest scores and criterion scores obtained atapproximately the same time. This method estab-lishes that the test can provide information aboutindependent events or behaviors in the present.

Selecting a Criterion
A criterion is an evaluative standard that researchers use to measure outcomes such as performance, atti-tude, or motivation. Evidence of validity derived from test-criteria relationships provides evidence thatthe test relates to some behavior or event that is independent of the psychological test. As you recall fromFor Your Information Box 8.1, the researchers at Brigham Young University constructed two criteria—a questionnaire and classifications on marital satisfaction and marital stability—to demonstrate evi-dence of validity of the PREP-M.
In a business setting, employers use pre-employment tests to predict how well an applicant is likely toperform a job. In this case, supervisors’ ratings of job performance can serve as a criterion that repre-sents performance on the job. Other criteria that represent job performance include accidents on the job,attendance or absenteeism, disciplinary problems, training performance, and ratings by peers—otheremployees at the work site. None of these measures can represent job performance perfectly, but eachprovides information on important characteristics of job performance.
Objective and Subjective Criteria
Criteria for job performance fall into two categories: objective and subjective. An objective criterionis one that is observable and measurable, such as the number of accidents on the job, the number of daysabsent, or the number of disciplinary problems in a month. A subjective criterion is based on a person’sjudgment. Supervisor and peer ratings are examples of subjective criteria.
218——SECTION II: PSYCHOMETRIC PRINCIPLES
Table 8.1 Common Criteria
Objective Subjective
Educational settings
Grade point average X
Withdrawal or dismissal X
Teacher’s recommendations X
Clinical settings
Diagnosis X
Behavioral observation X
Self-report X
Organizational settings
Units produced X
Number of errors X
Ratings of performance X

Each has advantages and disadvantages. Well-defined objective criteria contain less error because they areusually tallies of observable events or outcomes. Their scope, however, is often quite narrow. For instance, dol-lar volume of sales is an objective criterion that might be used to measure a person’s sales ability. This num-ber is easily calculated, and there is little chance of disagreement on its numerical value. It does not, however,take into account a person’s motivation or the availability of customers.On the other hand, a supervisor’s rat-ings of a person’s sales ability may provide more information on motivation, but in turn ratings are based onjudgment and might be biased or based on information not related to sales ability, such as expectations aboutrace or gender. Table 8.1 lists a number of criteria used in educational, clinical, and organizational settings.
Does the Criterion MeasureWhat It Is Supposed to Measure?
The concept of validity evidence based on content (addressed in Chapter 7) also applies to criteria. Criteriamust be representative of the events they are supposed to measure. Criterion scores have evidence of valid-ity to the extent that they match or represent the events in question. Therefore, a criterion of sales abilitymust be representative of the entire testing universe of sales ability. Because there is more to selling thanjust having the highest dollar volume of sales, several objective criteria might be used to represent theentire testing universe of sales ability. For instance, we might add the number of sales calls made eachmonth to measure motivation and add the size of the target population to measure customer availability.
Subjective measures such as ratings can often demonstrate better evidence of their validity based oncontent because the rater can provide judgments for a number of dimensions specifically associated withjob performance. Rating forms are psychological measures, and we expect them to be reliable and valid,as we do for any measure. We estimate their reliability using the test–retest or internal consistencymethod, and we generate evidence of their validity by matching their content to the knowledge, skills,abilities, or other characteristics (such as behaviors, attitudes, personality characteristics, or other men-tal states) that are presumed to be present in the test takers. (Chapters 10 and 15 contain more informa-tion on various types of rating scales and their uses in organizations.)
By reporting the reliability of their criteria, researchers provide us with information on how accuratethe outcome measure is. As you may have noticed, the researchers at Brigham Young University (Holmanet al., 1989) who conducted the study on the predictive validity of the PREP-M reported high reliabilityfor their questionnaire, which was their subjective criterion. Likewise, the researchers at the VeteransAffairs medical center (Watson et al., 1996) chose the computerized version of the Diagnostic InterviewSchedule (C-DIS) as a criterion because it reflected the Diagnostic and Statistical Manual of MentalDisorders (DSM-III-R; American Psychiatric Association, 1987) diagnosis of alcohol dependency—anindicator that the C-DIS showed evidence of validity based on content.
Sometimes criteria do not represent all of the dimensions in the behavior, attitude, or event beingmeasured. When this happens, the criterion has decreased evidence of validity based on its contentbecause it has underrepresented some important characteristics. If the criterion measures more dimen-sions than those measured by the test, we say that criterion contamination is present. For instance, if onewere looking at the test-criterion relationship of a test of sales aptitude, a convenient criterion might bethe dollar volume of sales made over some period of time. However, if the dollar volume of sales of a newsalesperson reflected both his or her own sales as well as sales that resulted from the filling of back orderssold by the former salesperson, the criterion would be considered contaminated.
Chapter 8: How Do We Gather Evidence of Validity Based on a Test’s Relationships With External Criteria?——219
Calculating and Evaluating Validity Coefficients
As you recall from Chapter 5, the correlation coefficient is a quantitative estimate of the linear rela-tionship between two variables. In validity studies, we refer to the correlation coefficient betweenthe test and the criterion as the validity coefficient and represent it in formulas and equations as rxy.The x in the subscript refers to the test, and the y refers to the criterion. The validity coefficient rep-resents the amount or strength of the evidence of validity based on the relationship of the test andthe criterion.
Validity coefficients must be evaluated to determine whether they represent a level of validity thatmakes the test useful and meaningful. This section describes two methods for evaluating validity coeffi-cients and how researchers use test-criterion relationship information to make predictions about futurebehavior or performance.
Tests of Significance
A validity coefficient is interpreted in much the same way as a reliability coefficient, except that ourexpectations for a very strong relationship are not as great.We cannot expect a validity coefficient to haveas strong a relationship with another variable (test-criterion evidence of validity) as it does with itself(reliability). Therefore, we must evaluate the validity coefficient by using a test of significance and byexamining the coefficient of determination.
As you can see, when evaluating a validation study, it is important to think about the criterion in thestudy as well as the predictor. When unreliable or inappropriate criteria are used for validation, the truevalidity coefficient might be under- or overestimated. For Your Information Box 8.4 describes the issuesassociated with identifying appropriate criteria to represent success in graduate school.
220——SECTION II: PSYCHOMETRIC PRINCIPLES
FOR YOUR INFORMATION BOX 8.4
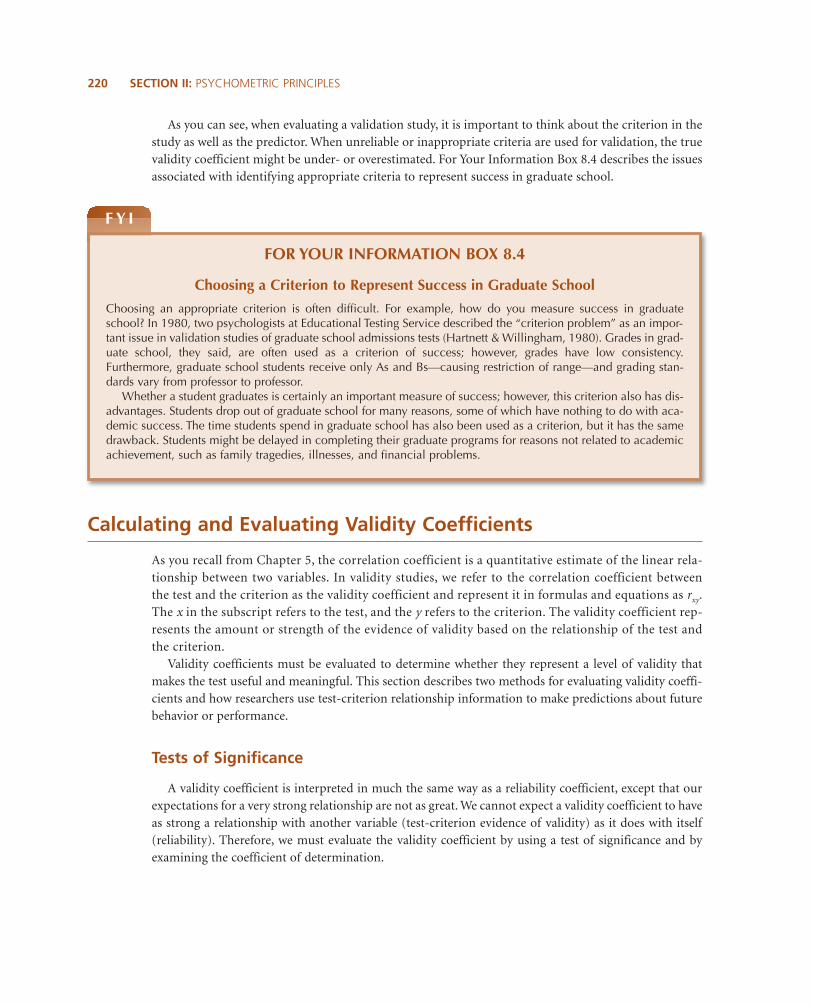
Choosing a Criterion to Represent Success in Graduate School
Choosing an appropriate criterion is often difficult. For example, how do you measure success in graduateschool? In 1980, two psychologists at Educational Testing Service described the “criterion problem” as an impor-tant issue in validation studies of graduate school admissions tests (Hartnett & Willingham, 1980). Grades in grad-uate school, they said, are often used as a criterion of success; however, grades have low consistency.Furthermore, graduate school students receive only As and Bs—causing restriction of range—and grading stan-dards vary from professor to professor.
Whether a student graduates is certainly an important measure of success; however, this criterion also has dis-advantages. Students drop out of graduate school for many reasons, some of which have nothing to do with aca-demic success. The time students spend in graduate school has also been used as a criterion, but it has the samedrawback. Students might be delayed in completing their graduate programs for reasons not related to academicachievement, such as family tragedies, illnesses, and financial problems.
F Y I

The first question to ask about a validity coefficient is, “How likely is it that the correlation betweenthe test and the criterion resulted from chance or sampling error?” In other words, if the test scores(for example, SAT scores) and the criterion (for example, college GPA) are completely unrelated, thentheir true correlation is zero. If we conducted a study to determine the relationship between these twovariables and found that the correlation was .4, one question that we need to ask is, “What is the proba-bility that our study would have yielded the obtained correlation by chance alone, even if the variableswere truly unrelated?” If the probability that the correlation occurred by chance is low—less than 5 chancesout of 100 (p < .05)—we can be reasonably sure that the test and its criterion (in this example, SAT scoresand college GPA) are truly related. This process is called a test of significance. In statistical terms, for thisexample we would say that the validity coefficient is significant at the .05 level. In organizational settings,it can be challenging for validity studies to have statistically significant results at p < .05 because of smallsample sizes and criterion contamination.
Because larger sample sizes reduce sampling error, this test of significance requires that we take intoaccount the size of the group (N) from which we obtained our data. Appendix E can be used to deter-mine whether a correlation is significant at varying levels of significance. To use the table in Appendix E,calculate the degrees of freedom (df) for your correlation using the formula df = N – 2, and then deter-mine the probability that the correlation occurred by chance by looking across the row associated withthose degrees of freedom. The correlation coefficient you are evaluating should be larger than the criti-cal value shown in the table. You can determine the level of significance by looking at the column head-ings. At the level where your correlation coefficient is smaller than the value shown, the correlation canno longer be considered significantly different from zero. For Your Information Box 8.5 provides anexample of this process.
When researchers or test developers report a validity coefficient, they should also report its level ofsignificance. You might have noted that the validity coefficients of the PREP-M (reported earlier in thischapter) are followed by the statements p < .01 and p< .05. This information tells the test user that thelikelihood a relationship was found by chance or as a result of sampling error was less than 5 chances outof 100 (p < .05) or less than 1 chance out of 100 (p < .01).
If the correlation between the test and the predictor is not as high as the critical value shown inthe table, we can say that the chance of error associated with the test is above generally acceptedlevels. In such a case, we would conclude that the validity coefficient does not provide sufficientevidence of validity.
The Coefficient of Determination
Another way to evaluate the validity coefficient is to determine the amount of variance that the testand the criterion share. We can determine the amount of shared variance by squaring the validity coef-ficient to obtain r2—called the coefficient of determination. For example, if the correlation (r) betweena test and a criterion is .30, the coefficient of determination (r2) is .09. This means that the test and thecriterion have 9% of their variance in common. Larger validity coefficients represent stronger relation-ships with greater overlap between the test and the criterion. Therefore, if r = .50, then r2 = .25—or 25%shared variance.
We can calculate the coefficient of determination for the correlation of husbands’ scores on the PREP-M and the questionnaire on marital satisfaction and stability. By squaring the original coefficient, .44, we
Chapter 8: How Do We Gather Evidence of Validity Based on a Test’s Relationships With External Criteria?——221
obtain the coefficient of determination, r2 = .1936. This outcome means that the predictor, the PREP-M,and the criterion, the questionnaire, shared (or had in common) approximately 19% of their variance.
Unadjusted validity coefficients rarely exceed .50. Therefore, you can see that even when a valid-ity coefficient is statistically significant, the test can account for only a small portion of the vari-ability in the criterion. The coefficient of determination is important to calculate and rememberwhen using the correlation between the test and the criterion to make predictions about futurebehavior or performance.
222——SECTION II: PSYCHOMETRIC PRINCIPLES
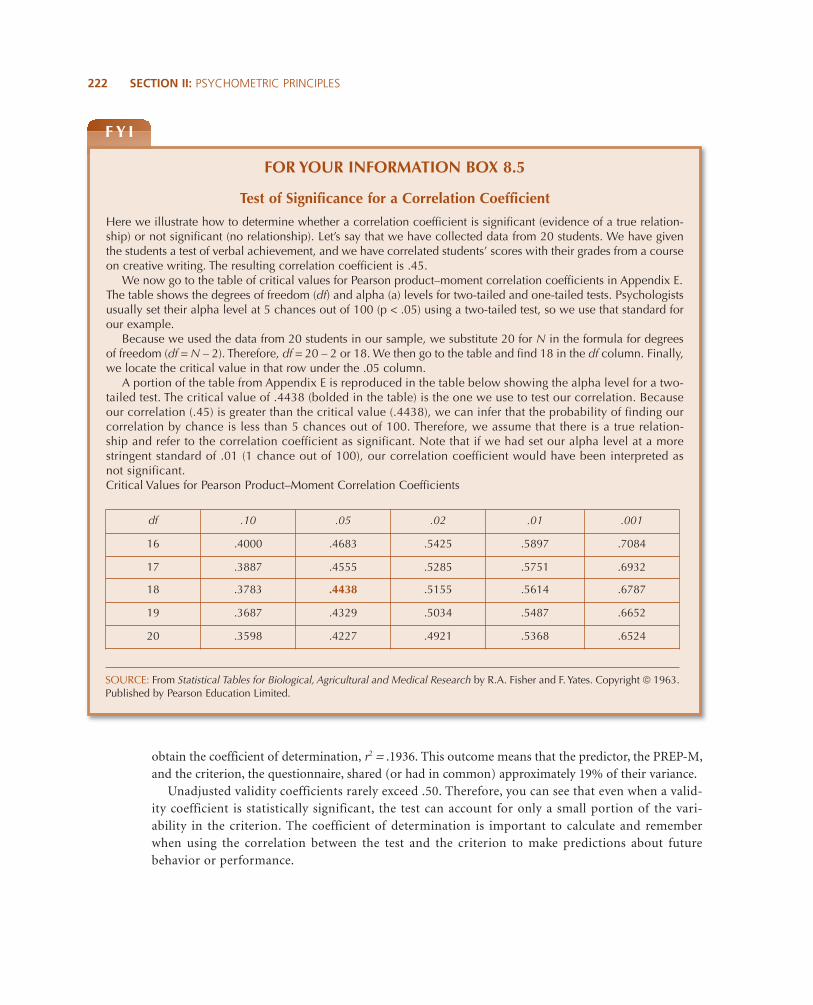
FOR YOUR INFORMATION BOX 8.5
Test of Significance for a Correlation Coefficient
Here we illustrate how to determine whether a correlation coefficient is significant (evidence of a true relation-ship) or not significant (no relationship). Let’s say that we have collected data from 20 students. We have giventhe students a test of verbal achievement, and we have correlated students’ scores with their grades from a courseon creative writing. The resulting correlation coefficient is .45.
We now go to the table of critical values for Pearson product–moment correlation coefficients in Appendix E.The table shows the degrees of freedom (df) and alpha (a) levels for two-tailed and one-tailed tests. Psychologistsusually set their alpha level at 5 chances out of 100 (p < .05) using a two-tailed test, so we use that standard forour example.
Because we used the data from 20 students in our sample, we substitute 20 for N in the formula for degreesof freedom (df = N – 2). Therefore, df = 20 – 2 or 18. We then go to the table and find 18 in the df column. Finally,we locate the critical value in that row under the .05 column.
A portion of the table from Appendix E is reproduced in the table below showing the alpha level for a two-tailed test. The critical value of .4438 (bolded in the table) is the one we use to test our correlation. Becauseour correlation (.45) is greater than the critical value (.4438), we can infer that the probability of finding ourcorrelation by chance is less than 5 chances out of 100. Therefore, we assume that there is a true relation-ship and refer to the correlation coefficient as significant. Note that if we had set our alpha level at a morestringent standard of .01 (1 chance out of 100), our correlation coefficient would have been interpreted asnot significant.Critical Values for Pearson Product–Moment Correlation Coefficients
F Y I
SOURCE: From Statistical Tables for Biological, Agricultural and Medical Research by R.A. Fisher and F. Yates. Copyright 1963.Published by Pearson Education Limited.
df .10 .05 .02 .01 .001
16 .4000 .4683 .5425 .5897 .7084
17 .3887 .4555 .5285 .5751 .6932
18 .3783 .4438 .5155 .5614 .6787
19 .3687 .4329 .5034 .5487 .6652
20 .3598 .4227 .4921 .5368 .6524
Using Validity Information to Make Predictions
When a relationship can be established between a test and a criterion, we can use test scores from otherindividuals to predict how well those individuals will perform on the criterion measure. For example,some universities use students’ scores on the SAT to predict the students’ success in college. Organizationsuse job candidates’ scores on pre-employment tests that have demonstrated evidence of validity to pre-dict those candidates’ scores on the criteria of job performance.
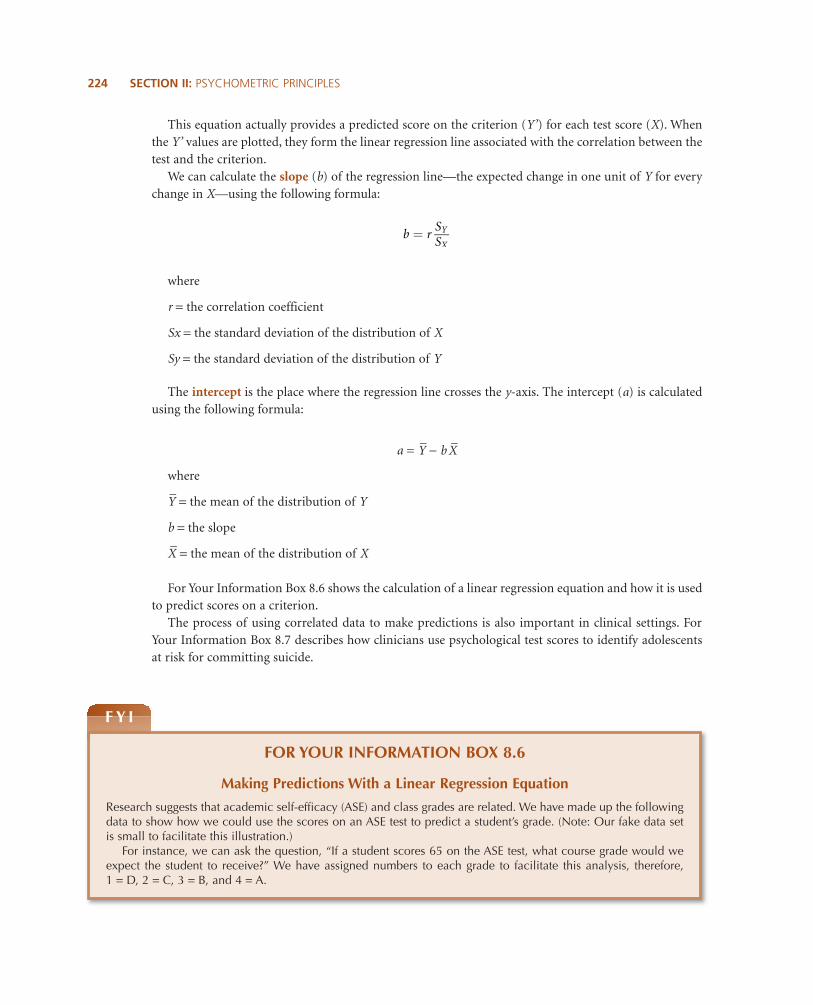
Linear Regression
We use the statistical process called linear regression when we use one set of test scores (X) to predictone set of criterion scores (Y’). To do this, we construct the following linear regression equation:
Y’ = a + bX
where
Y’ = the predicted score on the criterion
a = the intercept
b = the slope
X = the score the individual made on the predictor test
How Confident Can We Be About Estimates of Validity?
Conducting one validity study that demonstrates a strong relationship between the test and the criterion isthe first step in a process of validation, but it is not the final step. Studies that provide evidence of a test’s valid-ity should continue for as long as the test is being used.Nomatter howwell designed the validation study is, ele-ments of chance, error, and situation-specific factors that can over- or underinflate the estimate of validity arealways present. Ongoing investigations of validity include cross-validation (where the results that are obtainedusing one sample are used to predict the results on a second, similar sample) and meta-analyses (wherethe results from many studies are statistically combined to provide a more error-free estimate of validity).Psychologists also inquire about whether validity estimates are stable from one situation or population toanother—a question of validity generalization. (Chapters 12 and 15 address these issues in more detail.)
Chapter 8: How Do We Gather Evidence of Validity Based on a Test’s Relationships With External Criteria?——223
INTERIM SUMMARY 8.2EVALUATING VALIDITY COEFFICIENTS
• Tests of significance establish the likelihood that acorrelation observed between a test and a crite-rion was obtained by chance.
• The coefficient of determination describes howmuch variance a test and a criterion share.
• Ongoing investigations of validity include cross-validation and meta-analyses.
• Psychologists also inquire about whether validityestimates are stable from one situation or populationto another—a question of validity generalization.
224——SECTION II: PSYCHOMETRIC PRINCIPLES
This equation actually provides a predicted score on the criterion (Y’) for each test score (X). Whenthe Y’ values are plotted, they form the linear regression line associated with the correlation between thetest and the criterion.
We can calculate the slope (b) of the regression line—the expected change in one unit of Y for everychange in X—using the following formula:
where
r = the correlation coefficient
Sx = the standard deviation of the distribution of X
Sy = the standard deviation of the distribution of Y
The intercept is the place where the regression line crosses the y-axis. The intercept (a) is calculatedusing the following formula:
a = Y– − bX
–
where
Y– = the mean of the distribution of Y
b = the slope
X– = the mean of the distribution of X
For Your Information Box 8.6 shows the calculation of a linear regression equation and how it is usedto predict scores on a criterion.
The process of using correlated data to make predictions is also important in clinical settings. ForYour Information Box 8.7 describes how clinicians use psychological test scores to identify adolescentsat risk for committing suicide.
b ¼ rSY
SX
FOR YOUR INFORMATION BOX 8.6
Making Predictions With a Linear Regression Equation
Research suggests that academic self-efficacy (ASE) and class grades are related. We have made up the followingdata to show how we could use the scores on an ASE test to predict a student’s grade. (Note: Our fake data setis small to facilitate this illustration.)
For instance, we can ask the question, “If a student scores 65 on the ASE test, what course grade would weexpect the student to receive?” We have assigned numbers to each grade to facilitate this analysis, therefore,1 = D, 2 = C, 3 = B, and 4 = A.
F Y I

Chapter 8: How Do We Gather Evidence of Validity Based on a Test’s Relationships With External Criteria?——225
Step 1: Calculate the means and standard deviations of X and Y.
X– = 63.2Y– = 2.6Sx = 20.82Sy = .97
Step 2: Calculate the correlation coefficient (rxy) for X and Y.
rxy = .67
Step 3: Calculate the slope and intercept.
b = r (Sy/Sx), so b = .67(.97/20.82), so b = .031a = Y– – bX–, a = 2.6 – (.031)(63.2), so a = .64
Step 4: Calculate Y’ when X = 65.
Y’ = a + bXY’ = .64 + (.031)(65)Y’ = .64 + .2.05 = 2.59
Step 5: Translate the number calculated for Y’ back into a letter grade.
Therefore, 2.59 would be a grade of between C and B, perhaps a C+.The best prediction we can make is that a person who scored 65 on an ASE test would be expected to earn a
course grade of C+. Note that by substituting any test score for X, we will receive a corresponding prediction fora score on Y.
StudentASE(X–)
Grade(Y–)
1 80 3
2 62 2
3 90 4
4 40 2
5 55 2
6 85 2
7 70 4
8 75 3
9 25 1
10 50 3
FOR YOUR INFORMATION BOX 8.7
Evidence of Validity of the Suicide Probability Scale Using the Predictive Method
Although the general incidence of suicide has decreased during the past two decades, the rate for peoplebetween 15 and 24 years old has tripled. Suicide is generally considered to be the second or third most commoncause of death among adolescents, even though it is underreported (O’Connor, 2008).
If young people who are at risk for committing suicide or making suicide attempts can be identified, greatervigilance is likely to prevent such actions. Researchers at Father Flanagan’s Boys’ Home, in Boys Town, Nebraska,conducted a validity study using the predictive method for the Suicide Probability Scale (SPS) that providedencouraging results for predicting suicidal behaviors in adolescents (Larzelere, Smith, Batenhorst, & Kelly, 1996).
The SPS contains 36 questions that assess suicide risk, including thoughts about suicide, depression, and iso-lation. The researchers administered the SPS to 840 boys and girls when they were admitted to the Boys Townresidential treatment program from 1988 through 1993. The criteria for this study were the numbers of suicideattempts, suicide verbalizations, and self-destructive behaviors recorded in the program’s Daily Incident Reportcompleted by supervisors of the group homes. (The interrater reliabilities for reports of verbalizations and reportsof self-destructive behaviors were very high at .97 and .89, respectively. The researchers were unable to calcu-late a reliability estimate for suicide attempts because only one attempt was recorded in the reports they selectedfor the reliability analysis.)
(Continued)
F Y I
Multiple Regression
Complex criteria, such as job performance and success in graduate school, are often difficult to pre-dict with a single test. In these situations, researchers use more than one test to make an accurate pre-diction. An expansion of the linear regression equation helps in this situation.
We use the statistical process of multiple regression for predicting a criterion (Y’) using more thanone set of test scores (X1, X2, . . . Xn ) The multiple regression equation that incorporates information frommore than one predictor or test is as follows:
Y’ = a + b1X1 + b2X2 + b3X3 . . . bnXn
where
Y’ = the predicted score on the criterion
a = the intercept
b = the slope of the regression line and amount of variance the predictor contributes to the equation,also known as beta (β)
X = the predictor
The numbers following b and X indicate the test from which the information was drawn.In multiple regression, there is one criterion (Y), but there are several predictors (X). To describe this
relationship, we use a multiple correlation (R). We can evaluate R by calculating the coefficient of mul-tiple determination (R2), which indicates the proportion of variance in the criterion accounted for by allof the predictors. The R can also be subjected to a test of significance to determine whether it is signifi-cantly different from zero. We can also calculate the contribution that each predictor (X) by itself
226——SECTION II: PSYCHOMETRIC PRINCIPLES
(Continued)
After controlling for a number of confounding variables, such as gender, age, and prior attempts of suicide, theresearchers determined that the total SPS score and each of its subscales differentiated (p < .05) between those whoattempted suicide and those who did not. In other words, the mean SPS scores of those who attempted suicidewere significantly higher than the mean SPS scores of those who did not attempt suicide. The mean SPS scores ofthose who displayed self-destructive behaviors were also significantly higher (p < .01) than the mean SPS scoresof those who did not attempt self-destructive behaviors. Finally, the total SPS score correlated .25 (p < .001) withthe suicide verbalization rate. Predictions made by the SPS for those at risk for attempting suicide showed that each1-point increase in the total SPS score predicted a 2.4% greater likelihood of a subsequent suicide attempt.
The researchers suggest a cutoff score of 74 for those without prior suicide attempts and a cutoff score of 53for those with prior suicide attempts. In other words, if an adolescent who has no previous history of suicideattempts scores above 74 on the SPS, the youth would be classified as at risk for suicide and treated accordingly.If an adolescent who has a previous history of a suicide attempt scores below 53, the youth would be classifiedas not at risk for suicide.
The researchers emphasize, however, that although the SPS demonstrated statistically significant validity inpredicting suicide attempts, it is not a perfect predictor. A number of suicide attempts were also recorded forthose with low scores, and therefore a low SPS score does not ensure that an adolescent will not attempt sui-cide. The SPS does, however, provide an instrument for accurately identifying adolescents at risk for commit-ting suicide.

contributes to the total explained variance (R2). We must bear in mind, however, that when a predictoris first in the multiple regression equation, it is likely to explain more variance than when the predictoris last. This is the case when the predictors share variance (are correlated) with each other as well as withthe criterion.
Because each combination of a + bX in the preceding equation indicates the presence of a differentregression line, the multiple regression equation is difficult to plot. It works in theory, however, much thesame as does the linear regression equation. The value of each b (partial regression coefficient) indicateshow many units Y increases for every increase in X, and therefore each b indicates the contribution thateach predictor makes in determining a predicted score on the criterion (Y’).
Chibnall and Detrick (2003) published a study that examined the usefulness of three personalityinventories—the Minnesota Multiphasic Personality Inventory-2 (MMPI-2), the Inwald PersonalityInventory (IPI; an established police officer screening test), and the Revised NEO Personality Inventory(NEO PI-R)—for predicting the performance of police officers. They administered the inventories to79 police recruits and compared the test scores with two criteria: academic performance and physicalperformance. Tables 8.2 and 8.3 show the outcomes of the study for the academic performance criterion.
On the Web Box 8.1 guides you in researching the Inwald Personality Test. Can you find informationon evidence of validity based on test-criteria relationships for this test?
When the researchers entered recruit class, marital status, and race first, they accounted for 20% of theprediction of academic performance. In the second step, the researchers entered the test scores fromthe IPI. The table shows the contribution of the inventory dimensions that contributed significantly to theprediction. Together, the three dimensions of the IPI contributed 16% of the prediction (R2∆). In the thirdstep, the researchers entered two dimensions of the MMPI-2, and together they accounted for 8% of theprediction. Finally, the researchers entered three dimensions of the NEO PI-R, and together theyaccounted for another 11% of the prediction. Altogether, the demographic characteristics and the threeinventories accounted for 55% of the prediction of academic performance (R2).
Chapter 8: How Do We Gather Evidence of Validity Based on a Test’s Relationships With External Criteria?——227
Table 8.2 Regression Model for Predicting Academic Performance (R2 = .55)
SOURCE: Reprinted with permission from Chibnall, J. T., & Detrick, P. (2003). The NEO PI-R, Inwald Personality Inventory, and MMPI-2 inthe prediction of police academy performance: A case for incremental validity. American Journal of Criminal Justice, 27, 233–248.
NOTE: Step refers to the introduction of a predictor into the regression equation for predicting academic performance. The predictorsare the individual demographic characteristics or the subscales that reached significance. R2∆ is the percentage of prediction of acade-mic performance contributed by each predictor.
Step 1 Step 2 Step 3 Step 4
Demographic Variables IPI MMPI-2 NEO PI-R
Predictor β Predictor β Predictor β Predictor β
Recruit class .32 Trouble law −.26 Depression −.21 Assertiveness −.40
Marital status .27 Antisocial −.35 Hypomania −.27 Ideas .20
Race .24 Obsessiveness .29 Depression −.28
R2∆ .20 R2∆ .16 R2D .08 R2∆ .11

Demographic characteristics did not contribute to the prediction of physical performance. Only theNEO PI-R predicted 20% (R2∆ = .20) of the variance for physical performance. The dimensions of theNEO PI-R that accounted for variance in the criterion were Fantasy (β = .47), Deliberation (β = .26), andFeelings (β = .25).
Two studies (Kolb, Race, & Seibert, 2000; Meyer, Woodard, & Suddick, 1994) illustrate the usefulnessof multiple regression in providing evidence of validity from test-criterion relationships. Kolb and col-leagues evaluated the evidence of validity of a questionnaire designed to assess the satisfaction of psy-chiatric inpatients. They distributed the questionnaire to inpatients in 37 psychiatric units. Their dataanalysis showed that all coefficient alphas for the six scales in the questionnaire were above .74. Theresults of a multiple regression analysis, in which the six scales were used as predictors and the overallquality-of-care ratings were used as the criterion, are displayed in Table 8.4.
228——SECTION II: PSYCHOMETRIC PRINCIPLES
Table 8.3 Range of Variance Explained (R2) by Each Inventory at Each Step in the Regression Models That PredictAcademic Performance
SOURCE: Reprinted with permission from Chibnall, J. T., & Detrick, P. (2003). The NEO PI-R, Inwald Personality Inventory, and MMPI-2 inthe prediction of police academy performance: A case for incremental validity. American Journal of Criminal Justice, 27, 233–248.
NOTE: Step refers to the introduction of a predictor into the regression equation for predicting academic performance. MMPI-2 =Minnesota Multiphasic Personality Inventory-2, IPI = Inwald Personality Inventory, NEO PI-R = Revised NEO Personality Inventory.
Predictor Step 1 Step 2 Step 3 Step 4
Demographics .20 — — —
NEO PI-R — .20 .14 to .16 .11 to .16
IPI — .16 .00 to .05 .03 to .03
MMPI-2 — .14 .08 to .10 .00 to .08
SOURCE: From Kolb, S. J., Race, K. E. H., & Siebert, J. H. (2000). Psychometric evaluation of an inpatient psychiatric care con-sumer satisfaction survey. Journal of Behavioral Health Services and Research, 27, 75–86. Published by Springer Science andBusiness Media.
NOTE: Stepwise multiple regression is based on a sample of 1,351 patients. Partial R2 = additional variance explained at each step. Theproportion of variance explained at each step is affected by the order in which these scales are entered into the model. Modifying theorder of inclusion could result in proportional changes in this variance. R2 = total variance explained at each step.
Table 8.4 Power of Inpatient Psychiatric Scales to Predict Quality-of-Care Ratings
ScalePearson Product–MomentCorrelation Coefficient Partial R2 R2
Staff .667 .422 .422
Nonclinical Services .642 .199 .541
Program Components/Activities .570 .026 .576
Psychiatric Care .534 .006 .573
Medical Outcome .445 .002 .575
Patient Education .425 .002 .577
Meyer and colleagues (1994) conducted a validity study using the predictive method of two ofthe Descriptive Tests of Mathematics Skills (DTMS) of the College Entrance Examination Board.The researchers’ university requires elementary education majors to pass the Arithmetic Skillsand Elementary Algebra Skills tests of the DTMS. The university also requires elementary edu-cation majors to take an upper-division mathematics concepts and structures course. In thisstudy, the Arithmetic Skills and Elementary Algebra Skills tests were the predictors, and the gradereceived in the upper-division math course became the criterion in a study of 60 elementary edu-cation majors.
In their data analysis, Meyer and colleagues (1994) found evidence of internal consistency for thetwo tests: Arithmetic Skills (.72) and Elementary Algebra Skills (.77). Course grades (the criterion)correlated with Arithmetic Skills at .48 (p < .001) and correlated with Elementary Algebra Skills at .49(p < .001).
As you can see, Table 8.4 shows the correlation of each scale with the criterion in the Pearson’sProduct–Moment Correlation Coefficient column. The Partial R2 column shows the increase in percentageof variance that each scale provides. The partial R2 values will vary when the order in which the scalesappear in the formula changes. The R2 column (the coefficient of determination for R) shows the percent-age of variance accounted for at each step in the formula. Using just one scale on the questionnaireaccounts for 42.2% of the variance in the overall score, but using all six scales accounts for 57.7% of thevariance. We would expect such an outcome because each scale provides information about a differentaspect of inpatient satisfaction. Although Kolb and colleagues’ (2000) report of the results of their dataanalysis is clear, they do not provide information on how the criterion was developed, measured, or cal-culated. As you know from our discussion of criterion validity, we cannot rely on the results of studiesthat do not provide information on the criterion measure.
Chapter 8: How Do We Gather Evidence of Validity Based on a Test’s Relationships With External Criteria?——229
ON THE WEB BOX 8.1
Conducting Research
This book contains detailed information on the revised Minnesota Multiphasic PersonalityInventory-2 (see Chapter 11) and the Revised NEO Personality Inventory (see Chapter 14).Using professional databases, such as ProQuest, Mental Measurements Yearbook, Tests inPrint, and Education Resources Information Center (ERIC), research the Inwald PersonalityInventory. Chapter 1 provides information on using the Mental Measurements Yearbook and
Tests in Print. (Hint: Detrick, Chibnall, & Rosso, 2001, is also relevant to this exercise.)Find the following:
• Test purpose• Target audience• Reliability and validity estimates
Taking into account the information you found on the Inwald Personality Inventory, would yourecommend that organizations use the test for selection purposes? Back up your recommendationwith the information you found.
Then the researchers used both tests in a multiple regression equation to predict course grades.They found a multiple R of .54—higher than either test predicted independently—that accounted forapproximately 29% of the variance in the two tests and course grades (R2 = .286). Most of the variance,however, was predicted by one test, Elementary Algebra, which accounted for 24% of the variance(R2 = .241). The multiple R for Elementary Algebra alone and the R for both tests together were notsignificantly different.
Meyer and colleagues (1994) concluded that each test showed evidence of validity and could be usedas a predictor of math performance for elementary education majors. In addition, they suggested sim-plifying the assessment program by using one test instead of two tests because the tests supplied redun-dant information about the criterion (course grades).
Ethical Issues Associated With Test Validation
Decisions based on test predictions have far-reaching consequences. Each day in the United States andother industrialized nations, individuals are hired or rejected by organizations that base their decisionson employment tests. Therefore, test users must rely on validity studies to ensure that the tests they usemake accurate predictions.
Educators also use test results to admit or refuse admittance to programs based on predictions madeby educational ability tests, and clinicians use tests to screen clients for residential or outpatient treat-ment and to admit them to specific treatment programs based on diagnoses made by tests. As you recallfrom Chapter 3, Michael Elmore’s teacher used Michael’s score on an intelligence test to decide thatMichael was borderline retarded even though he was not.
The increasing diversity of the population in the United States presents questions about the suit-ability of tests for students, clinical clients, employees, and job seekers from various minorities. Also,as the use of psychological assessment spreads to countries whose primary languages are not English,questions arise concerning translations and norms associated with translations of standardized testsdeveloped in the United States and Great Britain. When test takers are members of minorities, espe-cially those who do not speak standard English as their primary language, test users must be awareof test bias and how it affects test validity. Cofresi and Gorman (2004) assert that the test users’responsibilities include testing assessment tools to ensure that they are valid for the minority popu-lation who will be the test takers. Appropriate assessments, they emphasize, should be free of ques-tions that require a specific cultural background (for example, knowledge of sports, holidays, orfoods; etiquette related to specific cultures, races, or religions). The use of test norms that were devel-oped without inclusion of the minority being tested is likely to be inappropriate for interpreting testscores of the minority group.
With each decision, the test user is ethically and morally responsible for ascertaining that the testinstrument shows acceptable evidence of reliability and validity. In some cases, such as employmentdecisions in which there is discrimination against protected classes, test users might be held legallyliable for improper test use. Test users rely on researchers and test publishers to provide full informa-tion about tests. Test publishers have a particular responsibility to prevent test misuse by making testmanuals and validity information available and accessible before test users purchase their tests.Publishers should also refuse to provide test materials to persons who do not have testing credentials
230——SECTION II: PSYCHOMETRIC PRINCIPLES

Chapter Summary
Evidence of validity based on test-criteria relations—the extent to which a test is related to inde-pendent behavior or events—is one of the major methods for obtaining evidence of test validity.The usual method for demonstrating this evidence is to correlate scores on the test with a measureof the behavior we wish to predict. This measure of independent behavior or performance is calledthe criterion.
Evidence of validity based on test-criteria relations depends on evidence that the scores on the testcorrelate significantly with an independent criterion—a standard used to measure some characteristic ofan individual, such as a person’s performance, attitude, or motivation. Criteria may be objective or sub-jective, but they must be reliable and valid. There are two methods for demonstrating evidence of valid-ity based on test-criteria relations: predictive and concurrent.
We use correlation to describe the relationship between a psychological test and a criterion. In thiscase, the correlation coefficient is referred to as the validity coefficient. Psychologists interpret validitycoefficients using tests of significance and the coefficient of determination.
Either a linear regression equation or a multiple regression equation can be used to predict criterionscores from test scores. Predictions of success or failure on the criterion enable test users to use test scoresfor making decisions about hiring.
Finally, decisions based on test predictions have far-reaching consequences. Researchers, test develop-ers, test publishers, and test users are ethically and morally responsible for ascertaining that any psycho-logical test used for making predictions and decisions shows acceptable evidence of reliability andvalidity. Their responsibility also extends to guarding against test misuse and to increasing public aware-ness about the important role that tests play in test takers’ lives.
Chapter 8: How Do We Gather Evidence of Validity Based on a Test’s Relationships With External Criteria?——231
INTERIM SUMMARY 8.3USING VALIDITY INFORMATION AND ETHICAL ISSUES
• When a relationship can be established between atest and a criterion, the test scores can be used topredict how well individuals are likely to performon the criterion.
• Linear regression is used to make predictions fromscores from one test.
• The slope b (the expected change in one unit of Yfor every change in X) and the intercept a (the pointwhere the regression line crosses the y-axis) areimportant for plotting a regression line.
• Multiple regression is used to make predictions abouta single criteria from two or more different tests.
• Decisions based on test scores have far-reachingconsequences, and test users should have evidenceof validity to be sure that the test scores and theirpredictions will be accurate.
• When test takers are members of minorities, espe-cially those who do not speak standard English astheir primary language, test users must be aware oftest bias and how it affects test validity.
or who are likely to misuse the tests. Finally, psychologists in general have a responsibility to increasepublic awareness about the importance of test reliability and validity so that the public can understandthe role that tests play in decisions that affect individuals’ lives.
LEARNING ACTIVITIES
The following are some learning activities you can engage in to support the learning objectives for this chapter.
232——SECTION II: PSYCHOMETRIC PRINCIPLES
• beta• coefficient of
determination• concurrent evidence
of validity (concurrentmethod)
• criterion• criterion contamination
• evidence of validity basedon test-criteria relationships(criterion-related validity)
• intercept• linear regression• multiple regression• objective criterion• peers
• predictive evidence of validity(predictive method)
• restriction of range• slope• subjective criterion• test of significance• validity coefficient
Learning Objectives Study Tips and Learning Activities
After completing your study of this chapter,you should be able to do the following:
The following study tips will help you meet these learning objectives:
Identify validity evidence of a test based on itsrelationships to external criteria (criterion-related validity), and describe two methods forobtaining this evidence.
• Make a chart of the similarities and differences between predictive andconcurrent methods.
• Be sure to include when the criterion is measured and its purpose.
Read and interpret validity studies. • Do Additional Learning Activities 1, 2, and 3, which follow this table.
Discuss how restriction of range occurs and itsconsequences.
• Review For Your Information Box 8.2.• Explain the reasons why restriction of range may have occurred in this study.
Describe the differences between evidence ofvalidity based on test-criteria relationships andevidence of validity based on test content.
• Make a chart of the similarities and differences.• Be sure to include the method of validation and method of statistical
analysis.
Describe the difference between reliability andvalidity.
• List the differences between reliability and validity.
Define and give examples of objective andsubjective criteria, and explain why criteriamust be reliable and valid.
• Study Table 8.1.• See whether you can add other examples of objective and subjective
criteria to the list.• Check your additions with a classmate or your instructor.• Do Additional Learning Activity 2, which follows this table.
Calculate a validity coefficient and thecoefficient of determination, and then conducta test of significance for the validitycoefficient.
• Work through the example in For Your Information Box 8.5 to see howthe test of significance works.
• Consider the following: Would the correlation have been significant atp < .001?
• Do Additional Learning Activities 3, 5, and 6, which follow this table.
Explain the concept of regression, calculateand interpret a linear regression formula, andinterpret a multiple regression formula.
• Use your calculator to work through the example of making aprediction with linear regression in For Your Information Box 8.6.
• Write a short essay that explains the difference between linearregression and multiple regression.
• Do Additional Learning Activities 3 and 4, which follow this table.
Engaging in the Learning Process
KEY CONCEPTS
After completing your study of this chapter, you should be able to define each of the following terms. These termsare bolded in the text of this chapter and defined in the Glossary.

ADDITIONAL LEARNING ACTIVITIES
1. Interpreting Validity Studies. Read the summarized published criterion-related validation studies below. Foreach summary, identify the following elements:
(1) Predictor(s)(2) Criterion(3) Evidence of validity examined(4) Validity coefficient and its strength(5) Type of reliability(6) Reliability of the test scores (where given)
a. College Students’ Recent Life Experiences. Researchers administered to 216 undergraduate students(in the same time period) the Inventory of College Students’ Experiences and a measure of daily has-sles. The total coefficient alpha was .92 for the inventory and .96 for the measure of daily hassles. Theinventory correlated with the measure of daily hassles at .76 (p < .001). (Adapted from Osman,Barrios, Longnecker, & Osman, 1994)
b. The Pilot Personality. Test scores for the Eysenck Personality Inventory and Cattell’s 16 PersonalityFactor Questionnaire were obtained for male army applicants for flyer training. Forms A and B wereused for each test, and the correlations between forms for the same test ranged from .39 to .85.Some of the men entered flying school several years after taking the tests. The correlations of the sub-scales on the two tests with training outcome (pass or fail) averaged approximately .20. (Adapted fromBartram, 1995)
c. Computer Aptitude and Computer Anxiety. Researchers gave 162 students enrolled in computer coursesa test that measured computer anxiety and another test that measured computer aptitude. Both testswere given at the beginning of the course. Student performance in the course was measured by thegrades the students earned in the course. Computer aptitude correlated with course grade at .41 (p < .01)for one course and at .13 (ns; note that ns stands for “not significant”) for the other course. Correlationsof computer anxiety and course grade were .01 and .16 (ns). (Adapted from Szajna, 1994)
2. Objective and Subjective Criteria. A number of criteria are listed in the table below. Decide what type of cri-terion each is, and mark either “Objective” or “Subjective” in the Type column. Discuss the advantages anddisadvantages you think might be associated with using each of the criteria.
Chapter 8: How Do We Gather Evidence of Validity Based on a Test’s Relationships With External Criteria?——233
Criterion Type
Ratings of training success
Letters of reference
Completion of a work sample (pass/fail)
Ratings based on a work sample
Annual salary
Number of alcoholic drinks
Self-ratings of drug use
Course grade
Number of weeks in therapy
Therapist’s estimate of weekly progress
3. Interpreting Statistics. The following table contains symbols that stand for statistics used in validation stud-ies. Identify each, and explain when to use it and what it means.
234——SECTION II: PSYCHOMETRIC PRINCIPLES
R
r2
R2
Y’
β
X
p
df
4. A Case for Incremental Validity. Return to the description of the study by Chibnall and Detrick (2003)described in the section on multiple regression. Reread the information about this study, including Tables 8.3and 8.4, and then answer the following questions:
(1) What are the predictors and criteria for this study?(2) What did the predictors have in common?(3) What are the strengths and weaknesses of this study?(4) Would you feel comfortable using the predictors in this study to select men and women for admission
to a police academy? Why or why not?
5. Testing the Significance of Validity Coefficients. Complete the table below, and then express an opinion onwhether each coefficient provides sufficient evidence of criterion-related validity. Test the coefficients usinga two-tailed test with p < .05. If the degrees of freedom are not listed in the table, use the next lowestdegrees of freedom listed.
ValidityCoefficient Size of Sample df
Critical r FromAppendix E
Significant atp < .05?
Coefficient ofDetermination
.23 40
.43 10
.33 50
.22 1,000
.50 6
6. Calculating a Validity Coefficient. The following simulated data were collected when an organization testedjob candidates before they were hired and then evaluated them using supervisor ratings after they hadworked for six months. Calculate the validity coefficient for these data. What kind of evidence of validitydoes it represent? Now suppose that the company had not hired those who scored 60 or below on theemployment test. What would the validity coefficient be for the six employees only? Can you explain whythe validity coefficient changed?
Chapter 8: How Do We Gather Evidence of Validity Based on a Test’s Relationships With External Criteria?——235
Candidate Employment Test Supervisor Rating (1–5)
Abel 80 2
Bartmann 98 3
Cardoza 95 5
Dixon 55 3
Everett 70 2
Friedman 75 4
Grass 50 2
Hart 55 1
Isaacs 90 2
Jensen 60 1
PRACTICE QUESTIONS
The following are some practice questions to assess your understanding of the material presented in this chapter.
Multiple Choice
Choose the one best answer to each question.
1. When a test is used topredict future performance,there must be evidence of validitya. based on test taker’s perceptions.b. based on test relationship with a criteria.c. using the predictive method.d. using the concurrent method.
2. Sarah conducted a study inwhich she correlated students’scores on the SAT taken in high school withstudents’ grade point averages at the end ofthe first year of college. Her study wasdesigned to find evidence of validitya. based on test content.b. using the concurrent method.c. based on test takers’ perceptions.d. using the predictive method.
3. In the study at Brigham Young University, theresearchers correlated scores on thePREParation for Marriage Questionnaire withmeasures of marital satisfaction and maritalstability. In this study, the measures of maritalsatisfaction and marital stability werea. predictors.b. tests.c. criteria.d. coefficients.
4. One problem with studies of validity using theconcurrent method is that there may bea. no evidence of validity based on test content.b. no criterion measure.c. restriction of range.d. low reliability.
5. Both the predictive method and the concurrentmethod are ways to establish evidence ofa. validity based on test-criteria relationships.b. validity based on test content.c. validity based on the perceptions of the
test takers.d. both validity and reliability.
6. A major difference between the predictivemethod and the concurrent method is the______ the criterion is measured.a. place whereb. people to whomc. time whend. format in which
7. ______ is a characteristic of the test itself;______ depends on how the test is used.a. Reliability; validityb. Validity; reliabilityc. Face validity; content validityd. Content validity; face validity
8. Sharon wanted to show evidence of validityfor a test that was designed to predictreading readiness for kindergarten children.She chose as her criterion the overall scoreon a published standardized test of academicperformance that was administered to thechildren after they completed first grade.What is the problem with her criterion?a. Low reliabilityb. Low validityc. Low face validityd. Criterion contamination
9. When we ask the question, “What is theprobability that our study would have yieldedthe validity coefficient we are evaluating bychance alone?” we are conducting aa. validation study.b. reliability study.c. test of significance.d. linear regression.
10. Which one of the following helps us interpreta validity coefficient by telling us how muchvariance the predictor and the criterionshare?a. Reliability coefficientb. Test of significancec. Content validity ratiod. Coefficient of determination
11. The difference between linear regression andmultiple regression is the number ofa. predictors.b. criteria.c. coefficients of determination.d. participants.
12. What does the linear regression formula(Y’ = a + bX) allow us to do?a. Predict the value of the criterion measure
associated with any test scoreb. Calculate the predictive validity of a testc. Provide evidence of validity based on test
contentd. Estimate the accuracy of any test score
13. When using test scores for decision making,the test user is ethically and morallyresponsible for ascertaining that the testshows acceptable evidence ofa. the use of both predictive and concurrent
studies.b. face validity and test taker acceptance.c. reliability and validity.d. reliability and face validity.
14. Who has the responsibility for preventing testmisuse by making test manuals and validityinformation available before purchase?a. Test usersb. Test takersc. Test publishersd. Test developers
15. When assessing groups that includeminorities, it is preferable for the test user toa. always refuse to test minorities with
standardized tests.b. not allow minority job candidates to
participate in employment testing.c. use tests that have norms that include the
minority groups being tested.d. warn minorities that their scores on the
test may be invalid or uninterpretable.
236——SECTION II: PSYCHOMETRIC PRINCIPLES
Short Answer/Essay
Read each of the following, and consider your response carefully based on the information presented in thischapter. Write your answer to each question in two or three paragraphs.
1. What is meant by evidence of validity based on test-criteria relationships? Describe two research methodsfor obtaining it.
2. What is the difference between evidence of validity based on test content and evidence of validity based ontest-criteria relationships? Give examples.
3. What are some challenges that organizations face when seeking to obtain predictive evidence of validity fora test?
4. Why is it important to evaluate the quality of the criterion when gathering evidence of validity of a test usingthe concurrent method?
5. What is the difference between reliability and validity? Give an example.
6. Discuss the difference between objective criteria and subjective criteria. Give examples of each.
7. Why do we conduct tests of significance and calculate the coefficient of determination? Explain the role of each.
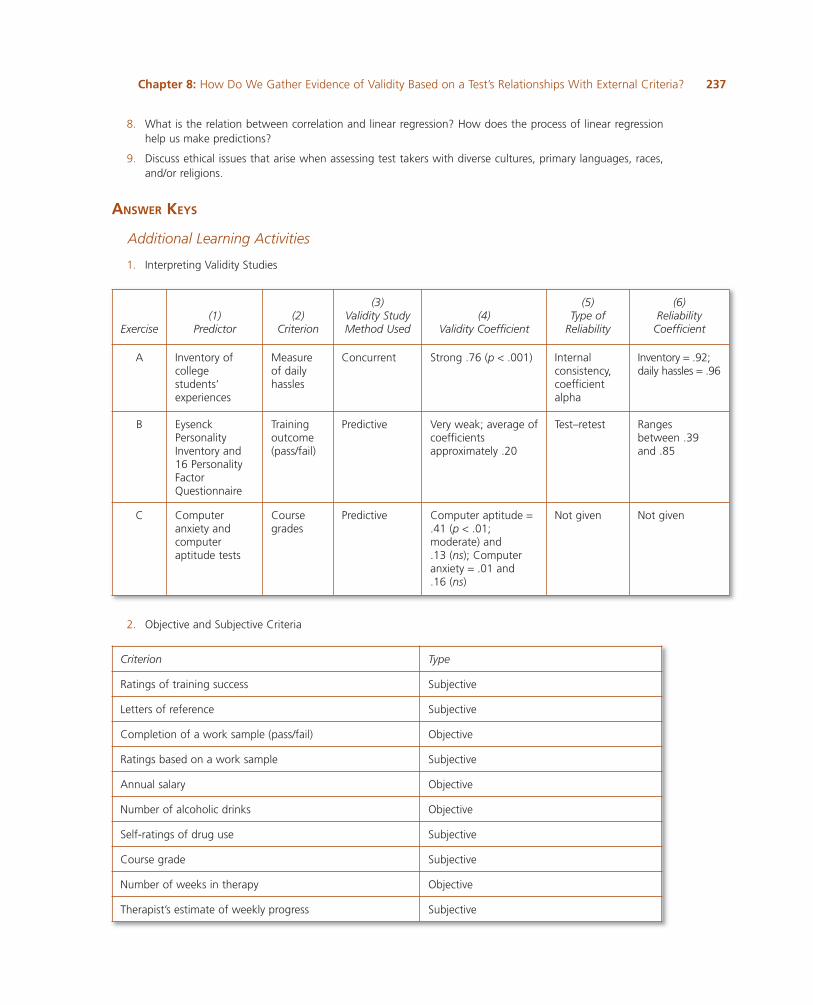
8. What is the relation between correlation and linear regression? How does the process of linear regressionhelp us make predictions?
9. Discuss ethical issues that arise when assessing test takers with diverse cultures, primary languages, races,and/or religions.
ANSWER KEYS
Additional Learning Activities
1. Interpreting Validity Studies
Chapter 8: How Do We Gather Evidence of Validity Based on a Test’s Relationships With External Criteria?——237
Exercise(1)
Predictor(2)
Criterion
(3)Validity StudyMethod Used
(4)Validity Coefficient
(5)Type ofReliability
(6)ReliabilityCoefficient
A Inventory ofcollegestudents’experiences
Measureof dailyhassles
Concurrent Strong .76 (p < .001) Internalconsistency,coefficientalpha
Inventory = .92;daily hassles = .96
B EysenckPersonalityInventory and16 PersonalityFactorQuestionnaire
Trainingoutcome(pass/fail)
Predictive Very weak; average ofcoefficientsapproximately .20
Test–retest Rangesbetween .39and .85
C Computeranxiety andcomputeraptitude tests
Coursegrades
Predictive Computer aptitude =.41 (p < .01;moderate) and.13 (ns); Computeranxiety = .01 and.16 (ns)
Not given Not given
2. Objective and Subjective Criteria
Criterion Type
Ratings of training success Subjective
Letters of reference Subjective
Completion of a work sample (pass/fail) Objective
Ratings based on a work sample Subjective
Annual salary Objective
Number of alcoholic drinks Objective
Self-ratings of drug use Subjective
Course grade Subjective
Number of weeks in therapy Objective
Therapist’s estimate of weekly progress Subjective

3. Interpreting Statistics
238——SECTION II: PSYCHOMETRIC PRINCIPLES
R Multiple regression coefficient
r2 Coefficient of determination for linear relationship
R2 Coefficient of determination for multiple regression coefficient
Y’ The number on the y axis that a linear regression coefficient predicts
β Beta for multiple regression equation
X Raw score
p Probability
df Degrees of freedom
4. A Case for Incremental Validity
The predictors in the Chibnall and Detrick (2003) study were the Minnesota Multiphasic Personality Inventory-2,the Inwald Personality Inventory, and the Revised NEO Personality Inventory, and the criteria were the academic per-formance of police officers. The information in the tables describes the prediction of the first criterion, namely, aca-demic performance.
At first glance, the predictors are well-known personality tests. From the data in Table 8.3, we can tell that thepredictors share variance among themselves and with the predictor. We know this because the contributions of thepredictors vary depending on how they are arranged in the multiple regression equation.
The study’s strength is that the researchers used well-known predictors with evidence of validity. The study’sweaknesses are that the sample contained only 79 participants and that the study, as reported in this textbook,does not provide information on reliability and evidence of validity of the criteria.
However, we would be comfortable using the predictors in this study to select men and women for a police acad-emy in the area in which the study was conducted. The study suggests that the three predictors and demographicvariables account for 55% of variance of the predictors and the criterion—assuming the criterion scores are reliable.
5. Testing the Significance of Validity Coefficients
The best evidence of validity is when the coefficient is statistically significant and also accounts for a substantialamount of shared variance. In this case, r = .33 for a sample of 52 provides the best evidence of criterion-relatedvalidity.
Validity Size of Sample dfCritical r FromAppendix D
Significant atp < .05?
Coefficient ofDetermination
.23 37 35 .3246 No .0529
.43 10 8 .6319 No .1849
.33 52 50 .2732 Yes .1089
.22 1,000 998 .1946 Yes .0484
.50 6 4 .8114 No .2500

6. Calculating a Validity Coefficient
Chapter 8: How Do We Gather Evidence of Validity Based on a Test’s Relationships With External Criteria?——239
Test Taker X Y Dx Dx2 Dy Dy
2 Dx X Dy
Abel 80 2 7.2 51.84 −0.5 0.25 −3.6
Bartmann 98 3 25.2 635.04 0.5 0.25 12.6
Cardoza 95 5 22.2 492.84 2.5 6.25 55.5
Dixon 55 3 −17.8 316.84 0.5 0.25 −8.9
Everett 70 2 −2.8 7.84 −0.5 0.25 1.4
Friedman 75 4 2.2 4.84 1.5 2.25 3.3
Grass 50 2 −22.8 519.84 −0.5 0.25 11.4
Hart 55 1 −17.8 316.84 −1.5 2.25 26.7
Isaacs 90 2 17.2 295.84 −0.5 0.25 −8.6
Jensen 60 1 −12.8 163.84 −1.5 2.25 19.2
Sum 728 25 2805.60 14.50 109.0
Mean 72.8 2.5
Standard deviation(calculated using theformula presented inChapter 5)
16.75 1.20
r .54
Abel 80 2 −4.67 21.78 −1.00 1.00 4.67
Bartmann 98 3 13.33 177.78 0.00 0.00 0.00
Cardoza 95 5 10.33 106.78 2.00 4.00 20.67
Everett 70 2 −14.67 215.11 −1.00 1.00 14.67
Friedman 75 4 −9.67 93.44 1.00 1.00 −9.67
Isaacs 90 2 5.33 28.44 −1.00 1.00 −5.33
Sum 508 18 643.33 8 25
Mean 84.67 3.00
Standard deviation(calculated using theformula presented inChapter 5)
10.35 1.15
r .35
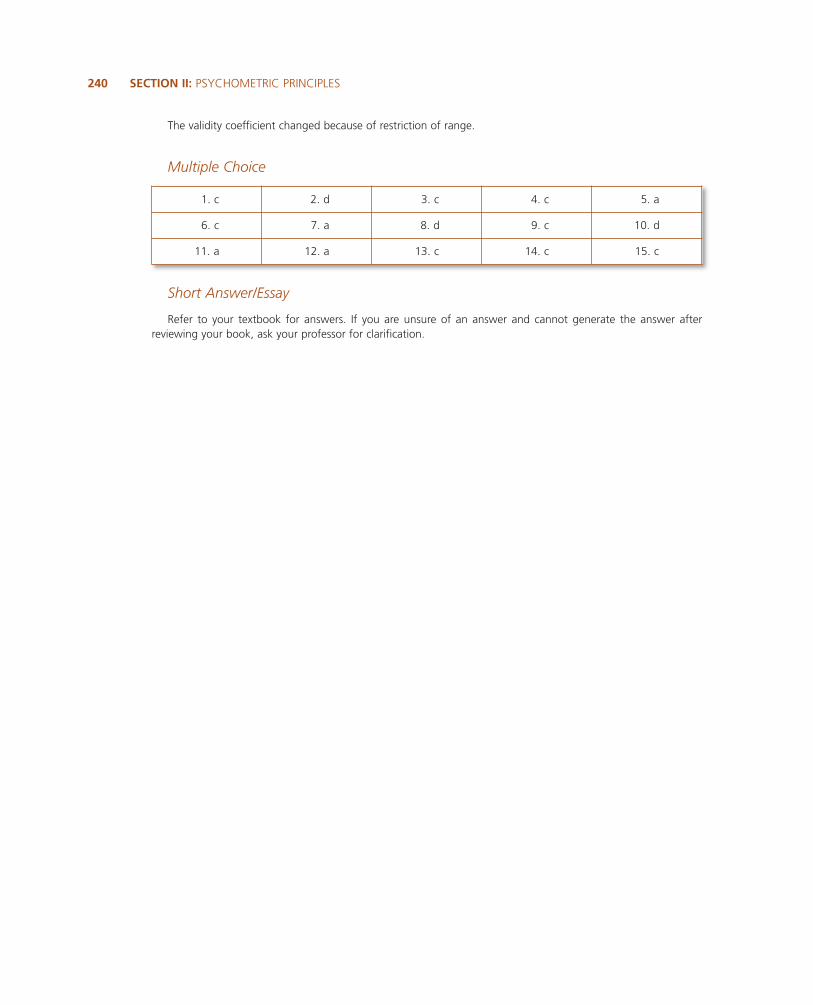
The validity coefficient changed because of restriction of range.
Multiple Choice
240——SECTION II: PSYCHOMETRIC PRINCIPLES
1. c 2. d 3. c 4. c 5. a
6. c 7. a 8. d 9. c 10. d
11. a 12. a 13. c 14. c 15. c
Short Answer/Essay
Refer to your textbook for answers. If you are unsure of an answer and cannot generate the answer afterreviewing your book, ask your professor for clarification.