Embed Size (px)
Citation preview

1/31/2021 How to Survive the Enrollment Bust
https://www.chronicle.com/article/how-to-navigate-the-demographic-cliff 1/14
How to Survive the Enrollment BustColleges face looming demographic challenges. The
pandemic offers clues for overcoming them.
GOLDEN COSMOS FOR THE CHRONICLE
THE REVIEW
By Nathan D. Grawe
JANUARY 13, 2021
s Covid-19 vaccines slowly trickle out, and with them the promise of a return to
normal, higher education is taking stock of what just happened. Before the pandemic

1/31/2021 How to Survive the Enrollment Bust
https://www.chronicle.com/article/how-to-navigate-the-demographic-cliff 2/14
Astruck, colleges were already dreading a “great enrollment crash.” Then
came the pandemic, breaking short-term projections and yield models. If
only the past year looked more like 2013! The pandemic-induced 13-percent
decline in first-time undergraduate enrollments, seen in the fall of 2020, lies outside
any projection model. What can we take away from all this?
First, we have been reminded of the risks of relying on international students. The
National Student Clearinghouse Research Center estimates that, in the fall of 2020,
undergraduate international-student enrollments fell by 15 percent and new
international enrollments declined 43 percent. That rate of decline is breathtaking,
and yet according to the Institute of International Education new undergraduate
international-student enrollments have declined each year since 2015-16 — with the
total loss reaching 12 percent in 2019-20. In other words, this market was weakening
even before the pandemic hit. The persistence of the decline is probably attributable
to competition (from Canada, Britain, and China, among others) that won’t disappear
even if U.S. regulatory and health controls are relaxed. In short, international students
are unlikely to save us.
Enrollments by domestic students also fell. Losses were particularly deep in areas with
more low-income families and larger minority populations. This news is worrisome
because hopes to recruit our way through demographic decline by expanding access
hinge on reaching precisely these student groups. At the very least, the pandemic
points to the tenuous connection between higher education and those students. At
worst, changes in enrollment brought about by the pandemic may mark the
beginning of new trends.
Boxed into a di�cult position, some colleges aremaking a bold choice: They’re attempting togrow their way to safety.

1/31/2021 How to Survive the Enrollment Bust
https://www.chronicle.com/article/how-to-navigate-the-demographic-cliff 3/14
Secondly, the long view. Drawing on data from the 1918 flu pandemic, Phillip B.
Levine and Melissa S. Kearney suggest that we can expect 2020 to produce 300,000 to
500,000 fewer babies in the United States than were born in 2019 — a drop of
approximately 10 percent. While higher education won’t experience the impact of this
decline until the late 2030s, the combination of these lost births with other impending
challenges — especially the sharp demographic decline projected for 2026 — is an
unwelcome development.
And yet the past year has delivered more than just bad news. Difficult realities spur
innovation and change. In 2020 we learned that colleges are much more agile than
their reputations suggest. Last spring nearly every institution moved all instruction
online in less than a month, residential campuses found new and meaningful ways to
connect virtually, and science instructors devised creative ways to deliver lab content
without physical labs, among many other reinventions. These changes were not pain-
free, but higher education, often described as sclerotic, proved adaptable.
The pandemic experience also gave many of us a deeper understanding of our
students. As online office hours opened virtual windows into students’ homes, faculty
members saw firsthand the myriad hurdles that impede progress toward a degree.
Seeing our students crammed into corners of shared bedrooms or struggling with
resource deficits such as slow Wi-Fi, we were reminded that determinants of success
extend deep into students’ lives. These experiences should draw us into renewed
commitments to holistic approaches to retention.
We also witnessed the fast pace of pandemic decision-making lead to new, more
flexible governance structures. At my institution this meant rewriting the budget over
the course of only a few months and revising the fall course schedule in a matter of
weeks. As the inevitable stresses of such speed became evident, many institutions
were also reminded that the faith in shared-governance systems necessary to support
swift action cannot be developed only at the moment of crisis but must be nurtured
continually so that it is available to draw on when needed.
1/31/2021 How to Survive the Enrollment Bust
https://www.chronicle.com/article/how-to-navigate-the-demographic-cliff 4/14
D
These lessons from 2020 will prove vital if colleges are to survive the approaching
demographic reversal of 2026. I described the challenges to come in my 2018 book,
Demographics and the Demand for Higher Education (Johns Hopkins University
Press), but since then the demand picture has come into sharper focus.
emographic challenges fall into two categories. The first, a shift in
composition, has been persistent and slow-moving. Differences in birth
rates combined with patterns of immigration and migration continually
nudge the country toward greater racial and ethnic diversity while shifting the center
of population toward the South and West. William H. Frey estimates that the United
States will become “minority white” near midcentury but that the subpopulation
under age 18 was on track to reach this milestone in 2020. The U.S. Department of
Education confirms that for higher education the future is now: From 2000 to 2018,
the share of postsecondary enrollments accounted for by non-Hispanic whites
steadily declined, from 71 percent to 55 percent. A recent report by the Migration
Policy Institute underscores the importance of immigration in this transformation. In
2018, 28 percent of enrolled college students were either first-generation immigrants
or their children — up from 20 percent in 2000.
The second challenge began in the shadow of the 2008 Great Recession: Young
families began having fewer children. While the economy rebounded, fertility rates
did not, and the result was the fewest births in more than three decades. Kenneth M.
Johnson calculates that, from 2008 to 2019, 6.6 million fewer children were born than
would have been born had fertility rates held steady at 2007 levels. While low fertility
has been particularly pronounced in the Northeast, the Centers for Disease Control
and Prevention reports deep fertility declines in every region. Colleges — particularly
those that serve traditional-age students — can expect to feel the front edge of this
fertility decline in the middle of this decade.
How might we expect enrollments to evolve if matriculation patterns of the past
continue into the future? The projections below, taken from my research for my new

1/31/2021 How to Survive the Enrollment Bust
https://www.chronicle.com/article/how-to-navigate-the-demographic-cliff 5/14
book, The Agile College (Johns Hopkins University Press), are disaggregated between
two- and four-year institutions, and the latter are further divided by U.S. News &
World Report rankings (“elite” colleges are those among the top 50 colleges or
universities; “national” colleges are ranked between 51 and 100; “regional” colleges
are those ranked outside the top 100). The enrollment-demand projections are
indexed to 2018.
Source: Nathan D. Grawe, “The Agile College” • Get the data • Created with Datawrapper
2-Year Colleges
2018 2020 2022 2024 2026 2028 2030 2032 2034
90
95
100
105
110%
SouthSouth
MidwestMidwest
WestWest
NortheastNortheast

1/31/2021 How to Survive the Enrollment Bust
https://www.chronicle.com/article/how-to-navigate-the-demographic-cliff 6/14
Source: Nathan D. Grawe, “The Agile College” • Get the data • Created with Datawrapper
4-Year Regional Colleges
2018 2020 2022 2024 2026 2028 2030 2032 2034
90
95
100
105
110%
SouthSouth
MidwestMidwest
WestWest
NortheastNortheast
Source: Nathan D. Grawe, “The Agile College” • Get the data • Created with Datawrapper
4-Year National Colleges
2018 2020 2022 2024 2026 2028 2030 2032 2034
85
90
95
100
105
110
115
120%
SouthSouth
MidwestMidwest
WestWest
NortheastNortheast
1/31/2021 How to Survive the Enrollment Bust
https://www.chronicle.com/article/how-to-navigate-the-demographic-cliff 7/14
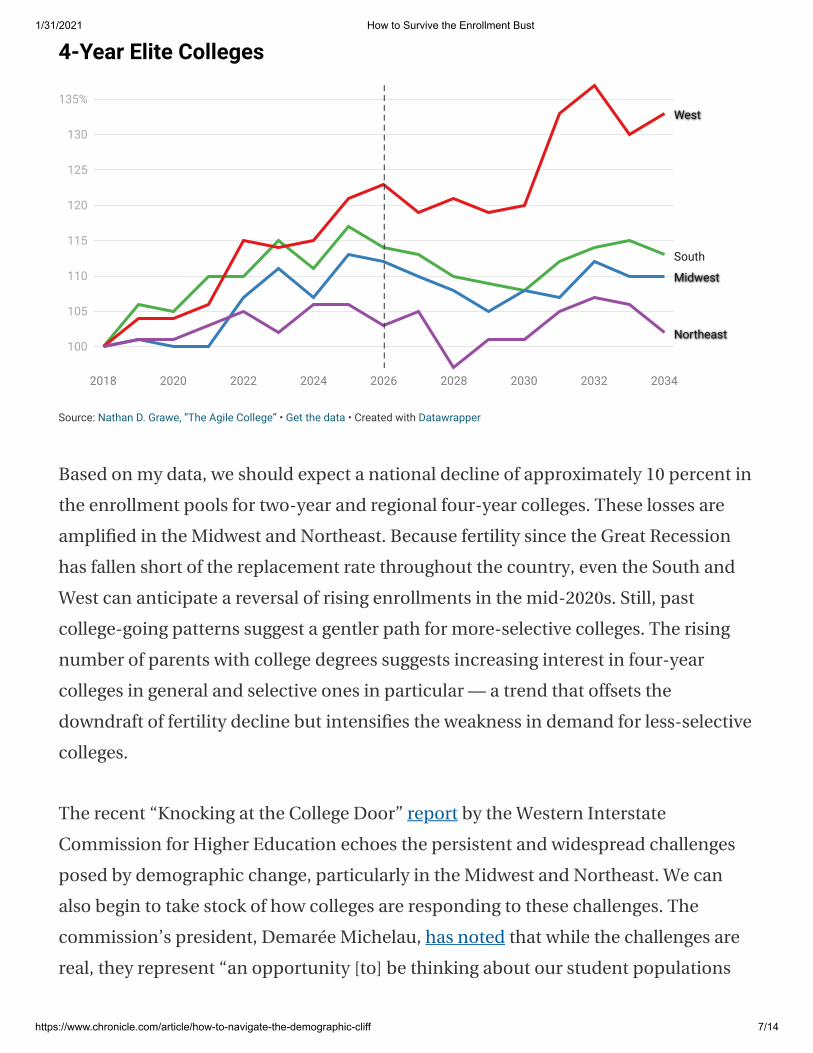
Based on my data, we should expect a national decline of approximately 10 percent in
the enrollment pools for two-year and regional four-year colleges. These losses are
amplified in the Midwest and Northeast. Because fertility since the Great Recession
has fallen short of the replacement rate throughout the country, even the South and
West can anticipate a reversal of rising enrollments in the mid-2020s. Still, past
college-going patterns suggest a gentler path for more-selective colleges. The rising
number of parents with college degrees suggests increasing interest in four-year
colleges in general and selective ones in particular — a trend that offsets the
downdraft of fertility decline but intensifies the weakness in demand for less-selective
colleges.
The recent “Knocking at the College Door” report by the Western Interstate
Commission for Higher Education echoes the persistent and widespread challenges
posed by demographic change, particularly in the Midwest and Northeast. We can
also begin to take stock of how colleges are responding to these challenges. The
commission’s president, Demarée Michelau, has noted that while the challenges are
real, they represent “an opportunity [to] be thinking about our student populations
Source: Nathan D. Grawe, “The Agile College” • Get the data • Created with Datawrapper
4-Year Elite Colleges
2018 2020 2022 2024 2026 2028 2030 2032 2034
100
105
110
115
120
125
130
135%
SouthSouth
MidwestMidwest
WestWest
NortheastNortheast

1/31/2021 How to Survive the Enrollment Bust
https://www.chronicle.com/article/how-to-navigate-the-demographic-cliff 8/14
W
differently and serving them better.” It’s not too late to alter the grim projections
above, but colleges must confront demographic change head-on.
hat have they been doing so far? Many colleges have intensified
recruiting to reach new student groups. Test-optional admissions are
one popular approach. According to the National Center for Fair and
Open Testing, more than 1,000 four-year institutions had waived test requirements by
the fall of 2019 — nearly half of all colleges that grant bachelor’s degrees. (The
pandemic led 500 more colleges and universities to go test-optional for the fall of 2020
and beyond.)
For those preferring to maintain test-score requirements, new approaches offer
greater context to applications. The College Board’s Landscape tool draws on public
data to present students’ scores against the backdrop of relevant neighborhood
characteristics such as family income, housing stability, and college-attendance rates.
An SAT score of 1050 may look very different when seen in light of great adversity,
compared with an identical score achieved in idyllic circumstances.
The tool’s users are bullish on Landscape’s potential. “Our job in admissions is not
just to reward performance; we’re also supposed to be identifying talent,” explains Joy
St. John, dean of admission and financial aid at Wellesley College. “And sometimes we
don’t have good information on a prospective student’s talent because of limited
resources within the student’s school community.” At Florida State University, the
associate vice president for academic affairs, John Barnhill, reports evidence that the
holistic use of data meaningfully alters admissions outcomes. In reviewing the class
arriving in the fall of 2018, the university used the environmental-context data to re-
evaluate applicants who were on the bubble — many on the path to “no.” Their
reassessment resulted in more than 1,000 additional admissions and yielded 400
additional students.

1/31/2021 How to Survive the Enrollment Bust
https://www.chronicle.com/article/how-to-navigate-the-demographic-cliff 9/14
Other colleges have turned to income-based repayment plans such as the Back a
Boiler program at Purdue University, which transfers the financial risk of paying for
college from the student to the institution. Colleges that want to reduce the financial
risk of these programs can do so through third parties such as Ardeo Education
Solutions, which absorbs losses when students do not fully repay their loans. By
reducing prospective students’ uncertainty about their return on investment in higher
education, income-based repayment serves as a useful recruiting tool — particularly
for low-income students who are increasingly sensitive to student-loan risks.
Interestingly, while income-sensitive loan repayment is controversial in the United
Staes, it is standard in Britain, where payments are collected through the tax system —
perhaps a sign of things to come here.
Boxed into a difficult position, some colleges are making a bold choice: They’re
attempting to grow their way to safety. Wheaton College adopted a strategic plan in
2016 aiming for a 13-percent enrollment increase, despite being located in
Massachusetts, a state with a shrinking pool of potential applicants. The college’s net
fee income had crept up by about 1 percent per year, and a rising discount rate (up
from 30 percent to 40 percent since 2010) consumed most tuition revenue from the
stable student population. Expanding the college would generate new resources.
When I asked its president, Dennis Hanno, whether these gains had come at the cost
of an accelerated rise in the discount rate, he responded, “Absolutely. It skyrocketed.”
(It hit 42.7 percent in 2017.) What’s more, growth necessitated more student housing.
As real as these expenses are, Hanno’s team sees them as “short-term costs for a long-
term payoff” with larger cohort sizes generating additional net fee income to support
strategic investment.
However they are rolled out, these recruiting tactics all must contend with an
unhappy truth: In a time of declining numbers of young people, recruitment is a zero-
sum game, unless it attracts students otherwise not bound for college. Broadening
access, by contrast, allows higher education to break free of the constraints of scarcity.

1/31/2021 How to Survive the Enrollment Bust
https://www.chronicle.com/article/how-to-navigate-the-demographic-cliff 10/14
W
But access initiatives present their own unpleasant admissions arithmetic — most
people in underrepresented groups have a lower capacity to pay.
hile some institutions will continue to succeed with growth-based
responses to demographic challenges, Jon McGee, author of Breakpoint
(Johns Hopkins University Press, 2015) and a former vice president for
planning and strategy at the College of Saint Benedict and Saint John’s University, in
Minnesota, offers words of caution. He points to the growth of graduate and
nontraditional undergraduate programs during the 1990s: “There never were any real
barriers to entry,” he observes. “So now you have a market stuffed with providers, and
any margins you may have had have just gone away for most of those programs.” In
other words, those who succeed on the growth path will do so only by setting
themselves apart from the competition.
Enrollment growth need not come from broader recruitment, however. Retention
initiatives generate increased enrollments by attracting more students to return. Such
efforts are hardly novel, but in an environment of declining prospective students they
take on renewed urgency. St. Cloud State University, in Minnesota, developed a Social
Belonging Index based on a 10-item questionnaire given to students in their first
month on campus. Those with a low sense of belonging were found to be almost 20
percent more likely to drop out before the spring term. A former interim dean of the
college, Glenn Davis, told me that “students who are performing well academically
but have a low sense of belonging are [identified] to faculty members,” who then take
individualized action. An at-risk student might be invited out for coffee with a
professor, for example.
Work at the University of Southern Maine shows how student-focused retention
efforts such as these can overcome shrinking pools of prospective students. Nancy
Griffin, chief operating officer, notes the challenges of a state at the center of the
nation’s demographic decline: “In any given day there are about 31 births and 41
deaths. Our work-force needs are through the roof.” Following deep program cuts and
1/31/2021 How to Survive the Enrollment Bust
https://www.chronicle.com/article/how-to-navigate-the-demographic-cliff 11/14
layoffs at Southern Maine in 2013–14, Griffin has led the university’s efforts to achieve
stability by keeping students enrolled. At the center of this work: personal, student-
centered advising and support that reversed trends toward automation. “There was
this acceptance,” she says, “that in the automation some students will fall through the
cracks.”
While not eye-catching, the program of intensive advising has proved effective by
assuring greater student success. For example, by providing each new student with a
90-minute advising session before fall classes begin, the university has increased the
number of first-year students pre-registered with the disability-services office by 38
percent. Advisers also have helped develop plans for students’ time management that
are realistic and consistent with completing courses. In all, under Griffin’s mantra of
“Student-Focused Everyday,” the university has been able to increase enrollment by
five percent through an eight-point rise in retention rates. While the benefit to the
campus is obvious, Griffin stays focused on a bigger goal: “We’re working for the
future of Maine.”
Rutgers University is extending retention efforts in a new direction by focusing on the
importance of balance between course work and campus jobs. Elena Ragusa, director
of strategic initiatives in the Division of Enrollment Management, says that student
work can improve retention because it “shifts student peer groups and gives students
more opportunities for mentors.” And with almost one-third of students at the New
Jersey university eligible for Pell Grants, work is a common component of paying
tuition.
The pilot program targets 70 low-income, first-generation students who are
guaranteed an on-campus job 10 to 12 hours per week. Work supervisors, trained in
mentoring, perform weekly “pulse checks” with the students. The program has shown
potential, particularly for improving retention among African American and Hispanic
men. Students in these groups “happen to be highest financial need, most likely to
reject their work-study offers, and most likely to indicate that they are working off

1/31/2021 How to Survive the Enrollment Bust
https://www.chronicle.com/article/how-to-navigate-the-demographic-cliff 12/14
campus,” Ragusa explains. If the program can improve support for even a few
students, Ragusa hopes for spillover effects with peers.
Another unique arrangement is a profitable collaboration between 30 of the 35
institutions in the North Carolina Independent Colleges and Universities group. They
have streamlined transfer paths from the state’s two-year colleges. While broad work
on the group’s articulation agreements dates back 25 years, recent efforts have
focused on creating discipline-specific paths so that students know their work at two-
year colleges will move them toward a major and on-time graduation from a private
four-year college or university. Initial agreements were created in music, nursing,
theater, and fine arts, with a teacher-education path in development.
The group’s president, Hope Williams, says, “We’re finding this is especially
important for traditional students [because] they are not place-bound — they can
transfer all over the state — and so it is important that they know that what they are
taking [at a two-year college] will transfer wherever they go.” The collaboration
between the private and public two-year colleges promises to reduce barriers to
student success while generating enrollments for the state’s private institutions, some
of which admit as many as 300 transfer students per year.
While the direct impacts of the pandemic on enrollments, student and employee
health, and financial stability are clearly disturbing, the past 10 months also provide
ample reason to be optimistic about higher education’s future. Campuses proved
creative and agile at a time of great stress, and were open to re-examining
fundamental practices. Changing realities dictated revisions in classrooms, dorms,
business offices, admissions and financial aid, facilities departments, and more. This
nimble, student-focused attitude is exactly what colleges need in responding to
demographic change. Colleges that can leverage flexibility developed during the
pandemic will have a strong foundation from which to break free from unsettling
demographic projections. They will be well on their way toward institutional health
and maintaining their missions through the difficult decade to come.

1/31/2021 How to Survive the Enrollment Bust
https://www.chronicle.com/article/how-to-navigate-the-demographic-cliff 13/14
A version of this article appeared in the January 22, 2021, issue.
We welcome your thoughts and questions about this article. Please email the editors
or submit a letter for publication.
OPINION COMMENTARY ADMISSIONS & ENROLLMENT
Nathan D. Grawe
Nathan D. Grawe is a professor of economics at Carleton College. He is the author of
Demographics and the Demand for Higher Education (Johns Hopkins University Press,
2018) and The Agile College (Johns Hopkins University Press, 2021).
IN THE CHRONICLE STORE
Online 2.0 Rethinking Campus Spaces

1/31/2021 How to Survive the Enrollment Bust
https://www.chronicle.com/article/how-to-navigate-the-demographic-cliff 14/14
1255 23rd Street, N.W. Washington, D.C. 20037 © 2021 The Chronicle of Higher Education
Vulnerable Students
Financial Strategies for aCrisis and Beyond

Enrollment UpdateKim Medina, AVP Enrollment Management
February 2021
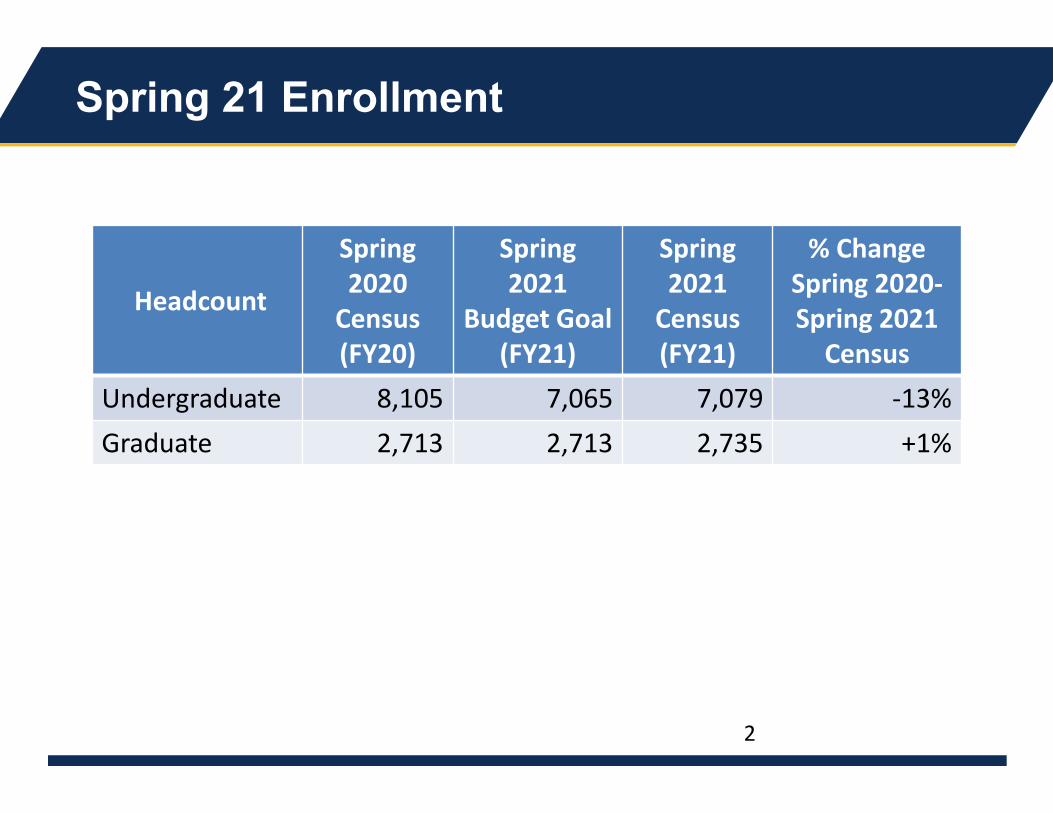
Spring 21 Enrollment
2
Headcount
Spring 2020 Census(FY20)
Spring 2021
Budget Goal (FY21)
Spring 2021 Census (FY21)
% Change Spring 2020‐Spring 2021 Census
Undergraduate 8,105 7,065 7,079 ‐13%Graduate 2,713 2,713 2,735 +1%

Fall 20 Cohort Retention Projection
3
Retention Rates for First‐Time, Full‐Time Baccalaureate Students by Cohort
Fall Cohort 2018 2019 2020Fall to Spring 87.8% 87.4% 85.7%Fall to Fall 72.3% 70.2% 68‐70%**Projection

Fall 20 to Spring 21 Retention of FTFT
4
Fall 20 First‐time Full‐time (FTFT) Cohort Total and Sub‐Populations
Total 86% vs. Fall ’19 ↓ 2%
First‐Gen 80%vs. Fall ’19 F.G.vs. Fall ’20 Non‐F.G.
↓ 2%↓ 10%
Pell Eligible 80%vs. Fall ‘19 Pell vs. Fall ‘20 Non‐Pell
↓ 4%↓ 8%
Under‐represented Minority (URM) 82%
vs. Fall ’19 URMvs. Fall ‘20 Non‐URM
↓ 1%↓ 6%
HS GPA <3.00 76%vs. Fall ‘19 GPA <3.00vs. Fall ‘20 GPA 3.00+
↓ 2%↓ 12%

New Fall 21 UG Enrollment Projections
5
Degree Seeking
Fall '20 Census Actual
Fall '21 Census
Projections
Change Fall 20 to Fall 21
UNDERGRADUATENew Full‐Time 1,343 1,557 214New Part‐Time 18 20 2Total First Time 1,361 1,577 216Transfer Traditional Full‐Time 436 486 50Transfer Traditional Part‐Time 105 105 02nd Bachelor's 57 57 0Total Transfer 598 648 50Total Degree Seeking* 1,959 2,225 266*Based on assumptions of information we had in September 2020.

Fall 21 New Graduate
6
As of 2/1/21
• Graduate School & departments projecting enrollment by program
• Admits increase throughout the spring as programs make decisions
• As of 2/21 we anticipate flat graduate enrollment
Term Applications AdmitsFall 2021 2,144 179Fall 2020 1,353 145
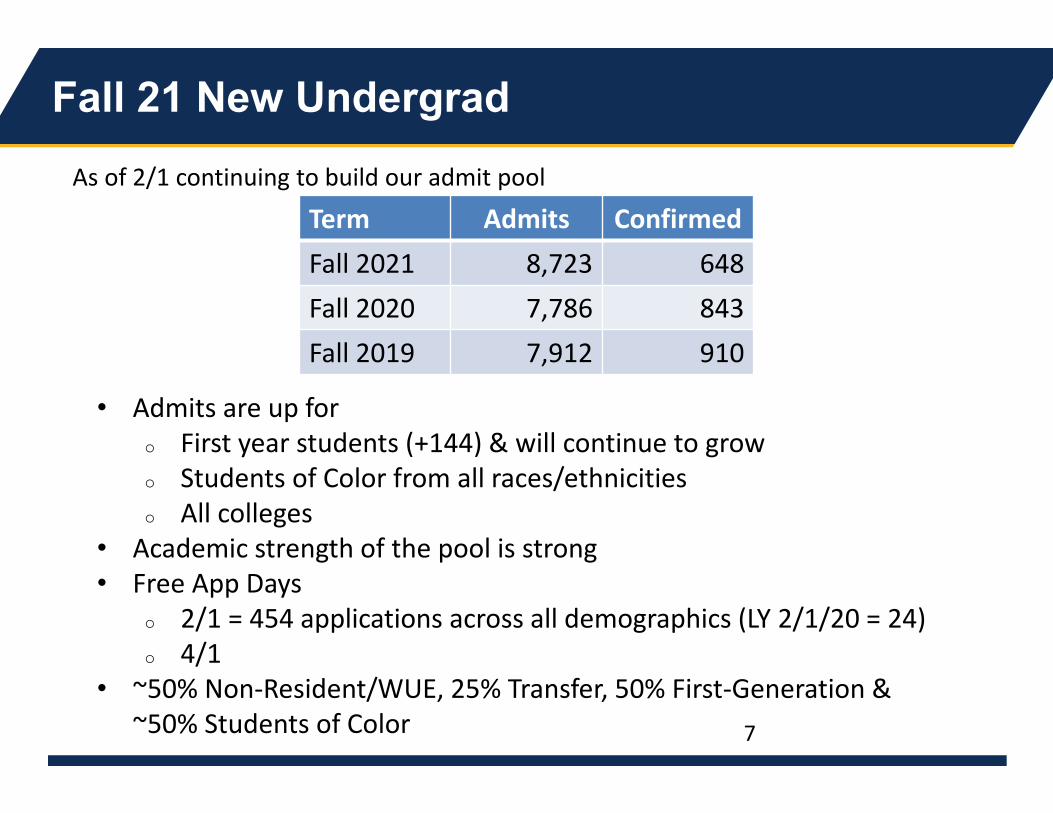
Fall 21 New Undergrad As of 2/1 continuing to build our admit pool
Term Admits ConfirmedFall 2021 8,723 648Fall 2020 7,786 843Fall 2019 7,912 910
• Admits are up foro First year students (+144) & will continue to growo Students of Color from all races/ethnicitieso All colleges
• Academic strength of the pool is strong• Free App Days
o 2/1 = 454 applications across all demographics (LY 2/1/20 = 24)o 4/1
• ~50% Non‐Resident/WUE, 25% Transfer, 50% First‐Generation & ~50% Students of Color 7

Fall 21 New Undergrad – COVID Impact
Term Admits ConfirmedFall 2021 8,723 648Fall 2020 7,786 843Fall 2019 7,912 910
• Waiting & deadline driven• Projecting yield & enrollment will be a challenge• Nationwide 10% down in FAFSA filers
o 54% of our admit pool vs 62% last year• Estimated aid awards out week of 1/25 (+99 confirms)• Comprehensive strategy
o Marketing/Communication o Outreach team to support FAFSA filing o Continue to message our plans to be open Fall 21
• Developing virtual & on campus visit opportunities8
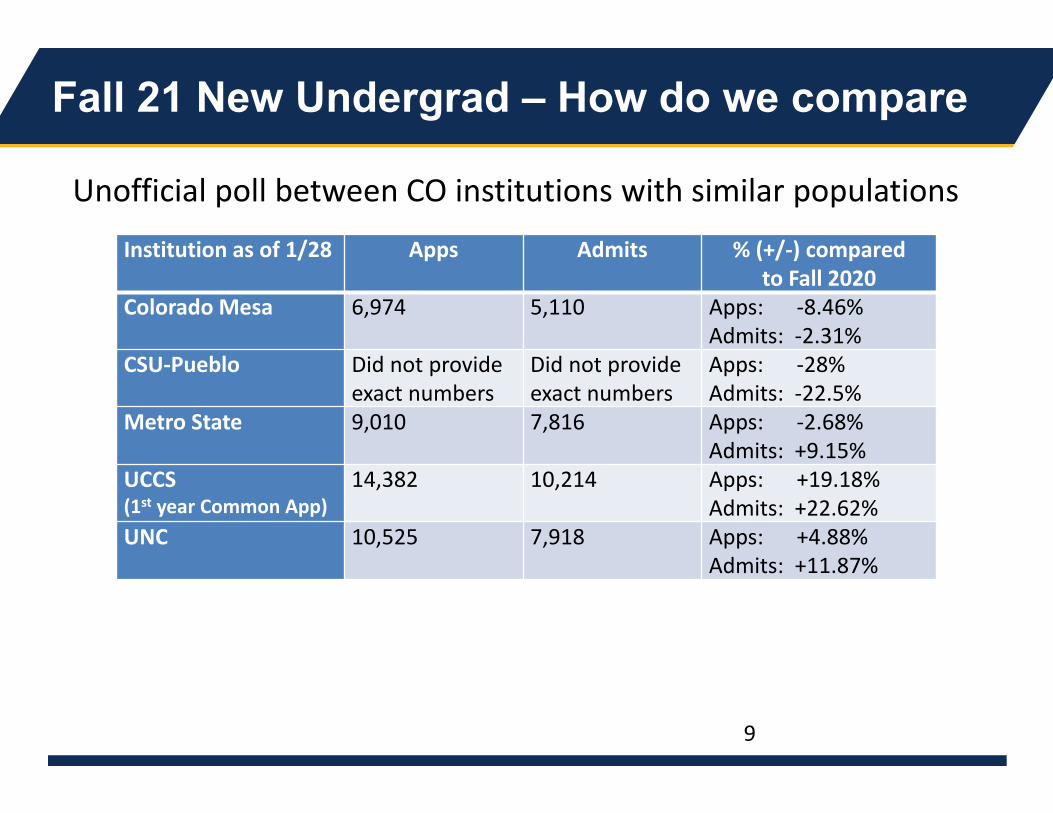
Fall 21 New Undergrad – How do we compare
Unofficial poll between CO institutions with similar populations
Institution as of 1/28 Apps Admits % (+/‐) compared to Fall 2020
Colorado Mesa 6,974 5,110 Apps: ‐8.46%Admits: ‐2.31%
CSU‐Pueblo Did not provide exact numbers
Did not provide exact numbers
Apps: ‐28%Admits: ‐22.5%
Metro State 9,010 7,816 Apps: ‐2.68%Admits: +9.15%
UCCS(1st year Common App)
14,382 10,214 Apps: +19.18%Admits: +22.62%
UNC 10,525 7,918 Apps: +4.88%Admits: +11.87%
9

Fall 21 New Undergrad – How do we compare
10
Nationally
• Competitive market • High school graduate increase less than 1% • Increases in applications & admitted students • Common Applications up 10% nationwide
o First generation down 3%o Needier students down 2%
• Costs concerns for students & families

Fall 21 New Undergrad – Yield/Summer Melt
Winter/Spring/Summer
• In‐person visit opportunities• Advising & Registration• Orientation • Individual outreach
11