Embed Size (px)
Citation preview

1
How to Study for Chapter 17 Perfect Competition in the Long Run (This chapter will take at least two class periods to complete.) Chapter 17 introduces the main tools for analyzing industry behavior. It brings in the long run and considers the three possible changes that can occur. It is very a technical chapter and needs to be studied slowly and carefully. 1. Begin by looking over the Objectives listed below. This will tell you the main points you
should be looking for as you read the chapter. 2. New words or definitions and certain key points are highlighted in italics and in red color.
Other key points are highlighted in bold type and in blue color. 3. There are a few new words in this chapter. Be sure to spend time on the various definitions.
There are also many calculations. Go over each carefully. Be sure you understand how each number was derived (do the calculations for yourself). Then, plot the calculations on graph paper to see how the graphs are derived. Check your graphs against the ones in the text. The calculations of this chapter continue the same case from the calculations of the previous chapters (the case of the construction company). The case of the change in a variable cost is especially involved and needs to be analyzed on a step-by-step basis.
4. The teacher will focus on the main technical parts of this chapter. You are responsible for the cases and the ways by which each case illustrates a main principle.
5. When you have finished the text, the Test Your Understanding questions, and the assignments, go back to the Objectives. See if you can answer the questions without looking back at the text. If not, go back and re-read that part of the text. Then, attempt the Practice Quiz for Chapter 17.
Objectives for Chapter 17 Perfect Competition in the Long Run At the end of Chapter 17, you will be able to: 1. Explain how purely competitive companies adjust in the long-run when they are making
economic profits and economic losses and show this on the graph. 2. Explain what is meant by "long-run equilibrium"? 3. Explain how perfectly competitive companies will adjust in the short-run and in the long-run
if there is an increase or decrease in demand and show the adjustments on the graph. 4. Explain the long-run industry supply curve? 5. Explain what is meant by a constant-cost industry and why is its long-run industry supply
curve horizontal (perfectly elastic)? 6. Explain how perfectly competitive companies adjust in the short-run and in the long-run
when there is an increase or decrease in a fixed cost and show the changes on the graphs. 7. Explain how perfectly competitive companies adjust in both the short-run and in the long-run
if there is an increase or decrease in a variable cost and show the changes on the graph. 8. Analyze various cases involving specific industries, using the analysis to the above questions. 9. Explain the following benefits to society of a perfectly competitive industry:
a. economic profits (both in the short-run and in the long-run) b. productive efficiency (both short-run and long-run) c. improvements in productive efficiency over time and improvements in products d. allocative efficiency

2
Chapter 17 Perfect Competition In The Long Run (latest revision July 2004) Response to an Economic Profit In Chapter 16, we considered the short-run, in which the number of companies stays the same (at 1,000). To complete our analysis of perfect competition, we now turn to the long-run. This means that we allow the number of companies in the industry to change. At the end the last chapter, it was shown that the equilibrium price of homes was $200,000 and the equilibrium quantity was 7,000. This was based on the numbers below, the first two columns of which are repeated from Chapter 16. Our representative construction company produced 7 homes and earned an economic profit of $120,000. This means that the owner earned $120,000 more income than could be earned in the next best alternative. In the long-run, this should attract new sellers into the industry. These new sellers will realize that they can earn more in the construction industry than they are presently earning doing whatever it is that they are doing. In perfect competition, there are no barriers to their entry. Assume that new sellers enter so that the supply increases from Old Supply (S1) to New Supply (S2) as follows: Price Old Supply(S1) Demand New Supply(S2) $120,000 3,000 11,000 5,000 140,000 4,000 10,000 6,000 160,000 5,000 9,000 7,000 180,000 6,000 8,000 8,000 200,000 7,000 7,000 9,000 220,000 8,000 6,000 10,000 240,000 9,000 5,000 11,000 260,000 10,000 4,000 12,000 280,000 11,000 3,000 13,000 300,000 12,000 2,000 14,000 320,000 13,000 1,000 15,000 The new supply (S2) is greater than (to the right of) the old supply (S1) as a result of the increase in the number of sellers. As a result, the equilibrium price will fall. The new equilibrium price becomes $180,000 (where the demand and the new supply are equal). The number set from Chapter 16 (and Chapter 14) is repeated below. Quantity Total Revenue Marginal Revenue Marginal Cost Average Total Cost 1 $180,000 $180,000 $160,000 $340,000 2 360,000 180,000 140,000 240,000 3 540,000 180,000 120,000 200,000 4 720,000 180,000 140,000 185,000 5 900,000 180,000 160,000 180,000 *6 1.080,000 180,000 180,000 180,000 7 1,260,000 180,000 200,000 182,857 8 1,440,000 180,000 220,000 187,500 9 1,620,000 180,000 240,000 193,333 10 1,800,000 180,000 260,000 200,000

3
Using these numbers, you can see that, at the price of $180,000, the representative company now produces 6 houses (where the price = marginal revenue = marginal cost). Why did we make the price fall to $180,000? The answer is that new sellers will continue to enter and the price will continue to fall until the economic profit equal to zero. An economic profit of zero means that sellers are earning no more than can be earned in the next best alternative. So at an economic profit of zero, there is no more reason for a new seller to enter. Why if the price is $180,000 per house, is the economic profit equals zero. The price is $180,000. The Average Total Cost of producing 6 houses is $180,000. When we take the price and subtract the average total cost, we get zero. If the economic profit is zero, the number of sellers will not increase nor decrease. When economic profits equal zero and the number of sellers will not change, the situation is called long-run equilibrium. The situation is shown on the graphs on the next page. The first graph is for the representative construction company. The price (equals marginal revenue) falls from $200,000 (the black horizontal line) to $180,000 (the teal horizontal line). The company produces where marginal revenue equals marginal cost (in pink). The quantity falls from 7 to 6 (point a). At point a, the price is equal to (just touches) the Average Total Cost and the economic profit is zero.

4
PRICE FALLS AS SELLERS ENTER
0
50000
100000
150000
200000
250000
300000
350000
400000
1 2 3 4 5 6 7 8 9 10 11 12 13 14
QUANTITY (-000)
a
b
P1 = MR1
P2 = MR2
ATC
MC

5
NEW SELLERS ENTER
$0
$50,000
$100,000
$150,000
$200,000
$250,000
$300,000
$350,000
$400,000
1 2 3 4 5 6 7 8 9 10 11 12 13 14
D1
S2
E2
E1
S1

6
Response to an Economic Loss Assume instead that the original price had been $160,000, as it was in one of the examples in Chapter 16. This would result from a reduction in demand for houses, shown in the table below: Price Old Supply(S1) New Demand
2 New Supply(S2)
$120,000 3,000 7,000 1,000 140,000 4,000 6,000 2,000 160,000 5,000 5,000 3,000 180,000 6,000 4,000 4,000 200,000 7,000 3,000 5,000 220,000 8,000 2,000 6,000 240,000 9,000 1,000 7,000 260,000 10,000 0 8,000 280,000 11,000 9,000 300,000 12,000 10,000 320,000 13,000 11,000 340,000 14,000 12,000 As explained in Chapter 16, the representative construction company will now produce 5 houses, making a total industry supply of 5,000 houses. The representative construction company will earn an economic profit of -$100,000 (loss). In Chapter 16, it was explained that, in the short-run, the company should continue to produce, even though it is making an economic loss. Times are temporarily bad; the company assumes that times will get better. Eventually, we reach the long-run. Some companies begin to realize that times are not going to get better anytime soon --- the demand for houses will stay low. And some companies may believe that, while times will someday get better, they can no longer afford the economic loss. As a result, some companies will go out of the construction industry permanently. Assume that your company manages to survive. As other companies leave the industry, the supply falls (shifts to the left to the new supply --- S2). As a result of the reduced supply, the price rises --- from $160,000 to $180,000. At this price, the representative company now produces 6 houses (where the price = the marginal revenue = the marginal cost) and earns an economic profit of zero. Once the economic profit reaches zero, there is no more reason for anyone else to leave the industry. No one can improve his or her income by leaving this industry and doing something else. We have once again reached long-run equilibrium. The situation is shown on the graphs on the next page. The graph for the industry shows the shift in supply to the left, and the resulting rise in the price. The graph for the representative company shows the rise in the price (equals marginal revenue) from P1 (the black horizontal line) to P2 (the teal horizontal line). The quantity rises from 5 to 6 where the new price (= marginal revenue) is equal to the marginal cost.

7
PRICE RISES AS SELLERS LEAVE
0
50000
100000
150000
200000
250000
300000
350000
400000
1 2 3 4 5 6 7 8 9 10 11 12 13 14
QUANTITY (-000)
a
b P1 = MR1
P2 = MR2
ATC
MC

8
SELLERS LEAVE THE INDUSTRY
100,000
150,000
200,000
250,000
300,000
350,000
400,000
1 2 3 4 5 6 7 8 9 10 11 12
QUANTITY (-000)
$
E1
D2
S1
E2
S2

9
In this example, the long-run equilibrium price is $180,000. At this price, each company earns an economic profit of zero. This means that each company earns exactly the same income as could be earned in the next best alternative. Each construction company produces 6 houses. In order to understand the process by which markets operate, we shall always assume long-run equilibrium as our beginning point. Then, markets are subject to one of three types of disturbances: a change in demand, a change in a fixed cost, or a change in a variable cost. Case 1: A Change in the Demand for the Product Let us assume that, for some reason, the demand for houses increases. Perhaps incomes have risen or interest rates have fallen. An increase in the demand for houses is a shift in the demand curve to the right (from Demand
1 to Demand 2). As a result, there are now shortages of houses
and the price of houses will rise. If we begin in long-run equilibrium, the price of houses is $180,000 and each company is producing 6 houses. Let us assume the price will now rise to $200,000 (the example we used above). For the individual company, the price and the marginal revenue will now equal $200,000. The horizontal line (price equals marginal revenue) shifts up from $180,000 to $200,000. To maximize profits, the company will produce where the new marginal revenue equals the marginal cost --- 7 houses. The industry supply is now 7 times 1000 companies, or 7,000 houses. Each individual construction company is now earning an economic profit of $120,000 --- the rectangle abcd on the graph. This is the situation in the short-run where the number of companies and the size of each company are fixed. In the long-run, people will know that construction companies are earning economic profits (that is, construction companies are earning more than can be earned in other activities) and will therefore enter the industry. Either new companies will be created or existing ones will expand. The new sellers will increase supply --- a shift in supply to the right (from Supply
1 to
Supply 2). As a result, the price will fall. Therefore the economic profits will fall also. The
new sellers will continue to enter and the price will continue to fall until the economic profits are zero. At this point, no one can become better off by entering the industry. The price will have fallen back to the original $180,000. The individual seller is now producing the original 6 houses. But the total market supply of homes has now increased to 8,000 because there are now more companies in the industry. Review Chapter 9 on the Invisible Hand. You will notice that, when we did the case of an increase in the demand for a product then, we were doing the short-run only. Now we must add in the long-run. If buyers desire more of a good, they get more of that good. In the long-run, they do not pay higher prices. The increased supply comes from new sellers, motivated by the higher profits. We have assumed here that the entry of new sellers has no effect on the costs of producing homes. None of the cost curves has shifted. Even though the new companies required natural resources and workers, their entry did not raise the cost of wood or labor. The new companies are simply too small to have an effect on these prices. An industry in which the entry of new sellers has no effect on the costs of production is called a constant-cost industry.

10
AN INCREASE IN DEMAND FOR THE PRODUCT $ Marginal Cost Average Total Cost d_____________________a______________________ Price2 =Marginal Revenue2 ($200,000) d b Price1 = Marginal Revenue1 ($180,000) 0 6 7 Quantity of Homes One Representative Company Explanation. An increase in the demand for homes is a shift in the demand curve to the right (from Demand
1 to Demand 2). See the next page. As a result, there are now shortages of homes and the price
of homes rises. If we begin in long-run equilibrium, the price of homes is $180,000 and each company is producing 6 homes. Let us assume it now rises to $200,000. For the individual company, the price and the marginal revenue will now equal $200,000. To maximize profits, the company will produce where the new marginal revenue equals the marginal cost --- 7 homes. The industry supply is now 7 times 1000 companies, or 7,000 houses. The individual company is now earning an economic profit of $120,000 --- the rectangle abcd on the graph. This is the situation in the short-run where the number of companies and the size of each company are fixed. In the long-run, people will know that construction companies are earning economic profits and will therefore enter the industry. The new sellers will increase supply --- a shift in supply to the right (from Supply
1 to Supply
2). As a result, the price falls. The economic profits
will fall also. The new sellers will continue to enter and the price will continue to fall until the economic profits are zero. The price will have fallen back to the original $180,000. The individual seller is now producing the original 6 homes. But the total market supply of homes has now increased to 8,000 because there are now more companies in the industry.

11
$ Supply1 Supply2 B 200 (Price2) A C 180 (Price1) Long-Run Industry Supply Demand2 Demand1 0 6000 7000 8000 Quantity of Homes
All Sellers Together (The Industry)
Point A is the original long-run equilibrium. Point B is the short-run situation. Point C is the new long-run equilibrium. The horizontal line through points A and C connects all possible points of long-run equilibrium. This line is called the long-run industry supply curve. The long-run industry supply of a perfectly competitive, constant-cost industry is perfectly elastic.

12
The new sellers entering the industry eventually drive the economic profits back to zero. If they know that the economic profits will become zero, why would the new sellers bother to enter at all? The answer is that they are motivated by the economic profits in the short-run. That additional $120,000 economic profit can be a powerful incentive to enter even if it lasts only a few years. Test Your Understanding In Chapter 16, you filled-in the table for the case of the orange grove. Assume again that there are 1000 orange groves and that they are identical. You decided that the equilibrium price of oranges was $0.60, that 180,000,000 pounds of oranges would be produced, and that the economic profits equaled 0. Show this situation on the graph. Now assume that the demand for oranges rises, because it comes out that oranges are especially good for fighting disease. The new demand is shown on the table. What is the new equilibrium price? What is the new equilibrium quantity of oranges? What economic profits will each producer make in the short-run? (To answer this, you have to look up the costs from the previous assignments.) Show the result of the rise in demand for oranges on the graph. Now, explain occurs in the long-run. Why will this occur? Show the long-run change on the graph. Quantity New Quantity Price Supply of One Grove Industry Supply Demanded Demanded $0.30 130,000 130,000,000 200,000,000 260,000,000 $0.40 160,000 160,000,000 190,000,000 235,000,000 $0.60 180,000 180,000,000 180,000,000 220,000,000 $1.00 192,000 192,000,000 170,000,000 198,000,000 $2.00 198,000 198,000,000 120,000,000 180,000,000 $6.00 200,000 200,000,000 80,000,000 160,000,000 Case 2: A Change in a Fixed Cost of Production For a second disturbance, let us consider an increase in a fixed cost. The fixed costs are the costs of the capital and the opportunity costs of the owners. Let us assume that, for some reason, these rise by $120,000 (from $180,000 to $300,000). Everything else (the variable costs and the price of $180,000 per home in long-run equilibrium) stays the same. Recalculate the Average Total Cost and the Marginal Cost. When you do, the calculations now become as follows: Quantity Total Total Total Average Marginal Marginal Variable Fixed Cost Total Cost Revenue Cost Cost Cost
2
1 $160,000 $300,000 $460,000 $460,000 $160,000 $180,000 2 300,000 300,000 600,000 300,000 140,000 180,000 3 420,000 300,000 720,000 240,000 120,000 180,000 4 560,000 300,000 860,000 215,000 140,000 180,000 5 720,000 300,000 1,020,000 204,000 160,000 180,000 6 900,000 300,000 1,200,000 200,000 180,000 180,000 7 1,100,000 300,000 1,400,000 200,000 200,000 180,000 8 1,320,000 300,000 1,620,000 202,500 220,000 180,000 9 1,560,000 300,000 1,860,000 206,666 240,000 180,000 10 1,820,000 300,000 2,120,000 212,000 260,000 180,000 Compare these calculations to those of Chapter 14. Notice first that the average total cost is higher (it shifts up to Average Total Cost
2). This results because the total cost of production is

13
higher. But notice second that the marginal cost is unchanged. A change in a fixed cost does not affect the marginal cost. This is an important point. Why is this so? The answer is that the marginal cost is the change in total cost from producing one more unit of the product; by definition, the fixed cost does not change if we produce one more unit of the product. Only the variable cost changes. This is shown in the graphs following pages. The company maximizes profits by producing up to that quantity at which the marginal revenue equals the marginal cost. Since neither change, in the short-run, the quantity remains the same as it was before the fixed costs rose --- 6 houses. Since none of the 1,000 companies change their quantity produced, the market supply remains the same --- 6,000 houses. With no change in either supply or demand, the market price remains the same --- $180,000 per home. In the short-run, the only change is to the economic profits. Economic profits were zero before the fixed costs rose; now, economic profits are equal to Price ($180,000) minus Average Total Cost ($200,000) times the quantity of houses (6). This equals minus $120,000 (abcd). In the short-run, the entire burden from the increase in the fixed costs is borne by to the owners of the company as lower profits. AN INCREASE IN A FIXED COST OF PRODUCTION $ Average Total Cost2 Marginal Cost Average Total Cost1 c b _____________________ e____________________ Price2 =Marginal Revenue2 ($200,000) d a Price1 = Marginal Revenue1 ($180,000) 5 6 Quantity of Homes One Representative Company

14
Explanation. The average total cost is higher (shift to Average Total Cost 2). This results because the
total cost of production is higher. But the marginal cost is unchanged. The company maximizes profits by producing up to that quantity at which the marginal revenue equals the marginal cost. Since neither change, the quantity remains the same as it was before the fixed costs rose --- 6 homes. Since none of the 1,000 companies change their quantity produced, the market supply remains the same --- 6,000 houses. With no change in either supply or demand, the market price remains the same --- $180,000 per home. In the short-run, the only change is to the economic profits. Economic profits were zero before the fixed costs rose; now, economic profits are equal to minus $120,000 (abcd). In the long-run, companies will be induced by the economic loss to leave the industry. As they leave, the industry supply will decrease (shift to the left from Supply 1 to Supply 2). The price will rise (to $200,000) and the economic profits will rise as well. Companies will continue to leave until the economic profits have returned to zero. Individual sellers will produce more as a result of the higher price. The representative company will now produce 7 homes, instead of 6 homes (point e). But the total quantity produced will decrease as a result of the fewer number of sellers.

15
$ Supply2 Supply1 B 200 (Price2) A 180 (Price1) Demand1
0 6000 7000 Quantity of Homes All Sellers Together (The Industry)

16
This result may seem strange. The company has just had an increase in its fixed cost. Perhaps the capital cost more? Why does the company not just raise the price to recover the higher costs? To answer this, remember that this is perfect competition. What would happen if one company raised its price? The answer is that it would sell nothing. No one company has any influence over the price by itself. The price will change only if ALL companies decide to change the quantity of the product they produce. But in this case, no company will change the quantity it produces. Producing any quantity other than the one that was being produced would reduce the company’s economic profits. Notice that there is an economic loss of $120,000. In the short-run, the company will continue to produce because the price is above the average variable cost (neither changed). But in the long-run, companies will be induced by the economic loss to leave the industry. They may go out of business permanently or they may just shift over to producing something else. As they leave, the industry supply will decrease (shift to the left from Supply 1 to Supply 2). The price will rise (to $200,000) and the economic profits will rise as well. Companies will continue to leave until the economic profits have returned to zero. Individual sellers will produce more as a result of the higher price. But the total quantity produced will decrease as a result of the fewer number of sellers. The situation is also shown in the graph above. The long-run results of an increase in a fixed cost are as follows: the quantity produced in the market is smaller (because there are fewer sellers) and the market price is higher. In the long-run, all of the burden of the increase in the fixed costs is borne by the buyers in the form of higher prices. Economic profits for owners remaining have risen to zero. (The other burden of the increase in the fixed costs is, of course, borne by those companies that had to go out of business.) Example: Medical Malpractice Insurance There has long been a dispute between doctors and lawyers concerning medical malpractice. Doctors claim that patients sue too quickly and win financial awards from the courts that are unreasonable. As a result, doctors pay for malpractice insurance. Doctors claim that the premiums they pay for this insurance are too high because of the excessive awards. As a result, they claim, they must charge more to customers. Is the argument of the doctors valid? Economists have no expertise to judge whether the lawyers sue too quickly or whether the doctors are guilty of malpractice. But economists can explain the result of the increase in the insurance premiums doctors must pay for malpractice insurance. Assume that doctors represent a perfectly competitive industry. (Actually, doctors do not meet the characteristics of perfect competition. However, as a result or the change toward managed care, doctors have become quite competitive.) How do we interpret the increase in medical malpractice insurance premiums? Obviously, these are costs to doctors, but are they fixed costs or variable costs? The question is asking: if the doctor changes the number of patients, does the medical malpractice insurance premium change? Since the answer is "no", medical malpractice insurance premiums are fixed costs of production. We just saw the results of an increase in a fixed cost of production. The average total cost rises but the marginal cost is not affected. Because the marginal cost is unchanged, the

17
quantity produced is unchanged. Because the quantity is unchanged for all companies, the price is unchanged. The only result in the short-run is a decrease in economic profits. When we began in long-run equilibrium (with zero economic profits), the economic profits fell from zero to less than zero (an economic loss). But in the case of most doctors, this in unlikely. Most doctors are earning economic profits (more than could be earned in the next best alternative). We know this because of the large number of people trying to become doctors. So, it is likely that, for most doctors, the result of an increase in medical malpractice insurance premiums is a decrease in profits. The consumer does not bear any of the burden. Why do doctors not just raise their fees to cover the increase in the medical malpractice insurance premiums? The answer is that doctors are competitive. If a doctor raises fees, the insurance plan the doctor is affiliated with will have to raise the amount it charges to employers. (Employers pay for much of the health insurance of their workers.) The employer will then search for a cheaper insurance plan. If the doctor is not affiliated with the cheaper insurance plan, the doctor could lose many patients. Suppose that the medical malpractice insurance premiums were to rise so much that the economic profits actually became negative. This is possibly the case for obstetricians. In this case, the long-run does come into play. Doctors will leave the industry. The decrease in supply will cause the market price to rise --- until the economic profits of those remaining has returned to zero. In this case, consumers will indeed pay for the increase in medical malpractice insurance premiums --- by driving doctors out of business. Consumers will also have less services from doctors available, since there will be fewer providers of these services. "Going out of business" in this case does not mean that they cease to be doctors. The obstetricians simply shift to another form of medical practice, commonly gynecology. *Test Your Understanding* Return to the assignment relating to the orange grove from previous chapters. The fixed costs were the costs of the capital, the land, and the opportunity costs of the owners. Let us assume that these drop by $6,000 from $36,000 to $30,000 (for example, caused by a reduction in the property taxes paid). Everything else (the variable cost and the price of oranges of $0.60) stays the same. The calculations now become as follows (fill in the table below): Quantity Total Total Total Average Marginal Marginal Variable Fixed Cost Total Cost Cost Revenue Cost Cost 10,000 $12,000 $30,000 $42,000 $0.60 40,000 24,000 30,000 54.000 .60 90,000 36,000 30,000 66,000 .60 130,000 48,000 30,000 78,000 .60 160,000 60,000 30,000 90,000 .60 180,000 72,000 30,000 102,000 .60 192,000 84,000 30,000 114,000 .60 198,000 96,000 30,000 126,000 .60 200,000 108,000 30,000 138,000 .60 Compare these calculations to the earlier ones. Then, use these calculations to analyze the effects of the decrease in the fixed cost of production in the short-run and then in the long-run.

18
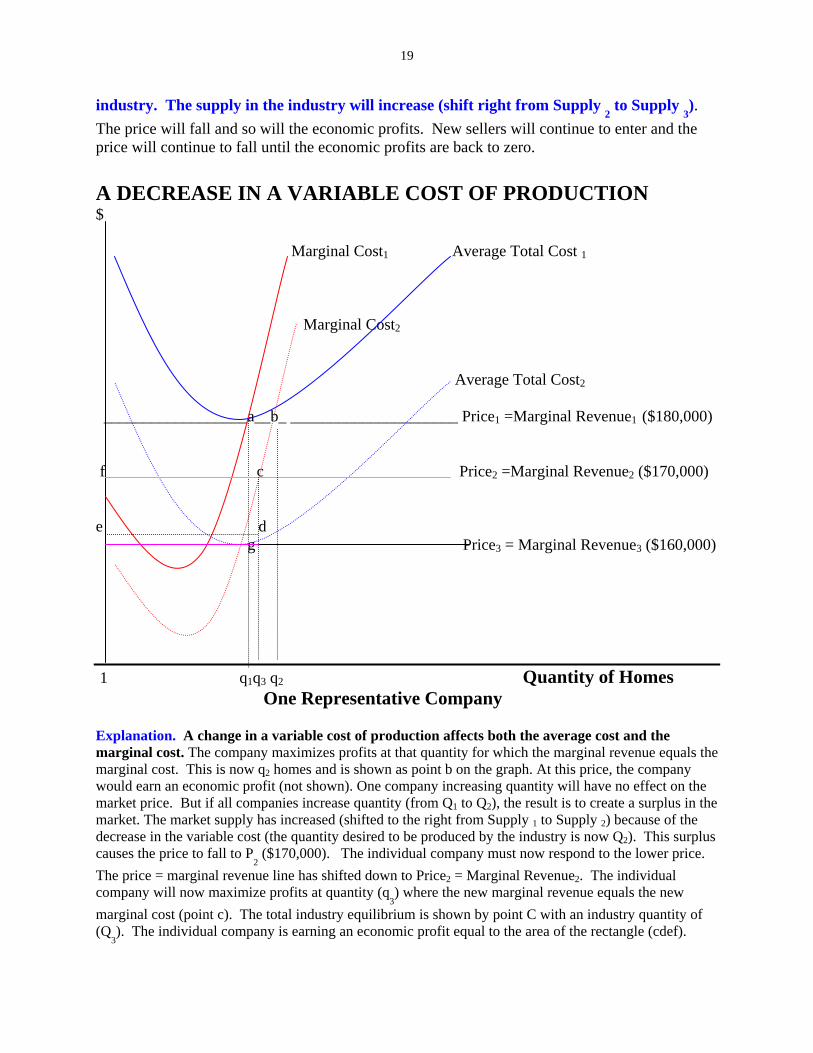
Case 3: A Change in a Variable Cost of Production For the third disturbance, let us consider a decrease in a variable cost of production. The variable costs are the costs of the natural resources and the labor. Let us assume that the productivity of the workers increases so that fewer workers are now needed to build houses. Our calculations become as shown below (with all costs in thousands to save space). Each worker is still paid $20,000. The natural resources still cost is $20,000 per house. The fixed cost remains at the original $180,000. We begin in long-run equilibrium. Natural Total Total Average Labor Resource Variable Fixed Total Total Marginal Marginal Quant Labor Cost Cost Cost Cost Cost Cost Cost Revenue 1 6 $120 $20 $140 $180 $320 $320 $140 $180 2 11 220 40 260 180 440 220 120 180 3 15 300 60 360 180 540 180 100 180 4 20 400 80 480 180 660 165 120 180 5 26 520 100 620 180 800 160 140 180 6 33 660 120 780 180 960 160 160 180 7 41 820 140 960 180 1,140 162.8 180 180 8 50 1,000 160 1,160 180 1,340 167.5 200 180 9 60 1,200 180 1,380 180 1,560 173.3 220 180 10 71 1,420 200 1,620 180 1,800 180 240 180 Compare these calculations to those of chapter 14. Notice that both the average total cost and the marginal cost are lower. A change in a variable cost of production affects both the average total cost and the marginal cost. This is shown in the graph on the next pages. The company will maximize profits at that quantity for which the marginal revenue equals the marginal cost. This is now 7 houses and is shown as point b on the graph. At this price, the company would earn an economic profit (180,000 - $162,857 times 7 = $120,000). One company increasing quantity will have no effect on the market price. But if all 1,000 companies increase quantity (from 6,000 homes to 7,000 homes), the result is to create a surplus in the market. The graphs on the next pages show the situation for the industry (all companies together). The supply has increased (shifted to the right from Supply 1 to Supply 2) because of the decrease in the variable cost (the quantity desired to be produced by the industry is now Q2 or 7,000 homes). This surplus causes the price to fall to P
2 ($170,000).
The individual company must now respond to the lower price. The price = marginal revenue line has shifted down. The individual company will now maximize profits at quantity (q
3)
where the new marginal revenue equals the new marginal cost (point c). The total industry equilibrium is shown by point C with an industry quantity of (Q
3). The individual company is
earning an economic profit equal to the area of the rectangle (cdef). This is not calculated here The analysis thus far has been confined to the short-run. In the long-run, there will be a response to the economic profits that are now being earned. New companies will enter the
19
industry. The supply in the industry will increase (shift right from Supply 2 to Supply
3).
The price will fall and so will the economic profits. New sellers will continue to enter and the price will continue to fall until the economic profits are back to zero. A DECREASE IN A VARIABLE COST OF PRODUCTION $ Marginal Cost1 Average Total Cost 1 Marginal Cost2 Average Total Cost2 __________________a__b_ _____________________ Price1 =Marginal Revenue1 ($180,000) f c Price2 =Marginal Revenue2 ($170,000) e d g Price3 = Marginal Revenue3 ($160,000) 1 q1q3 q2 Quantity of Homes One Representative Company Explanation. A change in a variable cost of production affects both the average cost and the marginal cost. The company maximizes profits at that quantity for which the marginal revenue equals the marginal cost. This is now q2 homes and is shown as point b on the graph. At this price, the company would earn an economic profit (not shown). One company increasing quantity will have no effect on the market price. But if all companies increase quantity (from Q1 to Q2), the result is to create a surplus in the market. The market supply has increased (shifted to the right from Supply 1 to Supply 2) because of the decrease in the variable cost (the quantity desired to be produced by the industry is now Q2). This surplus causes the price to fall to P
2 ($170,000). The individual company must now respond to the lower price.
The price = marginal revenue line has shifted down to Price2 = Marginal Revenue2. The individual company will now maximize profits at quantity (q
3) where the new marginal revenue equals the new
marginal cost (point c). The total industry equilibrium is shown by point C with an industry quantity of (Q
3). The individual company is earning an economic profit equal to the area of the rectangle (cdef).

20
$
Supply1 Supply2 Supply3 A B 180 (Price1) 170 (Price2) C 160 (Price3) D Demand1
Q1 Q3 Q2 Quantity of Homes
Q4 All Sellers Together (The Industry) Explanation. In the long-run, new companies enter the industry. The supply shifts right from Supply
2 to Supply
3.
The price falls and so do the economic profits. New sellers continue to enter and the price continues to fall until the economic profits equal zero. This occurs at a price of $160,000 (price
3). Point D shows the equilibrium quantity
for the industry (Q4); point g shows the equilibrium quantity for the individual company (= q1 in this particular
example). The price will continue to fall until the economic profits once again equal zero. This occurs at a price of $160,000 (price
3). Point D shows the equilibrium quantity for the entire industry (Q
4). Point d shows the
equilibrium quantity for the individual company of (q4). It turns out in this number set, the new quantity will be 6
homes, the same quantity as we began with in the original long-run equilibrium. This is purely a coincidence.

21
When the new long-run equilibrium is reached, all of the benefit of the increase in workers' productivity will have gone to consumers as lower prices. Consumers will also be receiving more of the product. The profits of the companies will be back to the original level of zero. Given that companies will end up earning an economic profit of zero, why would they bother trying to find ways to increase workers' productivity? The answer, of course, is the short-run economic profit that can be made. Steps In Using the Graphs when there is a Change in a Variable Cost: Changes in a variable cost of production present the most problems in analysis. This occurs because there are so many changes involved. It becomes easier if you systematically take the analysis one step at a time. 1. Begin in long-run equilibrium. Then, make the appropriate change in both the Average Total Cost and the Marginal Cost. 2. Find the quantity at which the new Marginal Cost equals the Marginal Revenue. 3. Shift the industry supply curve. 4. Find the new market price. 5. On the graph of the representative company, shift the Marginal Revenue curve to reflect the new market price. 6. Find the new profit-maximizing quantity at which the new Marginal Revenue equals the new Marginal Cost. 7. Find the economic profits or losses. (Price - Average Total Cost) x Quantity 8. Shift to the long-run. If there are economic profits (losses), new companies will enter (leave) the industry. Industry supply will shift to the right (left). The market price will fall (rise) until the economic profit is back to zero (new long-run equilibrium). On the graph of the representative company, the Marginal Revenue curve falls (rises) until it just touches the minimum point on the average total cost curve. 9. You may use the graphs to summarize the change in the market price, quantity produced by a representative company, and total quantity produced by the whole industry. Example: Tax Incidence Chapter 7 considered the incidence of a tax. Now, we can take that analysis further. Assume that the sales tax is raised from 7% to 8%. Each company must pay to the state 8 cents for each $1 of sales, instead of 7 cents. How do we interpret this increase? As was shown in Chapter 7, it is a cost of production. But is it a fixed cost or a variable cost? Since the amount paid in tax does depend on the quantity sold, this is a variable cost. We just analyzed a change in a variable cost. The increase would be shown as an increase (shift up) in Average Total Cost and in Marginal Cost (the opposite of the graphs above). In the short-run, each company would produce less. Less production by all companies would cause the price to rise. However, each company suffers an economic loss in the short-run. In Chapter 7, it was shown that the amount that the quantity would fall and the amount the price would rise depend on the price elasticity of demand for the product. The more inelastic the demand for the product, the more the price will rise and the greater is the incidence of the tax on the buyers.

22
The more elastic is the demand for the product, the less the price will rise and the greater is the incidence of the tax on the sellers in the form of reduced profits. But now we can go further. In the long-run, companies will be forced to leave the industry. This reduction in the number of companies shifts supply to the left, causing the market price to rise. The price rises until the economic profit is back to zero. Therefore, in the long-run, the buyers of the product pay all of the tax (the incidence is on the buyers). There is also a burden on those companies that are forced out of business. Example: Technological Improvements Let us examine the case of pocket calculators. When they first came on the market in the mid-1970s, the price was $150 and up. ($150 then had the same purchasing power over $500 today.). There were very large economic profits to be made from producing pocket calculators. The difficulty for American companies was the high labor cost of assembly. High labor cost has been the motivation for much of the technological innovation that has occurred in American history. In this case, as well, innovation occurred to lower costs of assembly. Texas Instruments developed a single chip that could do all four of the functions of the pocket calculator. Since this meant attaching connections to only one chip, it reduced the labor time for assembly greatly. How do we interpret this situation? The reduction in labor time for assembly is a reduction in a cost of production. But is it a fixed cost or a variable cost? We have consistently treated labor as a variable cost. Therefore, the situation involves a decrease in a variable cost --- similar to the one illustrated above. Remember that a decrease in a variable cost is shown as a decrease (shift down) in both Average Total Cost and the Marginal Cost. The quantity produced by each company increases in the short-run. Since all companies increase their quantity produced, market supply increases (shifts right) and the market price falls. However, the decrease in the price is less than the decrease in the Average Total Cost, and economic profits rise. This short-run rise in economic profits is the motivator for the technological innovation. In the long-run, other companies will be motivated by the economic profits to enter the industry. It will take some time for the new companies to learn the new technology as well as the best methods to manufacture the new product. But eventually many new companies did indeed begin manufacturing pocket calculators. The increase in supply caused the price to fall --- until the economic profits were zero. The falling economic profits provided incentives for companies to find even better technological innovations to lower costs of production, beginning the process all over again. You can now analyze this using the graphs above. Notice an important result. In the long-run, ALL of the benefits of the technological innovation go to consumers. Consumers benefit from the lower prices. Today one can buy a much better pocket calculator for less than $10. But consumers also benefit from the increased quantity of the product on the market as well as its improved quality. While the companies made considerable short-run economic profits, in the long-run, the owners of the companies earned no more than could have been earned in their next best alternative. The process here describes how the price of a pocket calculator fell from over $150 to less

23
than $10, while the quality improved. The same story could be applied to a large number of products: computers, CD players, VCRs (the first ones were over $1,500), color televisions (the first ones were over $2,000 in today’s money), contact lenses, DVD Players, and so forth. Test Your Understanding Go back to the numbers for the orange grove case. Consider a decrease in a variable cost of production for the same orange grove.. The variable costs are the costs of the natural resources and the labor. Let us assume that the wages of the workers are reduced from $12,000 to $7,200 per year ($600 per month). Make the calculations in the table Variable Fixed Total Average Marginal Marginal Quantity Cost Cost Cost Cost Cost Revenue 10,000 $ 7,200 $36,000 $43,200 $0.60 40,000 14,400 36,000 50,400 .60 90,000 21,600 36,000 57,600 .60 130,000 28,800 36,000 64,800 .60 160,000 36,000 36,000 72,000 .60 180,000 43,200 36,000 79,200 .60 192,000 50,400 36,000 86,400 .60 198,000 57,600 36,000 93,600 .60 200,000 74,800 36,000 100,800 .60 Compare these calculations to the earlier calculations. Show the changes on the graph. Begin your graph in long-run equilibrium. Use the calculations to analyze the effects of the decrease in wages in the short-run and then in the long-run. When the new long-run equilibrium is reached, who gains from the reduction in the workers’ wages? Test Your Understanding On a graph, draw the situation for a representative company and for the entire industry in long-run equilibrium. The industry, which is agriculture in California, is assumed to be perfectly competitive. Growers in California often pay $5 to $12 per acre-foot of water used to grow their crops. The market price might be closer to $300 per acre-foot. You are to assume that government policy changes: growers of crops in California are now forced to pay the full market price for water used to grow their crops. Show on the graph what will occur in the short-run. What happened to the quantity produced of agricultural products, the price of agricultural products, and the economic profits of the growers? Then, do the same analysis for the long-run. Conclusion to Chapters 16 and 17: Benefits To Society From Perfect Competition Let us conclude the discussion of perfect competition by summarizing the benefits to society from it. Remember that one of the functions of government under laissez faire is to "promote or maintain competition". Therefore, people must believe that competition is good for the society as a whole. Why is this so? Let us list some of these benefits. (1) Economic Profit of Zero As we saw, in perfect competition, companies earn an economic profit of zero in the long-run. While the long-run is not specified in weeks or years, we can presume it is a relatively short period. Why is this good for society? The answer is that, when companies are earning economic profits above zero, new companies enter the industry. The entry of the new companies

24
will soon eliminate the economic profits. The only way a company can earn economic profits for a long time period is to be able to prevent other companies from producing the products that consumers desire. This clearly is not good for society. For many years, companies like General Motors, IBM, and CBS earned economic profits that were well above zero. They were able to maintain these profits only by having barriers to entry that kept other companies from producing products that consumers definitely desired. Notice that, in perfect competition, companies do make economic profits in the short-run. As long as the short-run does not last too long, these economic profits are socially desirable. One reason they are desirable has already been mentioned --- short-run economic profits motivate producers to enter industry to produce products that buyers want produced. Short-run economic profits also motivate producers to do other things that are socially desirable. Some of these are covered in the following paragraphs. (2) Productive Efficiency We can look at productive efficiency in two ways. First, there is the short-run. In our example, the construction company chose to produce 7 houses at an Average Total Cost (cost per house) of $182,857. We can assume that this is the lowest possible cost per house of producing 7 homes. Companies in perfect competition have a financial incentive to produce as efficiently as possible. Any inefficiencies are reflected in reduced profits for the owners of the companies. Since in the long-run, these profits equal zero, inefficiencies would cause economic profits to fall below zero. Companies would either have to find more efficient ways of producing or be driven out of business. Second, there is the long-run. Since economic profits equal zero, the price must be equal to the Average Total Cost. We know that the company maximizes profits where the Marginal Revenue equals the Marginal Cost. We also know that, in the perfect competition (and only in perfect competition), the price equals the Marginal Revenue. Since price equals Marginal Revenue equals Marginal Cost and price also equals Average Total Cost, the Marginal Cost and the Average Total Cost must be equal (since they are both equal to the price). Where does this occur? As you saw when the cost curves were calculated in Chapter 14, this can only occur at the lowest point on the average total cost curve. In our example, the market guides the construction company to produce that quantity of houses (6) at which the cost per house of $180,000 is as low as possible. There is no quantity of houses at which you can produce a house for a cost below $180,000. (Check the number set from Chapter 14 to confirm this.) Since "cost" means opportunity cost, this means that the least possible is being sacrificed for the production of each home. Remember that the goal of the owner is not to produce at the lowest possible cost per house. The goal is to maximize profits. But, in the pursuit of maximum profits, the market guides the company to produce that quantity (6) at which the cost per house is at its lowest possible. The company’s decision-makers are probably not even aware that this is occurring. This is another of the results of the "invisible hand", whereby the market provides the proper incentives to guide producers to behaviors that are desirable for society as a whole.

25
(3) Improvements over Time As we have seen with so many products, companies with a large amount of competition have a strong incentive to find new ways of producing that will lower production costs. This strong incentive explains why products that were once very expensive ---computers, VCRs, televisions, contact lenses, and so forth --- are now so much cheaper. (To see this, review the case of a decrease in a variable cost.) The incentive is actually twofold. On the one hand, there is the positive reward of increased economic profits in the short-run if a company can find a way of producing at a lower cost. On the other hand, there is the fear that competitors of the company will find a way of producing at a lower cost before it does. If they do so, they will be able to charge a lower price. The company will not be able to earn satisfactory profits at this lower price. It risks being forced out of business. The case of pocket calculators, explained earlier, illustrates the incentive to find ways to lower costs. Companies that face considerable competition also have strong incentives to improve the product. What exactly is an "improvement"? The answer, in a market economy, is that a product has been improved if consumers desire it more and are more likely to buy it. Consumers decide when a given change in a product is actually an improvement. The strong incentives to "improve" products are easily seen in the continual improving of computer hardware and software, in the competition between the programs shown on television stations, in competition in fashion design, in competition between automobile companies, and in many other examples. To take just one example, let us consider the coffee maker. Prior to 1970, people who drank coffee drank instant coffee, had coffee brewed in a coffee percolator, or used a pyrex container. The pyrex container was much cheaper than the percolator. One would heat water in the container, put the coffee into a filter, put the filter into a plastic cone, and then pour the boiling water through the cone back into the container. In the early 1970s, Vince Marotta decided to develop a product that worked in the same way except that one poured cold water into a container and a heater boiled the water. The boiling water then ran through the coffee that had been placed in a plastic cone and into the pyrex container. He called this invention “Mr. Coffee”. He advertised it heavily. It was a huge hit and Marotta was soon making large economic profits. In a competitive industry, what should happen? Of course, others should start producing similar products. And so they did. As the supply rose, the price fell and the economic profits also fell. To maintain the economic profits, Marotta changed the design of the container to allow “Brew for Two”. This too was a hit and economic profits rose. Others, of course, soon copied. Then, Marotta combined his coffee maker with an alarm clock. Now instead of making a sound, the alarm would turn on the coffee maker. Another huge hit. Again it was soon copied. As time has gone one, we have seen space saver coffee makers, coffee for one, designer coffee makers, and so on. Some products have been very successful. Some have not. Since other companies can easily copy the product improvements causing the economic profits to go to zero, why bother developing the improvements at all? The answer, of course, is the economic profits in the short-run. Even if they don’t last very long, the huge profits made for awhile were enough so that Mr. Marotta need have no financial worries for the rest of his life.

26
(4) Allocative Efficiency Allocative efficiency loosely means that the "right" quantity of each good or service is produced (from the point of view of society, where “society” means consumers). How do we know that the "right" quantity of a particular good or service is being produced? To answer this question, we use our procedures for rational decision making. The question is not “what is the best quantity of a product to produce from the viewpoint of society?” The question is “is it desirable for the society (that is, for the consumer) to produce one unit of this product?” To answer this, we must compare the marginal benefit and the marginal opportunity cost of that first unit. If the marginal benefit to society is greater than the marginal opportunity cost, society is better off having one unit of the product produced. If that is so, go on to the second unit. And so on. When the marginal benefit becomes less than the marginal opportunity cost, that unit should not be produced. We are producing the "right" quantity for the society as a whole when the marginal benefit to society equals the marginal opportunity cost. If there are no external costs, the marginal opportunity cost to society is the same as the Marginal (opportunity) Cost for the company. But what is the marginal benefit to society? In Chapter 12, this question was answered: the marginal benefit is the highest price that someone is willing to pay for that unit of the product. Therefore, we are producing the "right" quantity (we have allocative efficiency) when the price equals the marginal cost. Since a profit-maximizing company will produce up to the quantity at which marginal revenue equals marginal cost, and since in perfect competition, the price equals the marginal revenue, we know that this condition (Price equals Marginal Cost) will be met. Companies do not know that they are producing the "right" quantity for society. They also do not care. But in trying to maximize their profits, they are indeed doing just that. This is the "magic of the market". Let us return to our example of the production of houses. For the first 1,000 houses, buyers are willing to pay up to $320,000 each (see the demand curve). The marginal opportunity cost of each of these houses is $160,000 each (this is the amount that must be sacrificed to produce each of these homes --- see the table of numbers). Therefore, society is better off having these houses produced. The companies are also better off producing them, because their economic profits are increased. The same is true for all houses up to 7,000. But for the 1,000 houses from 7,001 to 8,000, buyers are willing to pay only $180,000 for each of these houses. (Remember that the marginal utility decreases as more houses are bought. This is the law of diminishing marginal utility.) But the marginal opportunity cost of each of these houses is $220,000. (Remember that the marginal opportunity cost rises as more is produced. This is a result of the law of diminishing marginal returns.) Society is better off if these houses are not produced. And the companies will not produce them because doing so would reduce their economic profits. The "right" quantity of houses is 7,000, where the price equals the marginal cost. That is indeed the quantity that will be produced. Each of the 1,000 companies will produce 7 houses because that is the quantity that maximizes its profits. Again, the companies do not know and do not care that this is the "right" quantity of homes for the society. Companies care only about their own economic profits. But in pursuing their own economic profits, they end up doing what is right for the society as a whole.

27
Summary In summary, in perfect competition, companies will earn zero economic profits in the long-run, will produce that quantity for which the Average Total Cost is the lowest possible (productive efficiency), will have strong incentives to find ways to lower costs of production and to "improve" their products, and will produce the "right" quantity of each good from the point of view of the society as a whole (allocative efficiency). No wonder people believe that a market economy with perfect competition is so desirable. Practice Quiz on Chapter 17 1. Long-run equilibrium occurs when: a. Marginal revenue equals marginal cost c. New firms enter the industry b. Economic profits are at their maximum d. Economic profits are zero 2. For a constant-cost industry, the long-run industry supply curve is: a. horizontal b. vertical c. upward-sloping d. downward-sloping 3. Assume that an industry is perfectly competitive and begins in long-run equilibrium. Then, there is a decrease in a fixed cost. In the short-run, a. the quantity will stay the same c. the economic profits will rise b. the price will stay the same d. all of the above 4. From question 3 above, in the long-run, a. the quantity will fall b. the price will rise c. the profits will be zero d. all of the above 5. If there is a decrease in a variable cost:
a. average cost falls; marginal cost is unchanged c. marginal cost falls; average cost is unchanged b. average cost and marginal cost both fall d. neither average cost nor marginal cost fall
6. If there is a decrease in a variable cost, in the short-run
a. the price will rise and the quantity will rise c. the price will fall and the quantity will rise b. the price will fall and the quantity will fall d. the price will rise and the quantity will fall
7. If there is a decrease in a variable cost, in the long-run
a. new sellers will enter and the price will fall c. sellers will leave and the price will rise b. new seller will enter and the price will rise d. sellers will leave and the price will fall
8. Assume that an industry is perfectly competitive and begins in long-run equilibrium. Then, there is a decrease
in the demand for the product. In the short-run, a. the price will rise and the quantity will rise c. the price will fall and the quantity will rise
b. the price will fall and the quantity will fall d. the price will rise and the quantity will fall 9. Companies in perfectly competitive industries: a. Make zero economic profits in the long-run c. produce at minimum average total cost in the long-run b. have incentives to improve products and produce more efficiently over time d. all of the above 10. We know that allocative efficiency has been achieved if the a. price = marginal cost c. price = marginal revenue b. marginal cost = average total cost d. price = average total cost Answers: 1. D 2. A 3. D 4. C 5. B 6. C 7. A 8. B 9. D 10. A