Embed Size (px)
Citation preview

How to Give an Applied Micro Talk
Unauthoritative Notes
Jesse M. Shapiro
Chicago Booth and NBER
Motivation
Your audience does not care about your topic
You have 1-2 slides to change their minds
Make them count
anecdotesfactspolicy questions

Question
State a research question
Policy/counterfactual question: what would happen if...?Estimate of an important �deep� parameter: how forward-looking areconsumers?Test of an important theoretical prediction: does revenue equivalencehold in...Or, better yet, all three!

Not Research Questions
Applied research questions are motivated by economics and not the
economics literature.
Applied research questions are not
What happens if we apply the X model to industry Y?What happens if we change assumption Z of the X model?What happens when I re-estimate so-and-so's model on some otherdata?

This Paper
Outline what your paper does and why
Convey why you have something to add
�Revisit the consumption CAPM using new high-quality consumptiondata.�NOT �Revisit the consumption CAPM because no one has estimated itin a few years.�
Preview of Findings
Assume the audience is about to leave
Make sure they walk out with something
Be tangible but terse
Just enough of your methodology so results don't feel like magicNot so much that you crowd out the �ndings
Good Level of Detail
State adoption of mandatory maternity leave reduces women's wages
by 5%
No e�ect for women past fertile ageNo e�ect for men
Implies approximately $0.75 of every $1 spent on maternity bene�ts
are �paid� by mother

Not Enough Detail
Incidence of maternity leave policies mostly on wages

Too Much Detail
Across state-years
Number of observations ranges from 543 (Delaware in 1976) to 17,645(New York in 2005)Mean wage for women is $17.49/hour (2008 dollars); median is$15.12/hourMean wage for men is $25.16/hour (2008 dollars), median is$22.99/hourAverage annual change in women's wages is 1.34%
Regression model with state and year �xed e�ects
Weighted by number of observations in state-yearExclude outliers using Tukey's methodCluster standard errors (Bertrand Du�o Mullainathan 2003)
E�ect of maternity leave adoption is estimated to be
-$1.70 per hour (SE = $0.30) for women$-0.21 per hour (SE = $0.20) for men
Compare to cost of $2.25 per hour of providing leave

Data

Goals
State clearly the source of each variable
Prevent confusion later: no one should be wondering
�Where did that come from?��Is that measured at the state level or the county level?�
Anticipate concerns over pure measurement and address them now
Are data sources reliable?Do the concepts you measure approximate those in your model?

Credit
Be sure to get credit for
Novel dataNew ways of measuring somethingNew sources of variation
But no one cares that
This dataset took a long time to downloadThere are a lot of di�erent ways to weight the data and I had to read amanual

Your Underwear
No one wants to see your underwear
And no one wants to know how you processed the data
First I collapse by state, county, year, and gender to make the dataseteasier to look atThen I divide all variables by the 2008 CPIThen I remove observations with missing wagesThen I remove observations with wages that are greater than$100/hour...Then I collapse by state, year and gender
Try this:
Average wage by state, year and gender, excluding outliers(>$100/hour in 2008 dollars)
Model
Be Explicit
Panel data model with year and state �xed e�ects
Identi�cation comes from exogenous law changes

Be More Explicit
Panel data model with year and state �xed e�ects
yit = αi + δt + βxit + εit
with
yit = average wage in state i , year t
αi = state �xed e�ectδt = year �xed e�ectεit = error term
Identi�cation comes from exogenous law changes
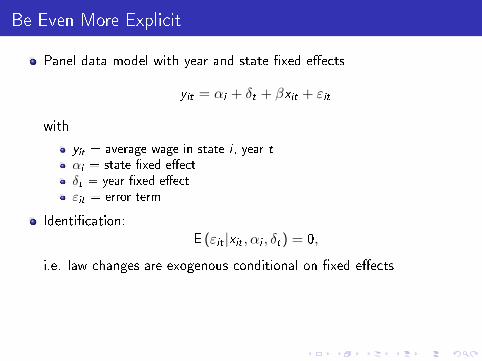
Be Even More Explicit
Panel data model with year and state �xed e�ects
yit = αi + δt + βxit + εit
with
yit = average wage in state i , year t
αi = state �xed e�ectδt = year �xed e�ectεit = error term
Identi�cation:
E (εit |xit , αi , δt) = 0,
i.e. law changes are exogenous conditional on �xed e�ects

De�ne Your Bottom Line
Let γ be the average cost (per hour) of providing maternity leave
De�ne β/γ as the fraction of maternity leave costs paid by the worker

Even Better If
You can lay out explicit economic assumptions that justify your
econometric assumptions
Your model connects directly to well-de�ned policy or welfare questions

Pause To
Discuss the most important vulnerabilities of your modeling approach
Why you think your model is a good approximationWhat you will do to assess plausibility of your assumptions / sensitivity

Do Not Pause To
Try to anticipate every possible criticism
Talk about the other models you have tried
Discuss �ne points that no one will think of anyway

By Now
The audience
believes in your questionunderstands what you measure and howunderstands what you will do with your data and why
Otherwise
the audience is lostno one will be able to appreciate your �ndingsthe talk is already over, you just don't know it
No pressure though

Interlude: Slides

Principles for Slide Design
Unlike reader of paper, audience can't skip or browse
So every word is precious
Slides should be clear
Slides should be sparse: no extraneous detail

Content
While you are talking, some people are not listening
Instead they are looking at your slides
Make the slides tell the story with your voice
(Can you hear me now?)
Don't put anything on a slide you don't plan to talk about
Amount of space you devote should correspond to the emphasis you
intend

Pacing
No pauses
Unless
You
Really
Want
to
Stress
Something

Pacing
No pauses
Unless
You
Really
Want
to
Stress
Something

Pacing
No pauses
Unless
You
Really
Want
to
Stress
Something

Pacing
No pauses
Unless
You
Really
Want
to
Stress
Something

Pacing
No pauses
Unless
You
Really
Want
to
Stress
Something

Pacing
No pauses
Unless
You
Really
Want
to
Stress
Something

Pacing
No pauses
Unless
You
Really
Want
to
Stress
Something

Pacing
No pauses
Unless
You
Really
Want
to
Stress
Something

Documentation
Your paper is a complete description of what you did and what you
learned
Slides cannot be complete�there is not enough time
Leave documentation to the paper
Use your talk to tell your story

Scaling
A 30 minute talk is not a 90 minute talk where you talk three times
faster
(Hat-tip to Matthew Rabin for teaching me this one.)
Choose emphasis and detail for the amount of time you have

Results

Figures
Use �gures wherever possible to tell the story of what is in the data
More honestMore completeMore interestingMore persuasive

Tables
Use tables to summarize key magnitudes
Not to
Show coe�cient on every control variable (unless these tell animportant story)Show every robustness check you did (can summarize these in bullets)
Always be telling your story

Bottom Line
Have a bottom line
A single qualitative or (ideally) quantitative take-away
Measurement error in consumption data explains 27% of equitypremium puzzle
Not just another description of what you did
Estimated the consumption CAPM with high-quality data

Conclusion
You worked hard on your research
Work hard on communicating it
Make sure the audience
Cares about your research questionUnderstands how you answer itKnows why they should believe youWalks out of the room knowing what you learned

And One More Thing
Practice
A lot
Give talks whenever you can

And One More Thing
Practice
A lot
Give talks whenever you can

And One More Thing
Practice
A lot
Give talks whenever you can