Embed Size (px)
Citation preview
Your Digital Network. Your Future.Network Services
How to Get Smarter with the Reference Design Kit: Insights and Practical Use Cases
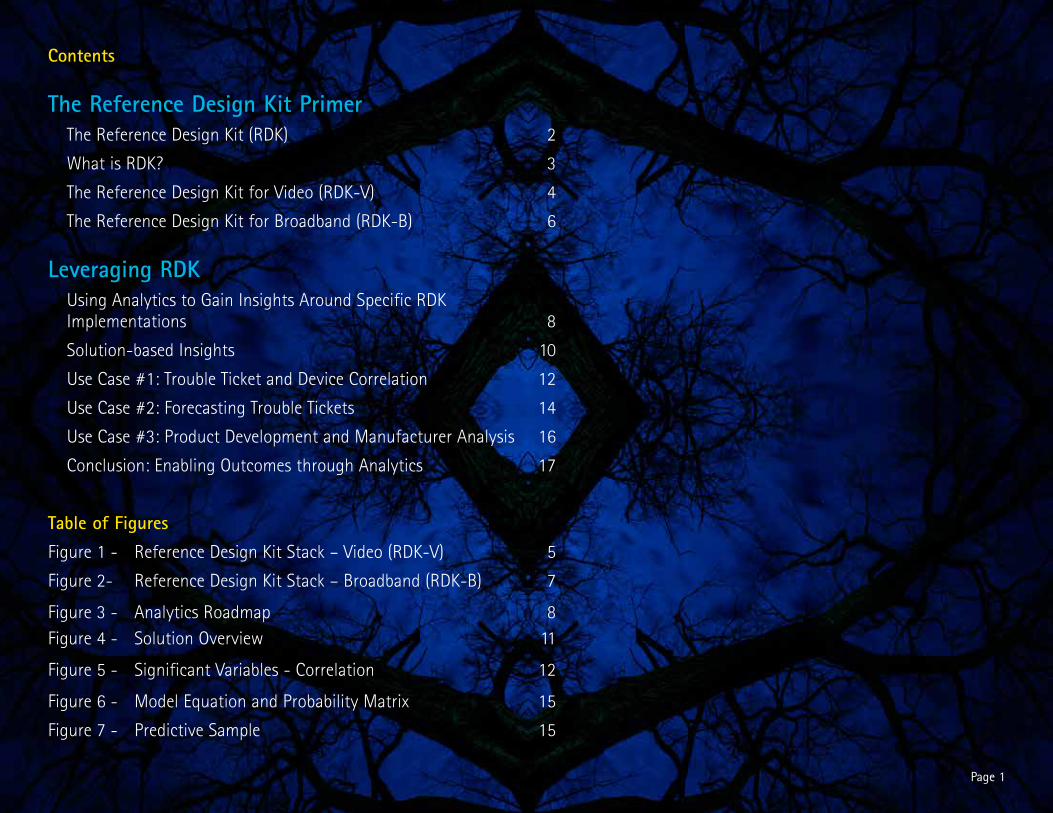
Contents
The Reference Design Kit Primer
The Reference Design Kit (RDK) 2
What is RDK? 3
The Reference Design Kit for Video (RDK-V) 4
The Reference Design Kit for Broadband (RDK-B) 6
Leveraging RDK
Using Analytics to Gain Insights Around Specific RDK Implementations 8
Solution-based Insights 10
Use Case #1: Trouble Ticket and Device Correlation 12
Use Case #2: Forecasting Trouble Tickets 14
Use Case #3: Product Development and Manufacturer Analysis 16
Conclusion: Enabling Outcomes through Analytics 17
Table of Figures
Figure 1 - Reference Design Kit Stack – Video (RDK-V) 5
Figure 2- Reference Design Kit Stack – Broadband (RDK-B) 7
Figure 3 - Analytics Roadmap 8Figure 4 - Solution Overview 11
Figure 5 - Significant Variables - Correlation 12
Figure 6 - Model Equation and Probability Matrix 15
Figure 7 - Predictive Sample 15
Page 1
The Reference Design Kit (RDK)
RDK is a standardized software stack with both video (RDK-V) and broadband (RDK-B) iterations. Its architecture allows device software to be controlled by the operator, increasing the speed with which new features and technologies are developed and adopted. RDK firmware can also be deployed to devices that are already installed in the customer’s home or business.
By taking control of the code, RDK presents a unique opportunity for service providers on several fronts. Operators can better manage customer premises equipment (CPE) to deliver a consistent experience across the various hardware vendors. RDK increases the velocity of new feature releases and bug fixes, from weeks and months to hours and days. With greater control of the device software, comes the ability to access metrics and device status data, such as crash and usage logs on a per firmware release basis.
Since operators control the code, they can extract visibility and instrumentation based on the exact things in which they are interested. Out of the box, the code base comes with a large amount of machine data, such as errors, reboot, crash, CPU utilization and system memory events.
The value of the data from RDK is greatly enhanced by integrating additional data sources. With its open architecture, service providers can easily capture native RDK data and aggregate it with other external data sources, to gain a deeper
understanding of how the end-user experience is influenced by its firmware releases.
Accenture has developed an advanced analytics framework for RDK, leveraging leading data ingestion, analytical and visualization platforms, combined with analytic models derived from our many engagements in CPE development, and field installation and repair.
This framework is designed to enhance native RDK data, to address commonly occurring issues in the product management lifecycle. Enabling faster diagnosis of root cause service issues, data-driven prioritization of high cost errors, and decrease in firmware related customer service calls.
In this primer, we’ll cover three use cases based on our experience of working with the RDK code base.
1. Correlating device errors with trouble tickets to support prioritization of bug fixes to eliminate thousands of tickets.
2. Driving down trouble tickets by pre-emptively applying engineering solutions before they become an issue in the field.
3. Supporting the comparative analysis of the performance by device and manufacturer based on the number of errors that have occurred.
These advantages built on the foundation of RDK data, are particularly beneficial in today’s competitive market, where agility and efficiency are rewarded.
Page 2
What is RDK?
Conceptually, RDK is a standardized software stack with both video (RDK-V) and broadband (RDK-B) iterations. This type of architecture allows the device software to be controlled by the operator, while increasing the speed with which new features and technologies are developed and adopted. RDK firmware can also be deployed to devices that are already installed in the customer’s home or business.
From a code base standpoint, RDK management is handled by a third party who ingests, tests, and monitors the continuous cycle of code development. Using an open-source approach, both RDK-V and RDK-B code are made available to users through the Apache 2.0 license at no cost. Companies that are members of the RDK community or executed CLA can contribute software changes and enhancements to either of these RDK stacks. RDK code management also offers the operator the opportunity to build out private functions that have historically been available to only the specific communications provider.
This code management structure is a key element of the open-source process. It furnishes communications providers with complete perspective on all the RDK components, as well as access to test and check-in their code. It also provides operators with the ability to take advantage of continuous code iterative capabilities from the open source community.
From a development, design, and release standpoint, RDK takes all the necessary software modules and places them into a pre-integrated kit. Operators can divide the kit to a system on a chip (SoC) manufacturer to integrate, without the need for additional hardware integration for development. By moving the development forward, the kit can cut in half the development time required for new product launches. Some have even compared RDK to the rapid momentum and broad exposure previously generated by the mobile operating software from Android.
Page 3
The Reference Design Kit for Video (RDK-V)
The RDK-V software stack gives communication providers a common framework for developing STB software. It incorporates functions such as tuning, IP video, and media streaming/DLNA, but still allows for user interface (UI) control and development by the operator. The momentum around RDK-V continues to grow, and support for the stack is currently offered by over 250 companies, including SoC vendors, software developers, system integrators and network operators.
As displayed in Figure 1, the multi-channel video programming distributor (MVPD) platform components include modules such as user navigation and third party apps that sit on top of the RDK stack. The RDK stack, which is built on top of an industry standard Linux 2.6 kernel. A central portion of the RDK stack is the RDK media framework (RMF) which is a robust, full-featured framework for the development and delivery of media services within the home networking environment. RMF provides the developer with an easy-to-use, powerful set of objects that can be combined to stream media and play back within the home.
It is important to note that an operator may not simply download the RDK stack and implement it as a turnkey solution. Although implementation for the generic RDK components is included, some of the components within RDK are only frameworks for implementing features, and the actual implementation, which is often customized for an operator, is not included. Every operator needs to integrate not only the MVPD components, but also their own security, back office systems, and unique business rules.
Page 4
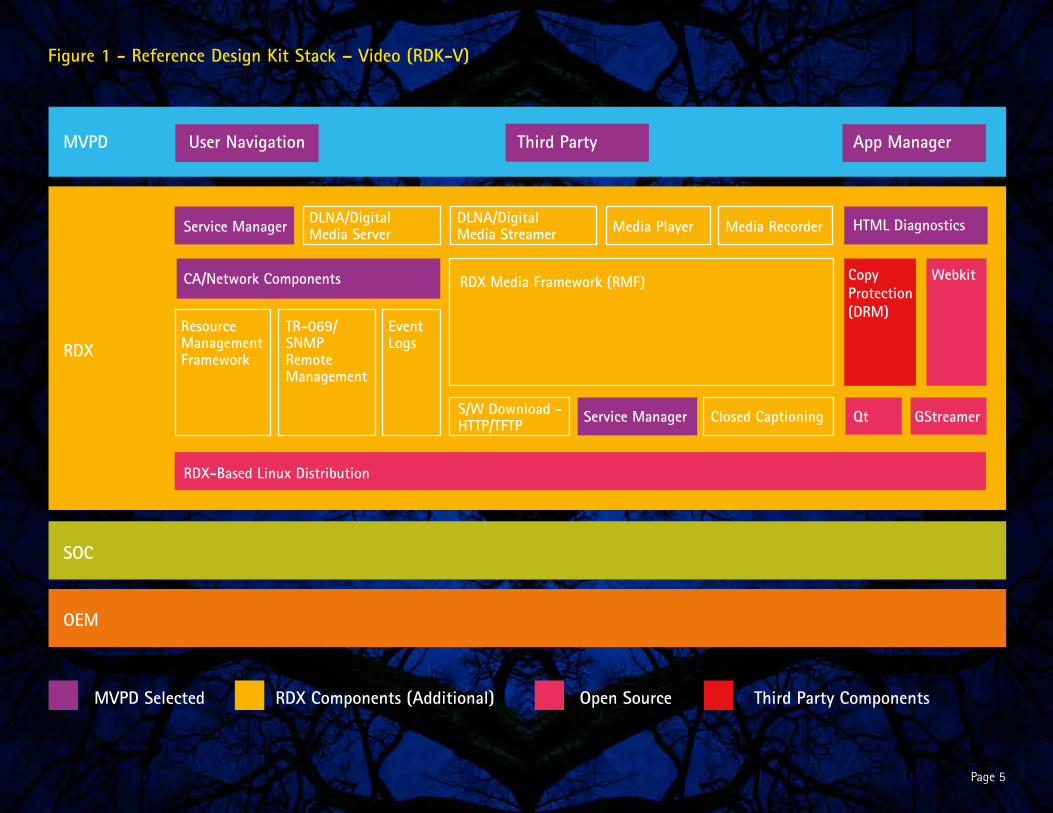
Figure 1 - Reference Design Kit Stack – Video (RDK-V)
MVPD
RDX
OEM
SOC
MVPD Selected Third Party ComponentsOpen SourceRDX Components (Additional)
User Navigation Third Party App Manager
Service Manager DLNA/Digital Media Server
DLNA/Digital Media Streamer Media Player Media Recorder
CA/Network Components
Service ManagerS/W Download - HTTP/TFTP
ResourceManagementFramework
TR-069/SNMPRemoteManagement
Event Logs
GStreamerQtClosed Captioning
RDX Media Framework (RMF) CopyProtection(DRM)
Webkit
RDX-Based Linux Distribution
HTML Diagnostics
Page 5
The Reference Design Kit for Broadband (RDK-B)
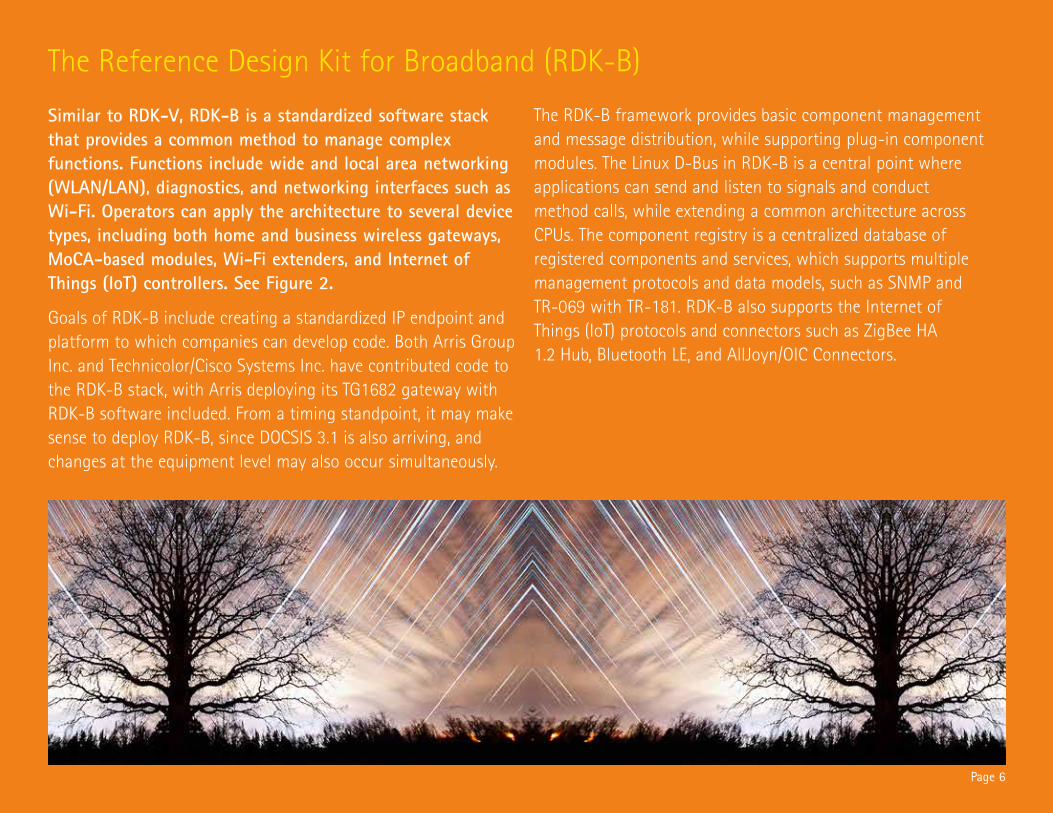
Similar to RDK-V, RDK-B is a standardized software stack that provides a common method to manage complex functions. Functions include wide and local area networking (WLAN/LAN), diagnostics, and networking interfaces such as Wi-Fi. Operators can apply the architecture to several device types, including both home and business wireless gateways, MoCA-based modules, Wi-Fi extenders, and Internet of Things (IoT) controllers. See Figure 2.
Goals of RDK-B include creating a standardized IP endpoint and platform to which companies can develop code. Both Arris Group Inc. and Technicolor/Cisco Systems Inc. have contributed code to the RDK-B stack, with Arris deploying its TG1682 gateway with RDK-B software included. From a timing standpoint, it may make sense to deploy RDK-B, since DOCSIS 3.1 is also arriving, and changes at the equipment level may also occur simultaneously.
The RDK-B framework provides basic component management and message distribution, while supporting plug-in component modules. The Linux D-Bus in RDK-B is a central point where applications can send and listen to signals and conduct method calls, while extending a common architecture across CPUs. The component registry is a centralized database of registered components and services, which supports multiple management protocols and data models, such as SNMP and TR-069 with TR-181. RDK-B also supports the Internet of Things (IoT) protocols and connectors such as ZigBee HA 1.2 Hub, Bluetooth LE, and AllJoyn/OIC Connectors.
Page 6
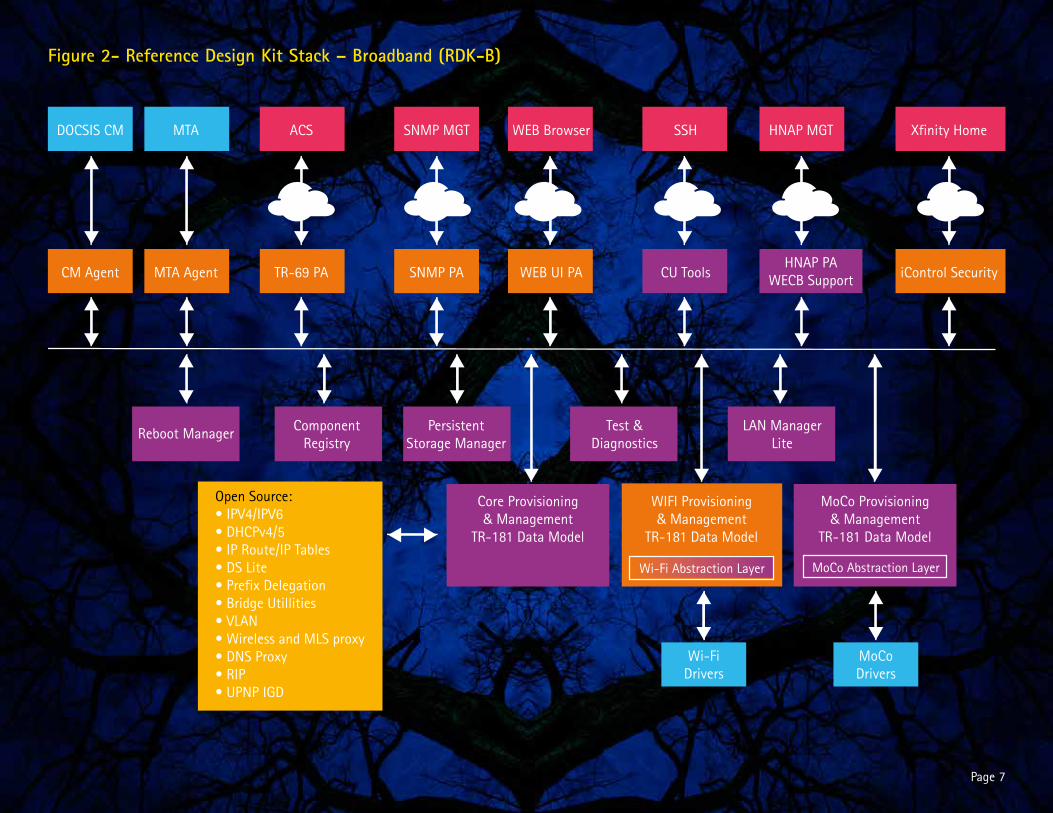
Figure 2- Reference Design Kit Stack – Broadband (RDK-B)
Page 7
DOCSIS CM ACS SNMP MGT WEB Browser HNAP MGT Xfinity HomeSSHMTA
CM Agent TR-69 PA
Reboot Manager
SNMP PA WEB UI PAHNAP PA
WECB Support
ComponentRegistry
PersistentStorage Manager
Test &Diagnostics
Wi-FiDrivers
MoCoDrivers
LAN ManagerLite
Core Provisioning& Management
TR-181 Data Model
Open Source:• IPV4/IPV6• DHCPv4/5• IP Route/IP Tables• DS Lite• Prefix Delegation• Bridge Utillities• VLAN• Wireless and MLS proxy• DNS Proxy• RIP• UPNP IGD
WIFI Provisioning& Management
TR-181 Data Model
MoCo Provisioning& Management
TR-181 Data Model
MoCo Abstraction LayerWi-Fi Abstraction Layer
iControl SecurityCU ToolsMTA Agent
Using Analytics to Gain Insights Around Specific RDK Implementations
user insights such as meaningful historical patterns and potential future trends. Accenture has developed and applied an analytics model to help clients move quickly into analytics via a phased maturity approach.
Now that a basic understanding of RDK has been established, the user can begin to take advantage of the available RDK data. With its open architecture, the user can quickly capture native RDK data and aggregate with other external data sources. Native RDK data examples include statistics such as reboot events, system errors, and CPU utilization. A methodical approach leveraging an appropriate analytics framework and appropriate data sources can help maximize
Page 8
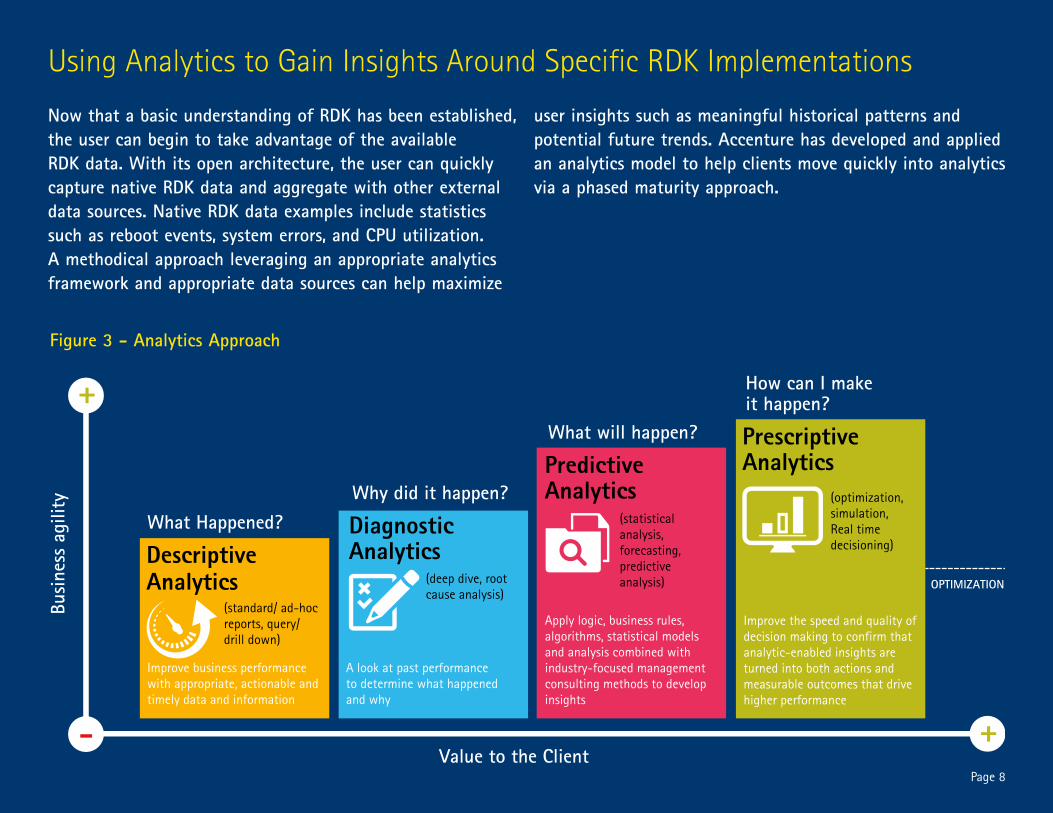
Figure 3 - Analytics Approach
What Happened?
What will happen?
How can I make it happen?
Why did it happen?
DescriptiveAnalytics
PredictiveAnalytics
PrescriptiveAnalytics
DiagnosticAnalytics
Value to the Client
OPTIMIZATION
Busi
ness
agi
lity
+
+
-
Improve business performance with appropriate, actionable and timely data and information
(standard/ ad-hoc reports, query/ drill down)
(deep dive, root cause analysis)
(statistical analysis, forecasting, predictive analysis)
(optimization, simulation, Real time decisioning)
A look at past performance to determine what happened and why
Apply logic, business rules, algorithms, statistical models and analysis combined with industry-focused management consulting methods to develop insights
Improve the speed and quality of decision making to confirm that analytic-enabled insights are turned into both actions and measurable outcomes that drive higher performance
Step #1: Descriptive Analytics – Historical reporting and trending using existing data sources. This first step is where the user explores historical reporting and trending of readily available data – answering the question “What has happened?” Traditional software such as Microsoft Excel and newer BI tools such as Tableau can assist the user with this first phase. The more insightful shift in analytics is recognized as the user moves into the advanced analytics realm of diagnostic analytics. Step #2: Diagnostic Analytics – Leveraging findings from descriptive analytics and applying deeper analysis toolsets. This second step includes deeper root cause analysis – going beyond single variate correlation into multi-variate analysis to determine and recognize that many issues are not driven by a single event or error, but multiple contributing factors. This second step may also include enriching existing data with additional obtainable data sources and can provide an improved perspective on the core data sources by enabling operators to observe deeper comparisons and correlations. Step #3: Predictive Analytics – Leveraging data and findings from the first two steps and applying forecasting and modeling to project trends and potential behaviors. As the user enters predictive analytics – Step 3 – the user leverages historical data and transforms it into a look into the potential future with forecasting. These
steps includes building analytic models at the lowest levels of the business and looks for predictable behaviors, propensities, and business rules that can be used to predict the likelihood of certain behaviors and actions, helping to answer the question “What will happen?” Step #4: Prescriptive Analytics – Parlaying the first three steps to help find the next best course of action. Prescriptive analytics assists in directing the user towards what actions should be taken next by leveraging the findings from the first three steps and applying additional logic and rules based on both user and machine learning. It improves the speed and quality of decision making to confirm that analytic-enabled insights are turned into both actions and measurable outcomes that drive higher performance. Techniques such as Monte Carlo simulation and non-linear optimization can be used to help model the probability of different outcomes while including factors such as risk and uncertainty.
By intertwining data available within RDK, data aggregation, and advanced analytics, the user can quickly move beyond basic reporting and trending. Applying concepts of data science will drive the user past the zone of descriptive analytics towards both diagnostic and predictive analytics. The user can apply logic, business rules, algorithms, statistical models, and analysis alongside industry-focused management consulting methods in order to develop specific insights.
Page 9
Using Analytics to Gain Insights Around Specific RDK Implementations Continued
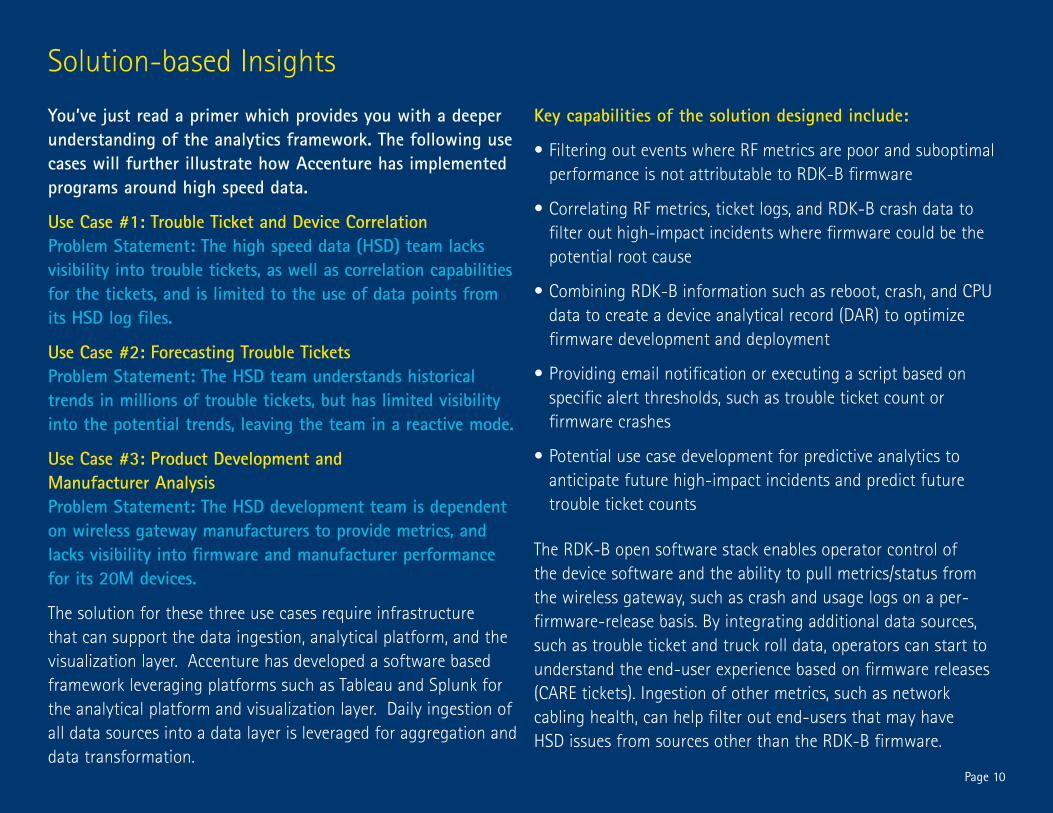
Key capabilities of the solution designed include:
• Filtering out events where RF metrics are poor and suboptimal performance is not attributable to RDK-B firmware
• Correlating RF metrics, ticket logs, and RDK-B crash data to filter out high-impact incidents where firmware could be the potential root cause
• Combining RDK-B information such as reboot, crash, and CPU data to create a device analytical record (DAR) to optimize firmware development and deployment
• Providing email notification or executing a script based on specific alert thresholds, such as trouble ticket count or firmware crashes
• Potential use case development for predictive analytics to anticipate future high-impact incidents and predict future trouble ticket counts
The RDK-B open software stack enables operator control of the device software and the ability to pull metrics/status from the wireless gateway, such as crash and usage logs on a per-firmware-release basis. By integrating additional data sources, such as trouble ticket and truck roll data, operators can start to understand the end-user experience based on firmware releases (CARE tickets). Ingestion of other metrics, such as network cabling health, can help filter out end-users that may have HSD issues from sources other than the RDK-B firmware.
Page 10
You’ve just read a primer which provides you with a deeper understanding of the analytics framework. The following use cases will further illustrate how Accenture has implemented programs around high speed data.
Use Case #1: Trouble Ticket and Device Correlation Problem Statement: The high speed data (HSD) team lacks visibility into trouble tickets, as well as correlation capabilities for the tickets, and is limited to the use of data points from its HSD log files.
Use Case #2: Forecasting Trouble Tickets Problem Statement: The HSD team understands historical trends in millions of trouble tickets, but has limited visibility into the potential trends, leaving the team in a reactive mode.
Use Case #3: Product Development and Manufacturer Analysis Problem Statement: The HSD development team is dependent on wireless gateway manufacturers to provide metrics, and lacks visibility into firmware and manufacturer performance for its 20M devices.
The solution for these three use cases require infrastructure that can support the data ingestion, analytical platform, and the visualization layer. Accenture has developed a software based framework leveraging platforms such as Tableau and Splunk for the analytical platform and visualization layer. Daily ingestion of all data sources into a data layer is leveraged for aggregation and data transformation.
Solution-based Insights
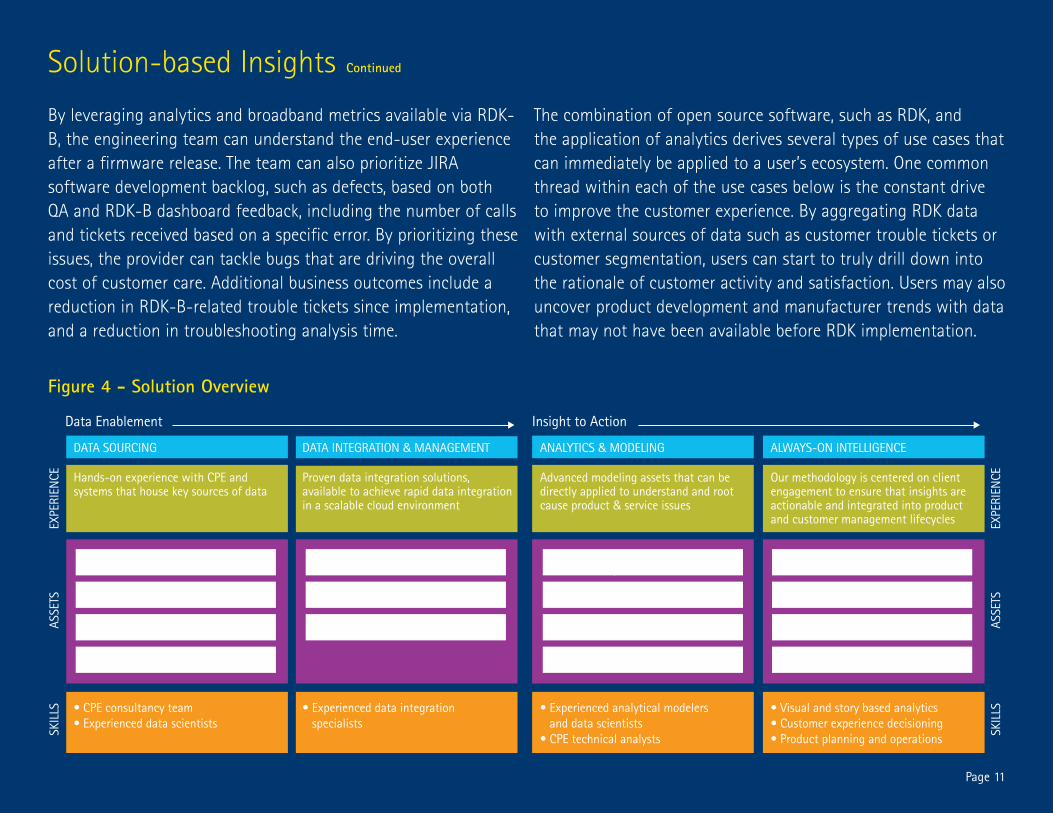
The combination of open source software, such as RDK, and the application of analytics derives several types of use cases that can immediately be applied to a user’s ecosystem. One common thread within each of the use cases below is the constant drive to improve the customer experience. By aggregating RDK data with external sources of data such as customer trouble tickets or customer segmentation, users can start to truly drill down into the rationale of customer activity and satisfaction. Users may also uncover product development and manufacturer trends with data that may not have been available before RDK implementation.
Page 11
By leveraging analytics and broadband metrics available via RDK-B, the engineering team can understand the end-user experience after a firmware release. The team can also prioritize JIRA software development backlog, such as defects, based on both QA and RDK-B dashboard feedback, including the number of calls and tickets received based on a specific error. By prioritizing these issues, the provider can tackle bugs that are driving the overall cost of customer care. Additional business outcomes include a reduction in RDK-B-related trouble tickets since implementation, and a reduction in troubleshooting analysis time.
Solution-based Insights Continued
Devices & In-Home Network
Field Force & Call Center Agents
Network & Infrastructure
Accenture Insights Platform
Data Pipeline process
Device & customer analytic record
Product Development
Intelligent reporting accelerator
Service design
Service enablement
Pro-active alerts & monitoring
• Visual and story based analytics• Customer experience decisioning • Product planning and operations
• Experienced analytical modelers and data scientists
• CPE technical analysts
• Experienced data integration specialists
• CPE consultancy team• Experienced data scientists
Our methodology is centered on client engagement to ensure that insights are actionable and integrated into product and customer management lifecycles
Advanced modeling assets that can be directly applied to understand and root cause product & service issues
Proven data integration solutions, available to achieve rapid data integration in a scalable cloud environment
Hands-on experience with CPE and systems that house key sources of data
ALWAYS-ON INTELLIGENCEANALYTICS & MODELINGDATA INTEGRATION & MANAGEMENTDATA SOURCING
Hypothesis testing and simulation capabilities
Exhaustive list of root causes
Device failure prediction
Time series forecasting accelerator
EXPE
RIEN
CEAS
SETS
SKIL
LS
EXPE
RIEN
CEAS
SETS
SKIL
LS
Data Enablement Insight to Action
Figure 4 - Solution Overview
Problem Statement: The high speed data (HSD) team lacks visibility into trouble tickets, as well as correlation capabilities for the tickets, and is limited to the use of data points from its HSD log files.
Outcomes: Applying both descriptive and diagnostic analytics, the HSD team is able to eliminate thousands of trouble tickets by finding correlations between device errors and associated tickets.
The solution: aggregated trouble-ticket data along with RDK-error data, to develop correlation dashboards that enable the team to focus on key ticket drivers. Users of the solution can also drill down on a specific problem category and solution for enhanced deep-dive analysis.
RDK presents a unique opportunity for communications providers on several fronts. Out of the box, the code base comes with a large amount of machine data, such as errors, reboot, crash, CPU and system memory. Also, since operators control the code, they can extract visibility and instrumentation based on the exact things in which they are interested. While requesting a new metric or field from an OEM can take six to 12 months, RDK enables firmware releases with the necessary visibility and instrumented code in mere days or weeks. In addition, RDK can go beyond a standard TR-069 connection to provide data via new connections such as sockets, thereby allowing for orders of magnitude of improvement in the quantity and/or frequency of data reception.
Page 12
Use Case #1: Trouble Ticket and Device Correlation
Operators can also address engineering and business challenges by employing reporting, visualization and analytics for HSD offerings. Examples of end goals might be driving down the number of trouble tickets received from RDK-B wireless gateway users, or providing an optimum HSD user experience.
Often, it is not simply one variable that pushes a customer to contact a support team. Multi-variate analysis is frequently critical to providing deeper insight into the root causes of an issue. Accessible variables should include not only RDK log data, such as crashes, reboots, and errors, but also other data, such as network status, customer interactions with the device, ticket history and user type.
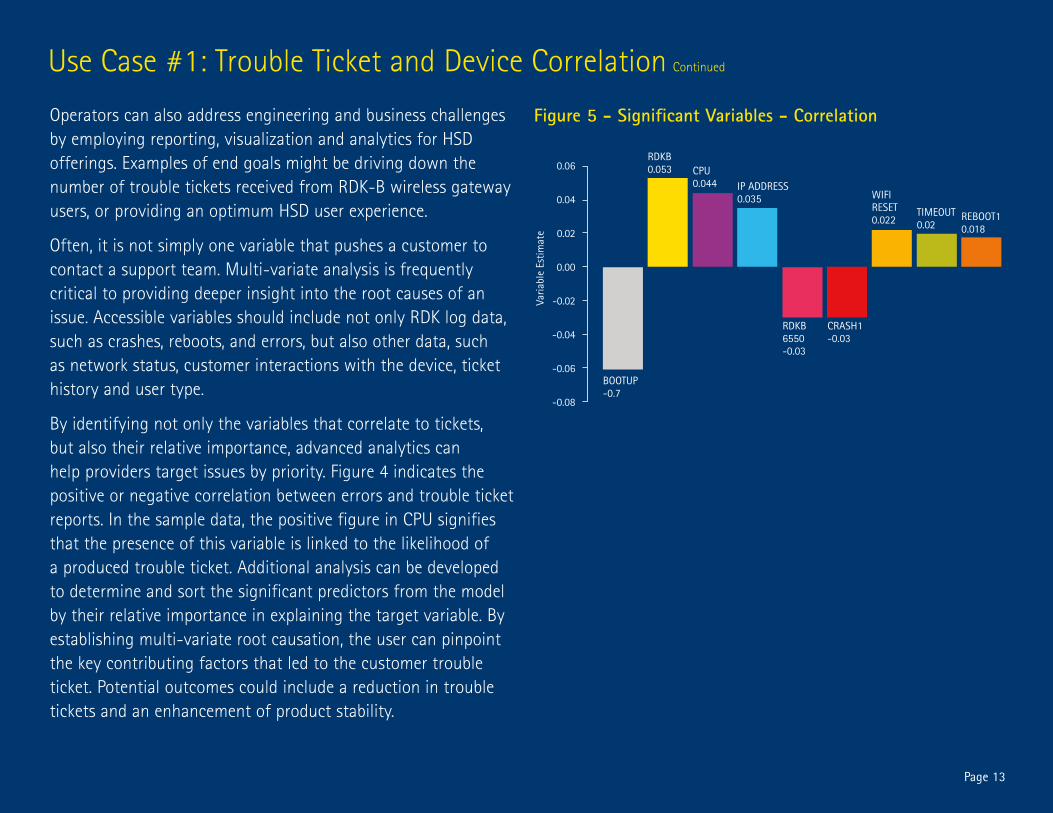
By identifying not only the variables that correlate to tickets, but also their relative importance, advanced analytics can help providers target issues by priority. Figure 4 indicates the positive or negative correlation between errors and trouble ticket reports. In the sample data, the positive figure in CPU signifies that the presence of this variable is linked to the likelihood of a produced trouble ticket. Additional analysis can be developed to determine and sort the significant predictors from the model by their relative importance in explaining the target variable. By establishing multi-variate root causation, the user can pinpoint the key contributing factors that led to the customer trouble ticket. Potential outcomes could include a reduction in trouble tickets and an enhancement of product stability.
Page 13
Varia
ble
Estim
ate
0.06
0.04
0.02
0.00
-0.02
-0.04
-0.06
-0.08
RDKB0.053 CPU
0.044
RDKB6550-0.03
CRASH1-0.03
WIFIRESET0.022 REBOOT1
0.018
TIMEOUT0.02
IP ADDRESS0.035
BOOTUP-0.7
Figure 5 - Significant Variables - Correlation
Use Case #1: Trouble Ticket and Device Correlation Continued
Page 14
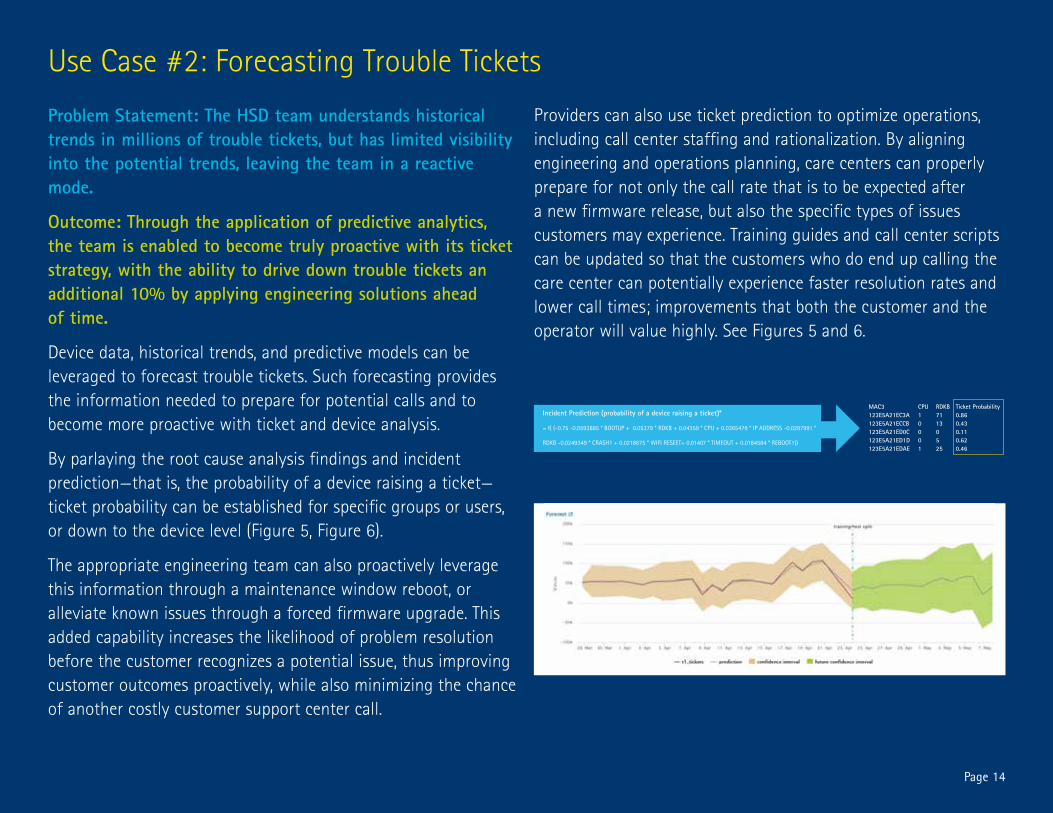
Problem Statement: The HSD team understands historical trends in millions of trouble tickets, but has limited visibility into the potential trends, leaving the team in a reactive mode.
Outcome: Through the application of predictive analytics, the team is enabled to become truly proactive with its ticket strategy, with the ability to drive down trouble tickets an additional 10% by applying engineering solutions ahead of time.
Device data, historical trends, and predictive models can be leveraged to forecast trouble tickets. Such forecasting provides the information needed to prepare for potential calls and to become more proactive with ticket and device analysis.
By parlaying the root cause analysis findings and incident prediction—that is, the probability of a device raising a ticket—ticket probability can be established for specific groups or users, or down to the device level (Figure 5, Figure 6).
The appropriate engineering team can also proactively leverage this information through a maintenance window reboot, or alleviate known issues through a forced firmware upgrade. This added capability increases the likelihood of problem resolution before the customer recognizes a potential issue, thus improving customer outcomes proactively, while also minimizing the chance of another costly customer support center call.
Providers can also use ticket prediction to optimize operations, including call center staffing and rationalization. By aligning engineering and operations planning, care centers can properly prepare for not only the call rate that is to be expected after a new firmware release, but also the specific types of issues customers may experience. Training guides and call center scripts can be updated so that the customers who do end up calling the care center can potentially experience faster resolution rates and lower call times; improvements that both the customer and the operator will value highly. See Figures 5 and 6.
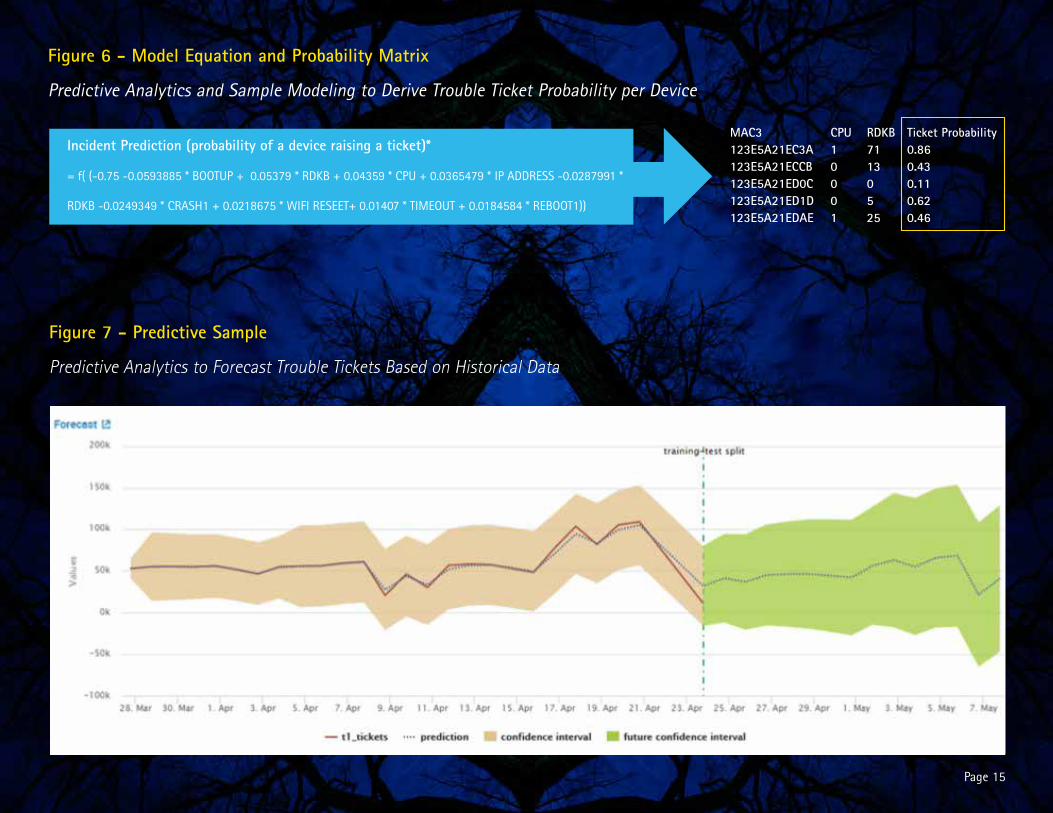
Incident Prediction (probability of a device raising a ticket)*
= f( (-0.75 -0.0593885 * BOOTUP + 0.05379 * RDKB + 0.04359 * CPU + 0.0365479 * IP ADDRESS -0.0287991 *
RDKB -0.0249349 * CRASH1 + 0.0218675 * WIFI RESEET+ 0.01407 * TIMEOUT + 0.0184584 * REBOOT1))
MAC3 CPU RDKB Ticket Probability123E5A21EC3A 1 71 0.86123E5A21ECCB 0 13 0.43123E5A21ED0C 0 0 0.11123E5A21ED1D 0 5 0.62123E5A21EDAE 1 25 0.46
Use Case #2: Forecasting Trouble Tickets
Page 15
Figure 7 - Predictive Sample
Predictive Analytics to Forecast Trouble Tickets Based on Historical Data
Incident Prediction (probability of a device raising a ticket)*
= f( (-0.75 -0.0593885 * BOOTUP + 0.05379 * RDKB + 0.04359 * CPU + 0.0365479 * IP ADDRESS -0.0287991 *
RDKB -0.0249349 * CRASH1 + 0.0218675 * WIFI RESEET+ 0.01407 * TIMEOUT + 0.0184584 * REBOOT1))
MAC3 CPU RDKB Ticket Probability123E5A21EC3A 1 71 0.86123E5A21ECCB 0 13 0.43123E5A21ED0C 0 0 0.11123E5A21ED1D 0 5 0.62123E5A21EDAE 1 25 0.46
Figure 6 - Model Equation and Probability Matrix
Predictive Analytics and Sample Modeling to Derive Trouble Ticket Probability per Device
Page 16
Problem Statement: The HSD development team is dependent on wireless gateway manufacturers to provide metrics, and lacks visibility into firmware and manufacturer performance for its 20M devices.
Outcome: By implementing RDK-B on two different wireless gateway manufacturers that represent 25% of its total ecosystem, then applying descriptive analytics, the team can now access and apply analytics to firmware and manufacturer statistics with expectations of improving reporting and engineering efficiency by up to 30%.
In the case of cable providers, it is not uncommon for a provider to have more than one manufacturer providing wireless gateways or set-top boxes. An open-source software structure, combined with analytics, can guide engineering teams to attain a higher level of reporting efficiency. By ingesting and tracking key metrics, the provider can achieve specific outcomes that support engineering and product development, including:
1. Firmware Release Analysis: Providing visualization of firmware performance with metrics such as reboot and crash statistics, and sending alerts when metrics cross a specific threshold.
2. Manufacturer Analysis: Comparative analysis of the performance of each provider or manufacturer, based on the numbers of errors that have occurred, and/or other performance metrics such as crashes, can be quickly presented to the provider to enhance existing offerings and products.
3. Understanding User Behavior: Usage of specific aspects of the device, including how often an application is triggered, how much time is spent on the device, and the types of errors and reboots that occur on the device, are all examples of relevant data that can be better examined and measured.
4. User Satisfaction: Tracking the number of tickets reported, the number of truck rolls pertaining to specific users or groups of users, and the number of tickets reported per firmware, can provide insight into overall customer satisfaction.
5. Customer Segmentation: Leveraging the data to understand where your customers are using the service, and any associated demographic information, may deliver not only a better product, but also sharper customer service.
Use Case #3: Product Development and Manufacturer Analysis
Conclusion: Enabling Outcomes through Analytics
Accenture can provide the technical capabilities, advanced tools and business knowledge to help quickly derive insights from devices and drive business outcomes through analytics. Both technology and business groups can benefit by applying the general concepts and frameworks of open source software, data aggregation, and advanced analytics to improve the customer experience and drive product decisions.
Users should consider descriptive analytics as simply the starting point in the analytics journey. When traditional business intelligence is combined with advanced analytics, operators can further improve the customer experience at the level of both the device and its support, while optimizing operations expenditures and improving product development. The open-source software will afford accessibility to the provider’s devices, will provide the opportunity to apply analytics to maximize insights which will lead to targeted business outcomes.
Page 17

About the Authors About Accenture
Accenture is a leading global professional services company, providing a broad range of services and solutions in strategy, consulting, digital, technology and operations. Combining unmatched experience and specialized skills across more than 40 industries and all business functions—underpinned by the world’s largest delivery network—Accenture works at the intersection of business and technology to help clients improve their performance and create sustainable value for their stakeholders. With more than 384,000 people serving clients in more than 120 countries, Accenture drives innovation to improve the way the world works and lives. Visit us at www.accenture.com.
Ryan Ray is a Technology Consulting Senior Manager within Accenture’s Network practice. He can be reached at [email protected].
Ragnar-Miguel Myhrer is a Managing Director with Accenture, where he leads the North America Network Practice. He can be reached at [email protected].
Philip Brennan is a Managing Director with Accenture, where he leads sales for the Digital Video practice. He can be reached at [email protected].
Copyright ©2016 Accenture. All rights reserved.
Accenture, its logo, and High Performance Delivered are trademarks of Accenture.
This document makes descriptive reference to trademarks that may be owned by others. The use of such trademarks herein is not an assertion of ownership of such trademarks by Accenture and is not intended to represent or imply the existence of an association between Accenture and the lawful owners of such trademarks.