Embed Size (px)
Citation preview

Catherine L. Mann OECD Chief Economist
www.oecd.org/economy/economicoutlook.htm
ECOSCOPE blog: oecdecoscope.wordpress.com/
Banque de France
Paris – 16 January 2017
How to deal with potential
secular stagnation
• Low-Growth trap: GDP and productivity
• Diffusion gap: productivity and wages
• Macro and Micro policies to improve
2
Themes
3
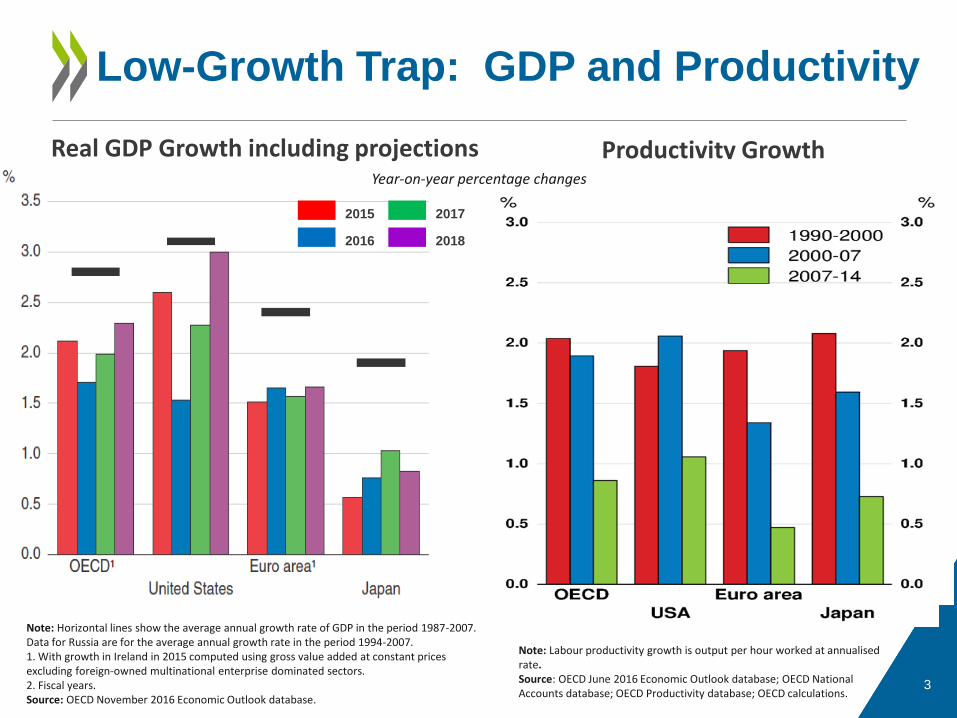
Productivity Growth
Low-Growth Trap: GDP and Productivity
To hide text
To hide text
Note: Horizontal lines show the average annual growth rate of GDP in the period 1987-2007. Data for Russia are for the average annual growth rate in the period 1994-2007. 1. With growth in Ireland in 2015 computed using gross value added at constant prices excluding foreign-owned multinational enterprise dominated sectors. 2. Fiscal years. Source: OECD November 2016 Economic Outlook database.
Note: Labour productivity growth is output per hour worked at annualised rate. Source: OECD June 2016 Economic Outlook database; OECD National Accounts database; OECD Productivity database; OECD calculations.
Year-on-year percentage changes Tt
Tt 2015
2016
2017
2018
Real GDP Growth including projections
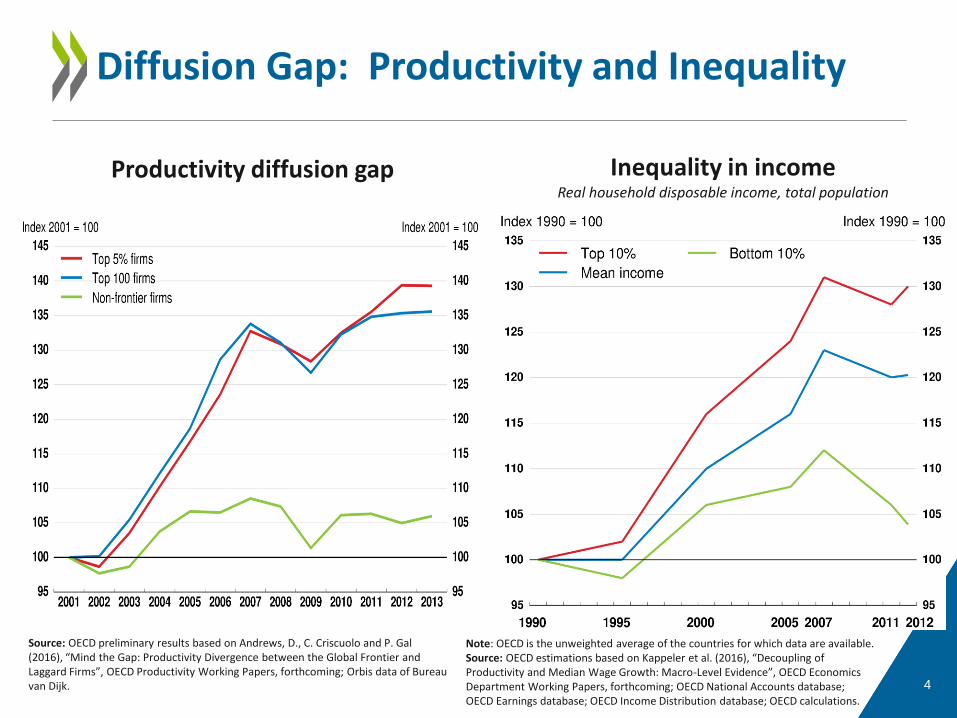
Diffusion Gap: Productivity and Inequality
4
Inequality in income Real household disposable income, total population
Note: OECD is the unweighted average of the countries for which data are available. Source: OECD estimations based on Kappeler et al. (2016), “Decoupling of Productivity and Median Wage Growth: Macro-Level Evidence”, OECD Economics Department Working Papers, forthcoming; OECD National Accounts database; OECD Earnings database; OECD Income Distribution database; OECD calculations.
Productivity diffusion gap
Source: OECD preliminary results based on Andrews, D., C. Criscuolo and P. Gal (2016), “Mind the Gap: Productivity Divergence between the Global Frontier and Laggard Firms”, OECD Productivity Working Papers, forthcoming; Orbis data of Bureau van Dijk.

Monetary Policy: Micro Role
5
The X axis plots the effect on fragility; Fragility is defined as higher likelihood of financial crises (polices with red outline) or a higher GDP (negative) tail risk.
Three types of financial crises are considered: Currency, banking and twin crises. Tail risk is defined as the effect on the bottom 10% of the distribution for
quarterly GDP growth. For each policy, the Y axis plots the average (overall) growth effect.
Source: Authors’ calculation based on Caldera Sánchez and Gori and by Caldera Sánchez and Röhn.
Macro-prudential
policies can reduce
fragility, but may also
lower growth
Growth benefits from
financial market
liberalisation offset
by higher crisis risk
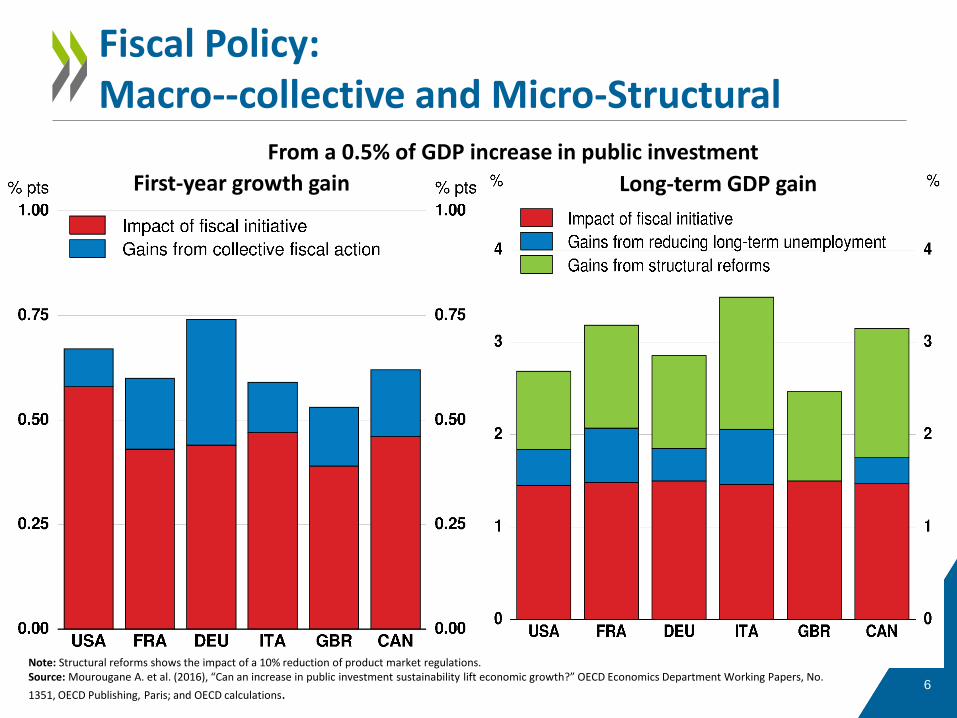
Fiscal Policy: Macro--collective and Micro-Structural
6
Long-term GDP gain
From a 0.5% of GDP increase in public investment
First-year growth gain
Note: Structural reforms shows the impact of a 10% reduction of product market regulations. Source: Mourougane A. et al. (2016), “Can an increase in public investment sustainability lift economic growth?” OECD Economics Department Working Papers, No.
1351, OECD Publishing, Paris; and OECD calculations.

To hide text To hide text
7
Fiscal-Micro and Structural Complementarity

Contractionary Mildly contractionary Broadly neutral Mildly expansionary Expansionary
Contractionary
Mildly contractionaryARG, BRA, COL, CRI,
GRC, SVKBEL
AUS, GBR, IDN,
KOR
Broadly neutral
CHL, CZE, DNK, ESP,
IND, IRL, ISR, JPN,
LTU, MEX, NZL,
PRT,TUR, SWE, ZAF
FRA, RUS, AUT,
FIN, NLDCHE
Mildly expansionary HUN SVNCAN, ITA, NOR,
POL
DEU, EST,
LVA
Expansionary ISL CHN USA, LUX
OECD recommends less expansionary policy than projected
Recommended fiscal stance for 2017
Projected
fiscal stance
for 2017
OECD recommends more expansionary policy than projected
Fiscal stance indicator … Many countries look OK, but Europe could do more
8 Source: OECD November 2016 Economic Outlook database; and OECD November 2016 Economic Outlook Special Chapter, “Using fiscal levers to escape the low growth trap”.
9
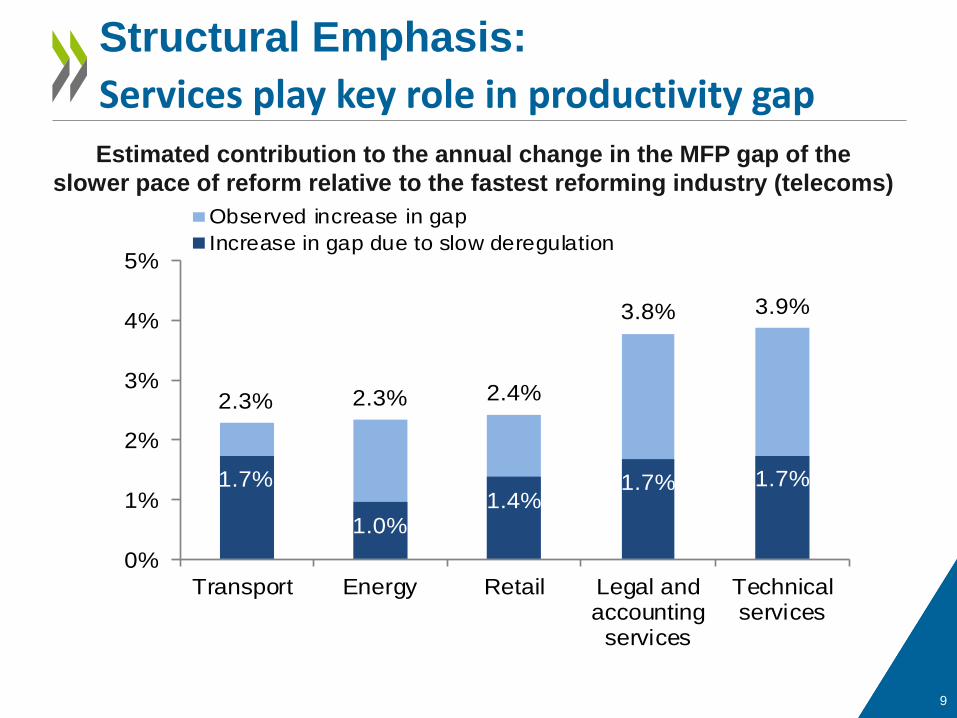
2.3% 2.3% 2.4%
3.8% 3.9%
1.7%
1.0%1.4%
1.7% 1.7%
0%
1%
2%
3%
4%
5%
Transport Energy Retail Legal andaccounting
services
Technicalservices
Observed increase in gap
Increase in gap due to slow deregulation
Structural Emphasis:
Services play key role in productivity gap
Estimated contribution to the annual change in the MFP gap of the
slower pace of reform relative to the fastest reforming industry (telecoms)

10
Resources: blogs, PPT, video, research
Research teams: Boris Cournède, Alain de Serres, Guiseppe Nicoletti, Peter
Hoeller, Oliver Denk, Aida Caldera Sanchez, Priscilla Fialho, Filippo Gori, Dan
Andrews, Chiara Criscuolo, Valentine Millot, Muge Adalet McGown
Economic Resilience Finance and Inclusive Growth Global Forum on Productivity