Embed Size (px)
Citation preview
Increasing Efficiency in Canada’s Healthcare System:
Robyn Tamblyn, PhD McGill University
The Transformative Potential of e-Technologies
How to Bend the Cost CurveTotal health expenditure as a % of
GDP
Source: CIHI, National Health Expenditure Trends, 2009
Is Canada Getting Value for Money?
Source: Calculated by the Commonwealth Fund based on the Commonwealth Fund 2004 and 2005 International Health Policy Surveys, the 2006 Commonwealth Fund International Survey of Primary Care Physicians, and the Commonwealth Fund Commission on a High Performance Health System National Scorecard. Source: Health Council of Canada, Population Patterns of Chronic Health Conditions in Canada, 2007
Chronic conditions are more common in older people
Includes: arthritis, cancer, COPD, diabetes, heart disease, high blood pressure, and mood disorders
Canada’s aging population
ER Use in Past Two Years
53
64
41 39
26
4540
59
0
20
40
60
80
AUSCAN FRA
GERNETH NZ UK US
1723
9 6 6 8 8
19
0
20
40
60
80
AUSCAN FR
GERNETH NZ UK US
Any ER use Used ER for condition treatable by regular doctor,
if available
Base: Adults with any chronic conditionData collection: Harris Interactive, Inc.Source: 2008 Commonwealth Fund International Health Policy Survey of Sicker Adults.
36
26
42 43
6054
48
26
0
20
40
60
80
AUSCAN FR
GERNETH NZ UK US
Access to Doctor When Sick or Needed Care
18
34
1826
38
14
23
0
20
40
60
80
AUSCAN FR GER
NETH NZ UK US
Same-day appointment 6+ days wait or never ableto get appointment
Base: Adults with any chronic conditionData collection: Harris Interactive, Inc.Source: 2008 Commonwealth Fund International Health Policy Survey of Sicker Adults.

Targeting Transformative Efficiency Gains with New Technologies
1.Patient Empowerment Tools1.1. Patient Empowerment ToolsPatient Empowerment Tools
2.Personalized Decision Support2.2. Personalized Decision SupportPersonalized Decision Support
3.Population Health Surveillance3.3. Population Health SurveillancePopulation Health Surveillance
Patient Empowerment
Increasing efficiency of contact: The “My Health Manager” patient-primary care team e-visit system
Chen et. al Health Affairs , April 2009 Chen et. al Health Affairs , April 2009
Increasing efficiency of contact: The “My Health Manager” patient-physician e-visit system
Self-Management Tools: Personal Health Records and Patient PortalsSupporting Disease Self-Management Systematic Review of Telehealthcare: Reducing the
Risk of Asthma-Related Hospital Admissions Mclean et.al CMAJ, August 9, 2011

Mclean et.al CMAJ, August 9, 2011
Systematic Review of Telehealthcare: Improving HRQL in Asthma Patients
Cost-Minimization Analysis of Tele-Homecare for COPD
Pare et. al, Telemedicine and e-Health, Vol. 12 No. 2, 2006
Ameliorable ADE’s (51)•Failure of physician to respond to medication-related symptoms - 32 (63%)•Failure of patient to inform physician of symptoms – 19 (37%)
Preventable ADE’s (20)•Selection of wrong drug – 9 (45%)•Wrong dosage – 2 (10%)•Wrong frequency of use – 2 (10%)
•Preventable by advanced systems of medication ordering – 7 (35%)
Opportunities to Prevent or Ameliorate Adverse Drug Events
N = 661
Ghandi et al. NEJM, April 2003
IVRS: Monitoring the Early Effects of Medication
IVRSMonitoring
MOXXISystems
Practice Monitoring Tools: Alerting Physicians about New Problems with Medications
Detection of Adverse Drug Events and Prescription Issues Using IVRS
ENROLLED (N = 496)
No problems with medication
263 (53.0%)
Problem with medication
233 (47.0%)
Adverse Drug Event127 (25.6%)
Primary Non-
Compliance91 (18.3%)
Advice Requested45 (9.1%)
Forster et. al CIHR grant #2456 2010

Personalized Decision SupportUsing Individualized Risk Assessment Tools to
Inform and Enhance Treatment Practices
Systematic Review of the Effectiveness of Computerized Decision-Support on Quality of Care and Patient Outcomes
Improvement in Quality of Care Number of Trials
Success Rate
Diagnostic Decision-Making 10 40%
Patient Care Reminder Systems 21 76%
Disease Management Decision-Support 37 62%
Drug Dosing 29 66%
Improvement in Patient Outcomes Number of Trials
Success Rate
All systems 52 13%
Garg et.al. JAMA, March 9, 2005
Incorporating Epidemiological Science into Risk-Benefit Assessment
Designing New Smart Alerts that Provide Person‐Specific Risk Assessment
( )( )nmhazardnmrisk baseline _^11*100_ 100−−=
⎟⎟⎠
⎞⎜⎜⎝
⎛ +++=
lw*0.0023- ci*0.287 gb*0.123 female *0.047 age_65*0.038
_ EXPnmhazard⎟⎟⎟⎟⎟⎟⎟⎟⎟
⎠
⎞
⎜⎜⎜⎜⎜⎜⎜⎜⎜
⎝
⎛
+++
+++++
+++++
=
class_23*0.07 class_18*0.147 class_17*0.047 class_16*0.099
class_15*0.106 class_13*0.008 class_11*0.056 class_9*0.225
class_7*0.088 class_6*0.088 class_5*0.105 class_4*0.253 class_3*0.035 class_2*0.304
*__ EXPnmhazardtotalhazard
Providing Immediate Feedback on the Consequences of a Change in Medication
Reductions in Fall-Related Injury Risk With Personalized Alerts
0
0.05
0.1
0.15
0.2
Intervention Control
Mean Reduction in Modifiable Risk After 6 Months
Tamblyn et. al, JAMIA (under review)
Starting Risk
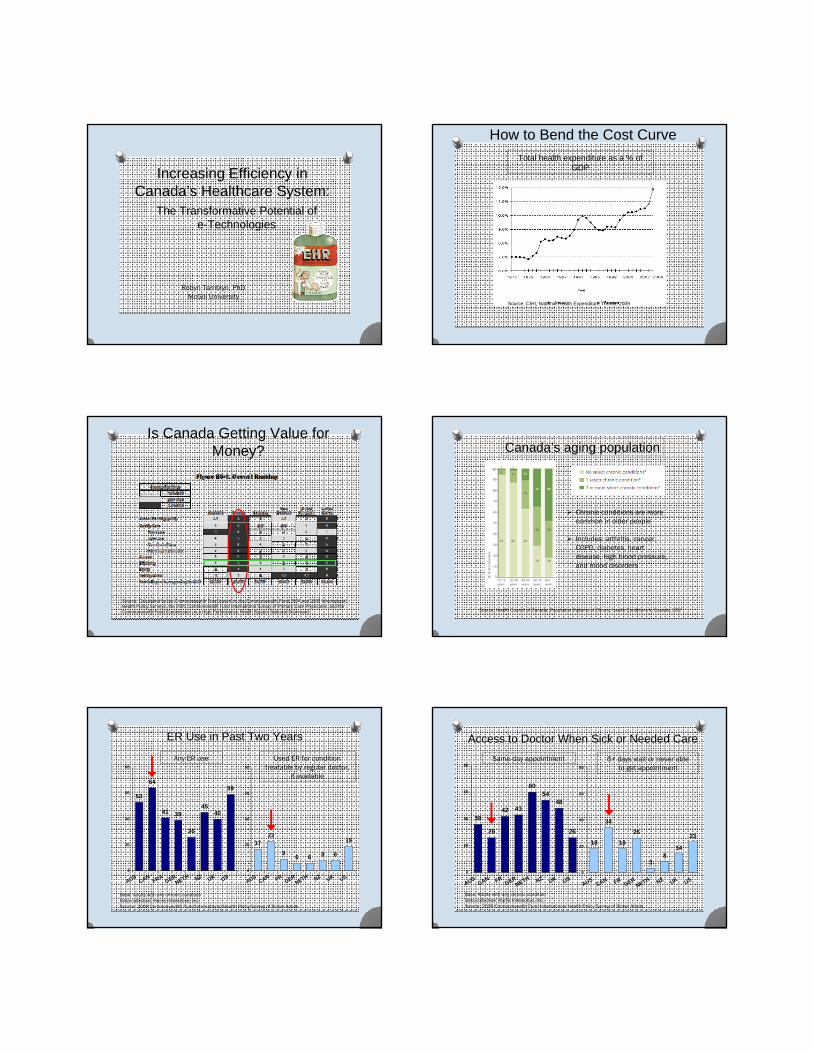
Daily Surveillance of ER Visits and Rescue Medication to Assess Asthma Control
Alert!Analysis of Daily Downloads of Information from the Provincial
Insurance Billing Data
Computerized Decision Support for Evidence-Based Asthma Management
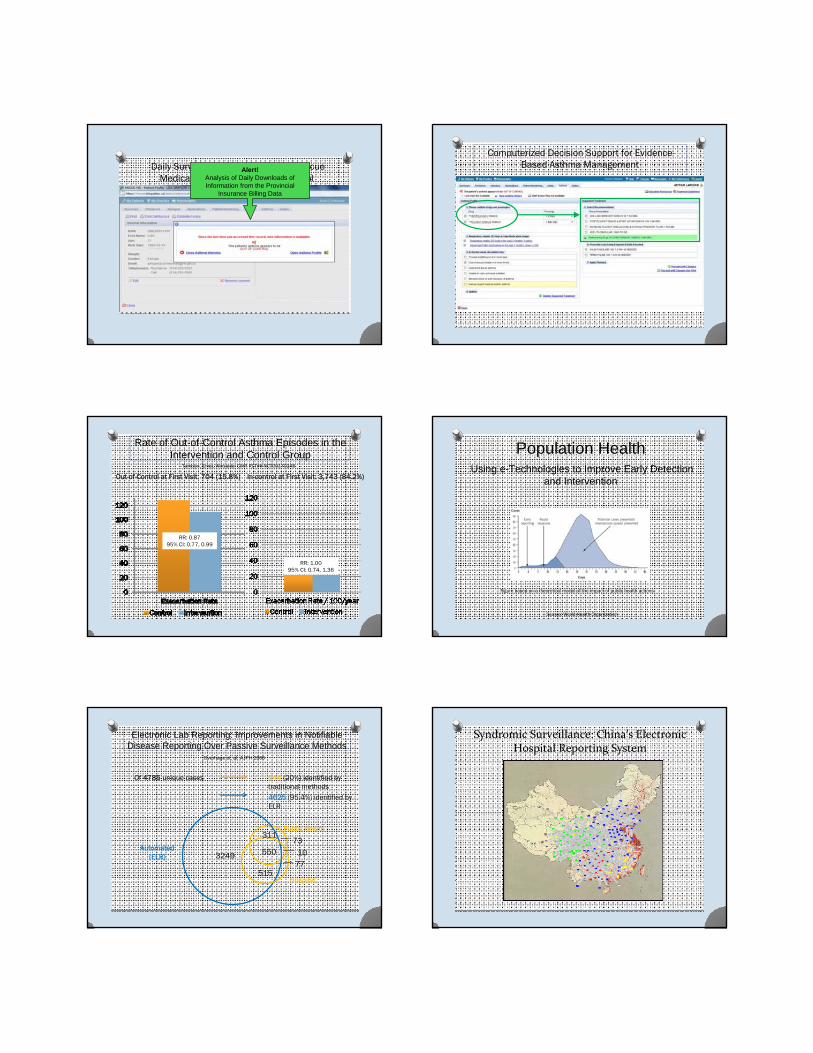
Rate of Out-of-Control Asthma Episodes in the Intervention and Control Group
RR: 0.8795% CI: 0.77, 0.99
RR: 1.0095% CI: 0.74, 1.36
Out-of-Control at First Visit: 704 (15.8%) In-control at First Visit: 3,743 (84.2%)
Tamblyn, Ernst, Winslade: CIHR RCT## NCT00170248
Population Health Using e-Technologies to Improve Early Detection
and Intervention
Figure based on a theoretical model of the impact of public health actions.
Source: World Health Organization
Electronic Lab Reporting: Improvements in NotifiableDisease Reporting Over Passive Surveillance Methods
Public Health
Automated (ELR)
Hospital
3249
311
550
515
73
1077
Overhage et. al, AJPH 2008
Of 4785 unique cases 944 (20%) identified by traditional methods
4625 (95.4%) identified by ELR
Syndromic Surveillance: China’s Electronic Hospital Reporting System

700
600
500
400
300
200
100
0 50
100 150 200 250 300 350
Time (days)
Rubella Outbreak in Chinese Middle School
Expected
ConclusionsTargeted e-Technologies Can Improve
Efficiencies By:
1. Empowering patients to manage chronic conditions and provide more timely access to healthcare.
2. Providing person-specific decision support to reduce morbidity.
3. Monitoring infectious diseases to control outbreaks.
How to Bend the Cost CurveTotal health expenditure as a % of GDP, by
country
Source: Commonwealth Fund National Scorecard on U.S. Health System Performance, 2006
Supporting outstanding health services and policy research: where to start?
Source: Statistics Canada. Estimates of Population, Canada, the Provinces and Territories (Persons). CANSIM Table no. 051-0001; and Statistics Canada. Population Projections for Canada, Provinces and Territories (2005-2031). CANSIM table no. 052-0004
Canada’s aging population Readmitted to Hospital or Went to ERfrom Complications During Recovery
11
17
79
17
11 10
18
0
20
40
AUS CAN FR GER NETH NZ UK US
Base: Adults with any chronic conditionData collection: Harris Interactive, Inc.Source: 2008 Commonwealth Fund International Health Policy Survey of Sicker Adults.

36 3931
40
5955
67
43
0
20
40
60
80
AUS CAN FR GER NETH NZ UK US
Percent received all four diabetes services*
* Hemoglobin A1c checked in past six months; feet examined for sores or irritations in past year; eye exam for diabetes in past year; and cholesterol checked in past year.Data collection: Harris Interactive, Inc.Source: 2008 Commonwealth Fund International Health Policy Survey of Sicker Adults.
Diabetics Who Received RecommendedPreventive Care Services
17.4%
16.4%
14.8%
10.5%
14.0%
16.0%
14.0%13.0%
12.4%
13.6%
9.3%
14.5%
10.0%
8.9%8.5%
16.4%
12.4%
14.2%13.3%
12.6%
0%
2%
4%
6%
8%
10%
12%
14%
16%
18%
CAN FRA OECDMedian
GER AUS* SWED US NZ SWITZ* DEN
1996 2006
Source: OECD Health Data 2008
Percentage of Total Health Care Spendingon Pharmaceuticals, 1996 and 2006
If this type of calling system were provided by your doctor, would you continue to use it?
Was the calling system easy to use?
Feasibility and Acceptability of IVRS (n=496)
Total Retail Drug Expenditure as a Percentage of Total Health Expenditure, Canada, 1985-2009
Retail drugs were forecasted to account for ~16.4% of total health expenditures in 2008 and 2009 (CIHI, 2008)
Growth in per capita spending due to:
Increased volume of drugs purchasedTypes of drugsPopulation aging (moderate effect)
“…It’s a sign of just how desperate overcrowded facilities are to free up beds…The bottleneck starts outside of hospital and is caused by a shortage of both home and long-term care.”
Automating the Completion of Adverse Event Reports Within the Patient’s Chart

Electronic Lab Reporting: Improvements in NotifiableDisease Reporting Over Passive Surveillance Methods
Timeliness Cases identified on average 7.9 days earlier by ELR
More timely for 13 out of 16 conditions (81%)
Overhage et. al, AJPH 2008
Completeness ELR identified 4.4 times as many cases as spontaneous reporting
Of 18 reporting fields:10 present more often in ELR5 present in more often in spontaneous reports3 present equally in both methods