Embed Size (px)
Citation preview

Available online at www.vrseducation.com
Vertex Research Society FULL PAPER PROCEEDING Multidisciplinary Studies
Business, Management and Economic studies
Full Paper Proceeding OMMSP-2020, Vol. 3, 06-17
ISBN: 978-969-670-861-3
OMMSP 2020
How Service Quality Enhances Customer Satisfaction: A Case Study of Low-
cost Airlines in Thailand
Yada Burapharat*
Kasem Bundit University, Thailand
Abstract
The airlines business in Thailand has become a major segment in the tourism industry that significantly affects the economic development
of the nation. The market has been more challenging and competitive; therefore, every airline sets goals to improve service quality to increase
customer satisfaction. To better understand the customer insights, this study aims to analyse the demographic factors influencing customer
satisfaction and how service quality enhances customer satisfaction of low-cost airlines in Thailand what is the level of customer satisfaction
measurements and how it can be improved. The respondent were 400 passengers of low cost airline from Don Muang and Suvarnabhumi
Airport, Thailand. The sample size was determined by using Taro Yamane’s formula. This research used a qualitative research method.
Using questionnaire and interview method were the instruments to collect data. The questionnaire consisted of 2 parts are the demographic
information of respondents including the respondents of gender, age, nationality, civil status, educational attainment, occupation and monthly
income. The customer satisfaction including reliability, responsiveness, assurance, empathy and tangible related to 5 main points. The study
was conducted by purposive sampling method. The findings were presented by descriptive statistics in forms of frequency, percentage and
mean. The results revealed that the passengers were male in the middle age between 25-45 years old, the nationality was Thai, the civil status
was single than married, the education attainment was bachelor’s degree, the occupation was business person follow by private employee
and monthly income between 25,000-85,000 baht. In overall, the level of customer satisfaction was medium, the highest level was
responsiveness and on the other hand the lowest level was reliability and follow by tangible respectively.
Keywords: Service quality, Customer satisfaction
Introduction
Statement of the Problems
Due to changing lifestyles and priorities, people around the globe are very much inclined towards travelling
nowadays. They are open to explore and experience new ideas and new places. This has given a great push to Global
air travels with an increase in destinations and routes. Airline industry is going through a dynamic shift facing multiple
challenges of reducing costs, attracting and maintaining demand as well as keeping up with quality standards (Baker,
2013). This has also elevated the customer perception and expectation of service quality.
Thailand’s air transportation industry tended to grow continuously thanks for the positive factors arising from
both domestic and international tourism growth. Airlines increase their flights in respond to an increased in air travel
demand. Therefore, the number of aircraft movements at the 6 AOT’s airports grew by 5.41% to 833,084 flights. The
total number of passengers handled at the 6 airports was greater than 133 million, an increase of 9.37%. The total
freight and postal parcel volume amounted to 1.60 million tons, increased by 9.68%when compared with those numbers
of the previous year.
Customer satisfaction and service quality are one of the basic opportunities which help to run, to improve
business and profit of the company, and especially save the loyalty of its customers (Asya, 2013). Good service is a
result of organized corporate culture, which can be considered as a kind of social culture in general. Set-ting the values
of a generalized trend of activity, rules, regulations and standards concretize this direction.
Quality service expectations in air travel are extremely important in consumer’s behaviour (Parasuraman et
al., 1985) as they affect their satisfaction and also lead to buying decisions (Park et al, 2004). Airline passengers
understand service quality as a multi-dimensional variable (Parasuraman et al, 1988) and satisfaction is measured by
overall service experience based on various factors, including the perception of service quality and also their mood,
emotions and other social and economic factors (Tolpa, 2012). This concept, based on the premise that customers’
assessment leads to a gap between expectations and perceptions of actual performance, has been used by many
researchers to measure airline service quality (Sultan and Simpson, 2000, Fick and Ritchie, 1991). When expectations

6
are exceeded, customers think that they receive high quality service and this surprises them. When expectations are
not met, customers think that service quality is unacceptable while, when expectations are confirmed by perceived
service, they find quality satisfactory. However, if quality is less than expected, it results in severe disappointment
that has greater effect than the excitement produced by quality that exceeds their expectations (Tolpa 2012, Atilgan et
al, 2008 Fitzsimmons and Fitzsimmons, 2001).
This means that airlines should only offer services that they are capable of delivering, as this differentiates
them from the other airlines in terms of service quality. Furthermore, airlines should adopt strategies that enhance
passengers’ satisfaction by exceeding desired service levels, dealing effectively with non-satisfied customers and
confronting customer complaints positively. Early confront of customers complaints and quick resolution is therefore
very important to change customer’s impression and increase satisfaction (Makarand 2012). The bottom line is
passenger’s loyalty; profit and growth are stimulated primarily by customer loyalty that is a direct result of customer
satisfaction (Amiruddin, 2013, Jones et al, 2002, Lee et. al. 2001, Heskett et al, 1997)
Objective of Study
The objective of this research is how service quality enhances customer satisfaction of low-cost airlines in
Thailand what is the level of customer satisfaction measurements and how it can be improved.
Hypothesis Testing
H1: The level of service quality does not influence by passenger’s profile.
H2: The level of customer satisfaction does not influence by passenger’s profile.
H3: The level of service quality influence by customer satisfaction.
Research Questions
1. What is the level of services quality?
2. What is the level of customer satisfaction?
3. How services quality improve customer satisfaction?
Definition of terms
Low cost airline refers to the airline that located in Bangkok, Thailand consists of Don Muang and
Suvarnabhumi Airport.
Service quality refers to the service quality of low cost airline in term of reliability, responsiveness, assurance,
empathy and tangible.
Customer Satisfaction refers to the customer satisfy in service quality.
Significant of study
This research aimed to find out the significant factors that influence by customer satisfaction and how to
improve them.
Literature Review
The theory supports this research are service quality and customer satisfaction as following:
Service Quality
Service quality (Kumaradeepan, V1 and Pathmini, MGS, 2015). World “quality” means different things
people and according to (Gravin, 1998), identifies five perspectives on quality; transcendent quality, product- based

7
quality, user based quality, manufacturing based quality and value based quality. As a result of intangible, multifaceted
nature of many services, it may be harder to evaluate service quality than goods. Because customers cannot be separated
from service delivery - process. Thus, most scholars were on the view that it as a major determinant to measure the
customer satisfaction and some time as a determinant of customer loyalty too (Parasuraman & Berry, 1991; Zeithaml
et al., 1990).
Service quality defined as the customer's judgment about the superiority or excellence of a product (Zeithaml,
1988). Gronroos, (1998) defined service quality as a” difference between customer expectations of „what they want‟
and their perceptions of „what they get‟. Also, service quality defined as “assessment of how well a delivered service
conforms to the client's expectations. Service business operators often assess the service quality provided to their
customers in order to improve their service, to quickly identify problems, and to better assess client satisfaction”. Also,
definitions of service quality revolve around the idea that it is the result of the comparison that customers make between
their expectations about a service and their perception of the way the service has been performed (Lewis and Booms,
1983; Lehtinen and Lehtinen, 1982; Parasuraman et al., 1994). Lehtinen and Lehtinen (1982) give a three-dimensional
view of service quality; interaction, physical and corporate quality. At a higher level, and essentially from a customer's
perspective, they see quality as being two dimensional; process quality and output quality. Among them, Parasuraman
was significantly contributed to the development of the service quality area as an important research field. The service
quality construct according to Parasuraman et al. (1994) resulted in the development of the original 22-item
SERVQUAL instrument that represents one of the most widely used operationalization of service quality. It has
provided researchers with the possibility of measuring the performance expectations gap (Gap 5) composed of five
determinants namely: reliability; responsiveness; empathy; assurance; and tangible.
Customer satisfaction
Customer satisfaction has been a popular topic in marketing practice and academic research since Cardozo's
(1965) initial study of customer effort, expectations and satisfaction. Despite many attempts to measure and explain
customer satisfaction, there still does not appear to be a consensus regarding its definition (Giese and Cote, 2000).
Customer satisfaction is typically defined as a post consumption evaluative judgment concerning a specific product or
service (Gundersen, Heide and Olsson, 1996). It is the result of an evaluative process that contrasts pre purchase
expectations with perceptions of performance during and after the consumption experience (Oliver, 1980). The most
widely accepted conceptualization of the customer satisfaction concept is the expectancy disconfirmation theory
(McQuitty, Finn and Wiley, 2000). The theory was developed by Oliver, who proposed that satisfaction level is a result
of the difference between expected and perceived performance. Satisfaction (positive disconfirmation) occurs when
product or service is better than expected. On the other hand, a performance worse than expected results is
dissatisfaction (negative disconfirmation). Studies show that customer satisfaction may have direct and indirect impact
on business results. Luo and Homburg (2007) concluded that customer satisfaction positively affects business
profitability. The majority of studies have investigated the relationship with customer behavior patterns (Dimitriades,
2006; Olorunniwo et al., 2006; Chi and Qu, 2008; Faullant et al., 2008). According to these findings, customer
satisfaction increases customer loyalty, influences repurchase intentions and leads to positive word-of-mouth
Given the vital role of customer satisfaction, it is not surprising that a variety of research has been devoted
to investigating the determinants of satisfaction. Satisfaction can be determined by subjective (e. g. customer needs,
emotions) and objective factors (e. g. product and service features). Applying to the hospitality industry, there have
been numerous studies that examine attributes that travelers may find important regarding customer satisfaction.
Atkinson (1988) found out that cleanliness, security, value for money and courtesy of staff determine customer
8
satisfaction. Knutson (1988) revealed that room cleanliness and comfort, convenience of location, prompt service,
safety and security, and friendliness of employees are important. Barsky and Labagh (1992) stated that employee
attitude, location and rooms are likely to influence travelers’ satisfaction. A study conducted by Akan (1995) showed
that the main determinants of hotel guest satisfaction are the behavior of employees, cleanliness and timeliness. Choi
and Chu (2001) concluded that staff quality, room qualities and value are the top three hotel factors that determine
travelers’ satisfaction.
1. Customer Satisfaction Models
Models of customer satisfaction come from a vast literature from the marketing research discipline. This pool
of research includes models that integrate the concept of customer satisfaction in a network of related concepts, such
as value, quality, complaining behavior, and loyalty. In this paper, we will label these kinds of models as “macro-
models.” Macro-models have special importance for the policy-level implications of an organization’s research in
customer satisfaction. Macro-models give the researcher the strategic context of the design and of the results for a
study of customer satisfaction. The marketing research literature extensively covers the elements that make up the
concept of customer satisfaction, such as disconfirmation of expectations, equity, attribution, affect, and regret.
Because these elements explain the composition of the customer satisfaction concept (or “construct”), we will label
these kinds of models as “micro-models.” Micro-models enable an analyst to properly operationalize measurements of
customer satisfaction, thus helping her/him to achieve construct validity in the eventual satisfaction survey.
1.1 Macro-models
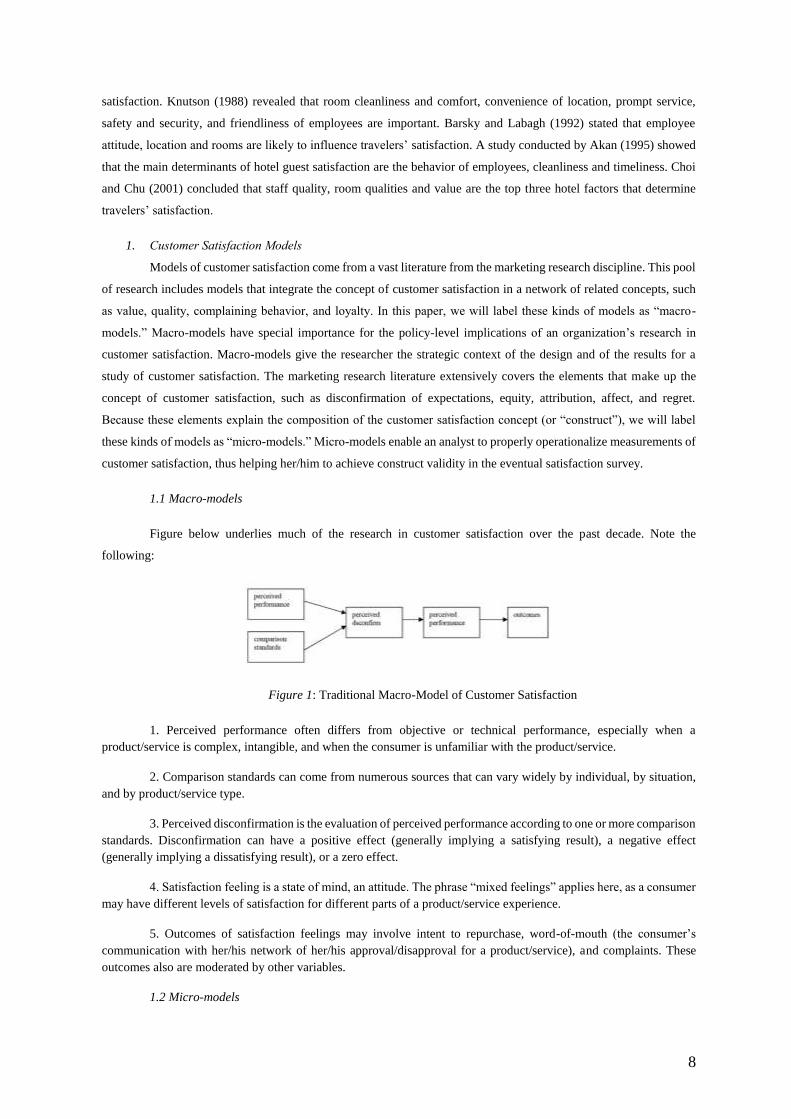
Figure below underlies much of the research in customer satisfaction over the past decade. Note the
following:
Figure 1: Traditional Macro-Model of Customer Satisfaction
1. Perceived performance often differs from objective or technical performance, especially when a
product/service is complex, intangible, and when the consumer is unfamiliar with the product/service.
2. Comparison standards can come from numerous sources that can vary widely by individual, by situation,
and by product/service type.
3. Perceived disconfirmation is the evaluation of perceived performance according to one or more comparison
standards. Disconfirmation can have a positive effect (generally implying a satisfying result), a negative effect
(generally implying a dissatisfying result), or a zero effect.
4. Satisfaction feeling is a state of mind, an attitude. The phrase “mixed feelings” applies here, as a consumer
may have different levels of satisfaction for different parts of a product/service experience.
5. Outcomes of satisfaction feelings may involve intent to repurchase, word-of-mouth (the consumer’s
communication with her/his network of her/his approval/disapproval for a product/service), and complaints. These
outcomes also are moderated by other variables.
1.2 Micro-models

9
The seven types of models they review in their article, and we will briefly comment on each type as
following:
1. The Expectations Disconfirmation Model has been the dominant model in satisfaction research. The model
has consumers using pre-consumption expectations in a comparison with post-consumption experiences of a
product/service to form an attitude of satisfaction or dissatisfaction toward the product/service. In this model,
expectations originate from beliefs about the level of performance that a product/service will provide. This is the
predictive meaning of the expectations concept.
2. The Perceived Performance Model deviates from the above model in that expectations play a less
significant role in satisfaction formation. The model performs especially well in situations where a product/service
performs so positively that the consumer’s expectations get discounted in her/his post-consumption reaction to the
product/service.
3. Norms Models resemble the Expectations Disconfirmation Model in that the consumer compares perceived
performance with some standard for performance. In this case, however, the standard is not a predictive expectation.
Rather than considering what will happen in the consumption experience, the consumer uses what should happen as
the comparison standard. This is the normative meaning of “should” rather than its occasional chronological
connotation in the English language.
4. Multiple Process Models characterize the satisfaction formation process as multidimensional. That is,
consumers use more than one standard of comparison in forming a (dis)confirmation judgment about an experience
with a product/service.
5. Attribution Models integrate the concept of perceived causality for a product/service performance into the
satisfaction process. Consumers use three factors to determine attribution’s effect in satisfaction. These are locus of
causality, stability, and controllability. The locus of causality can be external (that is, the service provider gets the
credit or blame) or internal (that is, the consumer is responsible for the product/service performance). Stable causes
would tend to have more impact in satisfaction because consumers tend to be more forgiving of product/service failures
that appear to be rare events. Finally, controllability affects attribution in that a poor outcome in a consumption
experience may mean that the consumer will be unsatisfied with the product/service provider if the consumer believes
the provider had the capacity, that is, control, to perform in a better fashion.
6. Affective Models differ from previous models in that it goes beyond rational processes. In these models,
emotion, liking, and mood influence (dis)satisfaction feelings following the consumption experience.
7. Equity Models emphasize the consumer’s attitude about fair treatment in the consumption process. Fair
treatment can use the concept of the equity ratio (that is, the amount of her/his return for her/his effort made) or the
concept of social comparison (that is, the perceived, relative level of product/service performance that other consumers
experience).
Methodology
This research used a qualitative research method. Using questionnaire and interview method were the
instruments to collect data.
Participant
The population was passengers of low cost airline from Don Muang and Suvarnabhumi Airport, Thailand.
The sample size was determined by using Taro Yamane’s formula.
Instrument
The instrument used in this research are divided into the following
1. The questionnaire consisted of 2 parts:

10
1.1 The questions related with general information, concerned demographic information of respondents
including the respondents of gender, age, nationality, civil status, educational attainment, occupation and monthly
income
1.2 The questions related to 5 main points of customer satisfaction including reliability, responsiveness,
assurance, empathy and tangible.
The research methodology was divided into 3 steps below:
1. Select sample group by purposive sample method. The sample group came from 400 passengers who used
low cost airline from Don Muang and Suvarnabhumi Airport, Thailand
2. Develop the research instrument which were two types of questionnaire and interview.
Collect data and analyze the data obtained from the questionnaires and interviews from key informants.
Research Framework
Data Analysis
The data was processed according to the following steps. The measurement of calculating for average and
standard deviation was done by using a computer program and the questionnaire was designed with the five – point
Likert scale for the respondents to their level of engagement with the given interpretation as below:
Means Scores Interpretations
4.50 – 5.00 Highest
3.50 – 4.49 High
2.50 – 3.49 Medium
Passengers’ Profile
- Gender
- Age
- Nationality
- Civil Status
- Educational
Attainment
- Occupation
- Monthly Income
Service Quality
- Reliability
- Responsiveness
- Assurance
- Empathy
- Tangible
Improve customer
service quality that
enhance customer
satisfaction

11
1.50 – 2.49 Low
1.00 – 1.49 Lowest
Table1: Demographic Characteristics of Participants
No. Variables Demographic
Data
Frequency (f) Percent (%)
1 Gender Male 163 40.6
Female 237 59.4
Total 400 100
2 Age Below 25 years 30 7.5
25 – 35 164 41.1
36 – 45 132 32.8
46 – 55 74 18.5
Total 400 100
3 Nationality Thai 287 71.75
Foreigner 113 28.25
Total 400 100
4 Civil Status Single 184 46.1
Married 152 38.1
Divorced/Separated 44 11.0
Widowed 20 4.8
Total 400 100
5 Educational
Attainment
Below Bachelor’s degree 55 13.8
Bachelor’s degree 239 59.6
Master’s degree 106 26.6
Total 400 100

12
6 Occupation Student 30 7.5
Government officer 83 20.7
Private Employee 97 24.3
Freelancer 66 16.5
Business Person 124 31.0
Total 400 100
7 Monthly Income Below 25,000
baht
38 9.5
25,000-
55,000 baht
150 37.6
55,001-
85,000 baht
138 34.3
Above 100,000 baht 74 18.5
Total 400 100
The Table-1, the sample group consisted of 163 male (40.6%) and 237 female (59.4%) passengers, the
proportion of male and female are similar their age were 25 – 45 years old (73.9%), nationality was Thai (71.75%)
than foreigner (28.25%), the civil status was single (46.1) than married (38.1), education attainment was bachelor’s
degree (59.6), occupation was business person (31.0%) follow by private employee (24.3%) and monthly income
between 25,000-85,000 baht. (71.9%).
Table 2: Customer Satisfaction
Customer Satisfaction Mean S.D Interpret
Reliability
1. Airline flights always departs on time. 3.10 0.712 Medium
2. Airline flights always arrives on time. 3.37 0.603 Medium

13
3. Airline solves passenger’s problems without
delays.
315 0.675 Medium
4. Handling of baggage is effective and
without loss.
3.48 1.004 Medium
Overall 3.27 0.748 Medium
The Table-2 above presents the item mean ratings on the level of outcome of the customer satisfaction as
following:
Reliability, the respondents as a whole obtained a sub mean rating of (3.27), described as “Medium”. The
highest mean rating is obtained by the item is “Handling of baggage is effective and without loss.” for the respondents
as a whole with (3.48) described as “Medium”. On the other hand, the lowest mean rating of (3.10) the item is “Airline
flights always departs on time.” described as “Medium”.
Customer Satisfaction Mean S.D Interpret
Responsiveness
1. The ticketing system is very quick. 3.33 0.663 Medium
2. You have always get help from the airline
staff no matter what is the problem.
3.51 0.734 High
3. Airline staff is very friendly 3.46 0.442 Medium
4. The baggage arrives on belt very quickly. 3.48 0.467 Medium
Overall 3.44 0.576 Medium
Responsiveness, the respondents as a whole obtained a sub mean rating of (3.44), described as “Medium”.
The highest mean rating is obtained by the item is “You have always get help from the airline staff no matter what is
the problem” for the respondents as a whole with (3.51) described as “High”. On the other hand, the lowest mean rating
of (3.33) the item is “The ticketing system is very quick.” described as “Medium”.
Customer Satisfaction Mean S.D Interpret
Assurance
1. Airline is a trusted name in the industry. 3.54 0.814 High
2. The airline has a very good safety record. 3.33 0.701 Medium

14
3. The airline staff are competent. 3.21 0.623 Medium
4. They have a high standard of service. 3.18 0.540 Medium
Overall 3.32 0.669 Medium
Assurance, the respondents as a whole obtained a sub mean rating of (3.32), described as “Medium”. The
highest mean rating is obtained by the item is “Airline is a trusted name in the industry.” for the respondents as a whole
with (3.54) described as “High”. On the other hand, the lowest mean rating of (3.18) the item is “They have a high
standard of service” described as “Medium”.
Customer Satisfaction Mean S.D Interpret
Empathy
1. They have understand the special individual
needs.
3.17 0.794 Medium
2. They anticipate the problems of passenger. 3.22 0.886 Medium
3. The airline staff treats everyone individually. 3.40 1.002 Medium
4. The airline staff is cheerful in providing
support service.
3.55 1.124 High
Overall 3.34 0.951 Medium
Empathy, the respondents as a whole obtained a sub mean rating of (3.34), described as “Medium”. The
highest mean rating is obtained by the item is “The airline staff is cheerful in providing support service.” for the
respondents as a whole with (3.55) described as “High”. On the other hand, the lowest mean rating of (3.17) the item
is “They have understand the special individual needs.” described as “Medium”.
Customer Satisfaction Mean S.D Interpret
Tangible
1. Airline has state of the art latest aircrafts. 3.11 0.695 Medium
2. Airline cabin crew is efficient. 3.24 0.702 Medium
3. Ticketing counters doesn’t have long queues. 3.41 0.761 Medium

15
4. Airline reservation office is conveniently
located.
3.35 0.878 Medium
Tangible, the respondents as a whole obtained a sub mean rating of (3.28), described as “Medium”. The
highest mean rating is obtained by the item is “Ticketing counters doesn’t have long queues.” for the respondents as a
whole with (3.41) described as “Medium”. On the other hand, the lowest mean rating of (3.11) the item is “Airline has
state of the art latest aircrafts.” described as “Medium”.
In overall, it could be seen that the customer satisfaction in term of responsiveness (3.44) described as
“Medium” is in high level and on the other hand the mean rating of reliability (3.27) and tangible (3.28) are lowest
described as “Medium” which mean this factor should be improved to be better.
Results of Hypothesis Testing
Table 3: The regression analysis of passenger’s profile toward customer satisfaction
Variables Beta t-value t-prob
Gender -.090 -1.766 .078
Age -.100 -1.995* .047
Nationality .014 .256 .798
Civil Status -.020 -.398 .691
Educational
Attainment
-.001 -.023 .981
occupation .007 .118 .906
Monthly Income .121 2.350* .019
MultR = .268 F-ratio = 3.010*
RSq = .072 F-prob = .001
*singificant at 0.05
The Table-3 showing the multiple linear regression analysis of the respondents was tested according to profile
of passengers toward customer satisfaction. It was found that 7.2% (R-Square=0.072) and the remaining 93.8% could
be due to some factors which do not considered in this study. When considering single variable, it was found that age
(beta=-.100), p-value= .047< .05 hypothesis was accepted at 5% level of significant, and monthly income (beta=.121),
p-value= .019< .05 hypothesis was accepted at 5% level of significant. This finding implies that age and monthly
income had a significant relationship between customer satisfactions.
Findings
The passengers were male in the middle age between 25-45 years old, the nationality was Thai, the civil
status was single than married, the education attainment was bachelor’s degree, the occupation was business person

16
follow by private employee and monthly income between 25,000-85,000 baht. In overall, the level of customer
satisfaction was medium, the highest level was responsiveness and on the other hand the lowest level was reliability
and follow by tangible respectively. Consider each of item of customer satisfaction found that in term of reliability the
highest mean rating is obtained by the item is “Handling of baggage is effective and without loss.” and the lowest the
item is “Airline flights always departs on time. Responsiveness, the highest mean rating is obtained by the item is “You
have always get help from the airline staff no matter what is the problem”, the lowest mean the item is “The ticketing
system is very quick.” Assurance, the highest mean rating is obtained by the item is “Airline is a trusted name in the
industry.” the lowest the item is “They have a high standard of service”. Empathy, the highest mean rating is obtained
by the item is “The airline staff is cheerful in providing support service.” the lowest the item is “They have understood
the special individual needs. Tangible, the highest mean rating is obtained by the item is “Ticketing counters doesn’t
have long queues.” the lowest the item is “Airline has state of the art latest aircrafts.” The hypothesis testing found that
age and monthly income had a significant relationship between customer satisfactions.
References
Amiruddin, N.H. (2013). “Price, service quality and customer loyalty: A case of Air Asioa, South East
Asia”. Journal of Contemporary Business, Economics and Law, 2(1), pp 34-40.
Asya Archakova (2013). Service Quality and Customer Satisfaction. Case study: Company X, 39 pages, 1 appendix
Saimaa University of Applied Sciences Faculty of Business Administration, Lappeenranta Degree
Programme in International Business, Thesis.
Atilgan, E., Akinci, S., and Aksoy, S. (2008). “Expectations and perceptions for airlines: The Sun Express case with
the gaps model” Journal of Global Strategic Management, 3, pp. 68-78.
Atkinson, A. (1988). Answering the eternal question: what does the customer want? The Cornell Hotel and
Restaurant Administration Quarterly, 1988:29(2): 12-14.
Barsky, J.D. & Labagh, R. (1992). A strategy for customer satisfaction. The Cornell Hotel and Restaurant
Administration Quarterly, 1992:35(3): 32-40.
Chi, C.G.-Q. & Qu, H. (2008). Examining the structural relationships of destination image, tourist satisfaction and
destination loyalty: An integrated approach. Tourism Management, 2008:29: 624-636.
Choi, T.Y., Chu, R., 2001). Determinants of hotel guests' satisfaction and repeat patronage in the Hong Kong hotel
industry. International Journal of Hospitality Management 20, 277-297.
Dimitriades, Z.S. (2006). Customer satisfaction, loyalty and commitment in service organizations-Some evidence
from Greece. Management Research News, 2006:29(12): 782-800
Faullant, R., Matzler, K. & Füller, J. (2008).A positioning map of skiing areas using customer satisfaction scores.
Journal of Hospitality & Leisure Marketing, 16 (3), 230-245.
Fitzsimmons, J. A., Fitzsimmons M. J. (2001). Service Management: Operations, strategy, and information
technology, 3rd edition, Irwin McGraw-Hill, New York, New York.
Gundersen, M. G., Heide, M. & Olsson, U. H. (1996). Hotel Guest satisfaction among Business Travellers: What Are
the Important Factors? The Cornell Hotel and Restaurant Administration Quarterly, 1996:37(2): 72-81.
Heskett, J.L., Earl-Sasser, W.Jr., Leonard, A.S. (1997). Service profit chain, New York, Free Press.

17
Jones, M.A., Mothersbaugh, D.L., Beatty, S.E. (2002). “Why customers stay: Measuring the underlying dimensions
of service switching costs and managing their differential strategic outcomes”, Journal of Business
Research 55(6), 441–450.
Knutson, B. (1988). Frequent travellers: making them happy and bringing them back. The Cornell Hotel and
Restaurant Administration Quarterly, 1988:29(1): 83-87.
Lee, M., Cunningham, L.F. (2001). “A cost/benefit approach to understanding service loyalty”, Journal of Services
Marketing 15(2), 113–130.
Luo, X. & Homburg, C. (2007). Neglected Outcomes of Customer Satisfaction. Journal of Marketing, 2007:71(2):
133-149.
Makarand, U. (2012). “Customer satisfaction measurement in airline services: an empirical study of need-gap
analysis”. International Journal of Management and Strategy, 3(5), 782-96.
McQuitty, S., Finn, A. & Wiley, J. B. (2000). Systematically Varying Customer Satisfaction and its Implications for
Product Choice. Academy of Marketing Science Review, 2000.
Oliver, R. L. (1980). A cognitive model of the antecedents and consequences of satisfaction decisions. Journal of
Marketing Research, 17, 460-9.
Olorunniwo, F. & Hsu, (2006). Service quality, customer satisfaction and behavioral intentions in the service factory.
Journal of Services Marketing, 2006:20(1): 59-72.
Parasuraman, A., Zeithamal, V. A., & Berry, L. L. (1988). SERVQUAL: A Multiple-Item Scale for Measuring
Consumer Perceptions of Service quality. Journal of retailing, 64(1), spring
Parasuraman, A., Zeithaml, V. A., & Berry, L. L. (1985). A conceptual model of service quality and its implications
for future research. The Journal of Marketing, 41-50.
Tolpa, E. (2012). “Measuring Customer Expectations of Service Quality: case Airline Industry”. Logistics, Master's
thesis, available at http://epub.lib.aalto.fi/en/ethesis/pdf/12898/hse_ethesis_12898.pdf