Embed Size (px)
Citation preview

RESEARCH REPORTS
How Pervasive AreAbuses in Fundraising
Among Nonprofits?A Research Report
Howard P. Tuckman, Cyril F. ChangThis article explores selected fundraising information for char-itable nonprofits, asking whether widespread abuses might existin this sector. After examining the pervasiveness of fundraisingand its relation to mission, we show that a few nonprofits raisea majority of sector charitable revenues, and we present theratio of funds raised to funds spent on fundraising by missioncategories. We find that 72 percent of charitable nonprofits donot report direct fundraising expenditures, 5 percent of the activefundraising nonprofits obtain 90 percent of total funds raised,mission is related to a nonprofit’s ability to raise funds, themedian nonprofit spends about 9.6 percent of total raised fundsfor fundraising, and only one in five nonprofits hires a profes-sional fundraiser. At least in terms of the measures used in thisreport, widespread abuses are not obvious.
THE fundraising activities of nonprofits are of considerable inter-est to both public decision makers and scholars of the behav-ior of nonprofit organizations. To date much research has
focused on practical issues such as how to achieve fundraising excel-lence (Mixer, 1993; Rosso, 1991; Dove, 1991), advance the profes-sion and practice of fundraising (Burlingame and Hulse, 1991), andidentify who gives to charity and for what purposes (Jencks, 1987;Hodgkinson and Weitzman, 1990, 1992). In contrast, public concernhas been directed more toward the amounts that nonprofits raise andspend on fundraising. For example, Philanthropy Journal reported inits October 20, 1997, issue that professional fundraising solicitorsraised nearly $50 million in 1996 for nonprofits in North Carolina.These solicitors kept $34 million for themselves to cover fees andcosts. Accounts are also periodically published about nonprofits’ mis-uses of funds. Although these cases are interesting and serve to raise
NONPROFIT MANAGEMENT & LEADERSHIP, vol. 9, no. 2, Winter 1998 © Jossey-Bass Publishers 211

public awareness, they fail to offer the public an idea of the perva-siveness of such abuses.
This article uses select fundraising information for charitablenonprofits to explore the possibility of widespread abuse. Our analy-sis begins with a discussion of the pervasiveness of fundraising activ-ities among nonprofits and the relationship of fundraising to missionand activity. We then explore the extent to which a few nonprofitsraise a majority of the revenues. Next the extent to which profes-sional fundraisers are used to raise charitable revenues is considered,and data on the ratio of fundraising revenues to fundraising expen-ditures are presented by mission and activity category. Our analysisconcludes that the empirical data analyzed in this report do not sug-gest the existence of widespread abuses of fundraising dollars.
The DataThe data used in this study are drawn from a 1988 national sam-ple constructed by the INDEPENDENT SECTOR from information pro-vided by the Internal Revenue Service (IRS). The database consistsof 12,746 returns selected from the returns of a population of125,718 charitable nonprofits required to file a federal Form 990.The selected returns are divided into two groups: first, returns fromall charitable nonprofits with assets above $10 million and, second,returns from a stratified random sample of nonprofits with returnsbelow $10 million. The inclusion of all large nonprofits and theundersampling of smaller ones by the IRS creates a sampling bias.This is adjusted by using weights to render the data representativeof the Form 990 filing population. A description of the sample,weights, and attributes of the data can be found in Hilgert andArnsberger (1992).
We define a nonprofit as engaged in fundraising if it reportsfundraising expenditures on its Form 990; a nonprofit that has noreported fundraising expenditures but that nonetheless receivescharitable revenues is not treated as an active fundraiser (Tuckman,Chang, and Kumar, 1996). Similarly, a nonprofit active in a previousyear but not in the 1988 year is also classified as inactive. Thisapproach may understate the pervasiveness of charitable fundrais-ing for several reasons. For example, a nonprofit may incur fund-raising expenses but not report them on its Form 990. In this casewe would fail to recognize it as active in fundraising. Similarly, if anonprofit raises funds infrequently, our use of a single year’s data maymiss the fact that the organization is active in fundraising at somepoint. A nonprofit may have donors who automatically contribute sothat it does not have to use resources to fundraise. If the organiza-tion fundraises without recorded costs, we would fail to recognize itas active. Finally, a nonprofit may rely entirely on volunteers to raisefunds. This organization also would not show up in our analysis asan active fundraiser. Although all of these situations are possible, we
212 TU C K M A N, CH A N G
This article usesselect fundraisinginformation for
charitablenonprofits toexplore the
possibility ofwidespread abuse

have no reason to believe that they are likely to have a strong impacton our results.
FindingsOur findings suggest answers to five questions about nonprofitfundraising.
How Pervasive Are Fundraising Expenditures AmongCharitable Nonprofit Organizations?Because a number of articles have appeared on fundraising abuses,we begin by exploring the extent to which nonprofits reportfundraising expenditures on their Form 990s. Using the NationalCenter For Charitable Statistics’ National Taxonomy of Tax ExemptEntities (NTEE), we tabulate the percentages of active nonprofitfundraisers by mission or activity category and present the resultsin Table 1.
HO W PE RVA S I V E AR E AB U S E S I N FU N D R A I S I N G AM O N G NO N P R O F I T S? 213
Table 1. Percent of Charitable Nonprofits ReportingFundraising Expenses, 1988
Percentage with Percentage of NTEE Major Code Fundraising Expc Total Sample
D Animal related 51.2 1.2O Youth development 50.2 3.1H Medical research 50.0 0.6I Public protection 42.1 1.5G Medical support and service 40.7 2.1R Civil rights, social action, and advocacy 39.1 0.5A Arts, culture, and humanities 39.0 9.9C Environmental quality and protection 36.6 1.6Q International affairs and national security 36.3 0.9V Social sciences 33.9 0.5W Public/society benefit 33.9 1.0M Public safety and disaster preparedness and relief 33.8 0.8S Community improvement/capacity building 31.9 6.8B Educational institutions 30.2 12.7X Religion related 27.9 5.2K Food, nutrition, and agriculture 27.6 0.9P Human services, other multipurpose 24.7 14.9Z All other 24.6 4.0T Philanthropy and voluntarism 23.3 3.7F Mental health and crisis intervention 22.4 2.9E Health: general and rehabilitation 18.9 11.8L Housing and shelter 18.8 5.1N Recreation, leisure, and sports 18.0 5.1J Employment and jobs 17.0 2.0U Science and technology research 10.5 1.0Y Mutual membership and benefit 4.2 0.3
Whole database (weighted N = 124.233) 28.1 100.0
Approximately 28 percent of the charitable nonprofits reportfundraising expenses for the whole sample, and large variation existsamong the twenty-six nonprofit categories in their percentages ofactive fundraisers. This large variation suggests that inasmuch as theNTEE taxonomy is largely mission based, a nonprofit’s expenditureson fundraising are related to its mission. Among the twenty-sixNTEEs, less than 4.2 percent of the nonprofits classified as mutualmembership and benefit report fundraising expenses, and in at leastthree major categories, including animal related, youth development,and medical research, more than 50 percent of the nonprofits reportfundraising expenses. The percentage of active fundraisers in a major-ity of these mission-based categories is in the 20 percent to 40 per-cent range. Clearly, the proportion of active fundraisers differs bymission, suggesting that fundraising generalizations about the entirenonprofit sector may be hazardous.
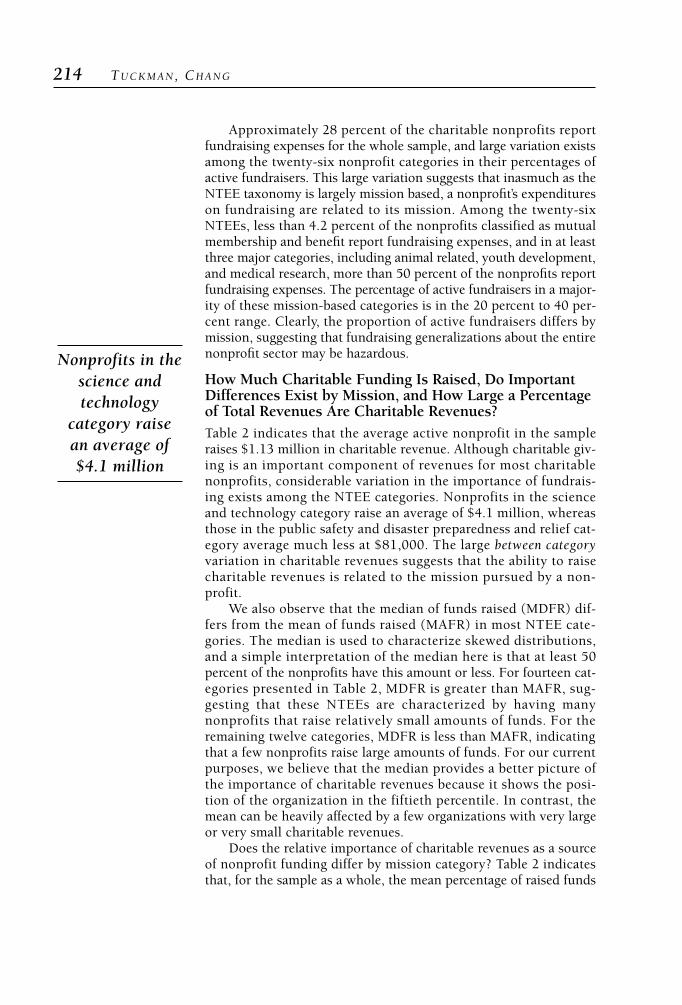
How Much Charitable Funding Is Raised, Do ImportantDifferences Exist by Mission, and How Large a Percentageof Total Revenues Are Charitable Revenues?Table 2 indicates that the average active nonprofit in the sampleraises $1.13 million in charitable revenue. Although charitable giv-ing is an important component of revenues for most charitablenonprofits, considerable variation in the importance of fundrais-ing exists among the NTEE categories. Nonprofits in the scienceand technology category raise an average of $4.1 million, whereasthose in the public safety and disaster preparedness and relief cat-egory average much less at $81,000. The large between categoryvariation in charitable revenues suggests that the ability to raisecharitable revenues is related to the mission pursued by a non-profit.
We also observe that the median of funds raised (MDFR) dif-fers from the mean of funds raised (MAFR) in most NTEE cate-gories. The median is used to characterize skewed distributions,and a simple interpretation of the median here is that at least 50percent of the nonprofits have this amount or less. For fourteen cat-egories presented in Table 2, MDFR is greater than MAFR, sug-gesting that these NTEEs are characterized by having manynonprofits that raise relatively small amounts of funds. For theremaining twelve categories, MDFR is less than MAFR, indicatingthat a few nonprofits raise large amounts of funds. For our currentpurposes, we believe that the median provides a better picture ofthe importance of charitable revenues because it shows the posi-tion of the organization in the fiftieth percentile. In contrast, themean can be heavily affected by a few organizations with very largeor very small charitable revenues.
Does the relative importance of charitable revenues as a sourceof nonprofit funding differ by mission category? Table 2 indicatesthat, for the sample as a whole, the mean percentage of raised funds
214 TU C K M A N, CH A N G
Nonprofits in thescience andtechnology
category raisean average of$4.1 million

to total revenue is 58 percent, whereas the median percentage is 34percent. (Once again, our preference is for the median.) These datasuggest that charitable revenues, though an important source offunds for many nonprofits, are not necessarily the dominant rev-enue source. In the health: general and rehabilitation category, forexample, the percentages are 7 for the median versus 46 for themean. The importance of these types of revenues ranges widelyacross the sectors. Large differences between the median and meanexist in the community improvement/capacity building, educationalinstitutions, employment and jobs, human services, housing andshelter, international affairs and national security, mutual mem-bership and benefit, all other, and public safety and disaster pre-paredness and relief categories. Taken together, these data suggestthat charitable revenues are an important source of revenue. Butthey are not the sole source or even in many cases the dominantsource. Consequently it cannot be automatically assumed that whenfunding abuses exist in the nonprofit sector, they are financed bydonor funds.
HO W PE RVA S I V E AR E AB U S E S I N FU N D R A I S I N G AM O N G NO N P R O F I T S? 215
Table 2. Funds Raised by Charitable Nonprofits, 1988
Funds Raised (in $1,000s) Percent of Total Revenue
NTEE Major Code Mean Median Mean Median
U Science and technology research 4,116.2 3,799.6 59.0 67.2Q International affairs and national security 36,36.3 5,140.7 49.9 90.8B Educational institutions 3,139.8 2,217.9 45.4 22.6S Community improvement/capacity building 1,744.9 3,003.0 81.6 94.5G Medical support and service 1,655.0 1,287.8 72.2 70.2H Medical research 1,572.8 2,370.3 72.7 73.4E Health: general and rehabilitation 962.2 642.2 46.2 6.9W Public/society benefit 817.3 1,665.5 52.5 64.9P Human service, other multipurpose 748.7 737.3 61.3 38.7C Environmental quality and protection 729.3 567.0 55.5 64.9A Arts, culture, and humanities 687.1 1,505.1 53.9 51.1X Religion related 665.8 543.1 79.6 68.5Y Mutual membership and benefit 652.3 350.5 64.3 27.9T Philanthropy and voluntarism 632.9 1,082.4 56.7 52.9D Animal related 596.3 1,225.5 52.3 48.7F Mental health and crisis intervention 587.3 698.7 57.5 52.0J Employment and jobs 567.1 593.5 60.3 19.7R Civil rights, social action, and advocacy 517.1 1,099.1 75.7 78.7V Social sciences 388.6 636.8 66.3 58.4O Youth development 336.0 401.4 55.0 48.8L Housing and shelter 325.4 436.4 63.1 16.3K Food, nutrition, and agriculture 308.9 299.4 53.4 42.4I Public protection 269.0 268.6 68.5 84.0N Recreation, leisure, and sports 244.6 381.0 39.4 30.6Z All other 223.3 208.6 62.8 47.0M Public safety and disaster preparedness and relief 81.2 63.9 52.5 29.2
Whole database (weighted N = 124.233) 1,127.5 1,270.4 58.3 33.9

How Concentrated Is the Distribution of Raised FundsAmong Active Nonprofits?Data on the concentration of charitable revenues are provided inTable 3 for the top 1, 5, and 10 percent and for each subsequentdecile of nonprofits. These data suggest a substantial concentrationof charitable fundraising. For example, the top 1 percent of non-profits receive over 69 percent of these funds, the top 5 percentreceive 90 percent, and the top 10 percent have 96 percent. Withinthe mission categories, a highly concentrated distribution of raisedfunds is found in all classifications (not shown in Table 3). Giventhese findings, it is reasonable to suggest that the abuses of funds ofconcern to society are more likely to be of importance in the top 5or 10 percent of the nonprofit sector.
How Much Do Charitable Nonprofits Spend toRaise Funds?National norms for fundraising expenditures have not been estab-lished, making it difficult for nonprofits to compare their perfor-mance with that of their contemporaries. However, the Council ofBetter Business Bureaus (1982) has published standards to promotepositive ethical practices by nonprofits. One of these standards sug-gests that fundraising costs should not exceed 35 percent of publiccontributions, and another calls for total fundraising and adminis-trative costs to be less than 50 percent. Although these percentagesare somewhat arbitrary, they provide a reasonable boundary for eval-uation. It should be recognized, however, that some nonprofits mayinvest in substantial fundraising campaigns designed to build theirendowments, causing temporary aberrations in the percentage raisedto spent funds. Hence, in practice, these standards may need to beapplied over more than one year. Moreover, in an optimal world, the
216 TU C K M A N, CH A N G
Table 3. Concentration of Total Funds RaisedAmong Charitable Nonprofits
Percentage of Cumulative Total Funds Percentage of Percentage ofOrganizations Raised (in $1,000s) Total Funds Increment
1 19,304,889 68.68 68.685 25,269,133 89.89 21.22
10 26,899,692 95.69 5.8020 27,780,321 98.83 3.1330 27,971,753 99.51 0.6840 28,047,582 99.78 0.2750 28,077,643 99.88 0.1160 28,094,780 99.94 0.0670 28,103,384 99.97 0.0380 28,107,684 99.99 0.0290 28,110,200 100.00 0.01
100 28,110,481 100.00 0.00
It is reasonableto suggest thatthe abuses of
funds of concernto society are
more likely to beof importance inthe top 5 or 10percent of the
nonprofit sector

Table 4. Fundraising and Management Expenditures as a Percentof Total Funds Raised, 1988
Fundraising Expenditures Management Expenditures as a Percentage of as a Percentage of Total Funds Raised Total Funds Raised
NTEE Major Code Mean Median Mean Median
A Arts, culture, and humanities 24.9 10.9 86.3 39.8B Educational institutions 14.8 10.8 154.2 48.6C Environmental quality and protection 17.2 8.3 53.6 25.9D Animal related 101.7 17.3 45.7 20.7E Health: general and rehabilitation 815.8 12.1 7588.2 106.9F Mental health and crisis intervention 7.5 5.3 409.3 30.1G Medical support and service 57.1 12.3 41.0 15.2H Medical research 17.3 5.3 85.9 20.9I Public protection 56.5 8.5 552.7 23.7J Employment and jobs 7.7 9.9 85.6 65.2K Food, nutrition, and agriculture 8.7 7.4 33.1 45.3L Housing and shelter 25.4 11.1 86.5 40.2M Public safety and disaster preparedness and relief 26.5 14.9 42.4 38.8N Recreation, leisure, and sports 133.2 7.2 244.3 25.0O Youth development 16.7 11.9 49.2 30.9P Human services, other/multipurpose 1947.1 6.3 337.2 32.5Q International affairs and national security 193.6 7.6 34.3 10.0R Civil rights, social action, and advocacy 14.6 9.9 47.4 15.4S Community improvement/capacity building 20.5 6.0 58.1 71.2T Philanthropy and voluntarism 16.0 7.2 106.4 17.2U Science and technology research 6.1 2.9 34.3 27.0V Social sciences 21.3 5.9 44.2 33.4W Public/society benefit 24.3 13.0 65.4 21.6X Religion related 12.2 8.0 58.4 23.6Y Mutual membership and benefit 3.9 5.0 7.1 11.8Z All other 16.3 6.7 65.4 31.5
Whole database (weighted N = 124,233) 347.9 9.6 747.4 34.5
correct measure would be the ratio of marginal dollars received tomarginal dollars spent, with a ratio close to, or at, one.
To evaluate the nonprofits in our sample, we compute the ratioof funds raised to funds spent, recognizing that this is, at best, acrude measure of abuse. Our belief is that this measure likely over-states abuses, for the reasons just presented. The results, shown inTable 4, suggest that the median nonprofit spends about 9.6 percentof total raised funds for fundraising. In each mission category themedian nonprofit spends far less to raise funds than it receives. Therange is from the 2.9 percent median in science and technologyresearch to 17.3 percent in animal related activities. These percent-ages are much lower than those suggested by the Better BusinessBureau standards.
Another way to examine whether nonprofits spend too much onfundraising is to compare fundraising expenses to management
HO W PE RVA S I V E AR E AB U S E S I N FU N D R A I S I N G AM O N G NO N P R O F I T S? 217

expenditures. Table 4 indicates that the median ratio of fundraisingspending to management expenditures is 34.5 percent for the wholedatabase, a ratio considerably less than 50 percent. Among thetwenty-six NTEE categories, considerable variation of median valuesexists, ranging from as low as 10 percent for the international affairsand national security category to 106.9 percent for the health: gen-eral and rehabilitation category. Again, fundraising expenses do notseem high for most nonprofits, although in some of the NTEE cate-gories, such as health: general and rehabilitation and communityimprovement/capacity building, there appears to be overspending bysome of the nonprofits.
How Prevalent Is the Practice of Using OutsideProfessional Help?The potential for abuse also exists in the use of external fundraisers;hence, the pervasiveness of the use of these professionals is of con-siderable interest. It can be argued that fundraising is becomingincreasingly more professional (Mixer, 1993; Harrah-Conforth andBorsos, 1991). Several scholars emphasize the importance of effec-tive managerial and organizational strategies (Duronio and Loessin,1991; Tempel, 1991). Others suggest useful rules and principles forimproving fundraising practices (Carroll, 1991; Mixer, 1993). Exter-nal fundraising consultants offer an array of professional services toassist in capital or annual campaigns (Geever, 1991). Consultantscreate feasibility studies to evaluate fundraising potential, designstrategic plans, provide staff training, assist campaign implementa-tion, and reduce the size of in-house fundraising staff. In short, thereare legitimate reasons for their use.
We begin by looking at the use of outside consultants. Data on thenumber of consultants employed are not available, nor are data on thenumber of nonprofits that hire a consultant. Given these data con-straints, we compute a proxy variable: reported expenditures for pro-fessional fundraising fees. Using this measure, we find that the averageamount paid by nonprofits that report these fees was $78,431. We alsofind that the percentage of nonprofits employing professional fundrais-ers is limited. Recall (as reported in Table 1) that of the 124,233 char-itable nonprofits required to file Form 990, 28 percent were activefundraisers. Of these, only 6,152 reported outside professional fees.These fundraisers represent 18 percent of the nonprofits that activelyengage in fundraising and only 5 percent of all charitable nonprofits.
The percentages of nonprofits reporting professional fundraisingfees for each of the twenty-six categories are reported in Table 5.Once again, statistically significant differences exist by mission cat-egory. The percentages range from a low of 3 percent for the food,nutrition, and agriculture category to a high of 39 percent for the ani-mal related and international affairs and national security categories.In a majority of the twenty-six categories, less than one in five orga-nizations report professional fundraising fees, suggesting that a small
218 TU C K M A N, CH A N G
Fundraisingexpenses do notseem high for
most nonprofits

percentage of nonprofits use outside experts in a given year. For thesector as a whole, even if every nonprofit that used fundraising pro-fessionals engaged in abusive behavior, the impact would likely belimited.
ConclusionIt is likely that charitable contributions attract greater concern thanany other nonprofit revenue source. In part this is because donorsexpect nonprofits to perform a fiduciary role and devote a large por-tion of their raised funds to program uses. In part, too, it is becausedonors cannot adequately monitor the way that funds are trackedand spent. Public concern that nonprofits may abuse their contribu-tions has a potentially significant impact on those nonprofits activelycompeting for charitable dollars. Clearly, nonprofits abuse the pub-lic trust at some risk to their future revenues.
HO W PE RVA S I V E AR E AB U S E S I N FU N D R A I S I N G AM O N G NO N P R O F I T S? 219
Table 5. Fundraising Nonprofits Reporting ProfessionalFundraising Expenses, 1988
Professional Fundraising Expenses
Yes No TotalNTEE Major Code (Percentage) (Percentage) (Percentage)
D Animal related 39.2 60.8 100.0Q International affairs and national security 39.2 60.8 100.0Y Mutual membership and benefit 39.0 61.0 100.0V Social sciences 26.6 73.4 100.0E Health: general and rehabilitation 25.0 75.0 100.0U Science and technology research 24.1 75.9 100.0W Public/society benefit 21.2 78.8 100.0H Medical research 21.1 78.9 100.0A Arts, culture, and humanities 20.9 79.1 100.0B Educational institutions 19.8 80.2 100.0P Human service, other/multipurpose 18.7 81.3 100.0C Environmental quality and protection 17.3 82.7 100.0M Public safety and disaster preparedness and relief 16.9 83.1 100.0L Housing and shelter 16.8 83.2 100.0N Recreation, leisure, and sports 16.3 83.7 100.0I Public protection 15.7 84.3 100.0O Youth development 14.9 85.1 100.0G Medical support and service 13.1 86.9 100.0Z All other 12.8 87.2 100.0T Philanthropy and voluntarism 12.3 87.7 100.0X Religion related 10.5 89.5 100.0F Mental health and crisis intervention 8.5 91.5 100.0S Community improvement/capacity building 8.4 91.6 100.0J Employment and jobs 6.6 93.4 100.0R Civil rights, social action, and advocacy 4.0 96.0 100.0K Food, nutrition, and agriculture 3.3 96.7 100.0
All NTEEs with professional fundraising expenses (weighted N = 34,952) 17.6 82.4 100.0
The results reported in this report should be considered prelim-inary, and they need to be updated with newer data. Taken as awhole, however, they do not provide support for the argument thatabuses of charitable revenues are widespread. Although fundraisingis important to many nonprofit organizations, donations are rarelytheir sole source of funds. In many instances, donations are not thedominant source. Because donations to nonprofits are concentrated,the likelihood for large abuses of funds is confined to comparativelyfew nonprofits, leaving open the possibility that increased scrutinyof the sector could be limited in scope. Indeed, for at least three-quar-ters of the nonprofits studied, donations are sufficiently limited tomake it unlikely that abuses of funds would occur on a large enoughscale to have a practical impact on society. Finally, on average, onlyone in five nonprofits reports professional fundraising fees, again lim-iting the number of nonprofits with the potential to abuse publictrust in fundraising.
HOWARD P. TUCKMAN is professor of economics and dean of the College ofBusiness, Virginia Commonwealth University.
CYRIL F. CHANG is professor of economics at the Fogelman College ofBusiness and Economics, University of Memphis.
References
Burlingame, D. F., and Hulse, L. J. (eds.). Taking Fund Raising Seri-ously: Advancing the Profession and Practice of Raising Money. SanFrancisco: Jossey-Bass, 1991.
Carroll, A. “My Six Rules for a Successful Volunteer-Based CapitalCampaign.” In D. F. Burlingame and L. J. Hulse (eds.), Taking FundRaising Seriously: Advancing the Profession and Practice of RaisingMoney. San Francisco: Jossey-Bass, 1991.
Council of Better Business Bureaus. Standards for Charitable Solicita-tions. Publication No. 311-12129. Arlington, Va.: Council of Bet-ter Business Bureaus, 1982.
Dove, K. E. Conducting a Successful Capital Campaign: A Comprehen-sive Fundraising Guide for Nonprofit Organizations. San Francisco:Jossey-Bass, 1991.
Duronio, M. A., and Loessin, B. A. “Effective Business Practices inFundraising.” In D. F. Burlingame and L. J. Hulse (eds.), TakingFund Raising Seriously: Advancing the Profession and Practice of Rais-ing Money. San Francisco: Jossey-Bass, 1991.
Geever, J. C. “How to Select and Use Fund Raising Consultants.” InH. A. Rosso and Associates, Achieving Excellence in Fund Raising: AComprehensive Guide to Principles, Strategies, and Methods. SanFrancisco: Jossey-Bass, 1991.
220 TU C K M A N, CH A N G

Harrah-Conforth, J., and Borsos, J. “The Evolution of ProfessionalFund Raising: 1890–1990.” In D. F. Burlingame and L. J. Hulse(eds.), Taking Fund Raising Seriously: Advancing the Profession andPractice of Raising Money. San Francisco: Jossey-Bass, 1991.
Hilgert, C., and Arnsberger, P. “Charities and Other Tax-ExemptOrganizations, 1988.” Statistics of Income Bulletin, Summer 1992,10, 60–78.
Hodgkinson, V. A., and Weitzman, M. S. Giving and Volunteering inthe United States. Washington, D.C.: INDEPENDENT SECTOR, 1990.
Hodgkinson, V. A., and Weitzman, M. S. Giving and Volunteering inthe United States. Washington, D.C.: INDEPENDENT SECTOR, 1992.
Jencks, C. “Who Gives to What?” In W. W. Powell (ed.), The Non-profit Handbook: A Research Handbook. New Haven, Conn.: YaleUniversity Press, 1987.
Mixer, J. R. Principles of Professional Fundraising: Useful Foundationsfor Successful Practice. San Francisco: Jossey-Bass, 1993.
Rosso, H. A., and Associates. Achieving Excellence in Fund Raising: AComprehensive Guide to Principles, Strategies, and Methods. SanFrancisco: Jossey-Bass, 1991.
Tempel, E. R. “Assessing Organizational Strengths and Vulnerabili-ties.” In H. A. Rosso and Associates, Achieving Excellence in FundRaising: A Comprehensive Guide to Principles, Strategies, and Meth-ods. San Francisco: Jossey-Bass, 1991.
Tuckman, H. P., Chang, C. F., and Kumar, N. The Factors Contribut-ing to the Success of Active Fundraising Nonprofits. Memphis, Tenn.:University of Memphis, 1996 (mimeographed).
HO W PE RVA S I V E AR E AB U S E S I N FU N D R A I S I N G AM O N G NO N P R O F I T S? 221