Embed Size (px)
Citation preview
How Packaging Contributes to
Food Waste Prevention
denkstatt GmbH
Hietzinger Hauptstrasse 28 · A-1130 Vienna · Austria
T (+43)1 786 89 00 F (+43)1 786 89 00-15
E [email protected] W www.denkstatt.at
denkstatt GmbH · Hietzinger Hauptstrasse 28 · A-1130 Vienna · Austria
T (+43)1 786 89 00 F (+43)1 786 89 00-15 [email protected] www.denkstatt.at
Specific examples from Austrian stakeholder projects, including carbon footprint assessments

Consumer‘s views of contributing to
more sustainable environment
All packaging
Slide 2denkstatt 2017
Source: PWC 2012 Sustainable Packaging
All packaging materials causeONLY 1,3 %
of the total carbon footprint of
Austrian consumers

Food waste – an important issue
� About 30 percent of the carbon footprint of an average European are linked to the production and distribution of food and to nutrition [European Commission 2006]
� More than 100 Mill. tonnes of food are wasted in Europe every year [European Commission 2014]
Slide 3denkstatt 2017
� EU action plan for the Circular Economy[European Commission Dec 2015]:
Plastics and food waste are priority areas
Development of a common methodology and indicators to measure food waste (2016)
Stakeholders platform to examine how to achieve SDGs goals on food waste, share best practice and evaluate progress (2016)
Explore options for more effective use and understanding of date marking on food

Retailers
Project “How Packaging Contributes to
Food Waste Prevention” [denkstatt 2014/15]
Packaging Recycling Association
Slide 4denkstatt 2017
Packaging producers
Polymer producer Industry association Research institute
Meat packer
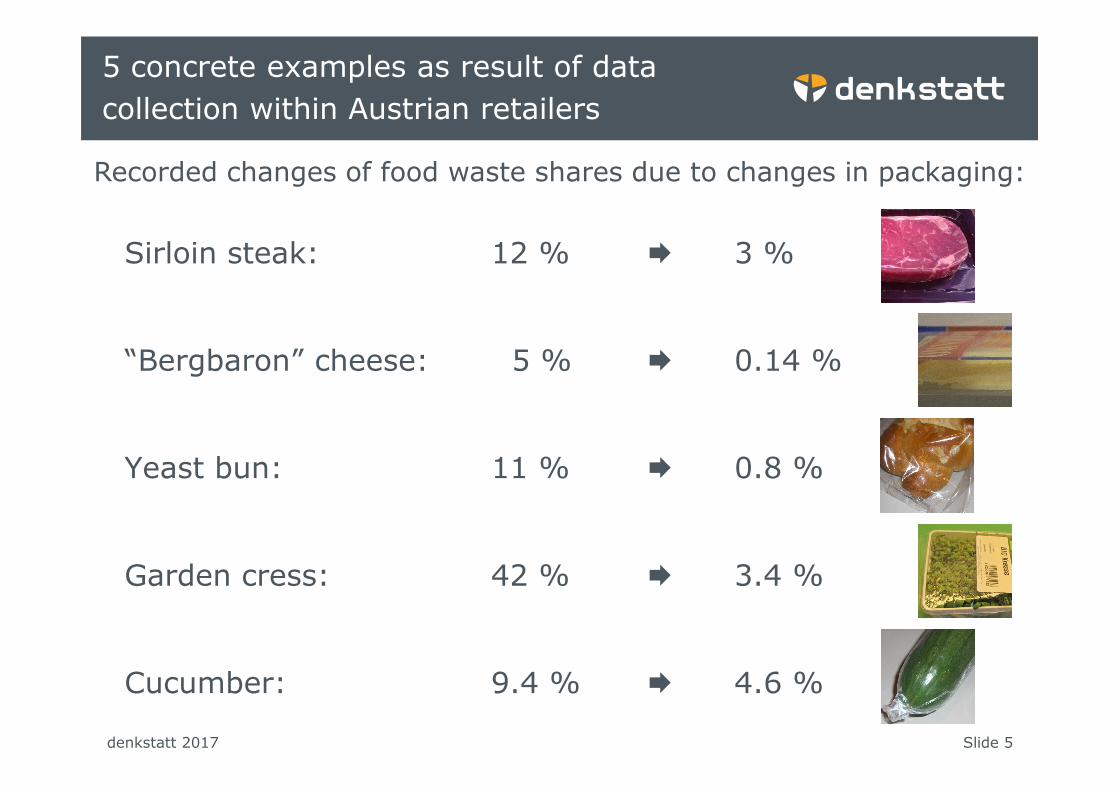
Sirloin steak: 12 % � 3 %
“Bergbaron” cheese: 5 % � 0.14 %
5 concrete examples as result of data
collection within Austrian retailers
Recorded changes of food waste shares due to changes in packaging:
Slide 5denkstatt 2017
Yeast bun: 11 % � 0.8 %
Garden cress: 42 % � 3.4 %
Cucumber: 9.4 % � 4.6 %

Packed Food Previous Version Improved Version
Sirloin steak (and similar cuts of beef steak), 330 g
EPS Top seal tray with modified atmosphere,12 % waste
PS/EVA/PE based skin packaging,3 % waste
Bergbaron cheese,150 g in slices
Cut from a 5 kg bar and sold at counter,5 % waste
Slices in APET/PE/PSA tray + film packaging,0.14 % waste
Investigated case studies
Slide 6denkstatt 2017
Plaited yeast bun,400 g
Paper bag with plastic strip window,11 % waste
OPP film packaging,0.8 % waste
Garden cress growing on substrate, 100 g
In PS tray,42 % waste
Additional PP film,3.4 % waste
Cucumber,350 g
Without packaging,9.4 % waste
PE film,4.6 % waste
Chicken meat,350 g
PP tray plus lidding, 14 % waste at home
PP tray plus lidding, meat separated into two pieces,5 % less waste at home

Example 1 – Sirloin steak
Darfresh skin packaging extends the shelf life from 6 to 16 days;enables steaks to be cut and aged in pack, eliminating separate
packaging for aging; reduction of food waste by 9 percentage points
Slide 7denkstatt 2017 Photo: denkstatt
1000
1500
2000
CO
2e
[g
ram
pe
r fu
nct
ion
al u
nit
]
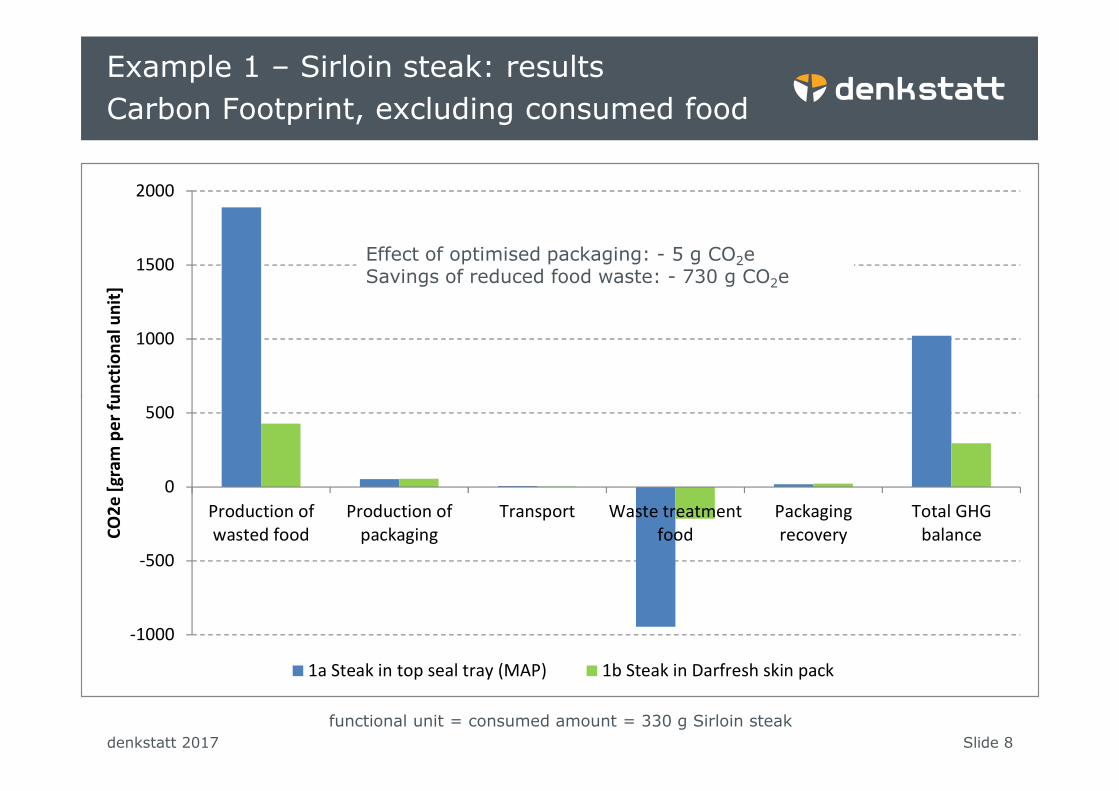
Example 1 – Sirloin steak: results
Carbon Footprint, excluding consumed food
Effect of optimised packaging: - 5 g CO2eSavings of reduced food waste: - 730 g CO2e
Slide 8denkstatt 2017
-1000
-500
0
500
Production of
wasted food
Production of
packaging
Transport Waste treatment
food
Packaging
recovery
Total GHG
balanceCO
2e
[g
ram
pe
r fu
nct
ion
al u
nit
]
1a Steak in top seal tray (MAP) 1b Steak in Darfresh skin pack
functional unit = consumed amount = 330 g Sirloin steak
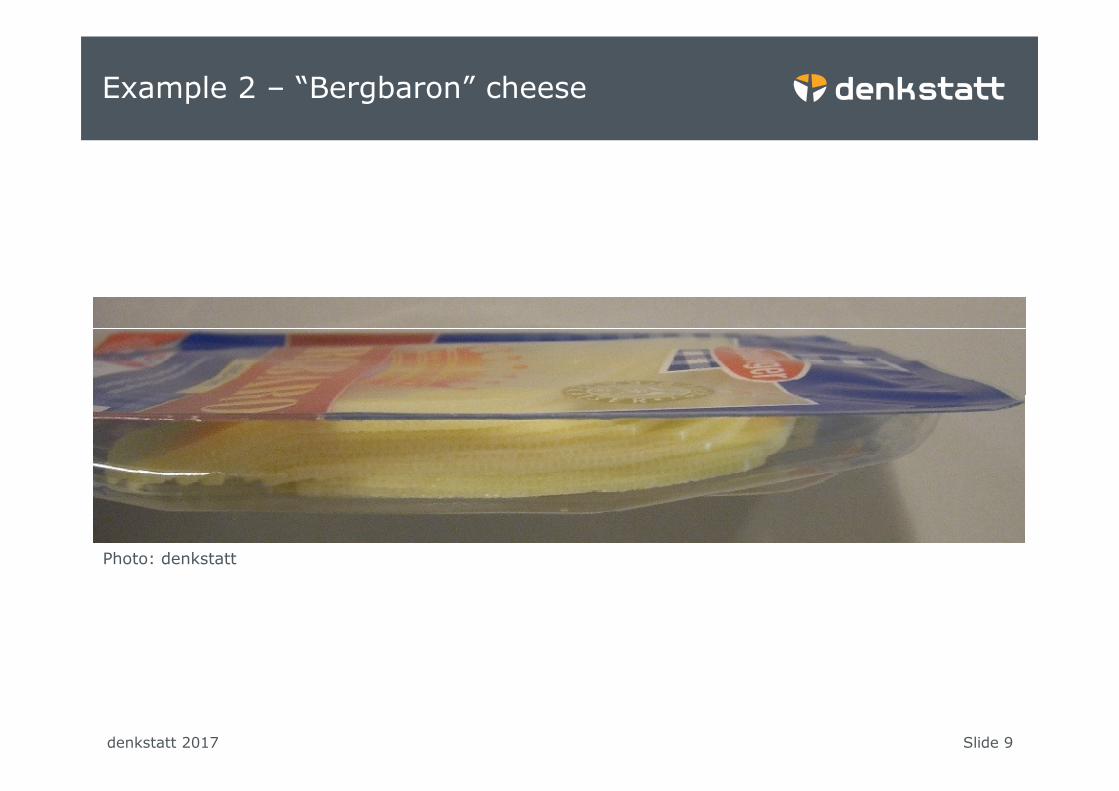
Example 2 – “Bergbaron” cheese
Slide 9denkstatt 2017
Photo: denkstatt
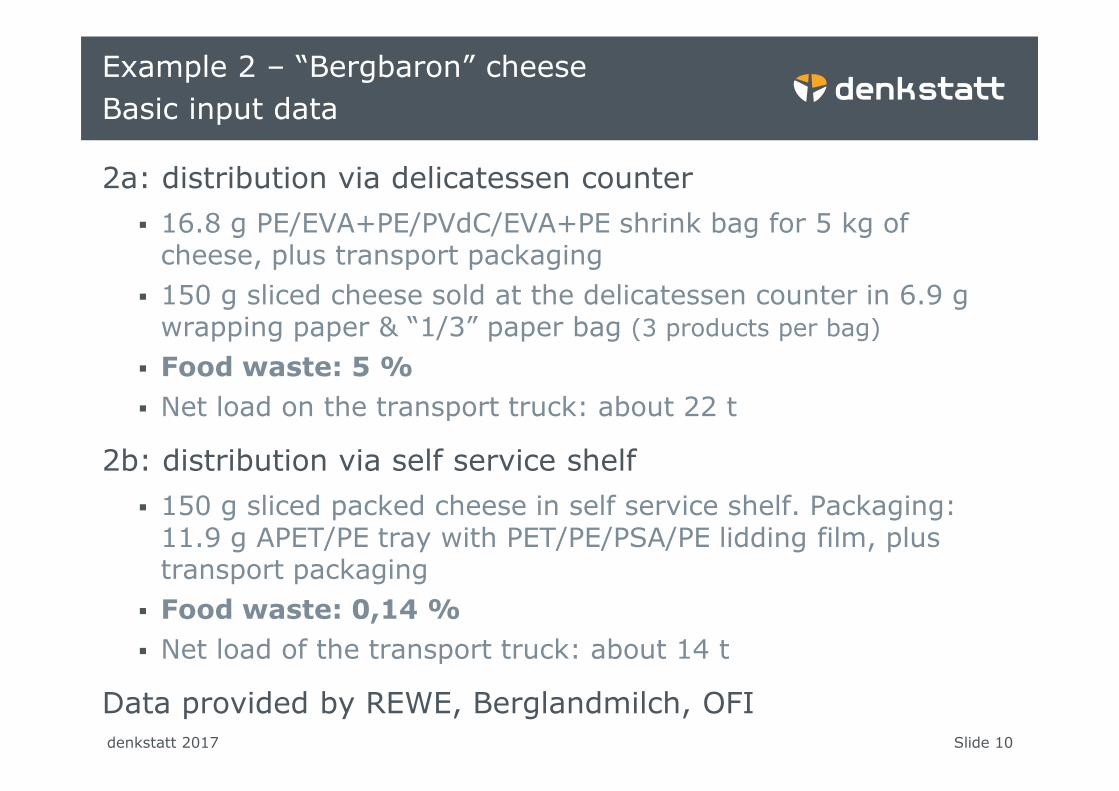
2a: distribution via delicatessen counter
� 16.8 g PE/EVA+PE/PVdC/EVA+PE shrink bag for 5 kg of cheese, plus transport packaging
� 150 g sliced cheese sold at the delicatessen counter in 6.9 g wrapping paper & “1/3” paper bag (3 products per bag)
� Food waste: 5 %
Net load on the transport truck: about 22 t
Example 2 – “Bergbaron” cheese
Basic input data
Slide 10denkstatt 2017
� Net load on the transport truck: about 22 t
2b: distribution via self service shelf
� 150 g sliced packed cheese in self service shelf. Packaging: 11.9 g APET/PE tray with PET/PE/PSA/PE lidding film, plus transport packaging
� Food waste: 0,14 %
� Net load of the transport truck: about 14 t
Data provided by REWE, Berglandmilch, OFI

Example 2 – “Bergbaron” cheese: results
Carbon Footprint, excluding consumed food
60
80
100
Gram CO2e per 150 g of sliced cheese
Reduced GHG
emissions due to
reduction of food
losses from
5 % to 0.14 %:
– 69 g CO2e
Increased GHG
emissions for better
packaging: + 28 g CO2e
Net-benefit of improved
packaging solution
Impact : benefit ratio = 1 : 2,5
Slide 11denkstatt 2017
-20
0
20
40
Production
of wasted
cheese
Production of
packaging
Transport Waste
treatment
cheese
Packaging
recovery
Total GHG
balance
Cheese sold at counter Packed cheese at shelf
packaging: + 28 g CO2e
Small relevance of increased
transport and less recyclability
functional unit = consumed amount = 150 g Bergbaron cheese

Example 3 – plaited yeast bun
PP film bag instead of paper bag – less dehydration0,8 % food waste instead of 11 %
Slide 12denkstatt 2017
Photo: denkstatt
80
100
120
140
160
180
CO
2e
[g
ram
pe
r fu
nct
ion
al u
nit
]
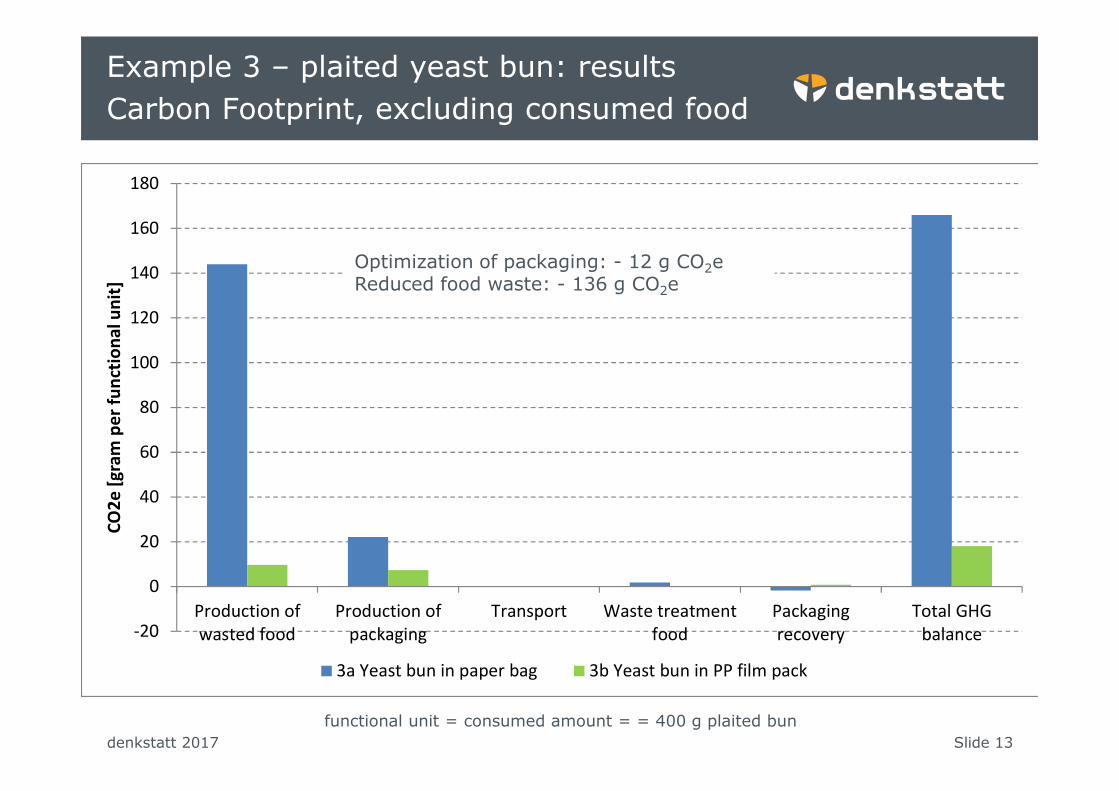
Example 3 – plaited yeast bun: results
Carbon Footprint, excluding consumed food
Optimization of packaging: - 12 g CO2eReduced food waste: - 136 g CO2e
Slide 13denkstatt 2017
-20
0
20
40
60
80
Production of
wasted food
Production of
packaging
Transport Waste treatment
food
Packaging
recovery
Total GHG
balance
CO
2e
[g
ram
pe
r fu
nct
ion
al u
nit
]
3a Yeast bun in paper bag 3b Yeast bun in PP film pack
functional unit = consumed amount = = 400 g plaited bun

1. Optimized packaging often provides environmental advantages. The reason is that benefits of prevented food waste are usually much higher than environmental impacts of production or optimization of the packaging involved.
Conclusions (I) – version 2
Slide 14denkstatt 2017

2. In most cases the protective function of food packaging is more important than the impact of different packaging materials, also regarding their recyclability.
3. A high value of the product should be complemented by a high standard of packaging to ensure optimal product protection.
Conclusions (II)
Slide 15denkstatt 2017
4. Advantages of improved packaging solutions should be communicated along the value chain in a transparent way.
5. Intense communication and cooperation within all stakeholders in the value chain will support future optimization.
6. In follow-up projects additional examples shall be identifiedand assessed.

Design guidelines for a circular,
resource-efficient economy
Sustainable design “formula”:
+ optimised material productionx small material demand per functional unit
+ high functionality / quality /use-benefits
Slide 16denkstatt 2017
use-benefits
+ optimal recovery/recycling-mix (determined by CBAs!)
___________________________________________
= Low eco-footprint, economic & social impact
Priority for functionality,then raw material and recycling aspects

Quantitative assessment of the impacts of improved processing and packaging
A 3 year multi stakeholder project
October 2016 – September 2019
of improved processing and packagingon food waste reduction

Premium Partners
Active Partners
18
Supporting Partners
InKind Partners

Meat packaging• Vacuum packaging versus MAP (beef, pork; odour aspects)
Fruit and vegetables
• Tomatoes, strawberries, cut salad, etc.
(conventional vs. biodegradable films; gas mixtures and perforation; etc.)
Consumer level• Influence of packaging on food waste; effects of portion size;
Case studies
19
• Influence of packaging on food waste; effects of portion size;
awareness raising
Eggs
• Influence of different materials on fracture rate
Barrier design
• Avoiding over-performance (example coffee capsule & fresh juices);
recyclability versus protective function
Vegetable processing• Reducing food losses by improved processing)
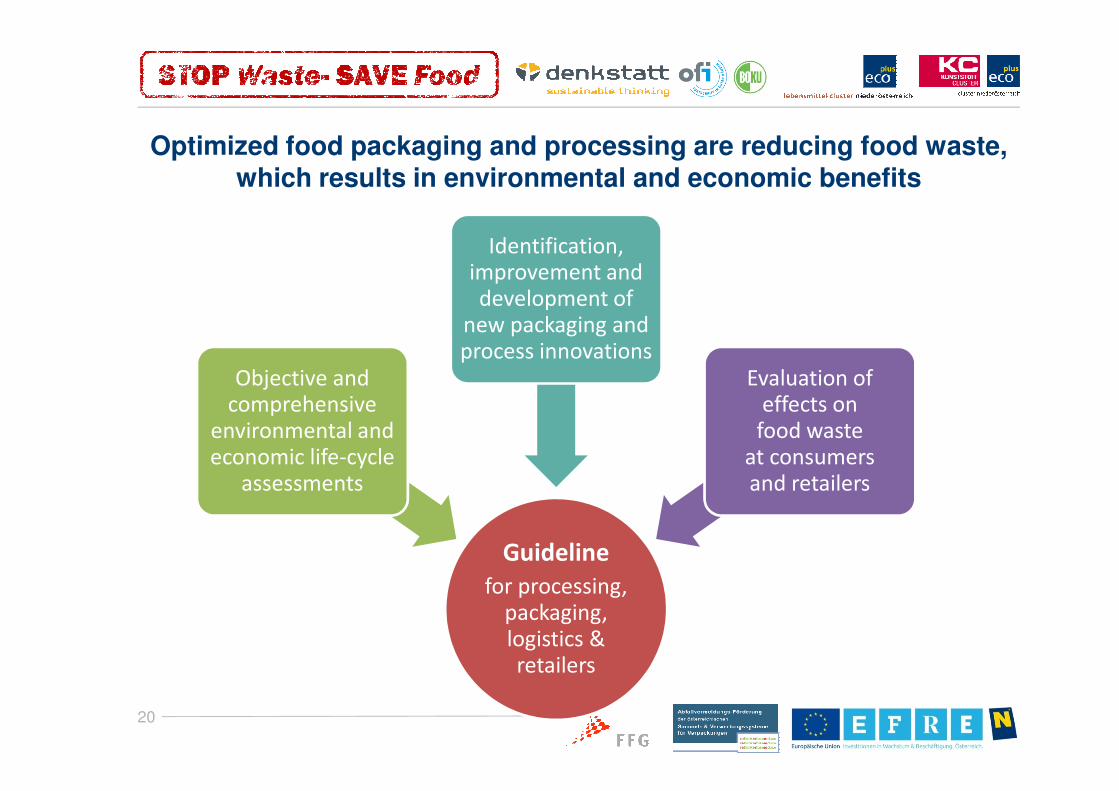
Optimized food packaging and processing are reducing food waste, which results in environmental and economic benefits
Objective and
comprehensive
Identification,
improvement and
development of
new packaging and
process innovations
Evaluation of
effects on
20
Guideline
for processing,
packaging,
logistics &
retailers
comprehensive
environmental and
economic life-cycle
assessments
effects on
food waste
at consumers
and retailers
We drive the change
to a sustainable society.
Slide 21denkstatt 2017
denkstatt GmbH · Hietzinger Hauptstraße 28 · A-1130 Wien · Austria
T (+43)1 786 89 00 F (+43)1 786 89 00-15 [email protected] www.denkstatt.at
Contact:
Katharina Aspalter [email protected]