Embed Size (px)
Citation preview

How Much Should a Firm Borrow?
• Student Presentations• Why M & M Does Not Hold
– Corporate Taxes– Personal Taxes– Financial Distress
• Pecking Order of Financing Choices

Corporate Taxes• Debt provides a tax shield
– Interest is tax deductible– Government’s share of income declines– Value of bondholders’ and stockholders’ share
increases
Present Value of Tax Shield• Present value of tax shield
• If debt is assumed to be a perpetuity
n
tt
D
Dc
r
DrTShieldTaxPV
1 )1(
)()(
DTr
DrTShieldTaxPV c
D
Dc )(
)(

Table 18.1: Comparison of Unlevered Firm and Levered Firm with $1000 of Debt at 8%

Compute the present value of the tax shield for a firm in the 35% tax bracket on the following debt issue:
1 year $1,000,000 loan at 8%
A) $25,926
B) $28,000
C) $35,000
D) $350,000
E) None of the above

Compute the present value of the tax shield for a firm in the 35% tax bracket on the following debt issue:
$1,000,000 perpetuity loan at 8%
A) $28,000
B) $80,000
C) $324,074
D) $350,000
E) None of the above

Claims on Firm
• Bondholders: Debt
• Government: Taxes
• Equityholders: Remainder of firm value

M&M and Taxes
Value of firm = Value of all-equity-financed firm + PV(tax shield)

Pfizer Balance Sheet 2004 and Adjusted for $1 billion Debt for Equity Trade
Net working capital 10,752 7,144 Long-term debt21,460 Other long-term liabilities
Long-term assets 86,900 69,048 EquityTotal assets 97,652 97,652 Total value
Net working capital 10,752 7,144 Long-term debtPV interest tax shield 2,500 21,460 Other long-term liabilitiesLong-term assests 283,373 268,021 EquityTotal assets 296,625 296,625 Total value
Book values
Market values
ACTUAL
ADJUSTED

What’s Wrong with Pfizer’s CFO?
• Should also consider personal taxes
• Cost of financial distress

Corporate and Personal Taxes
Relative tax advantage of debt vs. equity
If the relative advantage is > 1, debt is preferred
If the relative advantage is < 1, equity is preferred
incomeequityontaxPersonalT
erestontaxPersonalTLet
pE
p
int
)1)(1(
1
cpE
p
TT
T

Example – Advantage to Debt
Assume dividends are 40% of earnings
Each dollar of earnings generates $0.40 in dividends and $0.60 in capital gains
Marginal investor is in the 35% tax bracket on interest and 15% on dividends and capital gains
Deferral of capital gains reduces capital gains rate in half (to 7.5%)
%5.10)5.76(.)154(. xxTpE

Example - continued
Interest Equity Income
Income before tax $1 $1
Less corporate tax at Tc =.35 0 0.35
Income after corporate tax 1 0.65
Personal tax at Tp = .35 and Tpe = .105 0.35 0.068
Income after all taxes $0.675 $0.582
Advantage to debt= $ .068

Calculate the relative tax advantage of debt with personal and corporate taxes where:
TC = (Corporate tax rate) = 35%; TpE = Personal tax rate on equity income = 30% ;
Tp = Personal tax rate on interest income = 20% : A) 0.76
B) 1.16
C) 1.35
D) 1.76
E) None of the above

Given the following information, leverage will add how much value to the unlevered firm per dollar of debt?
Tc = 34% Tp = 30% TpE=20%
A) $0.66
B) $0.25
C) -$0.66
D) -$0.34
E) None of the above

Costs of Financial Distress
Value of firm = Value of all-equity-financed firm
+ PV(tax shield)
– PV(costs of financial distress)

Financial Distress
Debt
Mar
ket V
alue
of
The
Fir
m
Value ofunlevered
firm
PV of interesttax shields
Costs offinancial distress
Value of levered firm
Optimal amount of debt
Maximum value of firm

Types of Financial Distress• Bankruptcy costs
– Direct: legal and court costs– Indirect: Inefficient operations, creditors,
employees, suppliers, customers• Financial distress without bankruptcy• Incentives for a firm in difficulty
– Risk shifting– Refusing to contribute equity capital– Taking cash from firm– Delaying tactics– Bait and switch on use of funds from debt

Costs of Financial Distress by Asset Type
• Tangible assets unaffected by ownership– Real estate– Airplanes
• Intangible assets– Brand image– Technology– Human capital
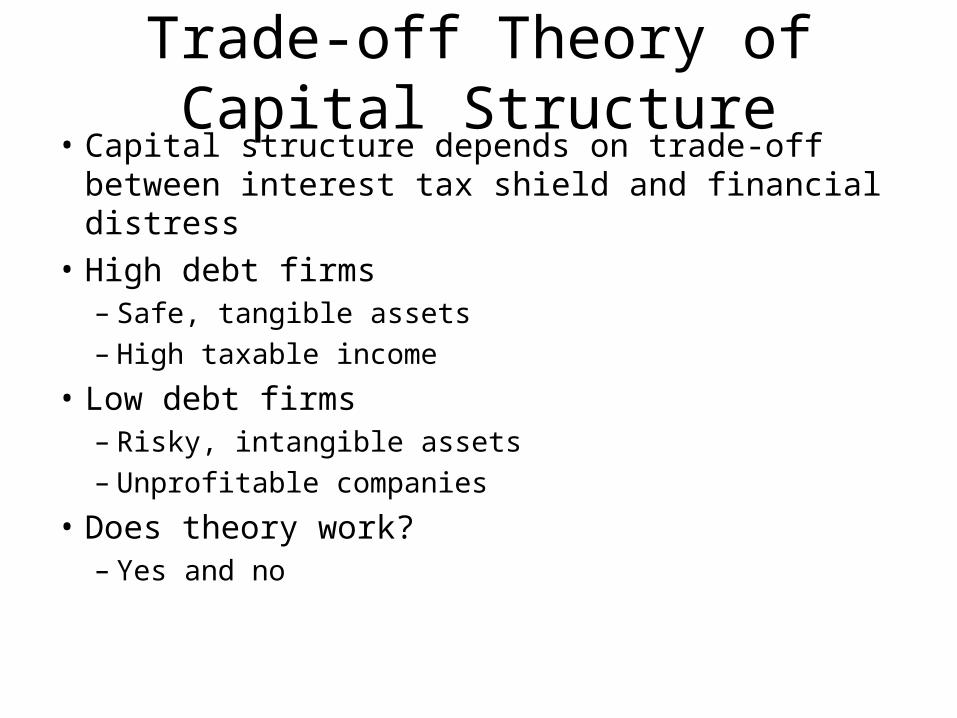
Trade-off Theory of Capital Structure• Capital structure depends on trade-off between interest
tax shield and financial distress
• High debt firms– Safe, tangible assets– High taxable income
• Low debt firms– Risky, intangible assets– Unprofitable companies
• Does theory work?– Yes and no

Pecking Order of Financing Choices
1. Firms prefer internal finance
2. Firms adapt payout targets to investment opportunities trying to avoid sudden changes
3. Sticky dividend policies and fluctuations in profitability and investment opportunities lead to cash flow shifts
4. If external finance is required, firms issue debt first, then equity

Tests of Pecking Order
1. Large firms tend to have higher debt ratios
2. Firms with high ratios of fixed assets to total assets have higher debt ratios
3. More profitable firms have lower debt ratios
4. Firms with higher ratios of book-to-market values have lower debt ratios

Next Class• Thursday, April 12
– Financing and Valuation – Chapter 19– Problem Set 3