Embed Size (px)
Citation preview

How much does Geography Influence LanguageVariation?
John Nerbonne
Center for Language and Cognition, University of Groningen
Language, Space and Geography III:26-28 Nov. 2009, Freiburg
John Nerbonne 1/32

Overview
Introduction to dialectometryLevenshtein distance
Examining the influence of geographyUnderstanding Seguy’s curve (distance)Incorporating areas
John Nerbonne 2/32

Why dialectometry?
Solve problems of earlier dialectologyNon-overlapping distributionsSelection of features too arbitrairy“Atomism” (Coseriu), idiosyncratic words (Bloomfield)
Introducing replicable proceduresFollowing Seguy, Goebl, Schiltz, Kretzschmar, Shackleton, ...
Aggregating over categorical variables (same vs. different)
Seeking law-like relations in linguistic variation
John Nerbonne 3/32

Beyond categorical differences: Levenshtein distance
Levenshtein distance enables analysis of phonetic transcriptionswithout manual alignment
—move from categorical to numerical analysis of data.One of the most successful methods to determine sequencedistance (Levenshtein, 1964)
biological molecules, software engineering, ...
Levenshtein distance: the minimum number of insertions,deletions and substitutions to transform one string into the other
John Nerbonne 4/32

Example of the Levenshtein distance
mO@lk@ delete @ 1mOlk@ subst. O/E 1mElk@ delete @ 1mElk insert @ 1mEl@k
4
m O @ l k @m E l @ k
1 1 1 1
John Nerbonne 5/32

Calculating dialect distances
To determine the aggregate distance between dialects:We determine the distance between each dialect pair for everysingle word (in sample, e.g. dialect atlas)We sum these distances for every word (hundreds of them) andcompare them
Besides dialect distances, this also yields interesting soundcorrespondences contained in the alignments (more on thatelsewhere)
Note that a 100-word comparison already yields about 500 soundcorrespondences
John Nerbonne 6/32

Example
Based on Dutch pronunciation data from theGoeman-Taeldeman-Van Reenen-Project data (GTRP; Goemanand Taeldeman, 1996)
We use 562 words for 424 varieties in the Netherlands
Wieling, Heeringa & Nerbonne (2007) An Aggregate Analysis ofPronunciation in the Goeman-Taeldeman-van Reenen-ProjectData. In: Taal en Tongval 59(1), 84-116
John Nerbonne 7/32

Distribution of sites
John Nerbonne 8/32

Analytical steps
Obtain the distances between each of the ≈ 90, 000 pairs ofvarieties
n.b. this involves 500× 52 segment comparisons≈ 1.1× 10⁹ segment comparisons in total
Organize these in a 400× 400 tableSeek groups (dialect areas) or continuum-like relations, e.g. byapplying clustering or multi-dimensional scaling, respectively
John Nerbonne 9/32

MDS map
John Nerbonne 10/32
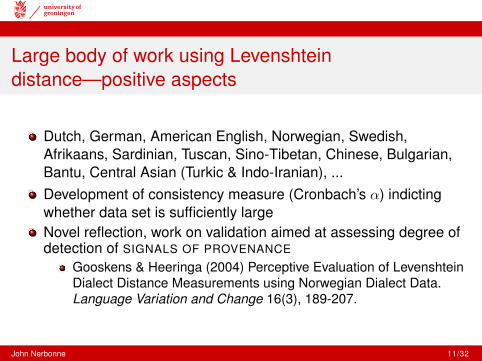
Large body of work using Levenshteindistance—positive aspects
Dutch, German, American English, Norwegian, Swedish,Afrikaans, Sardinian, Tuscan, Sino-Tibetan, Chinese, Bulgarian,Bantu, Central Asian (Turkic & Indo-Iranian), ...Development of consistency measure (Cronbach’s α) indictingwhether data set is sufficiently largeNovel reflection, work on validation aimed at assessing degree ofdetection of SIGNALS OF PROVENANCE
Gooskens & Heeringa (2004) Perceptive Evaluation of LevenshteinDialect Distance Measurements using Norwegian Dialect Data.Language Variation and Change 16(3), 189-207.
John Nerbonne 11/32

The Influence of Geography
Regression designDependent variable: varietal distance, as measured by aggregatecategorical distance or Levenshtein distanceIndependent variable: geographical distance, regarded as anoperationalization of the chance of social contactStatistical caution: correlations involving averages are muchhigher than correlations involving individual items
True, but we’re interested in the properties of entire varieties(dialects), not just in their individual features
John Nerbonne 12/32
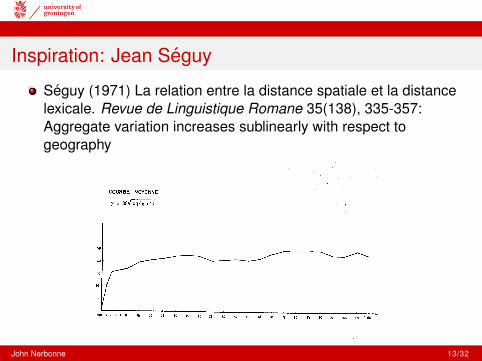
Inspiration: Jean Seguy
Seguy (1971) La relation entre la distance spatiale et la distancelexicale. Revue de Linguistique Romane 35(138), 335-357:Aggregate variation increases sublinearly with respect togeography
COURSE MOYENNE
Y = 36Vlog(x + 11
so
.0
J
10
1
~ 1. 6 . I) IS 10 1~ 30 3~ .0 .~ 50 55 60 ~ 10 1S 10 is 90 95 100 IDS 110
John Nerbonne 13/32
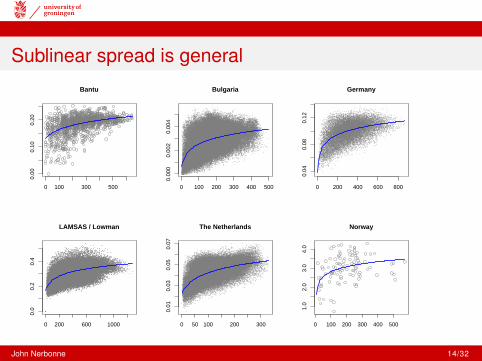
Sublinear spread is general
0 100 300 500
0.00
0.10
0.20
Bantu
0 100 200 300 400 500
0.00
00.
002
0.00
4
Bulgaria
0 200 400 600 800
0.04
0.08
0.12
Germany
0 200 600 1000
0.0
0.2
0.4
LAMSAS / Lowman
0 50 100 200 300
0.01
0.03
0.05
0.07
The Netherlands
0 100 200 300 400 500
1.0
2.0
3.0
4.0
Norway
John Nerbonne 14/32

Refuting Trudgill’s “Gravity hypothesis”
Moon
DeimosPhobos
Venus
Earth
Mars
Sun
According to Trudgill (1972) diffusion follows an inverse square
law, with the consequence that linguistic distance should likewise
increase with the square of the distance. Population size plays
the role of mass.
John Nerbonne 15/32

Trudgill’s “Gravity hypothesis”
Sublinear aggregate relation incompatible with a quadraticinfluence
J.Nerbonne (to appear) Measuring the Diffusion of Linguistic Change.Phil. Transactions of the Royal Society B
John Nerbonne 16/32
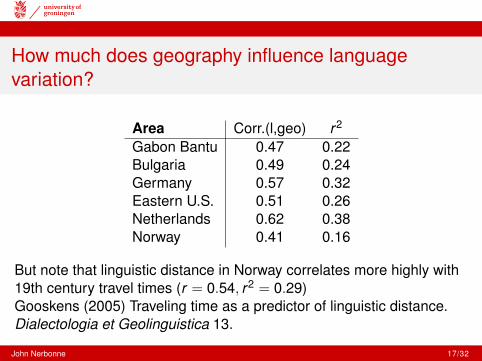
How much does geography influence languagevariation?
Area Corr.(l,geo) r2
Gabon Bantu 0.47 0.22Bulgaria 0.49 0.24Germany 0.57 0.32Eastern U.S. 0.51 0.26Netherlands 0.62 0.38Norway 0.41 0.16
But note that linguistic distance in Norway correlates more highly with19th century travel times (r = 0.54, r2 = 0.29)Gooskens (2005) Traveling time as a predictor of linguistic distance.Dialectologia et Geolinguistica 13.
John Nerbonne 17/32

Geography and language variation?
Geography accounts for 22− 38% of aggregate linguistic variation.General — sublinear — characterization of relation betweengeographical distance and linguistic differencesLike population geneticists’ “isolation by distance” (Wright, 1943;Malecot, 1955)
John Nerbonne 18/32

Wrede’s (1926-56) German Dialect Areas
Aachen
Adorf
Ahrbergen
Albersloh
AllnaAltenberg
Altentrüdingen
Altlandsberg
Altwarp
Astfeld Atzendorf
BardenflethBarßel
Bempflingen
Bennin
Benzingerode
Billingsbach
Bockelwitz
BonnBorstendorf
Breddin
Brelingen
Bremscheid
Brockhausen
Bruch
Burgrieden
Büdesheim
Clausthal
Cursdorf
Dexbach
Diekhusen
Dreeke
Ebertshausen
Ebstorf
Eichenhofen
Einöllen
Eisenbach
Endenburg−Lehnacker
Engelsbach
Engter
Ensheim
Eschelbronn
Eversen
Exdorf
Falkenthal
Freden
Frohnhausen
Gelting
Gerbstedt
Gersdorf
Gornsdorf
Gottsbüren
Gresenhorst
Groß Ballhausen
Groß Jamno
Groß Mohrdorf
Großwechsungen
Großenwiehe
Grünlichtenberg
Grünow
Götz
Haddorf
Hagen
Hammah
Hartenfels
Hartenstein
HelmersHerbornseelbach
Herdecke
Hermannsreuth
Hermeskeil
Herrentrup
Herßum
Herzfeld
Hesselteich
Hohenkörben
Hohwacht
Holmkjer
Horheim
Huddestorf
Hundisburg
Höchstädt
Hönebach
Iggingen
Igling
Iversheim
Jacobsdorf
Jeetzel
Jesteburg
Jever
Jonsdorf
Jürgenshagen
Kemmern
Kirch Kogel
Klafferstraß
Klein Rossau
Kleinbottwar
Kruft
Kuhstedt
Köln
LampertswaldeLandgrafroda
Langenbruck
LeuthLinz
Lippen
Lippramsdorf
Lohra
Lohrhaupten
Maibrunn
Mastershausen
Maxweiler
Mirow
Mockern
Mörshausen
Neu Schadow
Niederasphe
Niederauerbach
Niedernhausen
Nürnberg
Oberau
Oberhomberg
Obermaiselstein
Oberviehbach
Oberwürzbach
OdenspielOffdilln
Ohrdorf
Oiste
Orferode
Osterbruch
Osterfeld
Osterhagen
Ottowind
Peterskirchen
Pfaffenrot
Pielenhofen
Pretzsch
Pöttmes
Rammenau
Ramsau
Reelkirchen
Reetz
Ringgau−Röhrda
Rosenthal
Roßwein
Ruhlsdorf
Schachach
Schauenstein
Schellroda
Schmannewitz
Schnepfenbach
Schraden
Schwabstedt
Schömberg
Schönbeck
Seelbach
Siebenbach
Stöcken
Tann
Theuma
Treffelstein
Ulbering
Ungstein
Unterellen
Valdorf
Verchen
Vielbrunn
Vietmannsdorf
Volkershausen
Wangerooge
Warpe
Wasbek
Wasbüttel
Wehrsdorf
Weidenbach
Wemb
Wentorf
Weyhers
Wieda
Wildpoldsried
Winterspelt
Wittelsberg
Wolgast
Wüllen
Zellingen
John Nerbonne 19/32

Influence of Dialect Areas?
We add to the regression design variables indicating whether twovarieties belong to the same or different dialect areas.For example var56-dff has the value 1 if the two sitescompared differ in that one is in area 5 (Bavaria) and the other inarea 6 (Southwest)Do dialect areas contribute to the explanation of linguisticdifferences?
(Ongoing work.)
John Nerbonne 20/32

Influence of Dialect Areas?
Preliminary results: Dialect areas contribute substantially to theexplanation of aggregate linguistic distance. r2 increases fromabout 32% (based only on geographic distance) to about 45%(based on geographic distance and areal differencs).
(Ongoing work.)
John Nerbonne 20/32

How much does geography influence languagevariation?
Pure distance models explain 22% - 38% of aggregate linguisticvariation.Areal distinctions are somewhat collinear, but nonethless addsubstantially to simple models, perhaps as much as 50% (moving30% to 45%, for example).Naturally, there is also subdialectal variation (social, sexual,individual), but few systematic data collections.Emerging questions:
What is the linguistic structure of the dialect differences we find?Do typological constraints play a (confounding) role?Can we tease apart geographical and historical explanations, andhow?
John Nerbonne 21/32

Questions?
Thank You!
John Nerbonne 22/32
Criticisms of Levenshtein-based work
Binary segment distances too roughFrequent concern in Groningen (Heeringa Diss., 2004)
Segment distances based on phonetic features, phonologicalfeatures, canonical spectrogramsHigh correlation with rough measures when compared at aggregate(varietal) levelBut no substantial improvement in aggregate distance measures(validation wrt dialect speakers’ judgments)compare height measurements in in., cm, mm, µm
Difficult problem in general — due inter alia to fine detail inatlases, e.g., 1,300 different vowels in LAMSASNew procedure (Jelena Prokic) induces segment weights fromdata
John Nerbonne 23/32

Inducing segment distances
Sound correspondences were obtained using the Levenshteinalgorithm using a Pointwise Mutual Information procedure(Wieling et al., 2009; included in RuG/L04)
Levenshtein algorithm:
l E I k @ nl i k h 8 n
1 1 1 1
Segment distances based on Pointwise Mutual Information:
PMI(x , y) = log2
(p(x , y)
p(x) p(y)
)
John Nerbonne 24/32

Evaluating segment weight induction
Evaluation with respect to alignment correctness—more sensitive than aggregate correlations with judgments
50% less error using alignments with induced weightsCompetitive with sophisticated bio-informatic techniques from,(pair Hidden Markov Models)Future project: evaluate the segment weights against linguisticcriteria, compare weights induced from different data sets
Martijn Wieling, Jelena Prokic, & John Nerbonne “Evaluating thepairwise string alignments of pronunciations” LaTeCH-SHELT&R,2009.
John Nerbonne 25/32

Gabon Bantu
0 100 300 500
0.00
0.10
0.20
Bantu
Area: BantuData: 53 sites, 160 wordsSource: Van der Veen, LyonNote: Late settlement
John Nerbonne 26/32

Bulgaria
0 100 200 300 400 500
0.00
00.
002
0.00
4
Bulgaria
Area: BulgariaData: 482 sites, 54 wordsSource: Stoykov’s atlasNote: Long Turkish domination
John Nerbonne 27/32

Germany
0 200 400 600 800
0.04
0.08
0.12
Germany
Area: GermanyData: 186 sites, 201 wordsSource: Kleiner DeutscherLautatlas (Goschel)
John Nerbonne 28/32

LAMSAS / Lowman
0 200 600 1000
0.0
0.2
0.4
LAMSAS / Lowman
Area: Eastern Seaboard, USData: 357 sites, 145 wordsSource: Mid & South Atlantic,LAMSAS (Lowman)Note: Settlement in last 400 yr.
John Nerbonne 29/32

The Netherlands
0 50 100 200 300
0.01
0.03
0.05
0.07
The Netherlands
Area: The NetherlandsData: 424 sites, 562 wordsSource: Goeman-Taeldeman-van Reenen Atlas
John Nerbonne 30/32

Norway
0 100 200 300 400 500
1.0
2.0
3.0
4.0
Norway
Area: NorwayData: North Wind & Sun15 sites, 58 wordsSource:www.ling.hf.ntnu.no/nos
John Nerbonne 31/32

References
Inderjit Dhillon. 2001. Co-clustering documents and words using bipartite spectral graph partitioning. Proceedings of theseventh ACM SIGKDD international conference on Knowledge discovery and data mining, pp. 269–274. ACM New York.
Ton Goeman, and Johan Taeldeman. 1996. Fonologie en morfologie van de Nederlandse dialecten. Een nieuwemateriaalverzameling en twee nieuwe atlasprojecten. Taal en Tongval, 48:38–59.
Vladimir Levenshtein. 1965. Binary codes capable of correcting deletions, insertions and reversals. Doklady AdademiiNauk SSSR, 164:845–848.
Wilbert Heeringa. 2004. Measuring Dialect Pronunciation Differences using Levenshtein Distance. Ph.D. thesis,Rijksuniversiteit Groningen.
Martijn Wieling and John Nerbonne. 2009. Bipartite spectral graph partitioning to co-cluster varieties and soundcorrespondences in dialectology. In: Monojit Choudhury (ed.) Proceedings of the TextGraphs-4 Workshop at the 47thMeeting of the Association for Computational Linguistics, August 2009, Singapore. Available viahttp://www.martijnwieling.nl.
Martijn Wieling, Jelena Prokic, and John Nerbonne. 2009. Evaluating the pairwise string alignment of pronunciations. In:Lars Borin and Piroska Lendvai (eds.) Language Technology and Resources for Cultural Heritage, Social Sciences,Humanities, and Education (LaTeCH - SHELT&R 2009) Workshop at the 12th Meeting of the European Chapter of theAssociation for Computational Linguistics. Athens, 30 March 2009, pp. 26-34. Available via http://www.martijnwieling.nl.
John Nerbonne 32/32