Embed Size (px)
Citation preview
1
Antonio Pineda-LucenaInstituto de Investigación Sanitaria La Fe, Valencia, Spain
29/08/15
How metabolomics can contribute to our understanding of CDG pathophysiological mechanisms
2
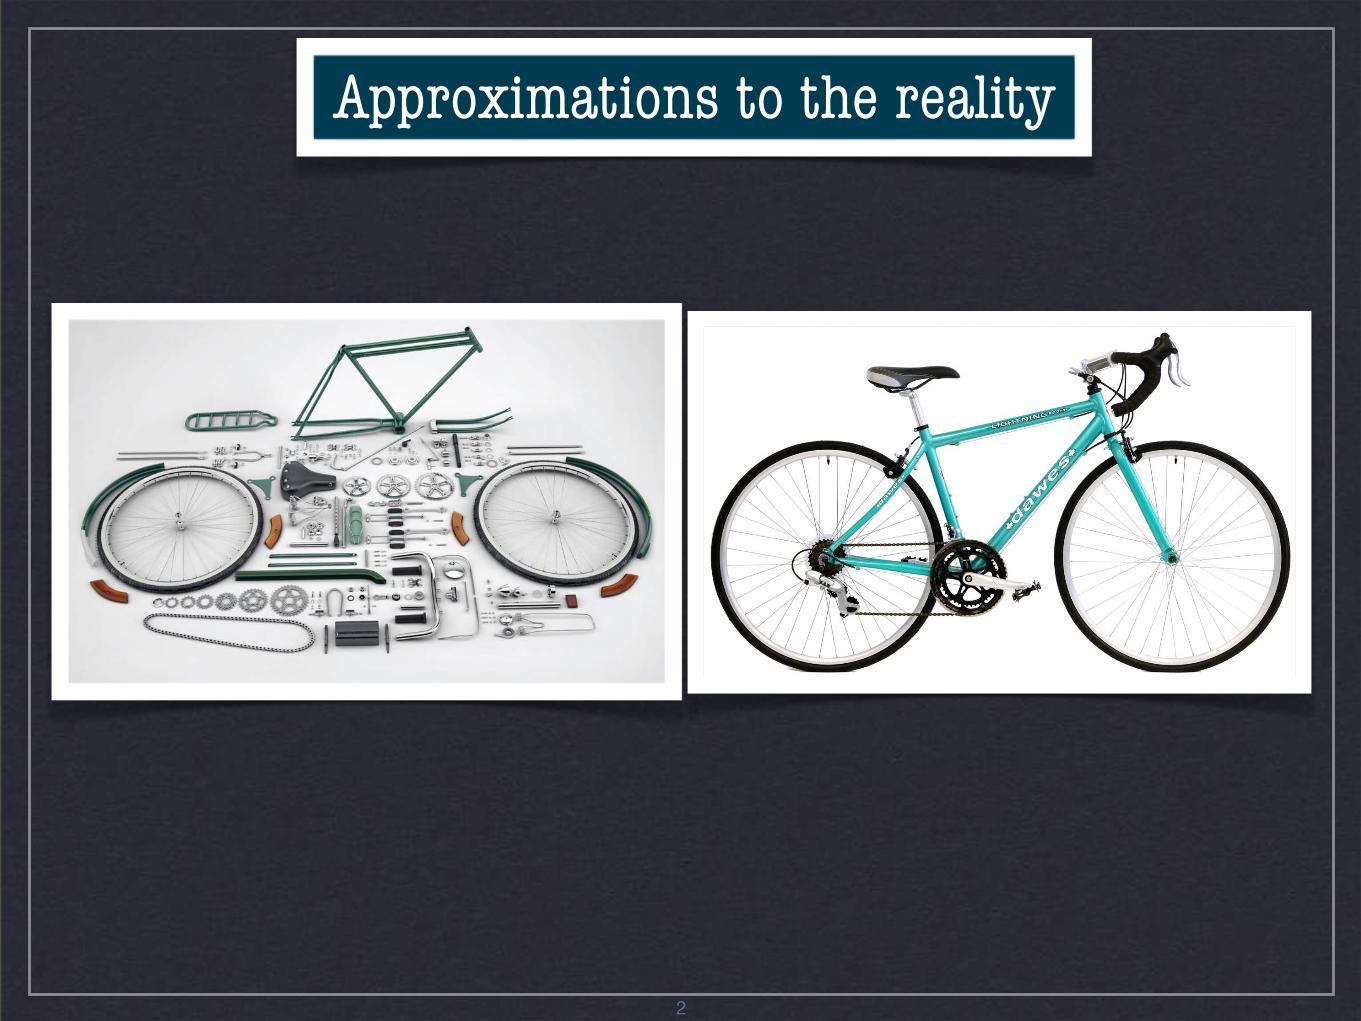
Approximations to the reality
3
NATURE REVIEWS | NEPHROLOGY ADVANCE ONLINE PUBLICATION | 3
presented and thus alter the effective allo specific precursor frequency. Thus, each patient can be considered a mosaic of alloimmune potential that is specific for a particular donor–recipient pair at a particular time and situation. Simply declaring the immune system as requiring suppres-sion defies the complexity inherent in the relevant biology; the concept of ‘immuno suppression’ should give way to deliberate and indivi dualized ‘immune modulation’.
The complexity of the immune responses after allo-transplantation can initially seem daunting. Development of an immune repertoire is fundamentally a random process and responsiveness toward any particular comple-ment of alloantigens can be considered equally stochas-tic. However, the aggregate threshold of alloimmune
responsiveness changes in reasonably predictable ways. In general, alloimmune responsiveness is greatest at the time of transplantation, and wanes with time. As the need for more intense immunosuppression wanes, the overall need for maintenance immuno suppression varies with two predominant variables—precursor frequency and memory. Precursor frequency relates to T-cell repertoire compatibility and is influenced most notably by HLA mis-match.21 Memory is a function of prior exposures, either to allo antigens or to sufficiently cross-reactive environmental antigens. These standard variables help to establish rational choices for therapeutic agents based on increasingly well-defined susceptibilities that individual immune cell types have to commonly available immunosuppressive drugs.
Chromosome
DNA
MeMe
Me
dsRNA
miRNA precursor
siRNA
miRNA
Pre-mRNA
mRNAAffect
translation
Affect transcription
Affect DNA repair/replication
Metabolism
Metabolite A
Membrane-bounde.g. transporters,receptors, channels
Metabolite Be.g. actin,
tubulin, collagen
Proteins
Histones
Nucleus Cytoplasm Plasmamembrane
(Epi-)genome Transcriptome MetabolomeProteome
Genetic profile Gene transcripts MetabolitesProteins
Extracellulare.g. hormones,antibodies
Intracellular
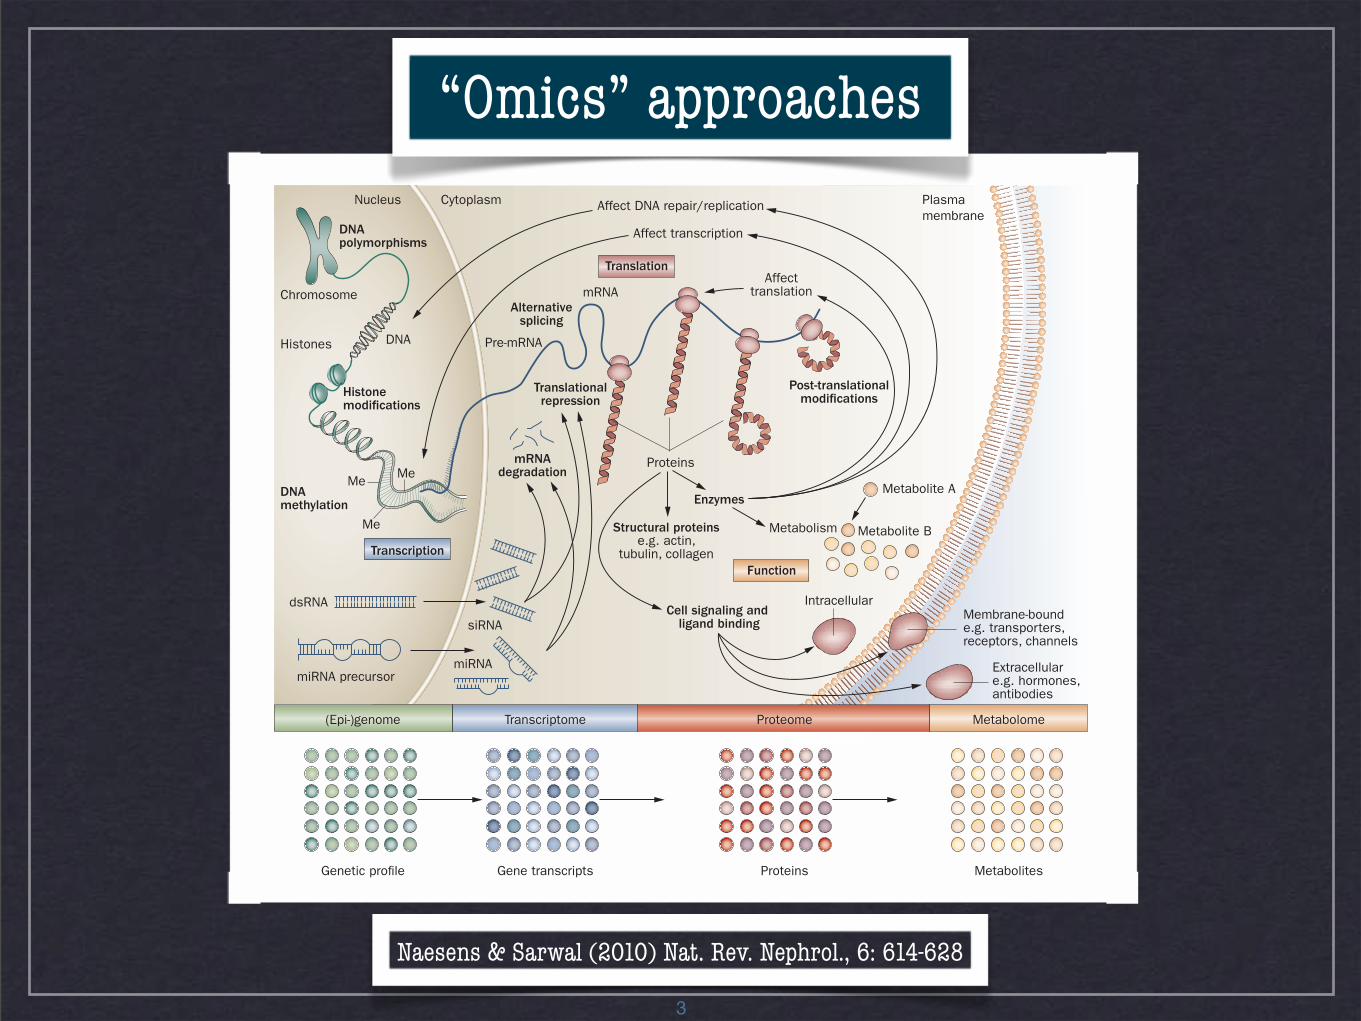
Figure 1 | Current paradigm of molecular biology. DNA is packed in chromosomes in tertiary structures defined by the histones. Histone modifications and DNA methylation are epigenetic factors that can influence the transcription process. DNA is transcribed into pre-mRNA, which is spliced into different mRNA molecules by alternative splicing. Noncoding RNAs, such as siRNA and miRNA, are also transcribed from DNA, and these small RNA fragments affect mRNA stability and regulate the translation of mRNA into proteins. In addition, post-translational modifications of proteins (for example, folding, cleavage, and chemical modifications) contribute greatly to the diversity of the proteome. These proteins can function as enzymes, affecting DNA repair or replication, the transcription process or translation, or can act as a catalyst for metabolic reactions. Proteins are also involved in cell signaling and ligand binding, and as structural elements. Each level interacts closely with the other level: protein–DNA and RNA–DNA interactions and chemical modifications of DNA that do not affect the primary DNA sequence also affect the molecular biological processes in cell systems. Each of these molecular biological processes can be studied with specialized omics tools—genomics/epigenomics, transcriptomics, proteomics and metabolomics—which study the complete sets of genes, transcripts, proteins and metabolites. Abbreviations: dsRNA, double-stranded RNA; Me, methylation; miRNA, microRNA; mRNA, messenger RNA; pre-mRNA, precursor messenger RNA; siRNA, small interfering RNA.
FOCUS ON TOLERANCE IN TRANSPLANTATION
© 20 Macmillan Publishers Limited. All rights reserved10
Naesens & Sarwal (2010) Nat. Rev. Nephrol., 6: 614-628
“Omics” approaches

Lindon et al. (2000) Concepts in Magnetic Resonance, 12: 289-320
4
Metabolomics approaches can characterize...
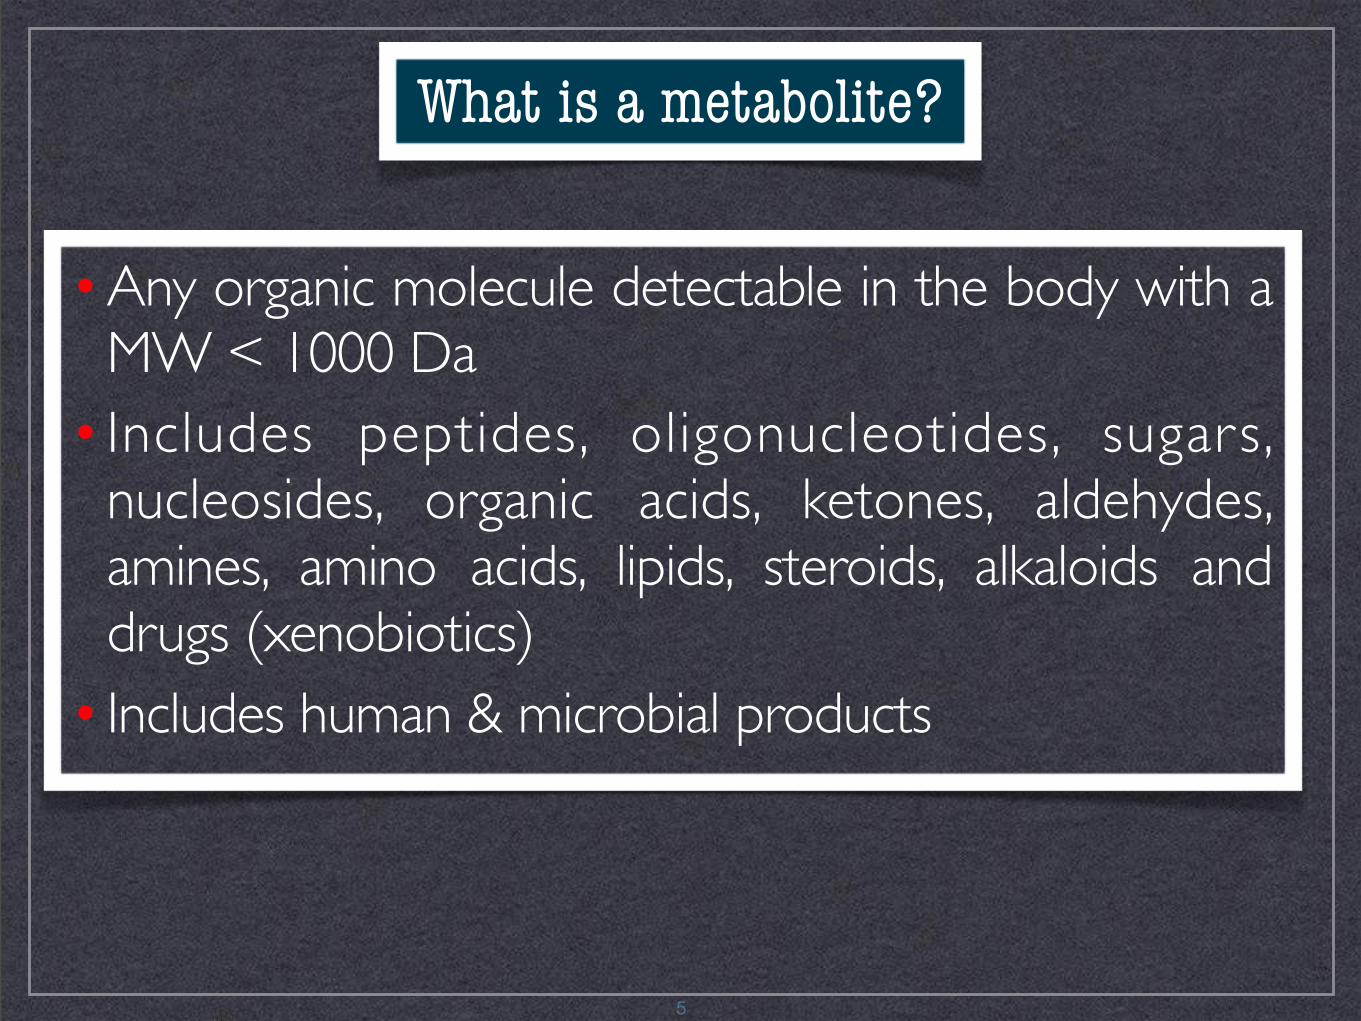
•Any organic molecule detectable in the body with a MW < 1000 Da
• Includes peptides, oligonucleotides, sugars, nucleosides, organic acids, ketones, aldehydes, amines, amino acids, lipids, steroids, alkaloids and drugs (xenobiotics)
• Includes human & microbial products
5
What is a metabolite?

6
Why study the metabolic composition?

FT Spectrum
Pulse effect
Chemical shift distribution
Free induction decay
Energy separation
7
How does NMR work?
8
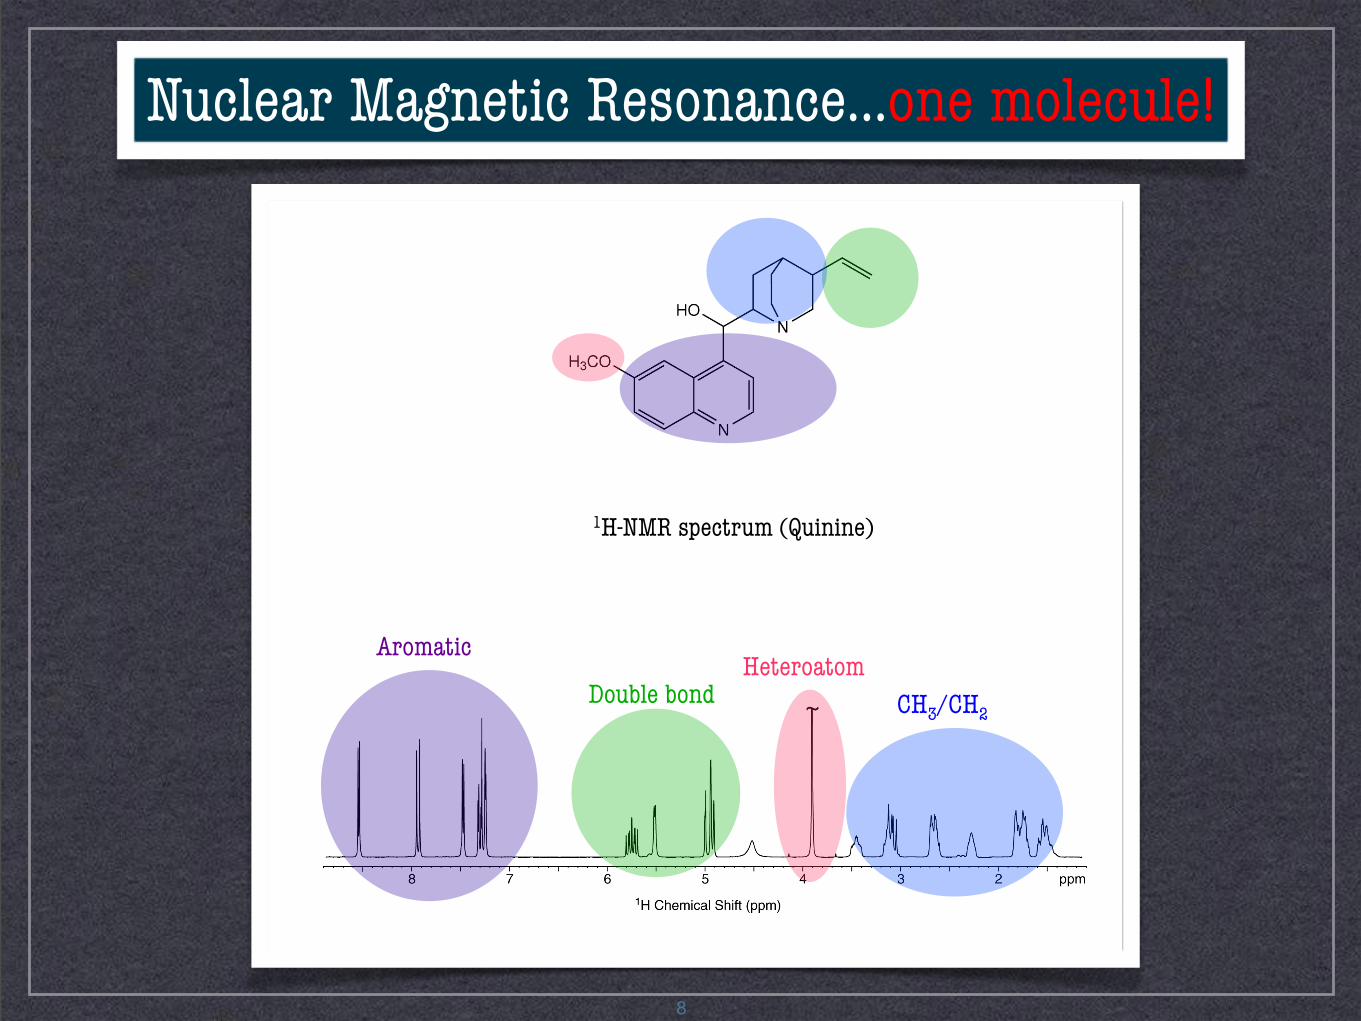
Aromatic Double bond
Heteroatom CH3/CH2
1H-NMR spectrum (Quinine)
Nuclear Magnetic Resonance...one molecule!

9
13
474 Representative 500 MHz 1H-NMR spectrum of urine sample from endometriosis 475 patient. The region corresponding to urea and water resonances have been excised from 476 the spectra. Metabolites assigned: 1, 2-hydroxyisovalerate; 2, butyrate/ethylmalonate; 3, 477 leucine/isoleucine; 4, valine; 5, isobutyrate/2-methylglutarate; 6, fucose; 7, 3-478 hydroxybutyrate/3-aminoisobutyrate; 8, methylmalonate; 9, 3-hydroxyisovalerate; 10, 479 threonine; 11, 2-hydroxyisobutyrate; 12, lysine; 13, alanine; 14, adipate; 15, citrulline; 480 16, arginine; 17, ornithine; 18, N-acetyl groups; 19, glutamine; 20, 2-hydroxyglutarate; 481 21, pyruvate; 22, citrate; 23, dimethylamine; 24, methylguanidine; 25, asparagine; 26, 482 trimethylamine; 27, creatinine; 28, choline; 29, glycerophosphocholine; 30, 483 trimethylamine-N-oxide; 31, taurine; 32, glycine; 33, serine; 34, guanidinosuccinate; 484 35, pseudouridine, 36, 3,4-dihydroxymandelate; 37, 3-methylhistidine; 38, histidine; 39, 485 indoxyl sulfate; 40, tryptophan; 41, phenylalanine/phenylacetylglycine; 42, hippurate; 486 43, 1-methylnicotinamide; 44, N1-Methyl-2-pyridone-5-carboxamide; 45, formate; 46, 487 N1-methyl-4-pyridone-5-carboxamide; 47, trigonelline. 488 489 490 491 492 493 494 495 496 497 498 499 500
������������������������������������������������
1
3
4
5
6
7
8
9
10
11
12
2
13
14
15
16
17
18
19
20
21
19
22 23
24
25
27 30
31
29
32
27
28
29
36 37
38
39
39,40
41
41
38
42
38
43
44 45
43 47
43
35
7
33
12,16,17
15
26
34
46
13
474 Representative 500 MHz 1H-NMR spectrum of urine sample from endometriosis 475 patient. The region corresponding to urea and water resonances have been excised from 476 the spectra. Metabolites assigned: 1, 2-hydroxyisovalerate; 2, butyrate/ethylmalonate; 3, 477 leucine/isoleucine; 4, valine; 5, isobutyrate/2-methylglutarate; 6, fucose; 7, 3-478 hydroxybutyrate/3-aminoisobutyrate; 8, methylmalonate; 9, 3-hydroxyisovalerate; 10, 479 threonine; 11, 2-hydroxyisobutyrate; 12, lysine; 13, alanine; 14, adipate; 15, citrulline; 480 16, arginine; 17, ornithine; 18, N-acetyl groups; 19, glutamine; 20, 2-hydroxyglutarate; 481 21, pyruvate; 22, citrate; 23, dimethylamine; 24, methylguanidine; 25, asparagine; 26, 482 trimethylamine; 27, creatinine; 28, choline; 29, glycerophosphocholine; 30, 483 trimethylamine-N-oxide; 31, taurine; 32, glycine; 33, serine; 34, guanidinosuccinate; 484 35, pseudouridine, 36, 3,4-dihydroxymandelate; 37, 3-methylhistidine; 38, histidine; 39, 485 indoxyl sulfate; 40, tryptophan; 41, phenylalanine/phenylacetylglycine; 42, hippurate; 486 43, 1-methylnicotinamide; 44, N1-Methyl-2-pyridone-5-carboxamide; 45, formate; 46, 487 N1-methyl-4-pyridone-5-carboxamide; 47, trigonelline. 488 489 490 491 492 493 494 495 496 497 498 499 500
������������������������������������������������
1
3
4
5
6
7
8
9
10
11
12
2
13
14
15
16
17
18
19
20
21
19
22 23
24
25
27 30
31
29
32
27
28
29
36 37
38
39
39,40
41
41
38
42
38
43
44 45
43 47
43
35
7
33
12,16,17
15
26
34
46
Vicente-Muñoz et al. (2015) Fertil. Steril., in press
Nuclear Magnetic Resonance...a biofluid!
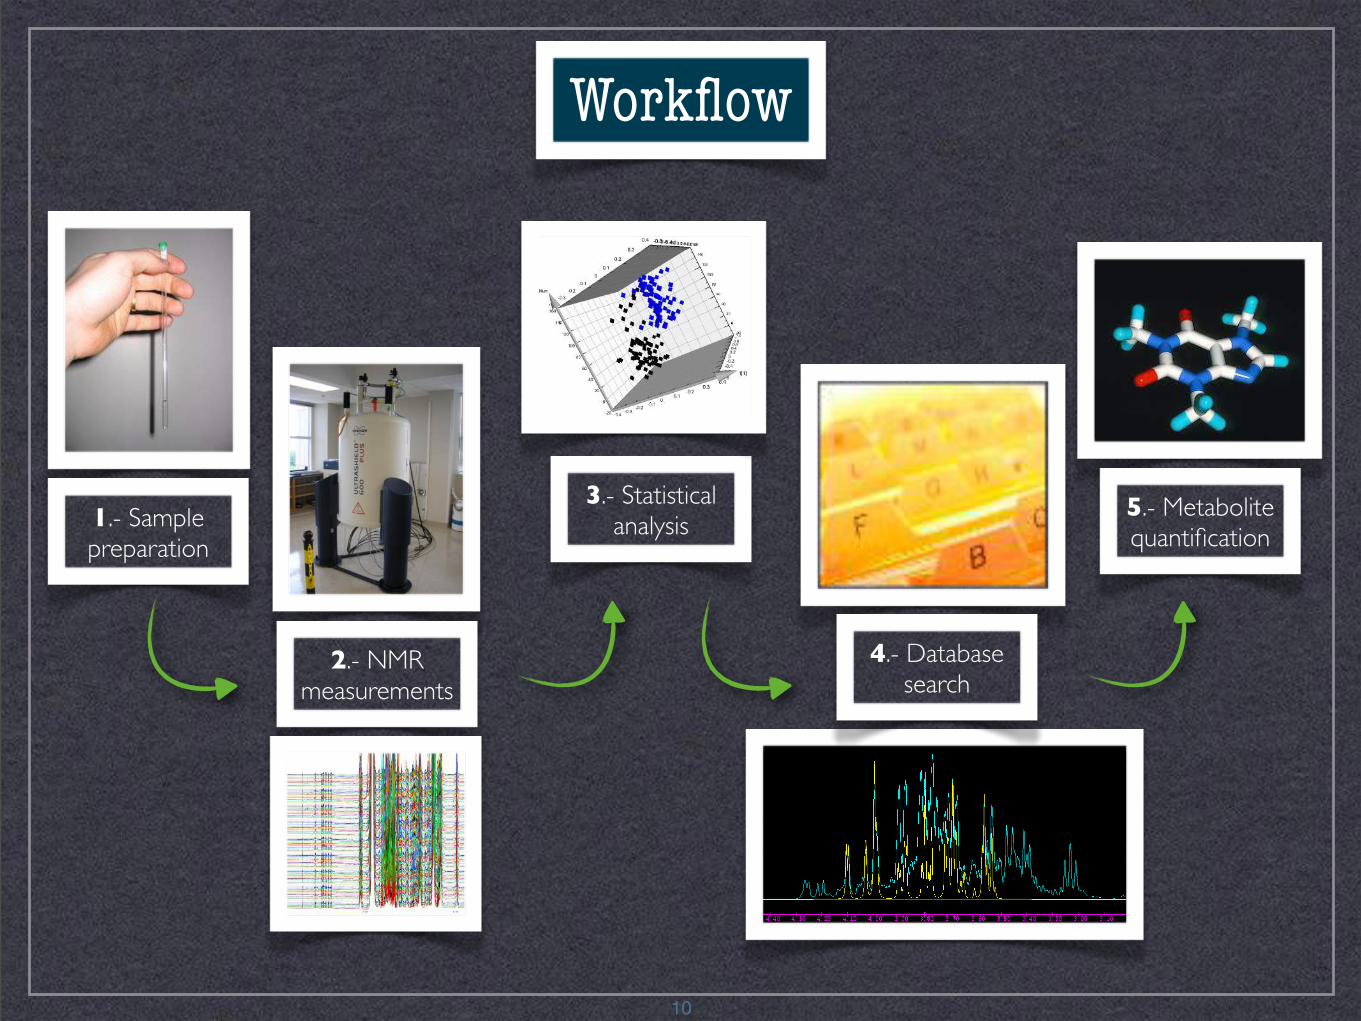
1.- Samplepreparation
2.- NMRmeasurements
3.- Statisticalanalysis
4.- Databasesearch
5.- Metabolitequantification
10
Workflow

11
Some applications...
...useful in the pharmaceutical industry and in the personalization of treatments
Puchades-Carrasco & Pineda-Lucena (2015) Curr. Opin. Biotechnol., 35: 73-77

12
Healthy aging
Endometriosis Prenatal origin diseases
Premature birth
Chromosomal abnormalities
In vitro fertilization
REPRODUCTIVE MEDICINE
BIOCHEMISTRY/PHARMACOLOGY
Stem cell differentiation
Yeast metabolismPlant metabolism
Drug mechanism of action
Multiple Myeloma
Chronic Lymphocytic Leukemia
HEMATOONCOLOGY/SOLID TUMORS
Prostate cancer
Melanoma Lung cancer
PATHOLOGIES
Cardiac ischemia
Ofthalmological diseases
Minimal hepatic encephalopathy
Tuberculosis
Metabolomics collaborations

13
BIOCHEMICAL APPLICATIONSInsights into the molecular mechanisms

14
Doxorubicin is a drug used in cancer chemotherapy. It is an anthracycline antibiotic, and works by intercalating DNA, with the most serious adverse effect being life-threatening heart damage. However, a copolymer-doxorubicin termed PK1 shows a four- to fivefold reduction in anthracycline-related toxicity, and even at high doses, no cardiotoxicity is observed.
! !
OPLS-DA analysis in MCF7 cell extracts, untreated and treated with high and low doses of doxorubicin (DOX)
OPLS-DA analysis in MCF7 cell extracts, untreated and treated with high and low doses of PK1
(In collaboration with the Lab of Polymer Therapeutics, CIPF)
Understanding the mechanism of action of antineoplastic drugs

Metabolic Profiles from unconditioned TeSR-1 (black) and CMp11 (blue)
Changes in the metabolic profile of CMp11 during a time course of 3 days
15
Characterisation of Human Embryonic Stem CellsConditioning Media by 1H-Nuclear Magnetic ResonanceSpectroscopyDavid A. MacIntyre1¤a, Darıo Melguizo Sanchıs2, Beatriz Jimenez1, Ruben Moreno2, Miodrag
Stojkovic2¤b, Antonio Pineda-Lucena1*
1 Structural Biochemistry Laboratory, Centro de Investigacion Prıncipe Felipe, Valencia, Spain, 2Cellular Reprogramming Laboratory, Centro de Investigacion Prıncipe
Felipe, Valencia, Spain
Abstract
Background: Cell culture media conditioned by human foreskin fibroblasts (HFFs) provide a complex supplement of proteinand metabolic factors that support in vitro proliferation of human embryonic stem cells (hESCs). However, the conditioningprocess is variable with different media batches often exhibiting differing capacities to maintain hESCs in culture. Whilerecent studies have examined the protein complement of conditioned culture media, detailed information regarding themetabolic component of this media is lacking.
Methodology/Principal Findings: Using a 1H-Nuclear Magnetic Resonance (1H-NMR) metabonomics approach, 32metabolites and small compounds were identified and quantified in media conditioned by passage 11 HFFs (CMp11). Anumber of metabolites were secreted by HFFs with significantly higher concentration of lactate, alanine, and formatedetected in CMp11 compared to non-conditioned media. In contrast, levels of tryptophan, folate and niacinamide weredepleted in CMp11 indicating the utilisation of these metabolites by HFFs. Multivariate statistical analysis of the 1H-NMRdata revealed marked age-related differences in the metabolic profile of CMp11 collected from HFFs every 24 h over 72 h.Additionally, the metabolic profile of CMp11 was altered following freezing at 220uC for 2 weeks. CM derived from passage18 HFFs (CMp18) was found to be ineffective at supporting hESCs in an undifferentiated state beyond 5 days culture.Multivariate statistical comparison of CMp11 and CMp18 metabolic profiles enabled rapid and clear discrimination betweenthe two media with CMp18 containing lower concentrations of lactate and alanine as well as higher concentrations ofglucose and glutamine.
Conclusions/Significance: 1H-NMR-based metabonomics offers a rapid and accurate method of characterising hESCconditioning media and is a valuable tool for monitoring, controlling and optimising hESC culture media preparation.
Citation: MacIntyre DA, Melguizo Sanchıs D, Jimenez B, Moreno R, Stojkovic M, et al. (2011) Characterisation of Human Embryonic Stem Cells Conditioning Mediaby 1H-Nuclear Magnetic Resonance Spectroscopy. PLoS ONE 6(2): e16732. doi:10.1371/journal.pone.0016732
Editor: Costanza Emanueli, University of Bristol, United Kingdom
Received October 25, 2010; Accepted December 28, 2010; Published February 9, 2011
Copyright: ! 2011 MacIntyre et al. This is an open-access article distributed under the terms of the Creative Commons Attribution License, which permitsunrestricted use, distribution, and reproduction in any medium, provided the original author and source are credited.
Funding: DAM is a Marie Curie International Incoming Fellow (PIIF-GA-2008-221484). BJ is supported by a Fondo de Investigacion Sanitario from Instituto deSalud Carlos III (ISCIII) Sara Borrell grant (CD2006/00133). The funders had no role in study design, data collection and analysis, decision to publish, or preparationof the manuscript.
Competing Interests: The authors have declared that no competing interests exist.
* E-mail: [email protected]
¤a Current address: Institute of Reproductive Developmental Biology, Department of Surgery and Cancer, Imperial College London, Hammersmith HospitalCampus, London, United Kingdom¤b Current address: SPEBO MEDICAL, Leskovac, Serbia and Human Genetics, Medical Faculty, University of Kragujevac, Kragujevac, Serbia
Introduction
Human embryonic stem cells (hESCs) harbor the capacity todifferentiate into all primary human cell types [1,2,3] and can becultivated in vitro indefinitely under specified culture conditions [4].This endowers them with the potential to provide an ongoingsource of cells for the study of early human development, diseasestates as well as for applications in drug screening and regenerativemedicine [5,6,7]. Undifferentiated hESCs are difficult to expandin culture without the presence of different types of fibroblasts [3]or high concentration of different growth factors [8]. However,concerns regarding cross-species virus transfer and subsequentcompatibility for therapeutic applications [9,10,11,12] have led to
hESCs being typically maintained on human fibroblast feeders oron naturally derived matrices supplemented with media condi-tioned by fibroblasts [13,14,15]. Intuitively, fibroblasts likelysecrete a plethora of factors critical for the proliferation andmaintenance of hESCs in vitro.In practice, the preparation of HFF conditioned media (CM) is
variable and batches of media often exhibit differing capacity tomaintain hESC proliferation in vitro. Currently this informationcannot be garnered until days after initiating the culturingprocedure. Consequently, a number of recent studies haveattempted to identify protein factors secreted by mouse andhuman feeder fibroblasts produced during the conditioningprocess [16,17,18,19] with the ultimate goal of creating a fully
PLoS ONE | www.plosone.org 1 February 2011 | Volume 6 | Issue 2 | e16732
Exo-metabolome applications: Stem cells conditioning media

16
CDGs: Cell models
somewhat later [35]. A variable portion of LLO can also be hydro-lyzed producing free oligosaccharides. Protein-bound N-glycanscan undergo extensive mannose trimming, liberating free mannosewithin the ER and Golgi. Misfolded glycoproteins in the ER that failto pass quality control are retro translocated into the cytoplasmand stripped of their glycans, which are further degraded in thecytoplasm and lysosome yielding free mannose [36–38] (Fig. 2).
4.1. Metabolic fate of mannose
Since 1979, the vast majority of biosynthetic studies have used[2-3H]-Man as tracer to determine mannose incorporation intomultiple glycosylation pathways. Following phosphorylation to[2-3H]-Man-6-P, any further catabolism involves isomerization atthe C2 position and release of 3HOH, which is immediately dilutedinto an ocean of H2O. 3HOH release provides an approximate mea-sure of [2-3H]-Man catabolism and has been used as a sensitivein vitro and live cell measure of MPI activity [2,39]. However, thislabel cannot address the mannose fate beyond Man-6-P. Morerecent studies show that mannose catabolism is nearly identicalto glucose [40].
In mammalian cells, 95–98% of mannose entering the cell viatransporters is catabolized via MPI and only !2% is used for N-gly-cosylation [13,19]. Labeling hepatoma cells with [2-3H]-Manshows incorporation into Man-6-P and Man-1-P within a few sec-onds and into GDP-Man within 5 min. 3H-labeled LLOs and free oli-gosaccharides reach a steady state in 15 min and 30 minrespectively [19]. Chasing [2-3H]-Man-labeled cells under physio-logical conditions of 5 mM glucose and 50 lM mannose showedthat LLO turns over with a t1/2 = 15 min and more than 50% 3H-from cellular glycoproteins is released in first 1–2 h (glycan pro-cessing) followed by much slower rate of decrease (glycoproteinsecretion or turnover) over the next 4 h.
Surprisingly, mannose released by N-glycan processing ishandled differently than mannose entering the cell. N-glycanprocessing mannose is shielded from hexokinase and transportedoutside the cell as free mannose, using an unidentified,
nocodazole-sensitive transporter [19]. The reason for these sepa-rate tracks for intracellular mannose is unknown, but cells mayneed to purge mannose to avoid glycation or accumulation of othertoxic products. Calculations estimate that the quantity of mannoseexported from cells is sufficient to account for the steady statelevel of mannose in plasma [19].
Comparison of [14C]-glucose and [2-3H]-Man incorporation attheir physiological concentrations (5 mM and 50 lM, respectively),suggested that cells derive most mannose from glucose [19]. Werecently used 13C or 2H stable isotopes to label mannose in N-gly-cans and determine whether it originated from glucose (ManG) orfrom mannose (ManM). Incorporated sugars in N-glycans arereleased, hydrolyzed, derivatized and the different fragmentsdetected by GC–MS [40]. The general picture agrees with theresults of radiolabeling, but the stable isotopes provide a muchmore precise quantitation.
In some cell lines, exogenous mannose can normally contributeup to 50% of the mannose to N-glycans when provided at theirphysiological concentrations. Mannose is far more efficiently uti-lized than glucose: 1.8% of transported mannose appears in N-gly-cans, but only 0.026% of transported glucose. At physiologicalconcentration of 50 lM, mannose is undetectable in galactose(Gal) or N-acetyl glucosamine (GlcNAc) of N-glycans or glycogen.At 1 mM, mannose becomes the sole source of mannose in N-gly-cans (ManM), and is easily detected in Gal and GlcNAc in N-glycans[40]. At this high concentration, most is catabolized to pyruvate,lactate and alanine, but not found in glycogen. This result suggeststhat glucose and mannose do not have equal access to the glycogenbiosynthesis apparatus [40] implying despite their similarities,they may exist in distinct pools.
4.2. Other sources of mannose in N-glycans
Glucose-derived Man in N-glycans (ManG) uses an MPI-depen-dent reaction that requires exchange of an H at C2 [40] (Fig. 3).In the presence of D2O, D is introduced at C2 [40]. Using thismethod, we found that mannose cannot be derived from glycogen
Lysosome
CytoplasmGlycan processingin ER and golgi
Glycan degradationin cytoplasm andlysosomes
Misfoldedprotein
PNGaseF
cytoplasmicmannosidase
Proteosome
GolgiER
OSTSec 61
flipase
Mannose
Glucose
N-acetyl gluco-samine
Protein
Glycan transport
Mannose exit
Unknown transporter in cell membrane
Unknown transporter in lysosome
Unknown transporter in ER
Fig. 2. Generation of free mannose inside the cell by processing and degradation.
222 V. Sharma et al. / Biochemical and Biophysical Research Communications 453 (2014) 220–228
Sharma et al. (2014) BBRC, 453: 220-228
- Evaluate cell metabolism under normal or pathological situations- Test hypotheses about the involvement of specific enzymes- Evaluate nutritional or pharmacological treatments

17
CDGs: Taking advantage of the fluxes
Bayet-Robert & Morvan (2013) PLoS ONE, 8: e57971
When mannose became an effective therapeutic for glycosyla-tion-deficient patients [2], it called for a more in-depth under-standing of mannose metabolism at both the cellular andorganismic levels. Mannose can be a life saving therapeutic and anon-antibiotic treatment for selected bacterial infections [3], butin other situations it can be lethal [4] or teratogenic [5], underscor-ing the importance of stringent regulation of mannose metabolism.In this review, we will discuss mannose origins, metabolism, fate incells, animals and humans, and its therapeutic applications.
2. Mannose chemistry
D-Mannose is the 2-epimer of glucose and exists primarily assweet-tasting a-(67%) or as a bitter-tasting b-(33%) anomer ofthe pyranose [6,7]; furanose forms comprise <2%. Mannose is!5x as active as glucose in non-enzymatic glycation [8], whichmay explain why evolution did not favor it as a biological energysource. In the laboratory, mannose can be generated by oxidationof mannitol or by base-catalyzed epimerization of glucose throughfructose [9]. L-Mannose is not normally used in biological systems;however, its structural similarity to naturally occurring L-rham-nose enables some plant enzymes to use L-mannose as an unnatu-ral substrate in vitro [10]. Mutant strains of Aerobacter aerogenescan use it as a sole carbon and energy source [11].
3. Occurrence, origins and dietary sources of mannose
Mannose occurs in microbes, plants and animals. Free mannoseis found in small amounts in many fruits such as oranges, applesand peaches [12] and in mammalian plasma at 50–100 lM [13].More often, mannose occurs in homo-or hetero-polymers such asyeast mannans (a-mannose) where it can account for nearly 16%of dry weight [14] or in galactomannans [15]. Ivory nuts, composedof b-mannans (sometimes called vegetable ivory) are quite hardand used for carving and manufacturing buttons. In fact, ivorynut shavings were the original industrial source of mannose [16].
Coffee beans, fenugreek and guar gums are rich sources of galacto-mannans [17], but these plant polysaccharides are not degraded inthe mammalian GI tract and, therefore, provide very little bio-available mannose for glycan synthesis. These polysaccharidesare partially digested by anaerobic bacteria in the colon [18]. Smallamounts of bio-available mannose occur in glycoproteins.
4. Mannose metabolism in cells
Mannose is transported into mammalian cells via facilitateddiffusion hexose transporters of the SLC2A group (GLUT) presentprimarily on the plasma membrane. Various cell lines transport6.5–23.0 nmols/hr/mg protein [19], but no mannose-specific or -preferential transporters have been reported among the 14 distinctGLUT transporters found in humans [20]. Most studies of GLUTsubstrate specificity assess only transport of glucose and fructose,but very rarely mannose transport. Several reports describeSGLT-like mannose transporters in the intestine and kidney, wherethey could deliver free mannose from the diet or recover it fromthe urine [21]. To date, there is no evidence for the physiologicalimportance of these transporters. Within the cell, mannose is phos-phorylated by hexokinase (HK) to produce mannose-6-phosphate(Man-6-P), which serves as a common substrate for threecompeting enzymes. It is either catabolized by phosphomannoseisomerase (MPI) or directed into N-glycosylation via phosphoman-nomutase (PMM2). Another minor pathway utilizes mannose forsynthesis of 2-keto-3-deoxy-D-glycero-D-galacto-nononic acid(KDN), a sialic-acid related molecule found in fish and mammals[22] (Fig. 1). The fate of Man-6-P largely depends on the ratio ofMPI to PMM2 within a cell [19] – higher ratio leads to greatercatabolism, while lower ratio favors the glycosylation pathway.PMM2-derived mannose-1-phosphate (Man-1-P) is then incorpo-rated into several glycosylation intermediates including GDP-man-nose (GDP-Man), GDP-fucose, and dolichol phosphate mannose(Dol-P-Man). These intermediates then contribute to N-glycosyla-tion, O-glycosylation, C-mannosylation, and GPI anchor synthesis(Fig. 1).
GPI anchors play a significant role in protein sorting, traffickingand dynamics. All GPI-anchors share a common core structure H2-
N(CH2)2OPO3H-6Mana1->2Mana1->6Mana1->4GlcNa1->6Myo-Ino1-phospholipid [23]. The mannosyltransferases use Dol-P-Man.O-Mannose-based glycans are well known in yeast [24], but onlyidentified 35 years ago in a mixture of unidentified brain proteo-glycans [25]. Now, it is known that ER resident Protein O-mannosyltransferases 1 and 2 (POMT1 and POMT2) use Dol-P-Man to addmannose to serine and threonine residues, and the glycan is furtherextended by other monosaccharides in ER and Golgi [26]. Func-tional mutations in O-Mannose glycosylation are known to causemuscular dystrophies called a-dystroglycanopathies, since themajor substrate protein is a-dystroglycan [27]. More recent studiesshow that a series of cadherins are also major carriers of O-man-nose glycans [28]. C-mannosylation also uses Dol-P-Man to addmannose to C2 of tryptophan. The C-mannosyl transferase in theER recognizes a consensus motif WXXW [29]. GPI anchors, O-and C-mannosylation have been reviewed extensively [29–33].Since the majority of mannose is used for N-glycosylation, we willfocus on it.
Mannose is the major monosaccharide component of N-glycansand relies on ample supply of Man-6-P, Man-1-P, GDP-Man, andDol-P-Man for synthesis of lipid linked oligosaccharides (LLOs).The first five mannose residues are added on the cytoplasmic faceof ER using GDP-Man. The glycan is then flipped to the luminal sidevia a flippase [34] and extended by four more mannose residuesand glucose. This Man9Glc3GlcNAc2 glycan is transferred to newlysynthesized proteins soon after they emerge from the translocon or
HK
KPS
KDN-9-P
KDN glycansMan-6-P
Man-1-P
GDP-Man
Dol-P-ManLipid linkedoligosachharide
N-glycosylation
O-mannosylation
GPI-anchors
C-mannosylation
Man
Glc Glc-6-P
Glycogen Glycolysis
MPI
PMM2
GMPPA/GMPPB
HK
Fru-6-PPGI
DPM1DPM2DPM3MPDU1
Fig. 1. Mannose metabolic pathway: Man, mannose; Glc, glucose; HK, hexokinase;MPI, phosphomannose isomerase; PMM2, phosphomannomutase; GMPP (A/B),GDP-mannose pyro-phosphorylase (A/B); PGI, phosphoglucose isomerase; KPS,KDN-9-phosphate synthase; Man-6-P, mannose-6-phosphate; Fru-6-P, fructose-6-phosphate, Glc-6-P, glucose-6-phosphate; GDP-Man, GDP-mannose; Dol-P-Man,dolichol phosphate mannose; DPM, Dol-P-Man synthase.
V. Sharma et al. / Biochemical and Biophysical Research Communications 453 (2014) 220–228 221
Sharma et al. (2014) BBRC, 453: 220-228
Metabolic fluxes provide an oppotunity to design new strategies that can be tailored to specific pathophysiological processes

18
CLINICAL APPLICATIONSOpportunities for diagnosis, prognosis and treatment
monitoring

Focus: The discovery of metabolomic biomarkers that could facilitate the early diagnosis of lung cancer using biofluids (peripheral blood). Collaboration between the SBL@CIPF and the Medical Oncology Service at the Hospital General de Valencia.
1H NMR (1D-CPMG) spectrum of a serum sample obtained from a LC patient
���������������������������
��� ��������������������������������������������� ��
������������������������������
NMR metabolomic profile of LC patients
Biomarker Id associated to LC stages
Evaluation of differences btw early & advanced LC
1
3
2
CONTROLLC (early)
LC (advanced)
-35
-30
-25
-20
-15
-10
-5
0
5
10
15
20
-9 -8 -7 -6 -5 -4 -3 -2 -1 0 1 2 3 4 5 6 7 8 9 10
to[1
]
t[1]
BT2_LC_SAI_Scaling_0.04_050812_UV.M25 (OPLS/O2PLS-DA), OPLS todas las muestras C/LC UV (AS reducido)
t[Comp. 1]/to[XSide Comp. 1]
Colored according to Obs ID (grupo)
R2X[1] = 0.0580012 R2X[XSide Comp. 1] = 0.395265
Ellipse: Hotelling T2 (0.95)
AS
C
ES
SIMCA-P+ 12.0.1 - 2012-10-16 18:50:48 (UTC+1)
-30
-25
-20
-15
-10
-5
0
5
10
15
20
-9 -8 -7 -6 -5 -4 -3 -2 -1 0 1 2 3 4 5 6 7 8 9
to[1
]
t[1]
BT2_LC_SAI_Scaling_0.04_050812_UV.M10 (OPLS/O2PLS-DA), OPLS todas las muestras C/ES UV
t[Comp. 1]/to[XSide Comp. 1]
Colored according to Obs ID (grupo)
R2X[1] = 0.0569448 R2X[XSide Comp. 1] = 0.405911 Ellipse: Hotelling T2 (0.95)
C
ES
SIMCA-P+ 12.0.1 - 2012-10-16 19:01:29 (UTC+1)
-25
-20
-15
-10
-5
0
5
10
15
20
25
30
-10 -9 -8 -7 -6 -5 -4 -3 -2 -1 0 1 2 3 4 5 6 7 8 9 10
to[1
]
t[1]
BT2_LC_SAI_Scaling_0.04_050812_UV.M27 (OPLS/O2PLS-DA), OPLS todas las muestras C/AS UV (AS reducido)
t[Comp. 1]/to[XSide Comp. 1]
Colored according to Obs ID (grupo)
R2X[1] = 0.0712458 R2X[XSide Comp. 1] = 0.41813 Ellipse: Hotelling T2 (0.95)
AS
C
SIMCA-P+ 12.0.1 - 2012-10-16 18:58:34 (UTC+1)
-35
-30
-25
-20
-15
-10
-5
0
5
10
15
20
-7 -6 -5 -4 -3 -2 -1 0 1 2 3 4 5 6 7
to[1
]
t[1]
BT2_LC_SAI_Scaling_0.04_050812_UV.M29 (OPLS/O2PLS-DA), OPLS todas las muestras AS/ES UV (AS reducido)
t[Comp. 1]/to[XSide Comp. 1]
Colored according to Obs ID (grupo)
R2X[1] = 0.0405272 R2X[XSide Comp. 1] = 0.386752 Ellipse: Hotelling T2 (0.95)
AS
ES
SIMCA-P+ 12.0.1 - 2012-10-16 19:03:09 (UTC+1)
n= 223R2Y= 0.743Q2= 0.679
n= 149R2Y= 0.909Q2= 0.783
n= 148R2Y= 0.841Q2= 0.759
n= 149R2Y= 0.747Q2= 0.591
19
NSCLC: Metabolomic study on peripheral blood

Current challenges include: (i) identification of the optimal sequence of available drugs as well as their combinations, (ii) characterization of subgroups of patients that would benefit most of these drugs, (iii) reduction of the side effects associated to treatments
NMR metabolomic profile of MM patients
Biomarker Id associated to treatment response
Evaluation of treatment side-effects
1H NMR (1D-CPMG) spectrum of a serum sample obtained from a multiple myeloma patient OPLS-DA loading plot (MM patients@diagnosis/MM patients@remission)
-15
-10
-5
0
5
10
15
to[1
]
Mieloma_CPMG_Amix_BT1_2a_medida.M7 (OPLS/O2PLS-DA)t[Comp. 1]/to[XSide Comp. 1]Colored according to Obs ID (Group)
R2X[1] = 0,0653052 R2X[XSide Comp. 1] = 0,375429 Ellipse: Hotelling T2 (0,95)
DR
4142
44
47
394043
45
46
50
52
5658
61
65
69
72
75
77
8488
94
102
103
108
113
114
117
119
120
126
48
49
54
62
64
66
73
79
81 8689
105
106
107
109110
111
121
123
SIMCA-P+ 12.0.1 - 2011-06-19 12:32:36 (UTC+1)
OPLS-DA loading plot (healthy individuals/MM patients@diagnosis)
-15
-10
-5
0
5
10
15
to[1
]
Mieloma_CPMG_Amix_BT1_2a_medida.M6 (OPLS/O2PLS-DA)t[Comp. 1]/to[XSide Comp. 1]Colored according to Obs ID (Group)
R2X[1] = 0,106409 R2X[XSide Comp. 1] = 0,381088 Ellipse: Hotelling T2 (0,95)
CD
5153
5557
59
60
63
67
68
70
71
74
76
7880
82
83
85
87
9091
92
93
96
99101
104
115
118
124
127
39
40
43
45
46
50
52
56
58
61
65
69
72
7577
84
88 94
102
103
108
113
114
117
119
120
126
SIMCA-P+ 12.0.1 - 2011-06-19 12:26:46 (UTC+1)
1
3
2
20
Multiple Myeloma: Metabolic profile and response to treatment

21
CDGs: What to expect from the exchange with
the surrounding "media"?
graphically represented in Fig. 2B. The results obtainedare consistent with the OPLS-DA model built for thediscrimination of both groups of samples.
Multiplemyelomapatients at diagnosis versusmultiplemyeloma patients after complete remissionA different OPLS-DA model was built to determine if
it was possible to distinguish when a multiple myelomapatient has achieved complete remission of the diseasebased on its 1H-NMR metabolic profile. Figure 3A and Bshows the score plot for this model, which illustratesthe clear separation obtained between the 2 groups (R2 ¼
0.553; Q2 ¼ 0.358), and a graphic representation of themain metabolites contributing to this separation, based onthe results obtained from the loading plot and the mostrepresentative buckets defined in the VIP list. Based onthese results, the 1H-NMR serum metabolic profile of mul-tiple myeloma patients after achieving complete remissiondiffered from the profile at the time of diagnosis mainlyin the levels of lactate, lysine, TMAO, choline, and choles-terol, which were significantly higher in patients after com-plete remission. To validate the statistical modeling, themetabolites identified were quantified using variable sizebucketing for the integration of the corresponding 1H-NMR
20
15
10
5
0
−5
−10
−15
−20
30
20
10
0
−10
−20
−30
−14 −13 −12 −11−10 −9 −8
A
B
−7 −6 −5 −4 −3 −2 −1 0 1 2 3 4 5 6 7 8 9 10 11 12 13 14
to[1
]%
var
iati
on
(M
M a
t D
iag
no
sis-
Co
ntr
ol G
rou
p)
t [1]
3-H
ydro
xybu
tyra
te
Cho
lest
erol
/LD
L/V
LDL
(CH
3)
Lysi
neLi
pids
(–C
H=C
H–)
Lipi
ds (C
H2–
C=C
)
Lipi
ds (C
H2–
CO
)
Lipi
ds (C
H=C
H–C
H2–
CH
=CH
)
Ace
tate
Isol
euci
neG
luta
min
e
Tyro
sine
Cho
line
Arg
inin
eP
heny
lala
nine
Figure 2. Multivariate modelingresulting from the analysis ofserum 1H-NMR spectra of controlindividuals (open symbols) vs.multiple myeloma patients at thetime of diagnosis (full symbols).A, OPLS-DA score plot showingthe separation between the 2groups based on their metabolicprofile. B, mean signal intensityvariation (%) of the metabolitesthat contributed most to theseparation between groups.Positive bars in the graphiccorrespond to signals that areincreased in multiple myelomapatients at the time of diagnosis.", Statistically significantdifferences compared to control(P < 0.05).
Metabolomic Profile of Multiple Myeloma Patients
www.aacrjournals.org Clin Cancer Res; 19(17) September 1, 2013 OF5
Research. on August 21, 2013. © 2013 American Association for Cancerclincancerres.aacrjournals.org Downloaded from
Published OnlineFirst July 19, 2013; DOI: 10.1158/1078-0432.CCR-12-2917
Puchades-Carrasco et al. (2013) Clin. Cancer Res., 19: 4770-4779
1752 Am. J. Hum. Genet. 66:1744–1756, 2000
Figure 5 One-dimensional 500-MHz 1H-NMR spectrum of the urinary tetrasaccharide Glc(a1-2)Glc(a1-3)Glc(a1-3)Man. The spectrumwas recorded in D2O at 300 K. Chemical shifts (d) are expressed in ppm by reference to internal acetone (d 2.225) (Gerwig et al. 1993). f,noncarbohydrate contaminant. Full assignments of the proton chemical shifts were performed by two-dimensional homonuclear TOCSY (mixingtimes, 20 ms and 100 ms) and ROESY (mixing time, 250 ms) experiments. The sequence of the residues followed directly from interresidualROE connectivities. The one-dimensional 1H-NMR spectrum is similar to that of the earlier reported 400-MHz spectrum of synthetic Glc(a1-2)Glc(a1-3)Glc(a1-3)Man (Ogawa et al. 1984), whereas the 1H-NMR data of the Glc residues of the tetrasaccharide were in agreement withthose reported for the Glc residues in the N-glycan Glc3Man9GlcNAc2 (Ronin et al. 1987).
found to be heterozygous for the TrC transition. Am-plification of genomic DNA sequences flanking both al-terations confirmed the cDNA findings in the family.These base changes were not seen in 100 control DNAsamples.
Discussion
The proband presented with abnormal clinical findingsin the neonatal period, including severe generalized hy-potonia, dysmorphic features, hypoventilation, feedingproblems, and seizures. An underlying metabolic dis-order was suspected because of the relentless course ofthe disease and the progressive hepatomegaly. Lysosomaldisorders related to N-glycan catabolism were excludedbecause the urinary carbohydrate excretion pattern wasdifferent from that reported in patients with lysosomalexoglycosidases deficiencies (Montreuil et al. 1996b). Aperoxisomal disorder was also unlikely because of nor-mal concentrations of very-long-chain fatty acids, phy-tanic acid, and plasmalogens in the patient’s serum. Thefinding of a normal IEF pattern of serum sialotransferrin
and of b-trace protein in CSF made the diagnosis ofCDGS unlikely. In the liver, the progressive cholangio-fibrosis with steatosis and cholestasis was a prominentfinding (fig. 2A). Furthermore, the concentrically ar-ranged multilamellar inclusions detected in the cyto-plasm of parenchymal cells of the patient, not confinedby a lysosomal membrane, were peculiar (fig. 2B). Thesephospholipid-like structures were also present in bilecanaliculi and bile duct lumina, which suggests that thelamellar configurations represented accumulated bilecomponents (Phillipps et al. 1993). The fact that thelamellae were also seen in the sinusoids probably reflectsdefective bile secretion and regurgitation. In Niemann-Pick disease, membrane-like structures can also be seenbut are intralysosomal and only detected in parenchymalcells and Kupffer cells. The inclusions in patients withCDGS are strictly limited to the lysosomes of parenchy-mal cells. In our patient, the morphological aspect ofthe inclusions was different from these diseases. The ab-normal intraneuronal vacuoles in the cerebral cortexwere empty probably because their contents were fullywater soluble (fig. 3B). This feature ruled out the di-
De Praeter et al. (2000) Am. J. Hum. Genet., 66: 1744-1756
Am. J. Hum. Genet. 66:1744–1756, 2000
1744
A Novel Disorder Caused by Defective Biosynthesis of N-LinkedOligosaccharides Due to Glucosidase I DeficiencyClaudine M. De Praeter,1 Gerrit J. Gerwig,6 Ernst Bause,7 Lieve K. Nuytinck,4Johannes F. G. Vliegenthart,6 Wilhelm Breuer,7 Johannis P. Kamerling,6 Marc F. Espeel,5Jean-Jacques R. Martin,8 Anne M. De Paepe,4 Nora Wen Chun Chan,9Georges A. Dacremont,3 and Rudy N. Van Coster2,3
Department of Pediatrics, Divisions of 1Neonatal Intensive Care, 2Pediatric Neurology, and 3Metabolic Diseases, and 4Center for MedicalGenetics, Ghent University Hospital; 5Department of Histology and Embryology, Ghent University, Ghent; 6Department of Bio-OrganicChemistry, Bijvoet Center for Biomolecular Research, Utrecht University, Utrecht; 7Institut fur Physiologische Chemie, Universitat Bonn, Bonn;8Born-Bunge Foundation, Antwerp University, Antwerp; and 9Department of Chemistry, University of Alberta, Edmonton
Glucosidase I is an important enzyme in N-linked glycoprotein processing, removing specifically distal a-1,2–linkedglucose from the Glc3Man9GlcNAc2 precursor after its en bloc transfer from dolichyl diphosphate to a nascentpolypeptide chain in the endoplasmic reticulum. We have identified a glucosidase I defect in a neonate with severegeneralized hypotonia and dysmorphic features. The clinical course was progressive and was characterized by theoccurrence of hepatomegaly, hypoventilation, feeding problems, seizures, and fatal outcome at age 74 d. Theaccumulation of the tetrasaccharide Glc(a1-2)Glc(a1-3)Glc(a1-3)Man in the patient’s urine indicated a glycosylationdisorder. Enzymological studies on liver tissue and cultured skin fibroblasts revealed a severe glucosidase I deficiency.The residual activity was !3% of that of controls. Glucosidase I activities in cultured skin fibroblasts from bothparents were found to be 50% of those of controls. Tissues from the patient subjected to SDS-PAGE followed byimmunoblotting revealed strongly decreased amounts of glucosidase I protein in the homogenate of the liver, anda less-severe decrease in cultured skin fibroblasts. Molecular studies showed that the patient was a compoundheterozygote for two missense mutations in the glucosidase I gene: (1) one allele harbored a GrC transition atnucleotide (nt) 1587, resulting in the substitution of Arg at position 486 by Thr (R486T), and (2) on the otherallele a TrC transition at nt 2085 resulted in the substitution of Phe at position 652 by Leu (F652L). The motherwas heterozygous for the GrC transition, whereas the father was heterozygous for the TrC transition. These basechanges were not seen in 100 control DNA samples. A causal relationship between the a-glucosidase I deficiencyand the disease is postulated.
Introduction
Glycoproteins play important roles in many biologicalprocesses. Their N- and/or O-linked carbohydrate chainsare involved in polypeptide folding and stabilizing pro-tein conformation and can act as targeting signals or asligands for cell-surface receptors mediating cell-cell in-teraction and recognition (Montreuil et al. 1995). Thebiosynthesis of N-linked glycans is a complex process,comprising transfer of a preformed Glc3Man9GlcNAc2
precursor oligosaccharide to the polypeptide and, sub-sequently, a series of processing reactions catalyzed by
Received November 30, 1999; accepted for publication March 14,2000; electronically published April 28, 2000.
Address for correspondence and reprints: Dr. Rudy N. Van Cos-ter, Pediatric Neurology and Metabolic Diseases, Ghent UniversityHospital, De Pintelaan, 185, B9000 Ghent, Belgium. E-mail: [email protected]
! 2000 by The American Society of Human Genetics. All rights reserved.0002-9297/2000/6606-0004$02.00
glycosidases and glycosyltransferases (Montreuil et al.1996a) (fig. 1).
Inborn errors in the glycan biosynthesis may havedramatic influences on the properties and functioningof the glycoproteins and may lead to severe clinicalsyndromes. Defects in the biosynthetic pathway mayoccur either in the assembly reactions of the precursoroligosaccharide or in enzymatic processing. Deficien-cies of the enzymes involved represent the main causesof these autosomal recessive diseases (Kornfeld 1998).Only five primary disorders due to defective N-gly-cosylation of glycoproteins have been identified: (1)mucolipidosis II (I-cell disease) (MIM 252500) andmucolipidosis III (MIM 252600) (pseudo-Hurler po-lydystrophy) (Reitman et al. 1981); (2) leukocyte ad-hesion deficiency, type II (MIM 266265) (Etzioni et al.1992); (3) congenital dyserythropoietic anemia type II(HEMPAS disease) (MIM 224100) (Fukada 1990); (4)paroxysmal nocturnal hemoglobinuria (MIM 311770)(Rosse 1997); and (5) carbohydrate-deficient glyco-protein syndrome (CDGS) (MIM 212065, MIM

22
CDGs: Metabolic trajectories
Healthy RecoveredDiseased
TREATMENT RESPONSE
DISEASE
SIDE-EFFECTS

23
SBL@CIPF: Leonor Puchades-Carrasco, Martina Palomino, Sara Vicente, Clara Pérez, Leticia Ortí, Pablo Mateos
Funding: Ministerio de Economía y Competitividad, Fundación Mutua Madrileña, Fundación GentxGent, Becas Abbott-AEU, Programa de Internacionalización de la I+D (Proyectos Bilaterales con India), Conselleria de Educación de la GVA, Conselleria de Sanidad de la GVA, Programa Prometeo, ERA-NET "New Indigo" (I & II), Bruker BioSpin, Janssen-Cilag
Acknowledgements


![Metabolomics Basics[1]](https://img.dokumen.tips/doc/110x75/553de2815503466f378b4864/metabolomics-basics1.jpg)