Embed Size (px)
Citation preview

How integrated are homelessness, mental health and drug and alcohol services in Australia?
authored by
Paul Flatau, Elizabeth Conroy, Monica Thielking, Anne Clear, Sarah Hall, Alicia Bauskis, Matthew Farrugia and Lucy Burns
for the
Australian Housing and Urban Research Institute
at University of Western Australia at University of Western Sydney at Swinburne University of Technology
May 2013
AHURI Final Report No. 206
ISSN: 1834-7223
ISBN: 978-1-922075-28-4

i
Authors Flatau, Paul University of Western Australia
Conroy, Elizabeth University of Western Sydney
Thielking, Monica Swinburne University of
Technology
Clear, Anne Murdoch University
Hall, Sarah Swinburne University of
Technology
Bauskis, Alicia University of Western Australia
Farrugia, Matthew Swinburne University of
Technology
Burns, Lucy University of New South Wales
Title How integrated are homelessness, mental health and drug
and alcohol services in Australia?
ISBN 978-1-922075-28-4
Format PDF
Key words homelessness, mental health, drug, alcohol, services,
Australia?
Editor Anne Badenhorst AHURI National Office
Publisher Australian Housing and Urban Research Institute
Melbourne, Australia
Series AHURI Final Report; no.206
ISSN 1834-7223
Preferred citation Flatau, P., et al. (2013) How integrated are homelessness,
mental health and drug and alcohol services in Australia?
AHURI Final Report No.206. Melbourne: Australian Housing
and Urban Research Institute.

ii
ACKNOWLEDGEMENTS
This material was produced with funding from the Australian Government and the
Australian states and territory governments. AHURI Limited gratefully acknowledges
the financial and other support it has received from these governments, without which
this work would not have been possible.
AHURI comprises a network of universities clustered into Research Centres across
Australia. Research Centre contributions, both financial and in-kind, have made the
completion of this report possible.
We would like to thank those in Western Australia, New South Wales (NSW) and
Victoria who assisted us in completing interviews for the case studies.
In Western Australia, we would like to thank Steve Joyce, Anna Paris, Steve Retel
and Natalie Hyde, all from Ruah Community Services, and Julie Waylen of the
Department for Child Protection.
In Victoria, we would like to thank Amanda Kingston-Coldwell, Mark Planigale, Gail
Heidke, Danielle Le Brocq, Nannette Wilkinson, Daniel Clements, Linda Staehli, all
from HomeGround; Danielle Collins, Alfred Hospital; Carmen Raspour, St Vincents
Hospital; Jo Beckett, Melbourne Magistrates Court; Trish Ferrara, North East Housing
Services; and Harry Lovelock, Australian Psychological Society.
In NSW, we would like to thank Andrew Don, Giselle Goy, Samantha George, Anita
Langley, Felicia Tungi, Darryn O'Brien and Carlos Duarte, all from Haymarket
Foundation; Susan Johnston, Susan Johnston Consultancy Services; Sylviane
Vincent and Bev Lange, Bobby Goldsmith Foundation; Jenny O'Maloney, Katy Roy
and Jenny Case, all from NSW Health; Anthony Stralow, Department of Community
Services; and Alison Little, Housing NSW.
Finally, we would like to thank Tamlin Gorter of AHURI Ltd for providing excellent
management of the project, anonymous referees for their comments, and the input of
the AHURI User Group.
DISCLAIMER
AHURI Limited is an independent, non-political body which has supported this project
as part of its programme of research into housing and urban development, which it
hopes will be of value to policy-makers, researchers, industry and communities. The
opinions in this publication reflect the views of the authors and do not necessarily
reflect those of AHURI Limited, its Board or its funding organisations. No responsibility
is accepted by AHURI Limited or its Board or its funders for the accuracy or omission
of any statement, opinion, advice or information in this publication.
AHURI FINAL REPORT SERIES
AHURI Final Reports is a refereed series presenting the results of original research to
a diverse readership of policy makers, researchers and practitioners.
PEER REVIEW STATEMENT
An objective assessment of all reports published in the AHURI Final Report Series by
carefully selected experts in the field ensures that material of the highest quality is
published. The AHURI Final Report Series employs a double-blind peer review of the
full Final Report—where anonymity is strictly observed between authors and referees.

iii
CONTENTS
LIST OF TABLES ........................................................................................................ V
LIST OF FIGURES ..................................................................................................... VI
ACRONYMS ...............................................................................................................VII
EXECUTIVE SUMMARY .............................................................................................. 1
1 INTRODUCTION ................................................................................................. 8
2 LITERATURE REVIEW ..................................................................................... 14
2.1 What is integration? ........................................................................................... 14
2.2 A typology of integration: construct .................................................................... 15
2.3 Measuring integration......................................................................................... 18
2.4 Drivers and enablers of integration..................................................................... 21
2.5 Summary ........................................................................................................... 22
3 RESEARCH METHODOLOGY .......................................................................... 23
3.1 Sites ................................................................................................................... 23
3.1.1 Victoria ...................................................................................................... 23
3.1.2 Western Australia ...................................................................................... 24
3.1.3 New South Wales ..................................................................................... 24
3.2 Methods ............................................................................................................. 25
3.2.1 Key stakeholder interviews ....................................................................... 25
3.2.2 Case studies ............................................................................................. 26
3.2.3 The Integration Survey .............................................................................. 26
3.3 Participants ........................................................................................................ 29
3.3.1 Key stakeholder interviews ....................................................................... 29
3.3.2 Case studies ............................................................................................. 29
3.3.3 The Integration Survey .............................................................................. 29
3.4 Summary ........................................................................................................... 32
4 UNDERSTANDINGS OF INTEGRATION .......................................................... 40
4.1 System and service integration .......................................................................... 40
4.1.1 Coordinated networks ............................................................................... 40
4.1.2 Connectedness ......................................................................................... 42
4.1.3 Client centred ............................................................................................ 43
4.1.4 Extension of professional boundaries ........................................................ 44
4.2 The serviceableness of integration ..................................................................... 45
4.3 Summary ........................................................................................................... 46
5 THE STRUCTURE AND FUNCTIONING OF INTEGRATION ........................... 47
5.1 Structure of integration ....................................................................................... 47
5.1.1 Extent of integration .................................................................................. 47
5.1.2 Scope of integration .................................................................................. 49
5.1.3 Depth of integration ................................................................................... 54
5.2 Functioning of integration ................................................................................... 61
5.2.1 Quality of the network ............................................................................... 61

iv
5.2.2 Participant perceptions ............................................................................. 64
5.2.3 Critical ingredients for integration .............................................................. 65
5.3 Summary ........................................................................................................... 71
6 CLIENT EXPERIENCES OF SERVICE INTEGRATION .................................... 73
6.1 Clients’ views on the importance of integration................................................... 73
6.2 Client-level indicators of integration .................................................................... 75
6.2.1 Case management .................................................................................... 75
6.2.2 Awareness of need ................................................................................... 76
6.2.3 Care coordination...................................................................................... 77
6.2.4 Duplicate information ................................................................................ 77
6.3 Client access to services .................................................................................... 77
6.3.1 Findings from the Integration Survey......................................................... 77
6.3.2 Findings from interviews with case study participants ............................... 81
6.4 Client outcomes ................................................................................................. 84
6.4.1 Findings from the Integration Survey......................................................... 84
6.4.2 Findings from interviews with case study participants ............................... 84
6.5 Summary ........................................................................................................... 88
7 EVALUATING THE INTEGRATED SERVICE DELIVERY APPROACH ........... 89
8 SUMMARY AND POLICY DISCUSSION ........................................................... 94
REFERENCES ........................................................................................................... 98
APPENDIX 1: CASE STUDIES ........................................................................... 102
A1.1 Homelessness Case Study (NSW): the Haymarket Foundation ....................... 103
A1.3 Health Case Study (NSW): the Homeless Health Service ................................ 107
APPENDIX 2: CONGRUENCE AND RECIPROCITY .......................................... 109
A2.1 Congruence ..................................................................................................... 109
A2.2 Reciprocity ....................................................................................................... 111

v
LIST OF TABLES
Table 1: Kodner and Spreeuwenberg (2002) Continuum of integrated care strategies
.......................................................................................................................... 17
Table 2: Measures included in the Integration Survey ............................................... 27
Table 3: Stakeholder profile, key stakeholder interviews ........................................... 33
Table 4: Agency profile, case studies ........................................................................ 34
Table 5: Number of participating agencies and services in the Integration Survey .... 34
Table 6: Agencies in the Integration Survey, by sources of funding and area of
specialisation ..................................................................................................... 35
Table 7: Services in the Integration Survey, by area of specialisation by assistance
provided, funding sources, target population, service size and mean episode of
care .................................................................................................................... 36
Table 8: Characteristics of client participants, stratified by service domain ................ 38
Table 9: Extent of integration scores for both observed and expected integration ..... 55
Table 10: Indicators for level of service integration scores ........................................ 55
Table 11: Total observed and expected levels of depth of integration by specialist
homelessness, mental health and drug and alcohol services within the outer
eastern metropolitan region of Melbourne .......................................................... 59
Table 12: Total observed and expected levels of depth of integration by specialist
homelessness, mental health and drug and alcohol services within the City and
South East Corridor region of Perth ................................................................... 60
Table 13: Dimensions of the Weiss Partnership Synergy Self-Assessment Tool ....... 62
Table 14: Average partnership synergy dimension scores for Melbourne .................. 63
Table 15: Average partnership synergy dimension scores for Perth: total group and
total service domains ......................................................................................... 63
Table 16: Average satisfaction with participation scores for service participants,
stratified by service domain ................................................................................ 64
Table 17: Critical ingredients for integration .............................................................. 70
Table 18: Indicators of client integration measured in the Integration Survey ............ 76
Table 19: Difficulties with access for total group and total service domains ............... 78
Table 20: Difficulties with access for total group and service domains within Perth
sample ............................................................................................................... 79
Table 21: Difficulties with access for total group and service domains within
Melbourne sample ............................................................................................. 81
Table 22: Comparison scores for benefits and drawbacks of participation among
service participants ............................................................................................ 89
Table A1: Ingredients of integration: the Haymarket Foundation ............................. 103
Table A2: Ingredients of integration: Moreland Hall ................................................. 105
Table A3: Ingredients of integration: the Homeless Health Service ......................... 107

vi
LIST OF FIGURES
Figure 1: Keast et al.’s (2007) integration continuum ................................................. 16
Figure 2: Ahgren and Axelsson’s integration continuum ............................................ 16
Figure 3: Adaptation of Browne, Kingston, Gridisa and Markle-Reid’s (2007) model of
‘Dimensions of Human Service Network Integration’ .......................................... 20
Figure 4: Extent of integration considered in the present study ................................. 48
Figure 5: Types of homelessness support provided by participating agencies, stratified
by jurisdiction ..................................................................................................... 51
Figure 6: Types of drug and alcohol support provided by participating agencies,
stratified by jurisdiction ....................................................................................... 52
Figure 7: Types of mental health support provided by participating agencies, stratified
by jurisdiction ..................................................................................................... 53
Figure 8: Decision-making dimension scores stratified by study site ......................... 65
Figure 9: Frequency with which critical ingredients of integration are present across all
service domains ................................................................................................. 67
Figure 10: Frequency with which critical ingredients of integration are present in
partnerships with homelessness services .......................................................... 67
Figure 11: Frequency with which critical ingredients of integration are present in
partnerships with housing services ..................................................................... 68
Figure 12: Frequency with which critical ingredients of integration are present in
partnerships with mental health services ............................................................ 68
Figure 13: Frequency with which critical ingredients of integration are present in
partnerships with drug and alcohol services ....................................................... 69
Figure 14: Degree of importance placed on information sharing by client participants
of the Integration Survey .................................................................................... 74
Figure 15: Degree of importance placed on care coordination by client participants of
the Integration Survey ........................................................................................ 75
Figure 16: Proportion of service participants reporting different benefits of
participation, stratified by service domain ........................................................... 90
Figure 17: Proportion of service participants reporting different drawbacks to
participation, stratified by service domain ........................................................... 91
Figure 18: Benefits and drawbacks to integration articulated by service participants in
the Integration Survey ........................................................................................ 92
Figure A1: The Haymarket Foundation (2009) ........................................................ 104
Figure A2: Moreland Hall (2011) ............................................................................. 106
Figure A3: Homelessness Health Service, St Vincent’s Health Network (2011) ...... 108

vii
ACRONYMS
ANOVA Analysis of Variance
AOD Alcohol and Other Drugs
ATSI Aboriginal and Torres Strait Islander
CALD Culturally and Linguistically Diverse
CBD Central Business District
CEO Chief Executive Officer
CTOs Community Treatment Orders
DoCS Department of Community Services
FaHCSIA Department of Families, Housing, Community Services and
Indigenous Affairs
LHN Local Hospital Network (NSW)
MHDAO Mental Health and Drug and Alcohol Office (NSW)
MOU Memorandum of Understanding
NCADA National Campaign Against Drug Abuse
NDS National Drug Strategy
NGO Non-Government Organisation
NSW New South Wales
NT Northern Territory
OEMHSA Outer East Mental Health Service Area (Victoria)
PDRSS Psychiatric Disability Rehabilitation and Support Services
QLD Queensland
SA South Australia
SAAP Supported Accommodation Assistance Program
SHS Specialist Homeless Services
VIC Victoria
WA Western Australia

1
EXECUTIVE SUMMARY
Aims and objectives
The homelessness, drug and alcohol, and mental health service systems are separate
service structures in Australia. They have their own unique funding and governance
arrangements and work in separate domains. The homelessness service system fits
largely within a community services support framework, while drug and alcohol, and
mental health services are embedded within their respective health systems.
Despite the fact that the homelessness, drug and alcohol, and mental health service
systems are separate, they share many of the same clients and address similar
problems among clients. Homelessness services, for example, provide support to
clients who also have drug and alcohol, and mental health needs. Therefore, the
homelessness, drug and alcohol, and mental health service systems interact. Service
integration and effective working relationships between services across the
homelessness, drug and alcohol, and mental health systems is, a priori, critical in
achieving good outcomes for clients wherever they may be located.
Service integration has become a point of policy focus in recent years. Despite the
focus on systems and service integration in the present policy environment and
among practitioners, there has been no study, as far as we are aware, of the
integration of homelessness, drug and alcohol, and mental health services in Australia
that also considers the perspective of clients.
This study aims to fill this critical gap in the literature. The purpose of the present
study is to increase our understanding of the extent and ways in which homelessness,
drug and alcohol, and mental health services are working together to provide services
to clients with particular emphasis on the needs of homeless people. The study also
considers the barriers, costs and benefits of service integration and the perceived
effectiveness of various integrated service delivery responses. It focuses at both the
service level and at the level of the client and addresses the question as to client
perceptions of the integration of services and the effectiveness of the services they
are receiving.
The study addresses six research questions.
1. What do we mean by the term ‘service integration’? What models and typologies of ‘service integration’ have been advanced in the existing literature?
2. How do key policy and practice stakeholders in the homelessness, drug and alcohol, and mental health sectors in Australia define ‘service integration’ and its role in the delivery of services to clients?
3. What is the current structure and functioning of service integration in selected networks within the homelessness, drug and alcohol and mental health sectors? How does the practice of service integration in Australia compare with the existing models?
4. What do clients and the practitioners who work with them, tell us about clients’ experiences of service integration and coordinated care within the homelessness, drug and alcohol, and mental health sectors?
5. What are the views of homelessness, drug and alcohol, and mental health services about the pros and cons of service integration and its overall effectiveness, particularly in relation to the delivery of services for homeless people?

2
6. In what ways can the findings of this study inform the development of policy with respect to service integration and the practice of integrated service delivery for homeless people?
Research methodology
Our study is a cross-sectional, mixed methods study. It comprises three components:
interviews with key stakeholders; case studies of specialist homelessness and health
services; and, a multi-level survey (the Integration Survey) of specialist
homelessness, drug and alcohol, and mental health services, the agencies they
operate from and the clients they assist.
The study was conducted across three capital cities: Perth, WA; Melbourne, VIC; and
Sydney, NSW to ensure that findings were not specific to one particular jurisdictional
setting. The structure of the health and community service systems is largely
determined at the State/Territory level despite the significant role the Australian
Government plays in funding these systems. As outlined in the study’s Positioning
Paper (Flatau et al. 2010), structural forces are an important driver of integration
(Williams & Sullivan, 2009).
Clients
The ultimate goal of a well-integrated service system is better client outcomes. It is
common for clients to have a range of needs that require support from service
providers from multiple systems or agencies. For example, clients presenting with
homelessness and housing needs may also have drug and alcohol issues and/or
require additional support with mental health issues. Likewise, clients of drug and
alcohol and mental health services may have needs in relation to shelter and
permanent housing. Clients from the three separate domains of service delivery:
homelessness; drug and alcohol; and mental health services were asked to
participate in the study in order to ascertain their experiences and attitudes toward
service integration within the chosen geographical area.
Key stakeholder interviews
Interviews were conducted with 25 key stakeholders at both the Commonwealth and
state level holding prominent policy and practitioner positions in WA, Victoria and
NSW across the homelessness, drug and alcohol, and mental health service systems.
These interviews aimed to document:
The policy environment, including any whole-of-government approaches, at both the federal and state/territory levels in respect to the delivery of homelessness, drug and alcohol, and mental health.
Stakeholder perceptions of integration—what it means, how it can be operationalised and implemented, and the benefits and costs of integration.
Case studies
Case studies were conducted in Melbourne, Perth and Sydney and aimed at
developing an understanding of how integration is being implemented at the local
level, focusing on responses that agencies themselves have developed to meet client
need.
Interviews were semi-structured and included the following discussion prompts:
Description of service/program and how it is linked into the broader organisational structure.
Target client group and definition of client success.

3
Integration mechanisms/strategies employed and the impact of these strategies on successful client outcomes.
Linkages and partnerships with external services/agencies.
Factors that facilitate and impede effective integration.
Funding sources and reporting requirements.
The Integration Survey
The Integration Survey is a unique multi-level survey comprising an organisational or
agency instrument, a service instrument and a client instrument. The Integration
Survey covers all topic areas in the study with a particular emphasis on mapping the
degree of integration that currently exists between agencies that provide
homelessness, drug and alcohol, and mental health services within specified localities
in Perth and Melbourne as well as gathering client-based data of relevance to the
study. (We also attempted to implement the study in Sydney but faced a number of
hurdles in doing so.) Measures used in the Integration Survey include a number
developed in previous studies of integration such as the Partnership Self-Assessment
Tool (Weiss et al. 2002) and the Integration of Human Services Measure (Browne et
al. 2007) as well as others developed specifically for the present study.
The area chosen to conduct the Integration Survey in Perth was from central Perth
through to what is referred to as the South-East Corridor. This is an area of high
concentration of clients of homelessness services (particularly inner Perth) but also of
drug and alcohol, and mental health services. The Perth site was chosen as
representing a typical area in which homelessness, drug and alcohol, and mental
health services operate in Australia. It is also typical in that services work together,
follow protocols of engagement that exist in relation to different service systems and
exist in a policy and practice environment that seeks greater integration, but do not
operate within a formal integrated network entity.
The chosen Melbourne area was a more ‘typical’ suburban area of outer eastern
Melbourne. This is an area of growing need but not an area of concentrated
homelessness services. The area includes a large well-established single, multi-
function agency, which developed as an integration response. Hence, the Melbourne
site has a more structured network design. There is no sense in which the two
regions, Perth and Melbourne, are comparable. Indeed, they represent intentionally
quite different sites of analysis.
Key research findings
A typology of integration
Integration involves ‘joint working’ in one form or another and this can range from
loose collaborative arrangements around referral of clients and good communication
between staff in different organisations to coordinated delivery of services and full
integration where the resources of different organisational units are pooled in order to
create a new organisation.
Integration can be developed on a system-wide basis and be centrally funded and
managed (system-level integration) or be generated at a service level involving the
coordinated delivery of individual services within and/or across different sectors
(service-level integration). It may also occur within agencies (vertical integration) or
between agencies (horizontal integration) and involve a broad range of stakeholders
including users, frontline providers, managers and policymakers. Ultimately, system-
level integration and service integration is a means to the intermediate objective of

4
greater client integration (a seamless service system as perceived by clients of
services) and the final end of improved client outcomes.
A typology of integration entails structural, functioning and output dimensions. In this
study, we adapt the typology and associated measurement framework presented in
Browne et al. (2007). We place particular focus on the clients of services and their
perceptions of the effectiveness of services in meeting their needs in a timely and
seamless fashion and the views of services managers as to the benefits, costs and
barriers of service integration and their views as to the effectiveness of integration
practices.
From stakeholder interviews and case studies, there were some differences between
policy and practice stakeholders in how they perceived integration. For example,
policy stakeholders placed a greater emphasis on particular models of integration. In
contrast, practice stakeholders had a greater sensibility about integration as a means
to an end—that is, using whatever strategies enabled them to achieve connectedness
with other services and to meet the needs of their clients.
The structure and functioning of integration
Based on the Integration Survey, specialist homelessness, drug and alcohol and
mental health services are all providing support in domains other than their direct area
of specialisation. Evidence of such support suggests a degree of internal integration
within the relevant agency, what we have termed vertical integration. For example, 40
per cent of specialist homelessness services provide mental health services and 35
per cent also provide drug and alcohol support.
We measured the depth of integration in the specified geographical areas using
Browne’s Integration of Human Services Network Measure (Browne et al. 2007). On a
scale from no integration through to excellent integration, Melbourne service
managers reported a good level of interaction, joint planning and communication
between services across the defined geographical area consistent with an active
program of communication and information sharing. In Perth, services reported a
lower, moderate level of integration consistent with high levels of awareness but not
active communication. In both cases, expected (or desired) depth of integration
scores are somewhat higher than actual levels of integration indicating that service
managers wish to raise the level of integration between services across the relevant
regions but not dramatically so.
However, in both the Perth and Melbourne sites, both actual and desired levels of
integration fall short of the two highest levels of integration, namely, cooperation and
collaboration. Cooperation involves services across the region having an active
program of communication and information sharing, while collaboration involves
services working closely with each other to guide and modify their own service
planning. The evidence suggests that services want to cooperate and collaborate with
each other much more closely than they currently do in a given geographical area, but
at the same time they are placing limits on the degree to which they integrate as well.
There is no appetite apparently for generalised deep integration across all services in
a region.
In addition to examining the depth of integration in the context of a given geographical
region, we also examined the extent to which individual services experienced the
highest level of integration of collaboration (a depth of integration score of 4 out of 4)
with at least one service in the region of interest. The vast majority of services in both
Perth and Melbourne do have collaborative relationships with one other service in the
same geographical region. In the Perth sample, for example, three quarters of all
services reported having a strong collaborative relationship with at least one other

5
service in another domain. In the Perth sample, 55 per cent of homelessness services
had at least one collaborative relationship with another service included in the sample.
However, 40 per cent had a collaborative relationship with at least one drug and
alcohol service and none had collaborative relationships with mental health services.
Strong integrated relationships with other services are more likely with services in own
sector domains than with other services. The challenge posed by this evidence is to
establish strong inter-sectoral integration among a network of services in different
domains.
Services in both Perth and Melbourne who engaged in formal partnerships reported
relatively high scores across the various domains of synergy, leadership, partnership
efficiency, administration and management and resources. However, services
generally reported relatively low scores across critical ingredients of integration
thought to be important for success in sustaining and developing service integration
arrangements. Across the domains of sharing and participation between services;
client referrals; relationships between staff; and, inter-agency functioning, services
were more likely to respond that they never engage in the practices outlined and least
likely to respond that they always engage in these practices.
Client integration
This report provides findings from the Integration Survey on the views of clients on
forms of service integration practice and their experience of integration in the service
system using a set of measures of client integration. Client-level integration focuses
on the experiences and perceptions of clients as to whether they face a seamless
system of care and support in which needs are met, irrespective of who provides
assistance to them. Client integration can be conceptualised in one of two ways: (1)
how clients perceive the service system, and whether it works seamlessly in their
eyes to meet their needs in a timely appropriate fashion; and (2) how clients
experience the service system, and whether it works seamlessly in actual practice to
meet their needs in a timely appropriate fashion.
In order to measure client integration, we assess the correlation between a given
client integration indicator and the extent to which the service is integrated with other
services using the service depth of integration score (Browne et al. 2004). The
chapter also provides insights from interviews with case study and stakeholder
participants on the impact of service integration on client outcomes.
The majority of client participants from the Integration Survey indicated that both
information sharing and care coordination between services was very important. This
was particularly the case for clients of specialist mental health services.
Clients from more integrated services (using the Browne depth of integration
measure) were generally more likely to report positive outcomes across a range of
client integration measures than were clients of less integrated services. For example,
across all sector domains, clients of more integrated services were more likely to have
a case manager than clients from less integrated services. Given the importance of
case management for supporting clients with complex needs to access relevant
services, this suggests that more integrated services can provide a more seamless
approach to service delivery.
Clients from more integrated homelessness services reported that the relevant service
was directly helping them with their mental health needs. In contrast, clients from drug
and alcohol services with lower levels of integration were more likely to report that
they had not told the service about their homelessness problems, or the service had
not asked and therefore did not know. Clients from more integrated homelessness
6
services were also more likely to report that providers of different services have
frequently worked together to coordinate their care over the past three months.
Clients listed the following key problems in accessing help for housing, mental health
and/or drug and alcohol problems: long waiting lists, lack of knowledge of how to
access a service, difficulty in negotiating the service system, limited access to
transport, and lack of coordination of services.
Benefits and costs of integration
Do services overall see a net benefit from participating with other services in the
delivery of support to clients? The broad answer is that, in the main, service
participants perceived the benefits of participation exceeded the drawbacks and this
was true for each of the separate service domains. The key benefits from greater
participation, as perceived by service managers, was that services felt that they were
able to have a greater impact than they could on their own, make a contribution to the
community, meet the needs of clients better, develop valuable relationships, and
acquire useful knowledge about services, programs, or people in the community.
Nevertheless, services do report drawbacks from integration including less
organisational flexibility, loss of organisational identity, time involved and they believe
that clients prefer more specialist services.
Policy implications
Service integration has been a major plank of Australian policy discussions and
settings in all jurisdictions in Australia. The White Paper: The Road Home and
subsequent homelessness plans implemented by state and territory jurisdictions refer
to the importance of service integration in achieving an end to homelessness for
clients. A similar focus on service integration is evident in the mental health and drug
and alcohol domains.
Based on the findings of this report, there are a number of issues that can be
identified as relevant for consideration in future policy and by services themselves.
The most important conclusion to be drawn from the study from a policy perspective is
that there is a desire on the part of both clients and service managers for greater
levels of service integration and that service integration is associated with improved
client integration. What this means is that there is significant support for the broad
service integration agenda on the part of clients and services, the two ‘actors’ that
matter the most.
However, beyond this there are significant implications of the findings as to the form
that service integration should take and its extent and the role governments may play
in supporting integration.
First, it is clear that some agencies have themselves expanded the range of services
they provide so that integrated responses may come from within, rather than between,
agencies. In other words, integrated care, provided by a single agency with multiple
service functions, may prove particularly effective. Moreover, the majority of services
have developed close collaborative relationships with at least one other service and
so bottom-up attempts at service integration are flourishing. At the same time, there
were some services who did not have a collaborative relationship and there was
greater likelihood of collaboration within the same service domain than with services
in other domains. The evidence from the Integration Survey is that these close
collaborative relationships and formal partnerships are producing positive net benefits
such as, for example, having a greater impact than they could have on their own and
an enhanced ability to meet the needs of clients.
7
Second, while services wish to increase levels of integration across a broad set of
services in a region they actually wish to do so while still clearly retaining their
independence. Services report that they do not want to integrate to the point of
extinguishing complete control over their own areas of service delivery. There are
limits to desired integration and these limits should be recognised in government
thinking and initiatives.
Third, service integration is highest between services in the same domain rather than
between services in different domains. Governments and peak bodies may play a role
in increasing connections between different service domains. The profile of clients in
the three service domains examined indicates significant overlap in terms of need and
hence there is a requirement for greater cross-sectoral dialogue.
Fourth, despite the fact that services perceive a net benefit from service integration
services identified a number of issues around governance and resource support. The
role of systems-level integration, the support of government and the funding of the
additional resource costs of integration as well as the role of government health
providers in integrated frameworks need to be considered. The resource implications
and potential issues surrounding the leadership of the network and the autonomy of
individual services and agencies also need to be considered as services consider
more structured relationships.
Fifth, the evidence presented in terms of the functioning of integration suggests that
integration practices remain relatively thin around the practices of sharing of
information, relationships between staff in different services and so on and may need
support to strengthen them before they are effective.
This study has only touched briefly on the question of the impact of integration on
client outcomes and there remains a significant research agenda ahead before a
more definitive assessment of client impact is possible. Both service providers and
clients alike believe that it is important to strive for a collaborative and integrated
model of service delivery. However, as many clients still report barriers to accessing
services, including cost, long waiting lists and difficulties negotiating the service
system, it is evident that further service delivery improvement and research in this
area is needed. Organisational mechanisms need to be in place to support service
providers in their pursuit of service integration, particularly in the area of providing
direction around how to engage in client information sharing with other service
providers.
Future research directions may include a deeper investigation of effective models of
integration for homeless clients in other Australian regions, especially in relation to
improved client outcomes. Identifying existing structural mechanisms within networks
that assist with the sharing of protocols, policies and client-care plans in order to meet
the needs of homeless clients and improve client outcomes would be of benefit to the
continued growth in integration practices in the period ahead.

8
1 INTRODUCTION
The homelessness, drug and alcohol, and mental health systems are separate service
systems in Australia. They have their own funding and governance arrangements and
work in separate domains. Homelessness services operate within the community
services sector, while alcohol and drug services and mental health services are
funded and managed largely within the Australian health system. Nevertheless,
despite these separate funding and management arrangements, all three sectors
share many of the same clients and addresses and, in many cases, similar problems
among their clients. It is this essential fact of an intersection in both clients and client
needs across the three service domains that provides the underlying ground for
greater collaboration between services across the homelessness, drug and alcohol,
and mental health systems.
The significant co-occurrence of substance use disorders and (other) mental health
disorders (co-morbidity) has been the subject of an extensive international research
literature and of major Australian health initiatives (e.g., see Teesson & Proudfoot
2003; Kessler 2004; Compton et al. 2005; Conway et al. 2006).1 However, it is the
prevalence of substance use disorders, together with co-morbidity of substance use
disorders and other mental health disorders among those who are homeless that is
the key interest for us. The prevalence of co-morbidity in the homeless population is
significantly higher than it is for the general population. This finding applies equally in
Australia as in other countries and across different time periods and different
homeless sub-populations (see, e.g., Koegel et al. 1988; Fischer & Breakey 1991;
Jablensky et al. 1999; Teesson et al. 2000; Herrman et al. 2004; Teeson et al. 2004;
Fazel et al. 2008; Flatau et al. 2010, 2012).
In an environment of co-morbidity of drug and alcohol and other mental health
disorders and a link between homelessness and such co-morbidity, there is a strong,
a priori, case for close collaboration between services in these three service systems.
The aim of service integration—defined for the present as simply services working
together to achieve common goals—is to provide a seamless system of support and
flexible care for clients, with an ultimate objective of improving client outcomes relative
to those that would prevail in an independent service delivery system—one in which
services work independently of each other. An independent or autonomous service
delivery system is unlikely to be able to address the needs of homeless people with
multiple, high and long-standing needs (see Flatau et al. 2010 for further discussion).
The a priori argument in favour of service integration of homelessness, drug and
alcohol and mental health services is a very strong one based as it is around the co-
occurrence of substance use disorders and other mental health disorders among the
homeless population. However, despite this, there is no guarantee that an integrated
1 The National Co-morbidity Initiative, launched in 2000, responded to the growing evidence of co-
morbidity of substance use disorders and other mental health disorders and was allocated $17.9 million over seven years from 2003–04 to 2009–10 with the specific aim of improving service coordination and treatment outcomes for people with co-existing mental health and substance use disorders. The initiative focused on the following priority areas: (1) raising awareness of co-morbidity among clinicians/health workers and promoting examples of good practice resources/models; (2) providing support to general practitioners and other health workers to improve treatment outcomes for co-morbid clients; (3) facilitating resources and information for consumers; and (4) improving data systems and collection methods within the mental health and AOD sectors to manage co-morbidity more effectively. The rationale for the National Co-morbidity Initiative, that co-morbidity is the norm rather than the exception, is now well recognised. However, explicit attention to issues around housing and homelessness were not directly addressed in the initiative.

9
service system will produce better outcomes for clients than a largely autonomous
system. The costs of integration may outweigh the benefits.
There are three aspects of the cost factor to take into account. First, integration
involves higher transaction costs between services than would otherwise be the case
brought about by the process of collaboration between separate organisations.2
Second, services build up their own skill, knowledge and network specialisations.
Integration may reduce the effectiveness of service delivery if it damages the
accumulation of skill and knowledge among services and the benefits derived from
skill specialisation.3 Third, potential governance issues arise with the integration of
services: Who takes the lead in an integrated network? Are partnerships sustainable
in the presence of possible free rider effects? Free-rider effects arise when members
of an integrated team gain the benefits of integration without putting commensurate
effort into developing and sustaining the partnership. Fourth, integration can result in a
dilution of the autonomy and blur the uniqueness of individual services. This can have
adverse impacts on service outcomes when staff in agencies have invested much in
the development of the agency and have an attachment to it. Finally, service
integration may create privacy issues for clients given the sharing of information and
data that arises in an integrated service delivery framework.
Given the pros and cons of service integration, more research is needed to build the
evidence base on how these countervailing forces play out in organisations and what
the overall impact of service integration is on the effectiveness of services. However,
there is a limited literature on the integration of services in the homelessness domain.
For example, the only Australian study, which examines the issue of service
integration in the homelessness domain using quantitative measures, is that of Keast
et al. (2008), which examined integration among homelessness services in
Queensland and mapped linkages between agencies based on shared resources,
shared planning and programming, and shared referrals.4
The purpose of the present study is to increase our understanding of the extent and
ways in which homelessness, drug and alcohol, and mental health services work
together to provide services to homeless people. The study also considers the
barriers, costs and benefits of service integration and the perceived effectiveness of
various integrated service delivery responses. One of the important features of the
present study is that it focuses at both the service level and at the level of the client
and addresses client perceptions of the effectiveness of the services they are
receiving, given their various needs.
The term integration is used in this study to cover all forms of working together,
service linkage, cooperation, coordination, collaboration and partnership. We focus at
the level of services in this study but do not lose sight of the critical importance of
systems-level integration. System-level integration involves cross-sectoral and
jurisdiction-level interventions, which bring together services from different support
systems under purpose-built, centrally funded and managed, coordinated programs of
support. Service-level integration, on the other hand, involves the coordinated delivery
of individual services across different sectors irrespective of whether or not the
2 Interestingly, such transaction costs can be reduced through the strongest form of integration, namely,
direct merger of the separate organisations. 3 However, service integration may add to improved service effectiveness if knowledge is efficiently
transferred between organisations. 4 The Keast et al. (2008) study differs from the present study in that it considers a narrower set of
dimensions of integration using measures drawn from network analysis and focuses solely on the homelessness sector and not across the homelessness, drug and alcohol and mental health domains as in the present work.

10
coordination which occurs is part of a purpose-built, system-wide integrated service
delivery program or reflects the actions of individual services working together at the
local level.
Beyond the distinction between system and service level integration, it is also
important to distinguish between vertical and horizontal integration. Vertical integration
refers to the integration of services performing different functions within the same
organisation or agency, while horizontal integration refers to the integration of services
across agencies.
A critical point of focus in the present study is that we are concerned with how clients
themselves see the service system. As such, we follow Mares et al. (2008) in focusing
attention on client-level integration, a client-centred approach to integration.5 Client-
level integration focuses on the experiences and perceptions of clients as to whether
they face a seamless system of care and support in which needs are met, irrespective
of who provides assistance to them. Client integration can be conceptualised in one of
two ways: (1) how clients perceive the service system, and whether it works
seamlessly in their eyes to meet their needs in a timely appropriate fashion; and (2)
how clients experience the service system, and whether it works seamlessly in actual
practice to meet their needs in a timely appropriate fashion.
The intended outcome of systems and service level integration is improved client-level
integration, and the intended outcome of enhanced client-level integration is improved
client outcomes. While an analysis of client outcomes is beyond the scope of the
present study, we will investigate linkages between the depth of service integration
and perceptions of clients in terms of the effectiveness of services provided to them
given their needs.
Integration can be conceptualised in terms of its structure, functioning, and
effectiveness (Browne et al. 2007). In Browne et al.’s (2007) framework, which we
have found particularly helpful, the structure of integration reflects the number of
sectors involved in the network (extent of integration), the number of service types or
forms of assistance within the network (‘scope’), and the degree of exchange among
individual services (‘depth’). The functioning of integration refers to the quality of
networks and the critical ingredients for effective integration in the selected networks.
The quality of a network is a function of synergy, leadership, efficiency, management
and resource elements. The overall effectiveness of service integration is a function of
the extent to which clients are receiving seamless support, given their needs, as well
as the impact of an integrated service system on the operation of organisations
themselves within the system. We discuss concepts of integration and the Browne et
al. (2007) framework in detail in Chapter 2 of the report and use an adapted form of
this framework in our empirical work.
Over the past few years, there has been an increased focus on the role of service
integration in achieving improved outcomes in the homelessness service system,
particularly with respect to the integration of specialist homelessness services with
mental health and drug and alcohol services. The White Paper, The road home,
specifically refers to the need for ‘services to be more connected, integrated and
responsive to achieve sustainable housing, improve social and economic participation
and end homelessness for their clients’ (see Australian Government 2008, 2009a).
The National Partnership Agreement on Homelessness has, as one of its key
5 Our use of the term client integration is different from a variety of ways in which the term is used
including in the health context as the integration of clients into the community after a period of residential care.

11
strategies, a better-connected service system (see Flatau et al. 2010 for a further
discussion).
A similar focus on service integration is evident in the mental health domain. The
Fourth National Mental Health Plan sets out an agenda for collaborative government
action in mental health over the period 2009–14. The National Mental Health Plan
takes a ‘whole of government’ approach by involving sectors other than health in
achieving mental health objectives. More specifically, the National Mental Health Plan
refers explicitly to the need for the development of ‘integrated programs between
mental health support services and housing agencies to provide tailored assistance to
people with mental illness and mental health problems living in the community’
(Australian Government 2009b, p.iv). It also calls directly for ‘integrated approaches
between housing, justice, community and aged care sectors to facilitate access to
mental health programs for people at risk of homelessness and other forms of
disadvantage’ (Australian Government 2009b, p.iv).6
In the drug and alcohol space, the National Drug Strategy (NDS) and its forerunner,
the National Campaign Against Drug Abuse (NCADA), have been operating since
1985 with a focus on partnerships across service sectors (Australian Government
2004, 2011). In the most recent version of the NDS (2010–15), explicit recognition is
given of the need to connect alcohol and drug services with other services, including
homelessness services, to meet those with complex needs. For example, the NDS
states: ‘Strong partnerships and integrated service approaches with alcohol and other
drug treatment, social welfare, income support and job services, housing and
homelessness services, mental health care providers and correctional services are
needed if people with multiple and complex needs are to be assisted to stabilise their
lives, reintegrate with the community and recover from alcohol and other drug related
problems’ (Australian Government 2011, p.7).
Despite the focus on systems and service integration in the present policy
environment and among practitioners, there has been no study, as far as we are
aware, of the integration of homelessness, mental health and drug and alcohol
services in Australia. This study aims to fill this critical gap in the literature. The study
addresses six research questions, as follows:
1. What do we mean by the term ‘service integration’? What models and typologies of ‘service integration’ have been advanced in the existing literature?
2. How do key policy and practice stakeholders in the homelessness, drug and alcohol and mental health sectors in Australia define ‘service integration’ and its role in the delivery of services to clients?
3. What is the current structure and functioning of service integration in selected networks within the homelessness, drug and alcohol and mental health sectors? How does the practice of service integration in Australia compare with the existing models?
4. What do clients and the practitioners who work with them, tell us about clients’ experiences of service integration and coordinated care within the homelessness, drug and alcohol and mental health sectors?
5. What are the views of homelessness, drug and alcohol and mental health services about the pros and cons of service integration and its overall effectiveness, particularly in relation to the delivery of services for homeless people?
6 However, the National Mental Health Plan includes little by way of practical detail concerning the
implementation of such an approach.

12
6. In what ways can the findings of this study inform the development of policy with respect to service integration and the practice of integrated service delivery for homeless people?
We address the above research questions using a cross-sectional, mixed methods
study design. Our research design comprises three key components:
1. Interviews at both the Commonwealth and state level with key stakeholders (policy-makers; senior industry representatives; departmental staff) within the homelessness, drug and alcohol and mental health sectors.
2. Case studies of specialist homelessness and health services in Sydney, Perth and Melbourne.
3. A multi-level survey (the Integration Survey) of senior agency managers, service managers and clients in selected networks within the homelessness, drug and alcohol and mental health sectors in Perth and Melbourne.
The report is structured as follows:
Chapter 2 addresses our first research question by reviewing key concepts in the
integration literature, including existing models and typologies of integration. We
present a conceptual framework that can be used to measure integration, which has
been strongly influenced by the work of Browne et al. (2007).
Chapter 3 details the study’s research design, outlining the approach taken to key
stakeholder interviews, case studies, and the multi-level Integration Survey.
Chapter 4 addresses our second research question by examining the way in which
the term ‘integration’ is used and applied in different settings by practitioners and
policy-makers and its serviceableness for policy and practice.
Chapter 5 explores our third research question by assessing the structure and
functioning of integration within selected networks. The structure of integration is
considered using findings on the extent, scope and depth of integration. The
functioning of these networks is then considered by examining the quality of
partnerships and the critical ingredients for effective integration in the selected
networks.
Chapter 6 addresses our fourth research question by examining clients’ experiences
and perceptions of service integration. In other words, the chapter focuses on the
question of client integration. This chapter also discusses clients’ views of the
importance of integration, indicators of integrated service delivery at the client-level,
access to services, and client outcomes. In addition to clients’ own reports, the views
of stakeholders are also discussed.
Chapter 7 addresses our fifth research question on the pros and cons of service
integration, and considers its overall effectiveness, particularly in relation to the
delivery of services for homeless people. In limiting our discussion of the effectiveness
of service integration to views and perceptions of respondents to the Integration
Survey and to qualitative interviews with stakeholders, we recognise that we are only
just at the beginning of answering the question of how effective service integration is
or could be in achieving improved outcomes for clients. That would require a detailed
assessment of client outcomes arising from the application of different models of
integration and the intensity of their application. This is beyond the scope of the
present study.
Chapter 8 provides a summary of findings from the present research, and a
discussion of the relevance of these findings. The implications of the present findings
for policy and practice are then considered in line with our sixth and final research

13
question. Some key questions arising include: How is the decision to integrate made
(when and how far)? Who should drive integration and how is the integration of
services made sustainable? The limitations of the study are also discussed as well as
future directions for research.

14
2 LITERATURE REVIEW
Research Question 1: What do we mean by the term ‘service integration’? What
models and typologies of ‘service integration’ have been advanced in the existing
literature?
This chapter briefly reviews existing definitions and models of integration and
examines the empirical literature on integration.7 We present a flexible framework of
integration drawing on and, in some areas extending, the work of Browne et al. (2007)
that provides a typology of integration as well as a measurement framework and the
starting point for a normative account of integration. We use the Browne framework to
help inform our empirical analysis presented in future chapters. This chapter also
considers briefly key drivers of integration and the policy case for integration.
2.1 What is integration?
Integration is a term used in a number of different ways in the literature. However,
common to all definitions is the notion that integration involves ‘joint working’ in one
form or another (Care Services Improvement Network 2009, p.7). As Konrad (1996,
p.6) suggests, integration is ‘a process by which two or more entities establish
linkages for the purpose of improving outcomes for needy people’. As these
definitions suggest, the term integration is used to cover a range of models of working
together, not simply the most comprehensive form of service interaction; namely, the
case of ‘a single system of needs assessment, service commissioning and/or service
provision’ (Care Services Improvement Network 2009, p.17).
Much of the work on service integration has been undertaken in the health care
context. A commonly cited definition of integrated care in this context is that
developed by the WHO European Office for Integrated Health Care Services:
Integrated care is a concept bringing together inputs, delivery, management
and organization of services related to diagnosis, treatment, care,
rehabilitation and health promotion. Integration is a means to improve services
in relation to access, quality, user satisfaction and efficiency. (Gröne & Garcia-
Barbero 2002, p.1)
Another prominent definition of integration is that used by the Canadian Council on
Health Services Accreditation, which defines integration in the following terms:
Services, providers, and organizations from across the continuum working
together so that services are complementary, coordinated, in a seamless
unified system, with continuity for the client (cited in Suter et al. 2007, p.7).
Similarly, Leutz (1999, pp.77–78) defines integration in the health care context as:
The search to connect the health care system (acute, primary medical, and
skilled) with other human service systems (e.g. long-term care, education, and
vocational and housing services) in order to improve outcomes (clinical,
satisfaction and efficiency).
What integration means depends on which stakeholders are of interest. Lloyd and
Wait (2006) list these various stakeholders and their views of integration as:
Users: a process of care that is seamless, smooth and easy to navigate.
Frontline providers: working with professionals from different fields and coordinating tasks and services across traditional boundaries.
7 This chapter draws heavily on our earlier Positioning Paper on integration (see Flatau et al. 2010).

15
Managers: merging or coordinating organisational targets and performance measures, and managing and directing an enlarged and professionally diverse staff.
Policy-makers: design of integration-friendly policies, regulations and financing arrangements; evaluation of systems/programs on a holistic basis.
It is also important to distinguish between integration at the systems level involving
jurisdiction-level interventions typically undertaken by government, which bring
together services from different support systems under purpose-built, centrally-funded
and managed, coordinated programs of support and integration at the service level.
Service-level integration involves the coordinated delivery of individual services within
and/or across different sectors, irrespective of whether or not the coordination that
occurs is part of a purpose-built, system-wide integrated service delivery program or
reflects the actions of individual services working together at the local level.
2.2 A typology of integration: construct
A number of typologies of integration exist in the literature. One typology of integration
that has been influential and which we find particularly useful is that provided by
Konrad (1996). Konrad’s (1996) typology of integration is organised around two key
main principles: the intensity of integration and the dimensions of integration. By the
intensity of integration, Konrad (1996) means the extent or strength of integration.
Konrad uses the term ‘dimensions of integration’ to cover a multitude of elements
around structure and process including the parties who are involved in providing
integrated care, the services that are subject to mechanisms of integration, who is
financing the integrated services and so on.
Konrad’s (1996) Integration Continuum begins with fragmented or independent
service delivery undertaken by autonomous agencies. It then moves through various
stages ending finally with ‘integration’. The continuum is set out below:
information sharing and communication
cooperation and coordination
collaboration
consolidation
integration.
The least intense type of informal integration involves information sharing and
communication between independent services or agencies. A stronger form of
informal integration involves inter-agency cooperation and coordination revolving
around loose arrangements in relation to activities such as reciprocal client referral.
The next level of intensity involves collaboration between agencies. Collaboration
involves still-autonomous agencies working together to achieve a common goal or
outcome and may involve activities such as partnerships with written agreements,
cross-training and shared information systems.
A stronger form of integration in Konrad’s typology involves an umbrella organisation
delivering services on a consolidated basis with functions being centralised but with
each organisation retaining its independent authority. The fully integrated system
involves a single authority covering all relevant needs of clients and doing so in an
individualised form with a blending of all activities and a common funding pool.
Glasby (2005) takes a similar approach to a typology of integration. He distinguishes
between the depth of integration (similar to Konrad’s intensity of integration) and the
breadth of integration. The depth of integration is measured on a continuum from

16
sharing information and consulting each other, to coordinating activities, joint
management, partnerships and mergers. The breadth of integration refers to the
coverage of the integrated care response across different sectors or domains.
Keast et al. (2007) and Ahgren and Axelsson (2005) also use a continuum approach
to conceptualise integration (see Figures 1 and 2 below). Keast et al. (2007)
incorporate in the continuum the so-called three ‘Cs’ of cooperation, coordination and
collaboration. The three Cs lie between a fully fragmented approach on the one hand
and full integration on the other.8
A number of conceptualisations of integration refer to the various levels at which
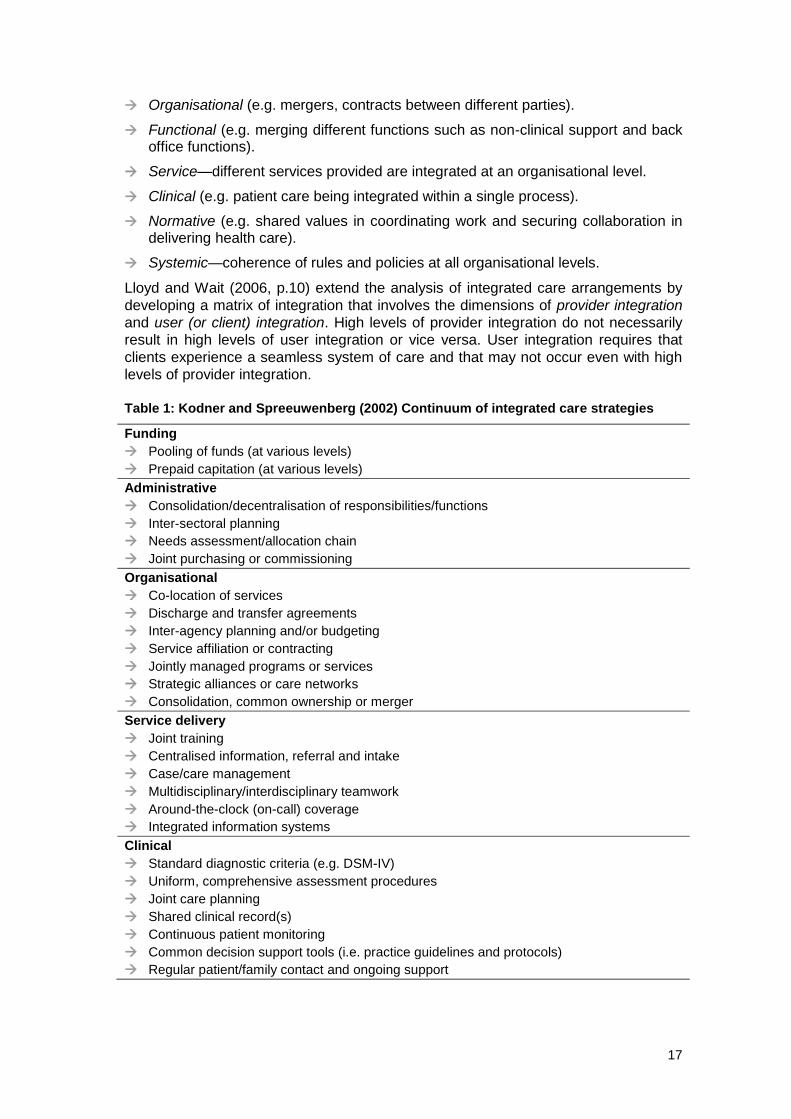
integration can work or the strategies involved in integration. Kodner and
Spreeuwenberg’s (2002) structure, replicated in Table 1, differentiates between
integrated care strategies at the funding, administrative, organisational, service
delivery and clinical levels.
Figure 1: Keast et al.’s (2007) integration continuum
Source: Keast et al. (2007)
Figure 2: Ahgren and Axelsson’s integration continuum
Source: Ahgren and Axelsson 2005
Leutz (1999, p.77) suggests that integration can occur at the policy, finance,
management and clinical levels and may involve various means, including ‘joint
planning, training, decision- making, instrumentation, information systems,
purchasing, screening and referral, care planning, benefit coverage, service delivery,
monitoring, and feedback’. Ramsay et al. (2009, pp.3–4) suggest that effective
integration requires that integration takes place across a number of domains,
including:
8 A similar presentation, distinguishing between full segregation through to linkage, coordination and
cooperation to full integration, is adopted by Ahgren and Axelsson (2005).
Fully fragmented Fully connected
Cooperation Coordination Collaboration
Limited connection Medium connection High connection
Low intensity Medium intensity High intensity
Fully segregation Fully integration
Linkage Coordination in networks Cooperation
Linkage: independent organisational units. Referral of patients to the right unit at the right time and
good communication between the professionals involved in order to promote continuity of care.
Coordination in networks: operates largely through existing organisational units. Coordination of
different health services, the sharing of clinical information, and the management of the transition
of patients between different units.
Full integration: the resources of different organisational units are pooled in order to create a new
organisation.
17
Organisational (e.g. mergers, contracts between different parties).
Functional (e.g. merging different functions such as non-clinical support and back office functions).
Service—different services provided are integrated at an organisational level.
Clinical (e.g. patient care being integrated within a single process).
Normative (e.g. shared values in coordinating work and securing collaboration in delivering health care).
Systemic—coherence of rules and policies at all organisational levels.
Lloyd and Wait (2006, p.10) extend the analysis of integrated care arrangements by
developing a matrix of integration that involves the dimensions of provider integration
and user (or client) integration. High levels of provider integration do not necessarily
result in high levels of user integration or vice versa. User integration requires that
clients experience a seamless system of care and that may not occur even with high
levels of provider integration.
Table 1: Kodner and Spreeuwenberg (2002) Continuum of integrated care strategies
Funding
Pooling of funds (at various levels)
Prepaid capitation (at various levels)
Administrative
Consolidation/decentralisation of responsibilities/functions
Inter-sectoral planning
Needs assessment/allocation chain
Joint purchasing or commissioning
Organisational
Co-location of services
Discharge and transfer agreements
Inter-agency planning and/or budgeting
Service affiliation or contracting
Jointly managed programs or services
Strategic alliances or care networks
Consolidation, common ownership or merger
Service delivery
Joint training
Centralised information, referral and intake
Case/care management
Multidisciplinary/interdisciplinary teamwork
Around-the-clock (on-call) coverage
Integrated information systems
Clinical
Standard diagnostic criteria (e.g. DSM-IV)
Uniform, comprehensive assessment procedures
Joint care planning
Shared clinical record(s)
Continuous patient monitoring
Common decision support tools (i.e. practice guidelines and protocols)
Regular patient/family contact and ongoing support
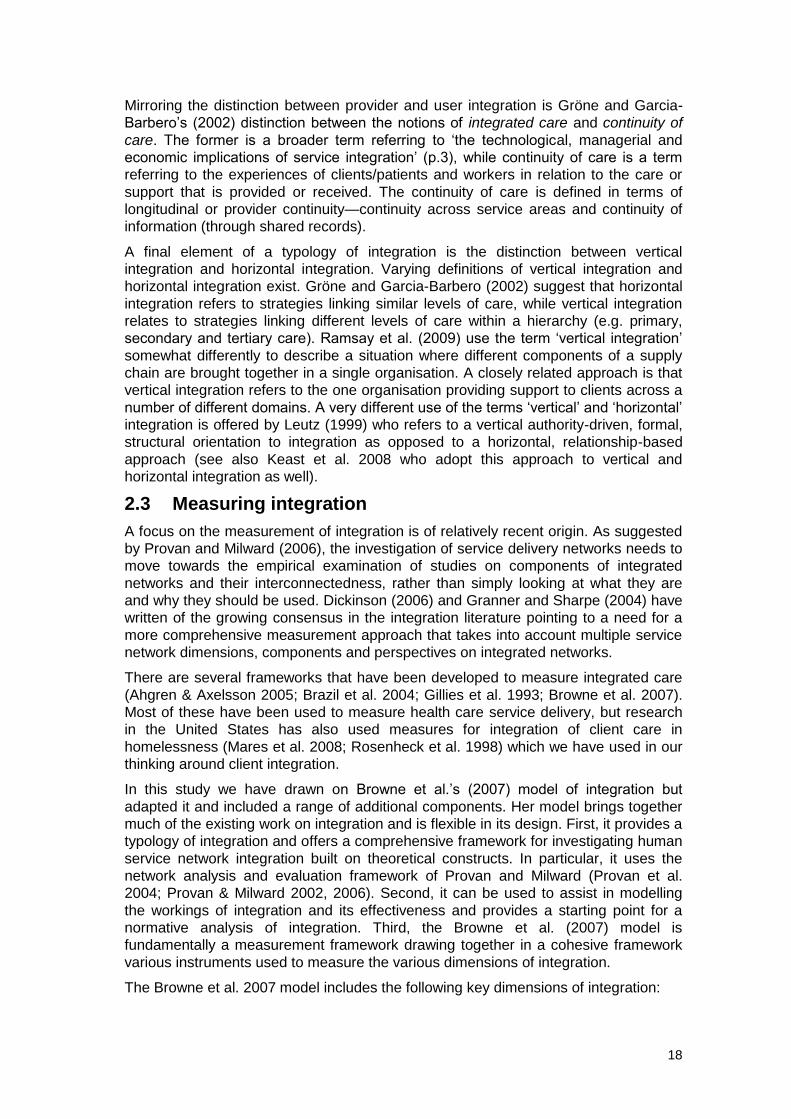
18
Mirroring the distinction between provider and user integration is Gröne and Garcia-
Barbero’s (2002) distinction between the notions of integrated care and continuity of
care. The former is a broader term referring to ‘the technological, managerial and
economic implications of service integration’ (p.3), while continuity of care is a term
referring to the experiences of clients/patients and workers in relation to the care or
support that is provided or received. The continuity of care is defined in terms of
longitudinal or provider continuity—continuity across service areas and continuity of
information (through shared records).
A final element of a typology of integration is the distinction between vertical
integration and horizontal integration. Varying definitions of vertical integration and
horizontal integration exist. Gröne and Garcia-Barbero (2002) suggest that horizontal
integration refers to strategies linking similar levels of care, while vertical integration
relates to strategies linking different levels of care within a hierarchy (e.g. primary,
secondary and tertiary care). Ramsay et al. (2009) use the term ‘vertical integration’
somewhat differently to describe a situation where different components of a supply
chain are brought together in a single organisation. A closely related approach is that
vertical integration refers to the one organisation providing support to clients across a
number of different domains. A very different use of the terms ‘vertical’ and ‘horizontal’
integration is offered by Leutz (1999) who refers to a vertical authority-driven, formal,
structural orientation to integration as opposed to a horizontal, relationship-based
approach (see also Keast et al. 2008 who adopt this approach to vertical and
horizontal integration as well).
2.3 Measuring integration
A focus on the measurement of integration is of relatively recent origin. As suggested
by Provan and Milward (2006), the investigation of service delivery networks needs to
move towards the empirical examination of studies on components of integrated
networks and their interconnectedness, rather than simply looking at what they are
and why they should be used. Dickinson (2006) and Granner and Sharpe (2004) have
written of the growing consensus in the integration literature pointing to a need for a
more comprehensive measurement approach that takes into account multiple service
network dimensions, components and perspectives on integrated networks.
There are several frameworks that have been developed to measure integrated care
(Ahgren & Axelsson 2005; Brazil et al. 2004; Gillies et al. 1993; Browne et al. 2007).
Most of these have been used to measure health care service delivery, but research
in the United States has also used measures for integration of client care in
homelessness (Mares et al. 2008; Rosenheck et al. 1998) which we have used in our
thinking around client integration.
In this study we have drawn on Browne et al.’s (2007) model of integration but
adapted it and included a range of additional components. Her model brings together
much of the existing work on integration and is flexible in its design. First, it provides a
typology of integration and offers a comprehensive framework for investigating human
service network integration built on theoretical constructs. In particular, it uses the
network analysis and evaluation framework of Provan and Milward (Provan et al.
2004; Provan & Milward 2002, 2006). Second, it can be used to assist in modelling
the workings of integration and its effectiveness and provides a starting point for a
normative analysis of integration. Third, the Browne et al. (2007) model is
fundamentally a measurement framework drawing together in a cohesive framework
various instruments used to measure the various dimensions of integration.
The Browne et al. 2007 model includes the following key dimensions of integration:

19
Structural inputs: the extent, scope, depth, congruence with and reciprocity between agencies (Browne et al.’s 2004 and Browne et al.’s 2007 Integration of Human Services Measure is used to measure the structural inputs of integration)9.
The functioning of the network: broken down into the quality of the network (based on Weiss et al.’s 2002 Partnership Self-assessment Tool) and the ingredients that go into it10.
Network outputs (or effectiveness): measured by the network’s capacity to achieve outcomes from the dual perspecitves of the services as well as their clients.
Our major additions to the Browne et al. (2007) framework are a focus on the clients
of services and their perceptions of the effectiveness of services (integration from a
client’s persepective) given their needs and the views of services managers as to the
benefits, costs and barriers of service integration and their views as to the
effectiveness of integration practices. These are key missing links in the existing
framework. We conceptualise these elements as being part of the network outputs of
integration. The qualitative findings (see subsequent chapters of the study) also
highlighted additional aspects of functioning that contributed to the effectiveness of
integration.
Figure 3 depicts the adapted form of the Browne et al. (2007) model used in the
present study. It includes additional elements around the effectiveness of service
integration, links elements of the model to client needs, and seeks to gain
perspectives on integration from a wide set of stakeholders.
9 See Thurston et al. (2010), Browne et al. (2012), and Ye et al. (2012) for recent uses of the Browne
Integration of Human Services Measure. Browne at al. (2004) provides a discussion of the validity of the measure. 10
In Browne at al. 2004 (p.7), the Browne Integration of Human Services Measure correlated weakly with
the Weiss measure of partnership synergy but more highly with satisfaction. They took this as evidence that the two questionnaires were measuring different components of integration.

20
Figure 3: Adaptation of Browne, Kingston, Gridisa and Markle-Reid’s (2007) model of
‘Dimensions of Human Service Network Integration’

21
Each of the dimensions (structure, functioning and effectiveness) represented in this
framework of service network integration are unique aspects of integrated service
networks. Thus, each dimension distinctly contributes to the description of an
integrated human service network. For example, the quality of a network could be
high as measured by strong partnership synergy. However, stakeholders may
experience service integration as time intensive for their service. In this case, high
levels of network functioning would not necessarily lead to better network outputs.
Browne et al.’s (2007) adapted model is a framework for measuring the different
dimensions of integration using multiple levels of analysis, with information being
potentially compiled from the CEO of an agency, a representative of the chief funding
body of the agency, team leaders of individual services within an agency, and clients
of the service. Results can therefore differ between levels of respondents and should
be viewed as mutiple perspectives of the network from the varying stakeholders. In
the present study, perspectives were sought from agency executives, service
managers and clients/consumers via the Integration Survey; front-line workers via
case studies of homelessness and health services/programs; and policy and practice
stakeholders from across the homelessness, mental health and drug and alcohol
sectors via in-depth interviews.
The Browne et al. 2007 Integration of Human Services Measure, used to assess the
structure of integration (extent, scope and depth of integration), has previously been
applied to self-defined structured networks of services. Our approach in this study is
somewhat different. We have selected geographical locations in Perth and Melbourne
and defined the relevant ‘network’ as all homelessness, mental health and drug and
alcohol services that lie in the chosen geographical area. We are aware that services
in the chosen regions do work together, have protocols of engagement and exist in a
policy and practice environment that seeks greater integration. However, only in the
case of the Melbourne location does there exist a formal network entity (it was chosen
for this reason to provide insights into the workings of such an approach). The Perth
location represents in our view a standard non-formalised network structure common
in respect of these three domain areas in Australia. We wish to understand the extent,
scope and depth of integration in these chosen geographical regions.
2.4 Drivers and enablers of integration
When developing a model of integration we are interested in understanding the key
drivers of integration among services and the critical enablers of integration. Williams
and Sullivan (2009) suggest the major drivers influencing integration are agency and
structural forces. Individuals and organisations are the creative drivers of integration
but they create change within the structural parameters of their environment. Agency
comes into play in various ways through motivation, goals, leadership and personal
skills, experience and capabilities. In terms of structural forces, Williams and Sullivan
(2009) focus on the role of economic and social drivers, the legislative and institutional
framework, available resources, histories of collaboration, accountability structures
and organisational cultures.
Ouwens et al. (2005) focus on a number of key enablers of successful integration.
They include supportive service information systems; agreement between personnel
involved on the nature of the integration; leaders with a clear vision of integrated care;
resources for the implementation and maintenance of integrated care approaches
(recognising the possible significant transaction costs involved in integration);
management commitment and support; clients capable of, and motivated for, self-
management; and a culture of quality improvement. At the other end of the spectrum,
key barriers to successful integration include entrenched professional values and

22
approaches, which are often oriented toward specialisation and fragmentation (Gröne
& Garcia-Barbero 2002; Goodwin 2008).
A number of authors point to the key aim of integrated care arrangements, namely,
the implementation of a client-centred approach to care. As Lloyd and Wait (2006,
p.7) suggest:
Integrated care seeks to close the traditional division between health and
social care. It imposes the patient’s perspective as the organising principle of
service delivery and makes redundant old supply-driven models of care
provision. Integrated care enables health and social care provision that is
flexible, personalised, and seamless.
In much the same vein, Allen and Stevens (2007) and Goodwin (2008) suggest that
the prime objective of integrated care is to shift the focus of attention from a service
delivery to a client-centred approach. In a social housing context, Phillips et al. (2009)
suggest that the key objectives and potential benefits of the integration of services are
improved client outcomes, enhanced client access to services, greater equity and
consistency, increased efficiency and enhanced accountability and control. We use
this thinking in our definition of client-integration—the experience and perceptions of
clients as to whether they face a seamless system of care and support in which needs
are met irrespective of the actual services accessed by clients.
2.5 Summary
In this chapter, we have presented definitions and typologies of integration and a
framework for measuring integration and its effectiveness to be used in subsequent
analyses.
Integration involves ‘joint working’ in one form or another and this can range from
loose collaborative arrangements around referral of clients and good communication
between staff in different organisations to coordinated delivery of services and full
integration where the resources of different organisational units are pooled in order to
create a new organisation.
Integration can be developed on a system-wide basis and be centrally funded and
managed (system-level integration) or be generated at a service level involving the
coordinated delivery of individual services within and/or across different sectors
(service-level integration). It may also occur within agencies (vertical integration) or
between agencies (horizontal integration) and involve a broad range of stakeholders
including users, frontline providers, managers and policy-makers. Ultimately, system-
level integration and service integration is a means to the intermediate end of greater
client integration (a seamless service system as perceived by clients of services) and
the final end of improved client outcomes.
A typology of integration entails structural, functioning and output dimensions. In this
study, we adapt the typology and associated measurement framework presented in
Browne et al. (2007). We place particular focus on the clients of services and their
perceptions of the effectiveness of services in meeting their needs in a timely and
seamless fashion and the views of service managers as to the benefits, costs and
barriers of service integration and the effectiveness of integration practices.

23
3 RESEARCH METHODOLOGY
This cross-sectional, mixed methods study comprises three components: interviews
with key stakeholders; case studies of specialist homelessness and health services;
and a multi-level survey of specialist homelessness, drug and alcohol, and mental
health services, the agencies they operate from and the clients they assist (the
Integration Survey).
The study was conducted in three stages. First, a round of key stakeholder and case
study interviews were carried out in the homelessness sector. Along with a review of
the extant literature on the measurement of integration (see Flatau et al. 2010), the
findings that emerged from these interviews informed the development of the
Integration Survey. The second stage of the study involved the dissemination of the
Integration Survey among agencies, services and their clients and a second round of
key stakeholder and case study interviews within the health sector. The third stage of
the study involved the analysis of findings from interviews with key stakeholders; case
studies of specialist homelessness and health services; and the multi-level Integration
Survey.
3.1 Sites
The study was conducted across three capital cities: Perth, WA; Melbourne, VIC; and
Sydney, NSW. These cities were chosen because of differences in the structure of the
health systems across the three states. As outlined in the study’s Positioning Paper,
structural forces are an important driver of integration (Williams & Sullivan 2009).
Ethical approval was obtained for the conduct of the research in each state as follows:
Murdoch University HREC (2009/210)
University of Western Australia HREC (2009/210)
University of New South Wales HREC (09269)
University of Western Sydney HREC (H9437)
Nepean Blue Mountains Local Health District HREC (11/42 – LNR/11/NEPEAN/69)
Swinburne University of Technology HREC (2011/277).
It is useful to describe in more detail the operation of the three sectors in each of the
jurisdictions of interest.
3.1.1 Victoria
Responsibility for the homelessness and housing sectors in Victoria rests with the
Department of Human Services, Office of Housing. This government agency provides
strategic oversight of the temporary accommodation system, social housing and
tenancy support programs.
The Department of Health has oversight of both the mental health and drug and
alcohol sectors. The mental health treatment system is divided into two parts. These
are the clinical services provided directly by the Department of Health including
hospital and community-based services (e.g., primary mental health teams, crisis
assessment and treatment, consultation and liaison), and statewide specialist services
(e.g., early psychosis services, dual diagnosis services); and Psychiatric Disability
Rehabilitation and Support Services (PDRSS) provided through the NGO sector.
PDRSS are funded to provide psychosocial support services including home-based

24
outreach support, day programs, care coordination, residential rehabilitation services,
supported accommodation services and respite services.
In contrast, the drug and alcohol treatment system in Victoria is entirely comprised of
NGOs funded to provide community-based treatment (e.g. counselling services,
pharmacotherapy, withdrawal services, rehabilitation and post-withdrawal services),
forensic treatment (e.g. diversion programs), needle and syringe programs and
support services (e.g., telephone information service).
3.1.2 Western Australia
The lead agency for homelessness in Western Australia is the Department of Child
Protection, which is responsible for the funding and delivery of homelessness crisis,
transitional, outreach and other support services. The Department of Housing is
responsible for capital infrastructure, tenancy management and tenancy support
services to formerly homeless people as well as those who enter public and
community housing with significant alcohol and other drug issues and mental health
problems.
Unlike Victoria and New South Wales, the drug and alcohol and mental health sectors
have separate governance structures (although they both report to the Minister for
Mental Health)—the West Australian Alcohol and Drug Authority and the Mental
Health Commission, respectively.
The alcohol and other drugs (AOD) treatment system is divided into two funding
streams: government-delivered clinical services (Next Step); and counselling and
support services provided through the NGO sector. The two service streams are co-
located and operate as integrated Community Drug Services managed by the lead
NGO partner.
In contrast, mental health services—both hospital and community-based services—
are predominantly government services but also include some NGO community-
based services. Recently, there has been a policy shift to provide individualised
support packages for people with persistent and severe mental illness.
3.1.3 New South Wales
New South Wales Housing is the lead agency for homelessness in New South Wales.
However, administrative responsibility for the temporary and crisis accommodation
system rests with the Department of Community Services (DoCS). NSW Housing has
operational responsibility for public housing and provides strategic support to the
social housing sector, including funding of community housing providers.
Homelessness services are provided by not-for-profit community service agencies
that are funded by the NSW and Australian Governments. The same arrangement
applies in each of the relevant jurisdictions.
In contrast to the homelessness sector, the NSW government is a direct provider of
mental health and drug and alcohol services delivered through 15 Local Hospital
Networks (LHNs; previously a smaller number of Area Health Services). The drug and
alcohol treatment system comprises pharmacotherapy services, withdrawal
management services, rehabilitation and counselling services, and consultation liaison
services. This is augmented by an NGO sector that provides residential rehabilitation
and education and prevention services.
The mental health treatment system comprises inpatient services (acute and non-
acute), community mental health services, family and carer support programs,
rehabilitation services, emergency services (hospital- and community-based acute

25
care teams), and supported accommodation services. Additional services are
provided through the NGO sector (counselling and support services).
Policy direction, funding and governance of both treatment systems is provided by a
single agency—the Mental Health and Drug and Alcohol Office (MHDAO), which was
formed in 2006 from the merger of the Centre for Mental Health and the Centre for
Drug and Alcohol. At an operational level however, the two treatment systems operate
as distinct entities. Additionally, the two treatment systems are culturally distinct; for
example, mental health has a stronger link to enforced service provision (e.g.
community treatment orders) whereas drug and alcohol places more emphasis on
client motivation for treatment.
3.2 Methods
A detailed description of the methodology for each component of the study is outlined
in the following sections.
3.2.1 Key stakeholder interviews
Stakeholder interviews aimed to document:
The policy environment (including governance structures and funding) at both the federal and state/territory levels regarding homelessness, mental health and drug and alcohol, and whole-of-government approaches.
Stakeholder perceptions of integration—what it means, how it can be operationalised and implemented, and the benefits and costs of integration.
Key stakeholders were invited to participate in the study by way of an initial telephone
or email contact and were provided with the study information sheet. If agreeable, a
time and location for the interview was organised. The interview was approximately 30
to 45 minutes duration, conducted either face-to-face or via the telephone, audio
recorded (with the consent of the participant) and later transcribed. A copy of the
transcript was provided to participants upon request.
Participation in the study was voluntary. All participants provided verbal consent at the
beginning of the interview; none declined to be audio recorded. No participant
reimbursement was provided.
Interviews were semi-structured and included the following discussion prompts:
meaning/definition of integration; objectives of integration; effective approaches to
integration; key mechanisms of integration at the client level, service provider level,
organisational level, strategic and policy levels; and the factors that facilitate and
impede integration.
Key stakeholders were identified by a variety of means, including:
An internet search for key commentators in the drug and alcohol, mental health and homelessness fields.
Review of government department websites such as Premier and Cabinet, health, housing and community services/child protection.
Perusal of membership on relevant national and state councils or boards.
Recommendations made my key stakeholders already interviewed.
A total of 32 key stakeholders were approached to be interviewed. Four persons
declined to be interviewed and three others did not respond to the invitation, resulting
in a total sample size of 25 stakeholders.

26
3.2.2 Case studies
Case studies aimed to develop a comprehensive understanding of how integration is
being implemented at the ground-level, including localised responses that agencies
have developed to meet client need, the way in which agencies work within the
current policy framework and governance system (especially funding arrangements),
and their experience of when integration works well and when it does not.
An initial interview (either face-to-face or by telephone) was held with a senior staff
member (usually the CEO or an Operational Manager) to ascertain the organisational
structure of the agency and identify appropriate programs and services to be included
in the case study. The senior staff member notified the staff about the project and
contact details were provided to the research team. Individual staff were then
approached and had the study explained to them, were provided with a copy of the
study information sheet, and if agreeable, a time and place for the interview was
arranged. Participation in the study was voluntary; staff had the option of declining to
be interviewed despite their nomination by senior staff.
Interviews were approximately 30 to 45 minutes duration and predominantly
conducted face-to-face, usually during a site visit to the organisation by a member of
the research team. In a few cases, staff were unavailable during the site visit and their
interviews were subsequently conducted by telephone at a later date.
Supporting documentation, either concerning the agency as a whole or for a particular
service, was collected as part of the site visits and interviews. This included, but was
not limited to, Annual Reports, service evaluations, MOU’s or other agreements, and
brochures for programs or services.
Interviews were semi-structured and included the following discussion prompts:
Description of service/program and how it is linked into the broader organisational structure.
Target client group and definition of client success.
Integration mechanisms/strategies employed and the impact of these on successful client outcomes.
Linkages and partnerships with external services/agencies; factors that facilitate and impede effective integration.
Funding sources and reporting requirements.
3.2.3 The Integration Survey
The Integration Survey is a multi-level survey comprising three sub-questionnaires—
an agency form, a service form, and a client form. The survey was designed to map
the degree of integration that currently exists between agencies that provide
homelessness, mental health and drug and alcohol services, to gather the views of
service managers as to the effectiveness of partnership arrangements, the key
ingredients of integration and its pros and cons, and to gather client-based data of
relevance to the study.
The agency is the over-arching, auspicing or management organisation under which
individual services operate. What constitutes the agency depends on the context
involved. For example, compare a single site organisation (e.g. a women’s refuge) to
a national organisation that has a national head office, a state head office, several
statewide operational divisions and numerous services or programs within each
division, only one of which was located within the study catchment area. In the former,
the agency is the same thing as the organisation. In the latter case, the agency would

27
be equated with the operational division that had corporate responsibility for services
operating in the region of our study.
For the purpose of the study, a ‘service’ is a defined program of assistance provided
by an agency typically but not always from a given geographic delivery site. Where
there were a number of very similar services operating from a single site, but perhaps
with different funding arrangements—such as a specialist drug and alcohol agency
offering opioid pharmacotherapy, inpatient detoxification, general counselling and
court diversion programs—we combined those services into a meta-service
comprising multiple programs or teams for the purposes of the Integration Survey.
The client form was delivered to clients of services that completed the service form.
Survey development
The Integration Survey was developed on the basis of a review of the literature,
preliminary findings from the homelessness key stakeholder and case study
interviews, and previous service evaluations conducted by the research team.
All items were developed specifically for the present study with the exception of two
critical measures, the Partnership Self-Assessment Tool (Weiss et al. 2002) and the
Integration of Human Services Measure (Browne et al. 2004, 2007). The Health
Systems Integration Study System Integration Scales (Gillies et al. 1993) guided the
development of the integration with other services, question 15 of the Services
Questionnaire.
The measures included in each form are summarised in Table 2.
Table 2: Measures included in the Integration Survey
Form Measurement domains
Agency Jurisdiction, specialisation, services provided
Funding sources
Formal integration mechanisms—internal and external
Service Jurisdiction, specialisation, services provided
Funding sources
Target client population, presenting problems, referral sources
Staffing profile
Partnership Self-Assessment Tool (Weiss et al. 2002)
Integration of Human Services Measure (Browne et al. 2007)
Cross-sectoral service integration
Perceptions of integration—meaning, benefits, costs and desirability
Client Demographic details
Homelessness history (lifetime)
Psychosocial problems and support received (past three months)
Self-report mental disorder diagnosis (lifetime)
Service utilisation and access barriers (past three months)
Case management and experience of coordinated care
Perceptions of integration
Data collection
A comprehensive list of specialist homelessness, mental health and drug and alcohol
services within each locality was generated using a number of strategies including a

28
web-based search and consultations with funding bodies, informal networks, inter-
agency groups and coalitions. Consultation most often occurred by telephone but also
involved attendance at inter-agency meetings and forums.
Confirmation of participation was sought from the appropriate management personnel
at each agency and service. All potential participants were provided with a study
information sheet. Survey packs—comprising a single agency form, one or more
service forms (dependent on the number of homelessness, mental health and drug
and alcohol services in the region), and five client forms for each participating
service—were then generated for each agency. These were disseminated by post
with a reply-paid envelope for their return.
All three forms, Agency, Service and Client, were designed to be self-completed. The
time taken to complete each form was around 15 minutes, 30 minutes and 20 minutes
for the Agency, Service and Client forms respectively.
Individual agencies were asked to identify five clients to participate in the survey. A
staff member who was not directly involved in their clinical care and provided with a
study information sheet and Client Form, approached clients. Participation was
voluntary and clients simply returned the Client Form to the staff member if they
declined to participate. Staff continued to approach clients until the maximum of five
clients were recruited. The Client Form was anonymous and consent to participate
was implied through completion of the survey. All client participants were provided
with a $10 gift card as reimbursement for participation.
There were significant delays in gaining the necessary ethical approvals for some of
the larger agencies and their respective services. In particular, a restructure of the
area health services in NSW (including a restructure of staff positions) meant it was
difficult to identify the agency level and an appropriate local investigator in Sydney
(necessary for ethical approval and site authorisation). Thus, the Integration Survey
was administered in Perth and Melbourne only. Delays were also experienced in
gaining ethical approval for the participation of government health services in
Melbourne. However, this comprised only a small portion of the total Melbourne
sample and thus the Melbourne sample was retained (but consists entirely of NGO
services).
Localities for data collection
In Victoria, specialist homelessness, drug and alcohol, and mental health agencies
from the outer eastern metropolitan region of Melbourne were invited to participate in
the study. This was deemed a suitable site for the survey as it contains a diverse
range of community organisations and cross-sector partnerships and is said to be an
area of growing need. The outer east metropolitan region comprises of the following
local government areas: Maroondah, Knox and Yarra Ranges. It also includes
Whitehorse-East (Statistical Local Area). These regions form the outer east mental
health service area (OEMHSA), as defined by the Government of Victoria.
A large multi-function agency network caters to residents in the outer east. This
makes the outer east an interesting area to study in relation to service integration.
Many of the services within this region, which historically functioned as independent
agencies, are now part of a local consortium of health services. Health is broadly
defined, and includes specialist homelessness services. For the most part, many of
these services still function independently, but under the umbrella of the local
consortium. The purpose of this consortium is to improve service coordination and
cross-sector partnerships in the local area. While there are clients in the outer east
requiring specialist homeless services, only a relatively small number of specialist

29
homelessness services are located in this region. A greater number of services for
homeless clients are more centrally located in Melbourne's CBD.
In Western Australia, the survey was conducted in the Perth Central Business District
(CBD) and surrounding suburbs and then down through the South Eastern Corridor
which includes Victoria Park, Bentley and Cannington. These geographical areas
were chosen as they include a range of government and non-government agencies, of
various sizes, providing homelessness, drug and alcohol, and mental health services
in an area of high need in Perth. The Perth CBD and South Eastern Corridor was a
suitable area in which to conduct the survey. This was because of the concentration of
homelessness, drug and alcohol and mental health issues, the varied government and
non-government agencies that provide services and how these agencies not only
service the local CBD area but also provide services to other northern and southern
metropolitan areas. The Perth site was chosen as representing a typical area in which
homelessness, drug and alcohol and mental health services work together, follow
protocols of engagement that exist in relation to different service systems and exist in
a policy and practice environment that seeks greater integration, but do not operate
within a formal network entity.
The Melbourne and Perth sites were picked, in large part, to illustrate the extent and
workings of integration in different environments. In particular, the Melbourne site has
an advanced multi-function agency combining many different services in operation. It
also has fewer homelessness services and relatively more mental health services
than the Perth site. As such, we would expect findings on the extent and working of
integration in the two sites to differ.
3.3 Participants
3.3.1 Key stakeholder interviews
Table 3 shows the jurisdiction, sector and level for each of the 25 stakeholders
interviewed. The homelessness and drug and alcohol sectors are well represented;
the mental health sector less so. The majority of key stakeholders held positions in the
policy space, and were recruited to aid in documenting the policy framework and
governance structures in the relevant regions.
3.3.2 Case studies
Three homelessness agencies (one from each capital city) and two health agencies
(one from Melbourne, one from Sydney) were selected as case studies. Table 4
provides an overview of the agencies involved. Appendix 1 presents a summary
structure of the operation of these agencies and their key homelessness, mental
health and drug and alcohol programs.
3.3.3 The Integration Survey
Table 5 shows the number of agencies and services that participated in the
Integration Survey. A total of 33 agencies and 66 services participated. Some
agencies surveyed were single focus agencies, that is providing services for drug and
alcohol treatment and support only, while others were multi-function in nature,
providing clients with services covering more than one issue, for example, support
services and treatment for homelessness and mental health issues.
The total number of agencies is less for Melbourne, as the majority of services
identified within the Melbourne study site were part of a single, multi-function agency.
The four Melbourne agencies were responsible for 19 services, the majority of which
were specialist mental health services. The Perth sample included 29 agencies,
approximately half of which were multi-function agencies, and 47 services, the

30
majority of which were specialist homelessness services. In Western Australia, mental
health services are predominantly provided by several large government agencies
(e.g. hospitals), whereas homelessness and drug and alcohol services are mostly
provided by numerous smaller non-government agencies. It is for this reason that the
number of agencies and services surveyed are lower for the mental health agencies in
comparison to the homelessness and drug and alcohol services.
Agencies
All participating agencies identified as not-for-profit, non-government agencies. The
agencies made use of a broad range of funding sources (see Table 6). For example,
within the Melbourne sample, the single specialist homelessness agency received
funding from all sources, as did the specialist mental health agency. Similarly, the
Perth agencies also identified multiple funding sources although, in contrast, none of
the agencies received any local council funding.
Services
Characteristics of the participating services are shown in Table 7. All of the specialist
homelessness services provided temporary or crisis accommodation. In addition,
approximately half also provided mental health support and half provided drug and
alcohol support.
In addition to mental health support, approximately one-third of the specialist mental
health services also provided temporary/crisis accommodation, one-half provided drug
and alcohol support, but fewer provided long-term housing support. Many of the
specialist drug and alcohol services also provided mental health support, as might be
expected from recent investment in dual diagnosis training within the drug and alcohol
sector.
Services were funded from a variety of sources but predominantly from government
funding sources; the most common source of funding for all service domains was
state/territory funding and this was followed closely by Commonwealth funding.
With regard to the target populations of services, most accepted both male and
female clients. There was a fairly even distribution of homelessness and housing
services that targeted individuals or families and those that accepted both client
groups. In contrast, most mental health services targeted individuals only, whereas
there were few drug and alcohol services that focused solely on this client group. Drug
and alcohol services were more likely to either focus solely on families or cater for
both individuals and families. Seventeen services provided assistance to youth
predominantly drawn from specialist homelessness and drug and alcohol services.
Indigenous Australian and CALD client populations were included across all service
domains.
Most of the specialist homelessness, housing and mental health services were
smaller services, servicing fewer than 300 clients in the last financial year. This is
likely reflective of the low client turnover for these services. For example, the
specialist homelessness services typically provided temporary or crisis
accommodation and the average episode of care for these services ranged from one
month to more than 12 months. For the specialist housing services, this ranged from
three months to more than 12 months and the majority of the specialist mental health
services supported their clients for one year or longer.
In contrast, specialist drug and alcohol services typically saw upwards of 100 clients
per year, with over half of the services treating more than 500 clients in the past
financial year. Approximately three-quarters of the services indicated an average

31
treatment episode of six months or less; few were longer than six months and only
one drug and alcohol service typically saw clients for longer than 12 months.
Clients
Table 8 shows the sample characteristics for the client participants. A total of 269
clients completed the survey, with the largest proportion recruited from specialist
homelessness services (39%), followed by mental health services (33%), drug and
alcohol services (19%) and housing services (9%).
Approximately half of all client participants were male and this was true for all service
domains except specialist housing services where three-quarters of participants were
male. The mean age of participants was similar across all service domains (range:
35–42 years), with the youngest participants found in drug and alcohol services (35
years) and the oldest in mental health services (42 years). The majority of client
participants were born in Australia (range: 73–86% across the service domains) but a
significant minority spoke a language other than English in their family homes. The
proportion that spoke another language at home was highest for the homelessness
service domain (32% and 20%, respectively) whereas it was much lower for the
mental health and drug and alcohol service domains (12% and 9%, respectively).
The drug and alcohol service domain had the highest proportion of Indigenous
Australian participants (22%), followed by the homelessness service domain (18%).
Only 8 per cent of housing participants and 5 per cent of mental health client
participants identified as Indigenous Australians.
The majority of client participants across all service domains had fewer than 11 years
of schooling; this was highest for the specialist housing service (72%), followed by
mental health (68%), drug and alcohol (65%) and homelessness (57%). Just under
one-half of the specialist homelessness client participants had achieved a minimum of
12 years schooling; this reduced to approximately one-third for the other service
domains (range: 28–35%). There were also substantial proportions of clients with
post-school education, ranging from 12 per cent among the specialist housing clients
to 32 per cent among the specialist homelessness clients.
Most clients were in receipt of government benefits (range: 89–96% across the
different service domains). Four per cent of clients from the specialist drug and
alcohol services had no source of income. The proportion of clients in paid
employment was found to be very low across all domains (1–5%), with the lowest rate
for specialist mental health services (1%).
Lifetime exposure to homelessness was high across all service domains: 94 per cent
among drug and alcohol services; 91 per cent among specialist homelessness
services; 90 per cent among housing; and 79 per cent among mental health services.
Unexpectedly, drug and alcohol clients had the highest rates of rough sleeping at
some point over their lifetime (82%) compared to 51 per cent for homelessness
clients, 51 per cent for mental health clients and 68 per cent for housing clients.
A similar pattern was found for couch surfing: the highest rate of couch surfing was for
drug and alcohol clients (82%), followed by housing (76%) then homelessness (64%)
and mental health (57%). Client participants from specialist housing services had the
highest lifetime exposure to crisis accommodation (76%) while the lowest prevalence
for this form of homelessness was found among clients of mental health services
(52%).
Staying in a boarding house was most common for housing client participants (68%)
and least common for homelessness client participants (37%); client participants from
mental health and drug and alcohol services reported similar exposure rates (40%

32
and 45%, respectively). The highest rate of exposure for hotel/motel stays (as a last
housing resort) was found for the housing (52%) and drug and alcohol service
domains (51%), whereas the rates were much lower for the mental health and
homelessness client participants (34% and 32%, respectively).
The most common form of homelessness among client participants from the specialist
homelessness and housing services was couch surfing and staying in crisis/temporary
accommodation. In contrast, the most common forms of homelessness for the mental
health and drug and alcohol client participants was sleeping rough and couch surfing.
What this profile of agency, service and client participants in the Integration Survey
reveals is a close underlying connection in client background between the
homelessness and drug and alcohol services in particular but also with mental health
services. Using the incidence of lifetime homelessness as an indicator, there is, for
example, little difference between drug and alcohol services and homelessness
services in terms of the prevalence of exposure to homelessness among clients of
these service domains.
These findings lend support to the contention presented earlier that all three sectors
share many of the same clients and addresses and, in many cases, similar problems
among their clients. It is the intersection in clients and client needs across the three
service domains that provides the underlying ground for greater collaboration between
services across the homelessness, drug and alcohol, and mental health systems.
3.4 Summary
Our study of service integration is the first major empirical analysis of integration in
Australia across three service systems—homelessness, drug and alcohol services
and mental health services. It combines a multi-level quantitative survey, the
Integration Survey, with an extensive qualitative program of qualitative research
involving iinterviews with key stakeholders (policy-makers; senior industry
representatives; departmental staff) and case studies of specialist homelessness and
health services in Sydney, Perth and Melbourne. The multi-level Integration Survey
obtains data at the agency, service and client level and therefore provides critical
insight into the extent and workings of integration within and across agencies and
services and its impact on clients’ perception of the service system.

33
Table 3: Stakeholder profile, key stakeholder interviews
Sector Level
ID # Jurisdiction Homelessness Mental health Drug & alcohol Policy Research/Advocacy Operations Clinical
KS01 Federal
KS02 Federal
KS03 NSW
KS04 NSW
KS05 NSW
KS06 NSW
KS07 NSW
KS08 NSW
KS09 NSW
KS10 NSW
KS11 VIC
KS12 VIC
KS13 VIC
KS14 VIC
KS15 VIC
KS16 VIC
KS17 VIC
KS18 WA
KS19 WA
KS20 WA
KS21 WA
KS22 WA
KS23 WA
KS24 WA
KS25 WA
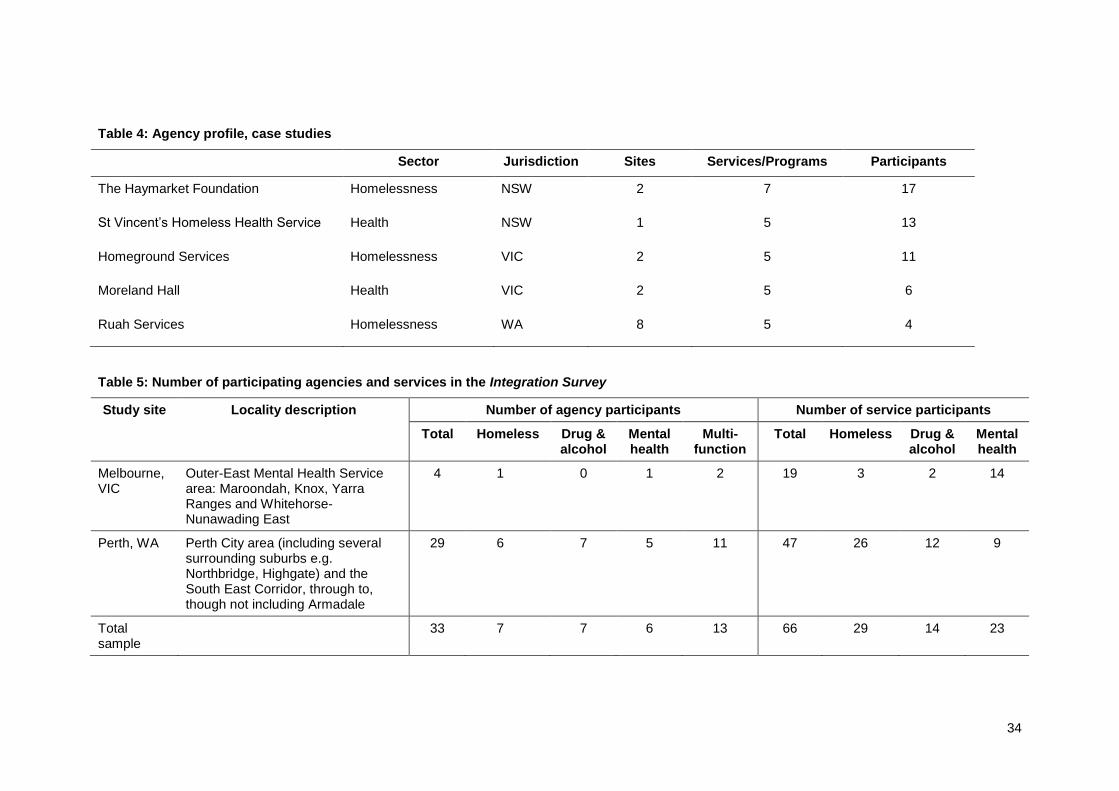
34
Table 4: Agency profile, case studies
Sector Jurisdiction Sites Services/Programs Participants
The Haymarket Foundation Homelessness NSW 2 7 17
St Vincent’s Homeless Health Service Health NSW 1 5 13
Homeground Services Homelessness VIC 2 5 11
Moreland Hall Health VIC 2 5 6
Ruah Services Homelessness WA 8 5 4
Table 5: Number of participating agencies and services in the Integration Survey
Study site Locality description Number of agency participants Number of service participants
Total Homeless Drug & alcohol
Mental health
Multi-function
Total Homeless Drug & alcohol
Mental health
Melbourne, VIC
Outer-East Mental Health Service area: Maroondah, Knox, Yarra Ranges and Whitehorse-Nunawading East
4 1 0 1 2 19 3 2 14
Perth, WA Perth City area (including several surrounding suburbs e.g. Northbridge, Highgate) and the South East Corridor, through to, though not including Armadale
29 6 7 5 11 47 26 12 9
Total sample
33 7 7 6 13 66 29 14 23
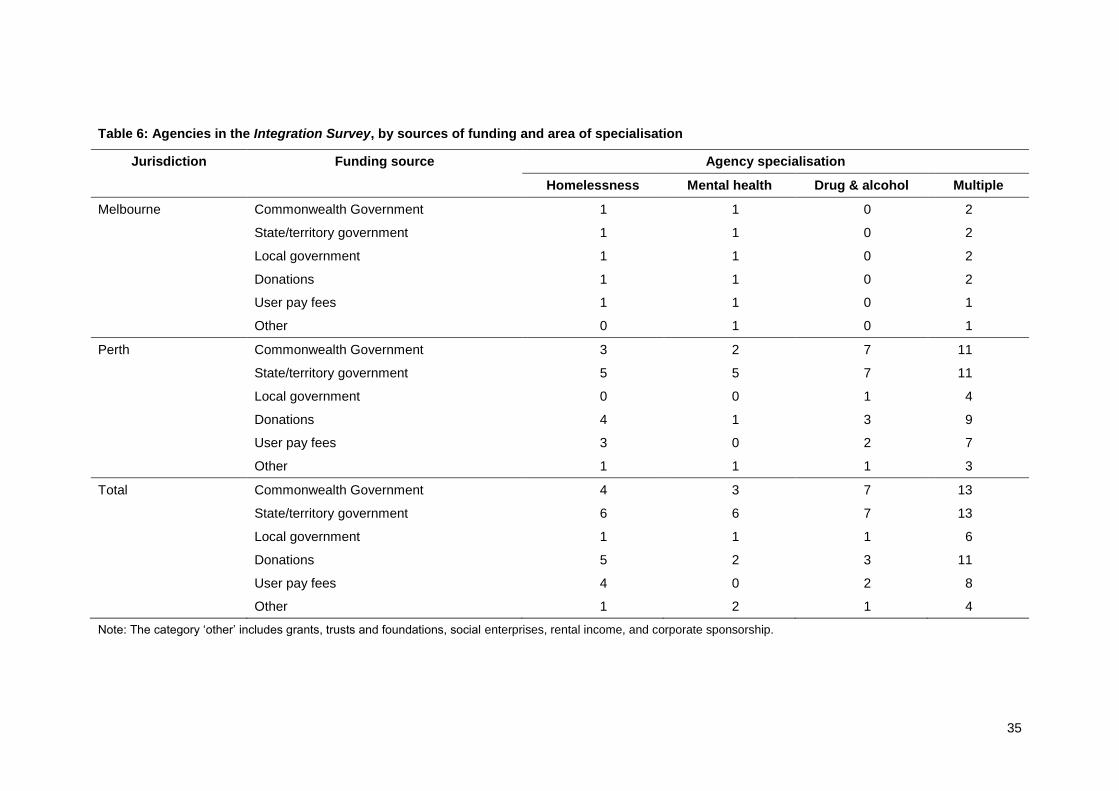
35
Table 6: Agencies in the Integration Survey, by sources of funding and area of specialisation
Jurisdiction Funding source Agency specialisation
Homelessness Mental health Drug & alcohol Multiple
Melbourne Commonwealth Government 1 1 0 2
State/territory government 1 1 0 2
Local government 1 1 0 2
Donations 1 1 0 2
User pay fees 1 1 0 1
Other 0 1 0 1
Perth Commonwealth Government 3 2 7 11
State/territory government 5 5 7 11
Local government 0 0 1 4
Donations 4 1 3 9
User pay fees 3 0 2 7
Other 1 1 1 3
Total Commonwealth Government 4 3 7 13
State/territory government 6 6 7 13
Local government 1 1 1 6
Donations 5 2 3 11
User pay fees 4 0 2 8
Other 1 2 1 4
Note: The category ‘other’ includes grants, trusts and foundations, social enterprises, rental income, and corporate sponsorship.

36
Table 7: Services in the Integration Survey, by area of specialisation by assistance provided, funding sources, target population, service size and
mean episode of care
Crisis/Transitional Accommodation Long-term Housing Mental Health Drug and Alcohol
Assistance provided
Crisis/transitional accommodation support 21 3 8 1
Long-term housing 3 3 6 0
Mental health support 9 1 23 9
Drug and alcohol support 8 1 9 14
Funding sources
Commonwealth Government 12 3 6 11
State/territory government 23 4 20 13
Local government 1 0 0 2
Donations 8 0 7 5
User pay fees 7 0 5 4
Other 4 0 1 1
Target population
Males only 4 0 0 0
Females only 3 0 2 1
Both males and females 17 5 21 13
Individuals only 9 1 11 4
Families only 6 1 3 7
Both individuals and families 10 3 9 3
Young people only (aged 24 years or less) 7 1 4 5
Indigenous Australians 17 4 18 14
Culturally and linguistically diverse people 17 4 18 13

37
Crisis/Transitional Accommodation Long-term Housing Mental Health Drug and Alcohol
Service size
Less than 50 4 0 3 0
50 to 100 10 4 13 0
101 to 300 5 1 5 3
301 to 500 3 0 0 3
More than 500 2 0 2 8
Mean episode of care
Less than 1 month 0 0 0 2
1 to 3 months 7 0 0 6
3 to 6 months 4 2 2 3
6 to 12 months 8 2 3 2
More than 12 months 4 1 17 1

38
Table 8: Characteristics of client participants, stratified by service domain
Crisis/transitional accommodation
(n=104)
Long-term housing
(n=25)
Mental health
(n=89)
Drug and alcohol
(n=51)
Demographics
Male (%) 47 76 47 51
Mean age (yrs) 37 39 42 35
Australian born (%) 74 76 79 86
Non-English language spoken at home (%) 32 20 10 8
Aboriginal or Torres Strait Islander (%) 19 8 5 22
Highest level of education
Primary school (%) 6 4 1 4
Some secondary school (%) 16 36 23 18
Completed secondary school to Year 10 or 11 (%) 36 32 44 43
Completed secondary school to Year 12 (%) 11 16 12 8
Trade certificate, apprenticeship (%) 3 0 3 10
TAFE qualification (%) 21 8 14 10
University bachelor degree or higher (%) 8 4 3 8
Main source of income
No income (%) 0 0 0 4
Registered and awaiting benefit (%) 2 0 0 0
Government benefit (%) 93 96 96 89
Spouse/partner’s income (%) 0 0 1 0
Maintenance/Child Support (non-government) (%) 0 0 1 0
Weekly allowance from family/friends (%) 0 0 1 0
Paid employment (%) 5 4 1 4
Workers compensation (%) 0 0 0 0
Other (%) 0 0 0 2

39
Crisis/transitional accommodation
(n=104)
Long-term housing
(n=25)
Mental health
(n=89)
Drug and alcohol
(n=51)
Lifetime homelessness
Slept rough or in makeshift dwelling (%) 51 68 51 82
Stayed with family/friends (couch surfing) (%) 64 76 57 82
Stayed in an accommodation service (%) 66 76 52 59
Stayed in a boarding/rooming house (%) 37 68 40 45
Stayed in a hotel/motel (%) 32 52 34 51

40
4 UNDERSTANDINGS OF INTEGRATION
Research Question 2: How do key policy and practice stakeholders in the
homelessness, drug and alcohol and mental health sectors in Australia define the
concept ‘service integration’ and its role in the delivery of services to clients?
A primary aim of this study is to deconstruct the term ‘integration’ and explore the
extent to which different stakeholders understand the concept of integration so as to
complement the review of uses of the term ‘integration’ in the literature (see Chapter
2).
This chapter will discuss the ideas raised by key stakeholders and case study
participants on how integration can be defined (in a way relevant to the sectors
involved in the present study). It also examines the serviceableness of the concept of
integration for practice and policy.
4.1 System and service integration
Integration means that we’ve divided up officially things in the past which
shouldn’t have been divided.
Four broad themes emerged from the interviews: coordination of networks,
connectedness, client-centred service delivery, and extension of professional
boundaries. Overall, the consensus was that integration can be defined as a
coordinated network of connected and ‘joined up’ services that takes a
multidisciplinary approach to supporting clients’ needs.
4.1.1 Coordinated networks
A number of participants described integration as involving a network of coordinated
services. For example, a homelessness case study participant commented:
It’s a matter of a coordinated network of services being involved.
This was expanded upon by a drug and alcohol research/advocacy key stakeholder:
I think about the core requirements for a person to be sustained in the
community and then having one service identified as the key linking service or
responsible service that then needs to bring in and work with other services to
ensure that the person is cared for. And so, in reverse order, that I guess
would then be my definition of integrated service provision. So yeah, for me it’s
really about the how-to and achieving efficient and effective use of resources
in as coordinated and timely manner, so that is the sequencing issues and
timeliness issues. To try and discover what is the most effective and efficient
way for a person to be supported in the community and to work towards that
being sustainable.
A health case study participant saw a well-coordinated network as akin to a
community of smaller service teams:
It’s about services working together for common goals. And, I guess with that,
there’s an understanding that services are going to have different goals as
well, and that’s okay. But a strong and clear communication and shared goals
and aims, I guess. And an understanding of how each service or each
individual is working, because you’re looking for integration between
individuals and a team to create the team, and then integration between teams
to create a service. But then it’s more about all those different services linking
in. So it’s kind of a community.

41
There was some discussion regarding formal versus informal development of
networks and the degree to which government should be responsible for creating and
enforcing system-level integration. For example, a policy key stakeholder held the
view that:
Integration for me is more about trying to make sure that all agencies are
aligned to being able to respond to the problem—not just at an individual level,
at a systemic level. The other models I think appear to be created for the
individual. Integration to me is about the system being integrated, so that it
responds in a systemic way so that you know that for 100 cases it’s going to
deliver the sorts of responses that will meet the client’s housing requirements,
their health requirements, their immediate crisis requirements, their drug and
alcohol issues. There might be employment or there might be child issues;
other risk factors that need to be dealt with. For 100 clients the system is going
to be able to systemically respond rather than have to be created. I think with
some of the other models where they talk about integration, it’s a forced
integration. And what I’m talking about is clearly a lot harder to achieve.
On the other hand, networks that developed informally were seen to have an
advantage of being flexible and responding to local needs. This is indicated in the
following comment from a mental health research/advocacy key stakeholder:
You know, people don’t want to be running from pillar to post to access
services needed. But I think what those one-stop shops might look like will
vary community to community. It will be about what local infrastructure exists,
what skill deficits exist and I think the process of communities coming together
to agree on what their services might look like is as important as setting these
things up. Like, right now, the government seems to be saying, ‘Here, cop
these medical care locals, they are going to be your one-stop shops’. And, in
some communities there are informal one-stop shops. You see organisations
cluster together, their relationships are really strong and the smaller the town,
the stronger their relationships become.
A common observation was that services tend to align themselves with other services
that hold similar values to their own, as this is where integration is most harmonious
and synergistic. Thus, the development of grass-roots networks may occur more
easily within a sector and less easily across sectors, given the different philosophies
and ideologies and historical ways of working that define the different service spaces
of homelessness, mental health and drug and alcohol.
In this regard, there is likely to be a need for some governance or direction across the
network to ensure that key services are represented. This is, however, a difficult and
fraught process, as indicated by a mental health advocacy key stakeholder:
What you see from a planning perspective is that—and this is coming from our
state but is actually starting to push out into a national framework—they are
trying to come up with models where they can work out all of the needs inside
and outside of the [mental health] sector and start coming up with a
methodology of how to resource that. But, you know, there are always these
idealised models; they are based on very generic figures and the reality is we
have done our mapping of the sector, we know that homeless are doing the
same thing right now … What we see on the ground is it’s like there’s some
sort of static in the transmission: they have got maybe only one of that sort of
service, and then six of this service for some reason, and then zero of three
other types of services that they really need, and the place just down the road
has the reverse.

42
4.1.2 Connectedness
Connectedness and a ‘joined-up’ service delivery was the most common definition of
integration given by participants. It was commonly expressed with respect to
redressing the siloed service system that dominates the human services system:
I think of different things, like a cog, fitting into each other. Things just sitting in
nicely, working together and it keeps working, it’s all—that analogy of a cog.
Participants referred to connections between services within a multi-function agency
(vertical integration), to connections between services from different agencies, and
connections across levels of need or specialty areas such as drug and alcohol and
mental health (horizontal integration). Moreover, it was the act of connecting rather
than the method by which services connected that appeared to be most relevant.
Participants offered many different examples of how services could be connected or
‘joined-up’ as indicated in the following comment by a mental health
research/advocacy stakeholder:
I mean, basically, service integration is about services working together but
how you do that can look radically different, you know, it can be a
collaboration, it can be about cooperation, it can be about networking.
Case study participants did not necessarily focus on a particular strategy by which
connectedness could be achieved. Key stakeholders, on the other hand, were more
likely to emphasise a particular model over another. This may relate to different aims
of integration between the practice and policy levels. For example, client engagement
and client-identified needs were deemed to be critical aspects of integration for front-
line workers and this typically involved patience and restraint on the part of the worker
and necessitated the use of multiple strategies to achieve the desired outcomes.
Health case study participants typically talked about connectedness as ‘coordinated
care’. Inherent in this definition is the role of effective communication between the
different health specialities providing care for an individual. This concept was also
strongly linked to the notion of multi-disciplinary teams, as explained by the following
participant:
So our integrated care is us as a team working as a whole. We're not separate
even though we have our own specialties within a specialty. We work together
… they have different skills as well and they might focus on one specialty
whereas we might have other things we can help with: we can't do housing,
but we can do the health side. So it's about me going, ‘okay, what have you
got, what do you need, what can work together?’
Moreover, some participants expressed the belief that integration could continue in
the background among health and other professionals even where the client was not
fully engaged. This was explained by a health case study participant as follows:
It just depends upon the client whether what they need [as defined by the
health professional] is what they might need at that time—that doesn't mean
that all of us can't work together in all specialties … There might be just
physical health [needs] at the moment because they can't cope with the other
issues, but those people are still on standby in the background and offering
advice anyway. So I think it's just as many or as few as the client needs to look
after them.
Integration is commonly examined from a systems and service perspective and there
is surprisingly scant mention of client integration in the research or policy space.
Client integration refers to clients’ perceptions that their treatment is delivered as a

43
‘one-stop shop’, single location on a single day or they are receiving coordinated care
rather than having to repeat historical information and receive separate care
programs; how the client measures the integration of the services they receive
(Brindis et al. 2005; Mares et al. 2008). The findings from the interviews conducted in
this study suggest, however, that front-line workers and operational managers are
acutely aware of the need to respond respectfully to clients’ needs and not to impose
their own framework of helping onto the client. The tension between the provision of
care and respect for client choice was highlighted by a number of key stakeholders
and case study participants, as indicated by the following quote:
What that means to me is services working better together in more joined-up
ways, but that doesn’t negate the person and their rights and choices being
central to that process. I guess, philosophically the view would be that the
person needing and wanting and choosing the services is their own case
manager and it’s about the services respecting that.
Client respect and human rights also underpinned the idea of integration being a
seamless service delivery response from the perspective of the client. We now turn to
this issue below.
4.1.3 Client centred
Integration as a ‘client centred’ process was the least tangible and most ‘idealistic’
definition proffered by participants. It encompasses assessment and referral
processes, but also the experience of a seamless service response, such that a
client’s movement through the system is almost imperceptible. Ultimately, of course, it
is a client’s own perception of a seamless service system that matters and which lies
at the heart of the notion of client integration (a subject we return to in Chapter 7).
One drug and alcohol research/advocacy key stakeholder explained the notion of
integration as ‘client centred’ in the following terms:
I think it is quite a complicated idea about how you give opportunity, capacity
and resources to a lot of services, to potentially recognise a core coordinating
role and then ability and authority to bring in other services as needed while
you actually follow the person, wherever they’re at, in the community. So in an
ideal world we would all be able to go to whatever service we were currently
either nearest to or felt like going to, and say, ‘these are the things that are
troubling me at the moment’, or get someone to discern that through some sort
of assessment or screening process. But we’ve tended historically to assume
that when people walk through a service, that let’s say has got ‘drug treatment
service’ on the door, that what they’re after is drug treatment and they’re ready
to express that desire and to receive whatever it is that we are offering. We
don’t assume that this is someone who’s looking for something, let’s find out
what it is.
Central to the idea of a client-centred approach as defined by the key stakeholder and
case study participants were the following characteristics:
No wrong door—the idea that a client can gain access into the entire human services system regardless of the service type at which they first present.
Comprehensive needs assessment—the idea that clients are treated as a ‘whole’ and that professionals consider the multiple needs of clients rather than ‘picking off’ only those that sit within their area of expertise.

44
Self-directed care—the idea that clients have a right to decide on the number and timing of needs to be addressed and the services that are to be involved in their care.
Facilitated referral—the idea that a ‘client doesn’t have to individually negotiate all the different services’ that are required; that much of the bartering for services happens behind the scenes by the human services professional.
Wrap-around care—the idea that services are brought to the client, whether that be through co-location of services or via facilitated referral pathways or other mechanisms.
4.1.4 Extension of professional boundaries
The final means by which integration was understood by key stakeholders and case
study participants was in terms of the professional backgrounds and disciplines of the
human services workforce. At the lowest level, this was expressed as the need for
multi-disciplinary approaches to the care of an individual. Although this could include
multi-disciplinary teams within a single service, it was also talked about in terms of
peer consultation with others outside of one’s own discipline or profession and the
learning of new knowledge through this shared experience. This is encapsulated in
the following comment from a homelessness service case study participant:
I think there’s definitely that element of working in partnership, yeah, and
division of labour. It can be that multi-disciplinary approach which is what I see
in the hospital so we’re kind of working together. As a social worker within
allied health, I’m working with the nursing staff as well as the medical team,
but I’m working as a social worker. In the community setting it’s a bit more
different in terms of integration ’cause it’s more inter-disciplinary so, yeah, I’m
looking a bit more outside my sphere so I’m looking at other kinds of medical
issues around substance abuse and other health concerns but working with
the services that specialise in this area as well. So seeking advice from the
experts, so to speak, but monitoring the client for my own work.
This broader way of working requires an additional skill set, something that may not
always be addressed in professional development pathways, but which invariably
tends to happen through experience and can, at times, be quite haphazard. As one
key stakeholder in the mental health space commented:
So you can sort of conceptualise behaviours in that space as occurring at the
services and systems level on the one hand, but also at the individual worker
service provider/practitioner level at the other end. And most of the spotlight in
the literature, interestingly enough, was on the services and systems level, not
on the worker level. It was almost like workers were expected to learn it
through osmosis.
Integration requires an extension of skills and knowledge beyond professional
boundaries and specifically funded activities to ensure that the gaps in the system are
overcome. The extension of boundaries can be viewed at multiple levels—individual
worker, service and system—as articulated in the previous quote and in the following
quote from a policy key stakeholder:
I think good integration means that there’s a degree of swap over between
services and policy areas and the degree of crossover in principles and
practice and intent.

45
This will require commitment from all stakeholders in the system, as it is, on a set of
core attributes that all human services professionals should have, regardless of their
professional background:
So it is everybody's task. It is not some specialist group’s task. It is not some
specialist group’s task to hive off a person’s feelings about themselves. At
some point, yes, but for the most part every person that you see at the
frontline has feelings about themselves, of being unwell in some way, of being
dispirited or concerned or whatever it might be. But that's not something you
shove off. So I think we’ve got to get people to have much more ownership.
4.2 The serviceableness of integration
Well, we know what dis-integration is ….
Compared with case study participants, key stakeholders, particularly those with
clinical and policy/advocacy experience, were more likely to admit to finding it difficult
to define and operationalise integration and to acknowledge the shortcomings of the
term. For example, a homelessness policy key stakeholder commented:
I don’t think it’s a useful term. I think integration in itself is a very worthy thing
to strive towards. I think that it’s just been used so much and so broadly that
really we don’t often pause to consider whether its uses actually are entirely
appropriate and whether we will be better off using words like coordination or
collaboration which are also, I think, probably, incredibly over-used words. To
me, service integration means that a whole range of services are working
together to create a whole unit. And more frequently when the word integration
is used, I think it’s probably more relevant to collaboration. You know, services
working together, but I don’t know if you could say that their efforts are really
creating a single combined whole.
This same stakeholder went on to describe the ubiquitous labelling of research
studies, demonstration projects and policy objectives as ‘integration’ without due
consideration of the implications of doing so:
… if you just look at something like the housing sector, particularly where an
initiative or a particular model is supported by government, people are really
very quick to adopt the lingo and the rhetoric and to bastardise certain ideas
without really understanding what it is that any one of those things does. So
that becomes a complicating factor.
Part of the difficulty in understanding integration is related to the fact that the
underlying architecture of integration may not exist, leaving the concept to work in a
vacuum. This was expressed by a clinical drug and alcohol stakeholder as follows:
Oh, I don't think it is a very good word because it's unclear as to what it
means. At one level it could mean integration of services, which is a very
difficult thing to achieve unless you’ve got organisational, administrative and
structural strategies to do that. For example, I imagine that the GP super
clinics may achieve this, but in most other environments it's really not achieved
at all. It’s certainly not achieved through the conventional drug and alcohol
services and certainly not achieved through current mental health services …
So, that goes back to my point that you need people engaging with the
individuals who have these problems who have a range of competencies and
a comprehensive approach. Unfortunately, medical care/healthcare/service
provision has retreated from that idea and so we have lots of different groups
with specific interests picking off elements of it, and in fact, complicating things
for the patient.

46
It was also acknowledged that ‘integration’ might not hold the same significance for
clients as for front-line workers and policy-makers. Language has the potential to
exclude people from the decision-making process and to pathologise individual
experiences. This is suggested in the following quote by a drug and alcohol policy
stakeholder:
It’s an interesting term because it can be a very valuable term but it can also
be loaded. So in terms of, for instance, mental health consumer politics, if I
can put it that way. People want to be citizens and participate in society, but
they don’t necessarily want to be integrated.
Some participants felt the problem was in defining integration as a structural
determinant rather than as a process by which positive client outcomes were more
likely to be possible. The latter conceptualisation of integration was considered to be
more useful by this drug and alcohol stakeholder:
I think I have a bit of a problem with some of the ideas that you can just have
an integrated service. For me, an integrated service isn’t a service that can
provide everything like a one-stop shop. Because just as you co-locate, say, a
drug and alcohol service, a mental health service and an acquired brain injury
service, then what you discover is that the person is actually incredibly
physically ill and so you are going to need primary health care services. Or you
discover the person’s eyesight is pretty poor and they need glasses. Or they
are going through a long-term grieving process and they have a post-traumatic
stress disorder and that needs very specialised intervention and you can’t
actually deliver it, even though you are there with all of these wonderful
grouped services. So that’s why I think of integration as a process, not a place
or a product or a service. And I think, to be done well, it needs to be
individualised.
4.3 Summary
The preceding sections demonstrate a shared understanding of integration among
professional groups across the homelessness, mental health and drug and alcohol
sectors although there were some differences with respect to the terminology used
across these service sectors. For example, health participants were more likely to use
the term ‘coordinated care’ to refer to the assessment process and subsequent
development of an individualised care plan. Both homelessness and health
participants however understood integration to involve connections between services
and an emphasis on client need.
There were also some differences between policy and practice stakeholders in how
they perceived integration. For example, policy stakeholders placed a greater
emphasis on particular models of integration. In contrast, practice stakeholders had a
greater sensibility about integration as a means to an end—that is, using whatever
strategies enabled them to achieve connectedness with other services and to meet
the needs of their clients.
47
5 THE STRUCTURE AND FUNCTIONING OF INTEGRATION
Research Question 3: What is the current structure and functioning of service
integration in selected networks within the homelessness, drug and alcohol and
mental health sectors? How does the practice of service integration in Australia
compare with existing models?
In this chapter, we describe the structure and functioning of integration within the
chosen networks, drawing upon data from the Integration Survey and interviews with
stakeholders and case study participants. This chapter is organised according to the
adapted model of integration of Browne et al. (2007) presented in Chapter 2. The
structure of integration is described in terms of the extent, scope and depth of
integration. The functioning of integration is examined in terms of the quality of
networks and the critical ingredients for effective integration.
5.1 Structure of integration
5.1.1 Extent of integration
Browne et al. (2007) define the extent of integration as the number of sectors involved
in a network. There are two separate components to this construction—the concept of
a sector and that of a network.
The term ‘sector’ denotes commonality/clustering in terms of human service functions,
discipline backgrounds, funding arrangements, sets of practices and rules, and group
allegiances. The term ‘network’ refers to a connected set of entities. This could be at
the macro level involving human service sectors or at the micro level involving
organisations or services.
In the Australian environment, the homelessness, mental health, and drug and alcohol
domains all operate as separate human service sectors. A narrower reading of the
term sector could increase the number of sectors involved in the present case from
three to more than three. In the case of homelessness, for example, it is certainly
useful to distinguish between the specialist homelessness sector and the long-term
housing sector, which provides long-term housing and tenancy support to those who
were formerly homeless and those at risk of homelessness. Within the homelessness
sector itself, it is possible to distinguish between different sub-sectors such as the
domestic violence sector, the single homelessness sector, the family homelessness
sector, and the youth sector.
Within the health domain, there exists a clear division between clinical or hospital-
based services and community-based services, particularly in the mental health area.
Browne et al. (2007) apply their measure of the extent, scope and depth of integration
in cases where an explicit network exists. In the present case, we would argue that
the notion of a network at a systems-level between the homelessness, mental health
and drug and alcohol sectors is something of a work in progress. Indeed, at the
service level it is something that we are indeed seeking to test.
In the case of the Perth location, we would argue that there exists, at the system-level,
a well-developed set of connections and partnerships between the mental health and
drug and alcohol sectors. These partnerships also operate with the homelessness
sector but not as decisively. There has always existed protocols and linkages between
the homelessness sector and each of the other two sectors, but, it is only now, with
the increasing emphasis on integration among all three sectors, that the partnership
between the three sectors is beginning to reach anything like maturity (see Figure 4).

48
Additional support sectors—namely child protection, disability and ageing—also
connect on to the nascent network that exists. In the case of Melbourne, there exists a
structured network arrangement in the outer east, which incorporates mental health
and drug and alcohol services and homelessness sectors.
In summary, we are taking forward into our empirical work the notion of an emerging
nascent network that comprises homelessness, mental health and drug and alcohol
sectors and a range of possible sub-sectors within these broader sectors.
Figure 4: Extent of integration considered in the present study
Findings from interviews regarding the structure of the three sectors
Across the three jurisdictions, only Victoria situated the homelessness and housing
sectors within a single agency. For NSW and WA, responsibility for the delivery of
homelessness services was separate from the management of the housing sector.
There are benefits to both structures. One key stakeholder suggested the child
protection portfolio was better placed for crisis responding and hence better placed to
manage the homelessness system. Other key stakeholders talked about the
specialisation of skills and the distinction between social support services on the one
hand and capital infrastructure and tenancy management on the other. Regardless of
where homelessness was placed in relation to housing, both key stakeholders and
case study participants frequently stressed the need for homelessness policy to be
strongly linked to the housing sector given that pathways into and out of
homelessness are ultimately highly dependent on access to sustainable housing
options.
In terms of the health sector, many participants believed the current structure poses
significant challenges for service and client integration. A number of key stakeholders
suggested the health system should be re-structured to reflect a primary health care
network and a second tier of specialist services. It was thought that this type of
structure would better reflect a holistic conceptualisation of health and make better
use of the range of workforce skills.

49
Across all jurisdictions, key stakeholders and case study participants commented on
the increasingly narrow focus of mental health services on crisis-driven presentations
(e.g. psychosis and self-harm) and pharmacotherapy. For example, a stakeholder
made the following comment regarding mental health services in Victoria:
Well in Victoria, I think, these days it is really hard for someone to get case-
managed, integrated care in a mental health service if they haven’t got a
condition for which there is a medication. And so if you’ve got anxiety or
depression or just not feeling good, or post-traumatic stress, or social anxiety
or personality disorder or Asperger’s syndrome, mental health services don’t
want to see you.
This was explained in terms of a threshold for disorder severity by a NSW key
stakeholder:
… public mental health services don't necessarily pick up lots of care from
people that may have a range of issues but don't have a mental illness. There
are many, many people in public housing who may need some low-level
support from somebody that can help them through various issues in their
lives. Your average community mental health team doesn’t provide that kind of
service. They're mostly dealing with people that have serious mental illness.
5.1.2 Scope of integration
Browne et al. (2007) define the scope of integration as the number of ‘service types’
offered within a network. In what follows we take it as given that the network consists
of the homelessness, mental health and drug and alcohol sectors. Operationally, the
network is taken to be the agencies and services in these three sectors that
participated in the Integration Survey.
The number of instances of forms of support provided by the participating agencies
across the homelessness, drug and alcohol, and mental health functional areas is
shown in Figures 5 to 7, respectively. It is important to note that the data represented
in Figures 5 to 7 is frequency data and therefore dependent on sample size. The
Perth sample consisted of 29 agencies, whereas the Melbourne sample consisted of
only four agencies. Hence, the number of instances of service provision of various
kinds will appear much lower in Melbourne than in Perth.
Types of homelessness services provided by agencies include crisis/transitional
accommodation; domestic violence refuges; day support programs; early intervention
programs; outreach; street-to-home programs; and tenancy support programs (see
Figure 5). Of these, crisis and transitional accommodation was the assistance type
most often offered in the inner Perth and South East Corridor area. Nineteen
participating agencies from the inner Perth and South East Corridor of Perth region
reported that they provide crisis and transitional accommodation services. There were
four such agencies in the Melbourne region, resulting in 23 agencies across the two
jurisdictions. Outreach support was the second most commonly provided form of
homelessness-based assistance, with 19 agencies providing this type of service in the
two regions (including 16 in Perth and three in Melbourne). The type of assistance
provided least often by agencies in the sample was day support, with nine agencies
providing this service.
The various drug and alcohol programs of support provided by participating agencies
is shown in Figure 6. For both Melbourne and Perth, the most commonly provided
drug and alcohol service was information and education (25 agencies), followed by
support and case management (23 agencies) and harm reduction (21 agencies). The

50
least commonly provided type of service was needle and syringe programs (5
agencies).
Figure 7 shows the various mental health programs provided by participating
agencies. The most commonly reported type of mental health service offered was
short and long-term support (21 agencies), followed by case management (16
agencies) and psychoeducation (16 agencies). Mental health inpatient clinics were
rare among the participating agencies (2 agencies).

51
Figure 5: Types of homelessness support provided by participating agencies, stratified by jurisdiction

52
Figure 6: Types of drug and alcohol support provided by participating agencies, stratified by jurisdiction

53
Figure 7: Types of mental health support provided by participating agencies, stratified by jurisdiction

54
In order to further establish the scope of integration within the network, we have
examined the extent to which specialist homelessness, housing, drug and alcohol and
mental health services are providing programs of support in domains other than their
area of specialisation. Evidence of such support suggests a degree of internal
integration within the relevant agency, what we have termed ‘vertical integration’.
Fifteen per cent of specialist homelessness services in the sample also provide long-
term housing, 40 per cent provide mental health services and 35 per cent also provide
drug and alcohol support. In addition to mental health support, specialist mental health
services also provide crisis and transitional accommodation and support, 28 per cent
also provide long-term housing and 28 per cent also provide drug and alcohol support.
Finally, in addition to drug and alcohol support, specialist drug and alcohol services
also provide significant levels of mental health support with 62 per cent of services
providing such support. This finding points to a high level of vertical integration of drug
and alcohol and mental health support among participating agencies and reflects the
emphasis on meeting co-morbidity issues in the drug and alcohol and mental health
area (and in the homelessness sector).
5.1.3 Depth of integration
The Integration of Human Services Network Measure (Browne et al. 2007) was used
to measure the depth of integration across the three service domains (specialist
homelessness, mental health and drug and alcohol services) within the two defined
regions of Melbourne and Perth. The observed and expected depths of integration
scores were calculated for the total group and for each service domain to establish the
degree of exchange within and across the sectors in the geographical areas of
interest.
Service managers from specialist homelessness, mental health and drug and alcohol
services were asked to rate, on a five point scale, from 0 = no awareness to 4 =
collaboration, the extent to which they are involved with all other services in the
geographical region, as well as the extent to which they should be involved with other
services. Scores were also calculated to generate a ‘clinical’ indicator scale ranging
from very little integration (0–49) to perfect or complete integration (3.5–4). See
Tables 9 and 10 for a description of each clinical indicator and level of scoring,
respectively.
Data for Perth and Melbourne services were analysed separately to determine the
extent of service integration in their respective networks. Responses from 17 services
in the outer eastern geographic region of Melbourne were analysed. This consisted of
three specialist homelessness services, 12 mental health services, and two drug and
alcohol services. For the City and South East Corridor of Perth, data from 47 services
were analysed. This consisted of 26 specialist homelessness services; eight specialist
mental health services; and 13 drug and alcohol services.
In line with the recommendations of Browne et al. (2007), observed and expected
depth of integration scores were calculated. Observed depth of integration can be
described as the degree to which service managers self-report that they interact,
jointly plan and communicate with other services in their local network. The observed
depth of integration is a positive measure of integration. The expected depth of
integration is the degree to which service managers self-report that they should
interact, jointly plan and communicate with other services in a network.11 It is a
normative measure of integration as perceived by service managers.
11
The study also measured the degree of congruence and reciprocity reported by each individual service
within the network. Congruence is the difference between each individual service’s observed and

55
Table 9: Extent of integration scores for both observed and expected integration
Range of scores
Level of involvement
Description of observed integration
Description of expected integration
0 No awareness Your service is not aware of the other service
Your service should not be aware of the other service
1 Awareness You have knowledge of the other service although no effort is taken to organise activities according to any principles except those that conform to individual service missions.
You should have knowledge of the other service although no effort is taken to organise activities according to any principles except those that conform to individual service missions.
2 Communication You and the other service have an active program of communication and information sharing.
You and the other service should have an active program of communication and information sharing.
3 Cooperation You and the other service each use your knowledge of the other’s service to guide and modify your own service planning in order to obtain a better set of links between services.
You and the other service should each use your knowledge of the other’s service to guide and modify your own service planning in order to obtain a better set of links between services.
4 Collaboration You and the other service jointly plan the offering of policies and/or services and actively modify service activity based on advice and input from mutual discussions.
You and the other service should jointly plan the offering of policies and/or services and actively modify agency activity based on advice and input from mutual discussions.
Source: Browne et al. 2004, Integration of Human Services Measure
Table 10: Indicators for level of service integration scores
Score range Clinical indicator
0.0 – 0.49 Very little integration
0.5 – 0.99 Little integration
1.0 – 1.49 Mild integration
1.5 – 1.99 Moderate integration
2.0 – 2.49 Good integration
2.5 – 2.99 Very good integration
3.0 – 3.49 Excellent integration
3.5 – 4.00 Perfect integration
Source: Browne et al. 2004
expected depth of integration scores within a network, while reciprocity is a measure of the difference between an individual service’s self-reported depth of integration score and the group reported depth of integration score for that service. These results are presented graphically in Appendix 2.

56
In interpreting the results, it is important to be mindful of two things. First, that the
geographical boundaries are wide and, in the case of Perth, combine potentially two
sub-regions into one region. Second, that especially in the case of Perth, there are a
large number of services operating. The practical implication of this is that services
may have a highly integrated network of services that they work in across the three
main domains but may have relatively little interaction with the broad set of services in
the area of interest. We consider this question further below.
Total integration score for each network: Perth and Melbourne
In relation to the total observed depth of integration, service managers in the outer
eastern region of Melbourne (N = 17) reported a score of 2.19 out of 4 (or 55%),
indicating that overall, service managers reported a good level of interaction, joint
planning and communication between services in the specified geographical region.
The total expected depth of integration score for Melbourne was slightly higher (2.81
out of 4, or 70%), indicating that service managers expected that depth of integration
should be higher in their local network.
For the Perth network of services (N = 47), the total observed depth of integration
score was 1.52 out of 4 (or 38%) indicating that overall, service managers reported
only a moderate level of interaction, joint planning and communication between
services in their network. The total expected depth of integration score for Perth was
1.94 out of 4 (or 48%), indicating that service managers expected that the depth of
integration in their local network should be slightly higher.
As indicated previously, the Perth site was chosen as indicative of what might be
expected in terms of service integration in an area, which has been a focus of
homelessness and drug and alcohol and mental health services (inner city to
immediate outlying suburbs of high need) without a defined general partnership model
in place. The Melbourne site would be more indicative of narrowly defined
geographical sites outside the traditional focus of homelessness services where a
strong formal partnership model is in place for a number of services in the region.
Hence, we would expect the observed level of integration to be lower for the Perth site
than for the Melbourne site. However, interestingly, the expected level of integration
was also lower in Perth than in Melbourne suggesting that observed levels of
integration may anchor expectations of the desired level of integration.
Domain-specific integration scores for the Melbourne network
Table 11 shows the total observed depth of integration scores for each of the service
domains for Melbourne; the extent to which each of these domains report that they
should be involved with other services in their network; and the extent to which
services in a network report that they should be involved with each of the other
service domains. The results should be read in light of the fact that there are a
relatively small number of services in each domain in Melbourne.
On average, service managers in all three domains reported good levels of
interaction, joint planning and communication between their domain and other service
domains within their local network in Melbourne. However, service managers from
both the specialist homelessness and mental health services domains reported that
there should be a higher level of integration between their service and others in the
network. Mental health service managers reported the greatest difference between
observed and expected levels of integration and indicated that they should be at the
level of cooperation with other services rather than being at the level of where they
are now, which is at the communication level within the network (see Table 10 for a
description of scores).
57
While mental health service managers report this higher expectation, on average
other service managers from other domains within their network expect a slightly
lower level of involvement and integration with them. Furthermore, homelessness and
drug and alcohol service domains both had higher network-reported expected depth
of integration scores than their own expected levels of involvement with these other
groups. For example, while service managers from mental health and specialist
homelessness services expected excellent integration and a more cooperative
involvement with drug and alcohol services, drug and alcohol service managers
themselves in the network only expected good integration at the communication level
of involvement with these other services.
Domain-specific integration scores for the Perth network
Domain-specific integration scores for the Perth network are set out in Table 12. Table
12 shows the total observed depth of integration scores for each of the service
domains (specialist homelessness service, mental health and drug and alcohol) for
Perth. It also shows the extent to which each of these domains report that they should
be involved with other services in their network, and the extent to which services in a
network report that they should be involved with each of the other service domains.
On average, service managers in both the specialist homelessness and mental health
domains in Perth reported relatively low levels of interaction, joint planning and
communication between their service domains and other domains in the network.
Drug and alcohol service managers reported a slightly higher level of depth of
integration.
All service managers within each domain of the Perth region reported that there
should be a higher level of integration between their service domain and the services
within their local network. In particular, mental health and drug and alcohol service
managers indicated that they need to move beyond simply having an awareness of
other services, to establish an active program of communication and information
sharing. There was no discrepancy between domain-reported expected depth of
integration with other services’ scores and network-reported expected depth of
integration scores. This indicates that all service domains expect that the same level
of involvement should occur within the local network. This expected level of
involvement is reported to be at the very good to excellent level of service integration.
Localised depth of integration
The integration measure used by Browne et al. (2007) is appropriate for assessing the
depth and scope of integration within a singular cohesive network. Our sample
consists of large geographical regions across Melbourne and Perth, within which there
are likely to be multiple network clusters. Thus, the aggregation of scores within each
of these geographical regions to calculate the total depth of integration may not reflect
the intricacies of network connectivity within these regions. Specifically, this aggregate
measure may under-represent the degree of networking present within each cluster.
Further examination of the integration data reveals important patterns in terms of
strength of relationships within specific clusters of each region. The proportion of
services reporting collaborative relationships with other services is outlined below.
Collaborative relationships are indicated by a depth of integration score of 4 out of 4,
and are representative of joint planning of policies and/or services and active
modification of service activity based on advice and input from mutual discussions
(Browne et al. 2007).

58
Collaborative relationships for the Melbourne network
Of the services recruited in Melbourne, 94 per cent indicated that they held a strong
collaborative relationship with at least one other service in the sample.
All homelessness services from the Melbourne sample indicated that they hold at
least one strong collaborative relationship with another service in the sample. Two of
the three reported having a strong collaborative relationship with at least one mental
health service and one of the three reported a strong collaborative relationship with at
least one drug and alcohol service. In contrast to the pattern seen in the Perth
sample, there were no collaborative relationships between services within the
homelessness domain in the Melbourne sample.

59
Table 11: Total observed and expected levels of depth of integration by specialist homelessness, mental health and drug and alcohol services
within the outer eastern metropolitan region of Melbourne
Total observed depth of integration scores for each domain
To what extent do services from each of the three domains report that they are involved with other services within the network?
Domain-reported expected depth of integration with other services
To what extent do service managers in each domain report that they should be involved with other services in their network?
Network-reported expected depth of integration with each domain
To what extent do other services in the network report that they should be involved with the services in each domain?
Melbourne network domain
Total observed depth of integration score for each domain
Clinical indicator and observed level of involvement for each domain
Total expected depth of integration score for each domain
Clinical indicator and expected level of involvement as reported by domain
Total expected depth of integration score reported by the network about each domain
Clinical indicator and expected level of involvement as reported by network
Specialist homelessness services
N=3
2.15 or 54%.
Good integration
1.85 or 46%.
Should have moderate integration
2.70 or 68%.
Should have very good Integration
Communicating Should be aware and communicating
Should be communicating and cooperating
Mental health services
N=12 2.02 or 50%.
Good integration
3.12 or 78%.
Should have excellent integration
2.69 or 67%.
Should have very good integration
Communicating Should be cooperating Should be communicating and cooperating
Drug and alcohol services
N=2 2.39 or 60%.
Good integration
2.35 or 59%.
Should have good integration
3.07 or 77%.
Should have excellent integration
Communicating and cooperating
Should be communicating
Should be cooperating

60
Table 12: Total observed and expected levels of depth of integration by specialist homelessness, mental health and drug and alcohol services
within the City and South East Corridor region of Perth
Total observed depth of integration scores for each domain
To what extent do services from each of the three domains report that they are involved with other services within the network?
Domain-reported expected depth of integration with other services
To what extent do service managers in each domain report that they should be involved with other services in their network?
Network-reported expected depth of integration with each domain
To what extent do other services in the network report that they should be involved with the services in each domain?
Perth network domain
Total observed depth of integration score for each domain
Clinical indicator and observed level of involvement for each domain
Total expected depth of integration score for each domain
Clinical indicator and expected level of involvement as reported by domain
Total expected depth of integration score reported by the network about each domain
Clinical indicator and expected level of involvement as reported by network
Specialist homelessness services
N=26
1.41 or 35%.
Mild integration
1.58 or 39%.
Should have moderate integration 1.84 or 46%.
Should have moderate integration
Aware Should be aware and communicating
Should be aware and communicating
Mental health services
N=8
1.30 or 33%.
Mild integration
2.39 or 60%.
Should have good integration
1.99 or 50%.
Should have moderate integration
Aware Should be communicating
Should be aware and communicating
Drug and alcohol services
N=13
1.75 or 44%.
Moderate integration
2.26 or 57%.
Should have good integration
2.26 or 57%.
Should have good integration
Aware and communicating
Should be communicating
Should be communicating

61
The vast majority (92%) of mental health services recruited from Melbourne reported
having at least one strong collaborative relationship with another service.
Collaborative relationships with other mental health services were most likely (92%),
followed by homelessness services (54%), and then drug and alcohol services (46%).
All the drug and alcohol services within the Melbourne sample reported at least one
strong collaborative relationship with a service. However, this collaboration was
limited to the drug and alcohol sector; neither of the drug and alcohol services
included in the sample reported collaborative relationships with services in the mental
health or homelessness domains.
Collaborative relationships for the Perth network
In the Perth sample, 71 per cent of services reported having a strong collaborative
relationship with at least one other service in another domain. Fifty-five per cent of
homelessness services recruited from Perth reported having at least one collaborative
relationship with another service included in the sample. In terms of specific domains,
none of the homelessness services had collaborative relationships with mental health
services, 40 per cent have a collaborative relationship with at least one drug and
alcohol service, and 55 per cent reported having a collaborative relationship with at
least one other homelessness service.
Seventy-five per cent of mental health services surveyed indicated that they have at
least one strong collaborative relationship with another service from the Perth sample.
The same proportion had a strong collaborative relationship with at least one drug and
alcohol service, and one homelessness service and 100 per cent have a strong
collaborative relationship with at least one other mental health service.
Among drug and alcohol services in the Perth sample, 91 per cent reported having at
least one strong collaborative relationship with another service in any domain. Strong
collaborative relationships with other drug and alcohol services were most likely
(82%), followed by homelessness services (64%), and then mental health services
(27%).
5.2 Functioning of integration
The second main dimension of integration we consider is concerned with the
functioning of the network. Network functioning is reflected in the quality, participant
perceptions and ingredients of the network. The following section presents the
findings from the Integration Survey that measured each of these domains
complemented by a discussion of the themes that emerged from the case studies.
5.2.1 Quality of the network
One of the aims of this study was to explore the current level and nature of service
and system integration within selected networks in Perth and Melbourne, as it relates
to the provision of support services to homeless people with poor mental health and
problematic substance use. Furthermore, a typology of integration in the
homelessness context was sought, coupled with an account of how and over what
dimensions homelessness services in these regions coordinate and partner with
mental health and drug health services (and vice versa).
The Weiss et al. (2002) Partnership Synergy Self-Assessment Tool was included
within the Integration Survey to explore how services work with other services to meet
the needs of client/consumers. Table 13 gives a brief description of each of the
scale’s dimensions.
Service managers who indicated that their service works together with other services
in the areas of housing/homelessness, mental health, and/or alcohol and drug issues

62
in a formal partnership were invited to complete the measure. Managers completed
the measure by considering the most important partnership that exists between their
service and another. The results presented below are conditional in the sense that
only those services who indicated they had a partnership completed the relevant
questions.
Service managers were asked to rate on a scale from 1–5 (with 1 indicating worst and
5 indicating best) the degree to which their formal partnership operationalised or
engaged in the given dimensions.
Table 13: Dimensions of the Weiss Partnership Synergy Self-Assessment Tool12
Dimension Description
Synergy The extent to which the combined perspectives, knowledge, and skills of the partners strengthen the thinking and actions of the group and the partnership’s relationship to the broader community.
Leadership Leadership in partnerships may be informal or formal and may include (but is not limited to): taking responsibility for the partnership; inspiring and motivating partners; fostering respect, trust inclusiveness, and openness in the partnership.
Partnership efficiency The extent to which services make good use of partner’s financial resources, in-kind resources and time.
Administration and management
Administration and management activities that may be especially important in supporting the partners and achieving high levels of synergy.
Non-financial resources The extent to which partnerships have what they need to work effectively to achieve their goals in relation to skills and expertise; data and information; connection to target populations, connection to political decision-makers, etc.
Financial and other capital resources
The extent to which a partnership has the financial and other capital resources needed in order to work effectively and achieve its goals.
Network quality: Melbourne
Table 14 shows the average partnership synergy dimension scores for the total
Melbourne sample, and for specialist homelessness, mental health and drug and
alcohol services in Melbourne. Note that the scale ranges from 1–5, from worst to
best, with 3 being the midpoint.
The responses from Melbourne service managers reveals that for the total Melbourne
sample all dimensions of partnership synergy are generally being experienced or
applied by services. Overall, on average, services in the Melbourne sample are:
Able to achieve various goals somewhat well by working together (synergy).
Have fair to good effectiveness across multiple areas of leadership (leadership).
Have partnerships that make good use of time and resources (partnership efficiency).
Have partnerships with good levels of effectiveness in carrying out administrative and managerial activities (administration and management).
Have some of the non-financial resources they need to work effectively (non-financial resources).
12
See Weiss et al. (2002) for a more detailed description of each of the Partnership Synergy dimensions.

63
Table 14: Average partnership synergy dimension scores for Melbourne
Dimension Total Homelessness Mental health AOD
Synergy 3.33 3.33 3.36 3.56
Leadership 2.71 3.05 2.66 2.27
Partnership efficiency 2.94 2.55 3.10 3.00
Administration and management 2.78 2.39 2.70 3.00
Non-financial resources 3.09 2.67 3.08 4.00
Financial and other capital resources 3.00 3.22 2.71 4.00
Although there does appear to be some differences between the experience or
application of partnership dimensions between service domains, particularly in the
domains of non-financial resources and financial and other capital resources, a one-
way between groups ANOVA revealed that these differences were not significant.
Network quality: Perth
The responses from Perth service managers reveals that for the total Perth sample all
dimensions of partnership synergy are generally being experienced or applied by
services at an effective level. Overall, services in the total Perth sample are:
Able to achieve various goals somewhat to very well by working together (synergy).
Have good effectiveness across multiple areas of leadership (leadership).
Make good use of time and resources (partnership efficiency).
Are involved in partnerships with good levels of effectiveness in carrying out administrative and managerial activities (administration and management).
Report that their partnerships have some to most of the resources they need to work effectively (non-financial resources; financial and other capital resources).
A one-way between groups ANOVA revealed no significant differences between any
of the reported partnership synergy dimensions of specialist homelessness, mental
health and drug and alcohol services.
Table 15 shows the average partnership synergy dimension scores for the total Perth
sample, and for specialist homelessness, mental health and drug and alcohol services
in Perth.
Table 15: Average partnership synergy dimension scores for Perth: total group and total
service domains
Dimension Total Homelessness Mental health AOD
Synergy 3.61 3.56 3.87 3.46
Leadership 3.45 3.37 3.70 3.43
Partnership efficiency 3.41 3.40 3.89 3.08
Administration and management
3.15 3.16 3.09 3.15
Non-financial resources 3.67 3.63 3.77 3.67
Financial and other capital resources
3.60 3.62 3.50 3.62

64
5.2.2 Participant perceptions
Satisfaction with participation
Service managers’ satisfaction with participation in partnerships was explored using
Weiss et al.’s (2002) Partnership Synergy Self-Assessment Tool. Satisfaction was
measured using the item ‘How satisfied are you with the way the people and
organisations in the partnership work together?’ Respondents were asked to rate from
1–5 the degree to which they are satisfied or not (1 = not at all satisfied and 5 =
completely satisfied).
Table 16 shows the average score reported for the total sample and for each of the
service domains. There were no significant differences in satisfaction with
participation between each of the service domains and, on average, participants
reported that they were somewhat to mostly satisfied with the various elements of
participation measured.
Table 16: Average satisfaction with participation scores for service participants,
stratified by service domain
Dimension Total Homelessness Mental Health AOD
Satisfaction with participation 3.54 3.65 3.30 3.66
Decision-making
Browne et al. (2004) define decision-making in the context of integration as the way
decisions are made in the partnership. For example, whether stakeholders feel
supported or alternatively excluded in the decision-making process, whether the
network gives due consideration to all stakeholders in the decision-making process,
and whether individual stakeholders feel pressured to conform with group decisions.
Results from the Integration Survey suggest that, on average, respondents are
somewhat comfortable with the way decisions are made in their formal partnerships. A
one-way between groups ANOVA revealed no differences between the sectors in their
experience of decision-making within their networks.
Figure 8 shows the average decision-making dimension scores for the total sample
and for specialist homelessness, mental health and drug and alcohol services across
the two study sites and for the entire sample. As with the dimensions presented in the
previous section, the scale ranges from 1–5, from worst to best, with three being the
midpoint.

65
Figure 8: Decision-making dimension scores stratified by study site
Interviews with case study participants revealed two important factors that contribute
to effective decision-making in partnerships—respect among partners for each other’s
areas of expertise and feeling comfortable to raise concerns outside of one’s own
area of expertise. In this sense, decision-making was linked to the experience of the
relationship between partners. A homelessness case study participant in Sydney gave
an example of how collaborative decision-making can be effective:
One client was suffering chest pains that he thought was angina, and so by
agreement with the case manager from the [health] community team, we sent
him down to our doctor at the clinic. The case manager in the [health]
community team followed up with the doctor after that particular visit, and in
that particular case they felt he needed to have a number of tests done. So
between them they actually worked out a strategy as to how he might be able
to get into [hospital] and get those tests done.
5.2.3 Critical ingredients for integration
Results from the Integration Survey
According to the Browne et al. model (2007), the overall functioning of the network is
dependent on both the quality of partnership functioning and the ingredients of
integration within the network’s working arrangements. The Integration Survey
included a series of questions to ascertain the extent to which the necessary
ingredients for integration are present in the working arrangements of services in the
sample. Services indicated the degree to which these critical ingredients are present
in their relationships with other services from each of the four domains:
homelessness, housing, mental health, and drug and alcohol.
The critical ingredients can be conceptualised as belonging to four key categories:
Sharing and participation between services.
Client referrals.
Relationships between staff.
Inter-agency functioning.
66
The sharing/participation component refers to whether services share protocols,
procedures, goals, funding, client plans of care and client data. Services were asked
to indicate how frequently (‘never’, ‘rarely’, ‘sometimes’, ‘often’ or ‘always’) they share
these components with other services in each of the four domains.
For the nine items within the sharing/participation category, the most common
response was that services never share these resources. There was some variation
depending on the resource shared. However, of all the components listed,
assessment protocols (policies, procedures) were the most likely to be shared
between services (20% of services ‘always’ share these protocols), and planning and
budgeting goals were the least likely to be shared between services (4% of services
‘always’ share goals). In terms of the different domains, sharing was most likely with
mental health services and least likely with homelessness and housing services.
The client referrals component pertains to whether services refer clients on to other
services, receive referred clients from other services, and whether reciprocal referral
arrangements exist between services. Overall, services stated that client referrals
occur ‘sometimes’ between their own service and those in the homelessness/housing
sector, and ‘often’ between their own service and those in the mental health/drug and
alcohol sector. The most common practice was services referring clients onto other
services (this was most frequently noted to occur ‘often’ across all domains). Having
reciprocal client referral arrangements in place with other services was less likely;
across all domains, only 9 per cent of services ‘always’ use such agreements, and 33
per cent ‘never’ use such agreements.
Critical ingredients of integration relating to staff include sharing of staff, cross-training
of staff, awareness of staff members in other services, inter-agency MOUs and the
involvement of staff from other services during and after a client’s discharge. On
average, these integrative processes for staff are most commonly used ‘sometimes’
(36%) with other services in the mental health and drug and alcohol domain, and
‘never’ (32%) with other services in the homelessness/housing domain. The sharing of
staff between services was found to be a very uncommon practice (71% responded
that their staff are never shared with other services). The most common practice in
this category was the referral of discharged clients to other services (92% of the
services surveyed ‘sometimes’, ‘often’, or ‘always’ refer clients on to other services
once they have been discharged).
The inter-agency component involves the frequency of inter-agency case review
meetings with other services, communication between services and sharing of a
physical locality. Overall, services were most likely to report that they ‘sometimes’
conduct inter-agency case review meetings with other services (this response was
given by 40% of services). Regular (monthly) inter-service communication appears to
be more likely than formal meetings; services were most likely to report that this type
of regular communication occurs ‘often’ (36%). Sharing a physical location with other
services was uncommon (58% ‘never’, 14% ‘always’).
In conclusion, these results suggest that services in this sample are lacking many of
the necessary ingredients of integration. Across all categories and relationships with
each of the service domains (see Figure 9), services were most likely to respond that
they ‘never’ engage in the practices outlined (28%), and least likely to respond that
they ‘always’ engage in these practices (10%).

67
Figure 9: Frequency with which critical ingredients of integration are present across all
service domains
Figure 10: Frequency with which critical ingredients of integration are present in
partnerships with homelessness services

68
Figure 11: Frequency with which critical ingredients of integration are present in
partnerships with housing services
Figure 12: Frequency with which critical ingredients of integration are present in
partnerships with mental health services

69
Figure 13: Frequency with which critical ingredients of integration are present in
partnerships with drug and alcohol services
Partnerships with services in the homelessness and housing sectors were found to
have the fewest critical ingredients overall, with 33 per cent saying these practices
and policies ‘never’ occur or exist, compared to 22 per cent for partnerships with
mental health and 24 per cent for partnerships with drug and alcohol services (see
Figures 10–13).
Results from interviews with stakeholders and case study participants
Key stakeholders and case study participants were asked to comment on the
ingredients they considered critical to achieving effective integration.
There was overwhelming consensus for the first six categories shown in Table 17—
streamlined assessment, facilitated referrals, case review and supervision, flexible
and supportive governance, relationships and communication and staffing. The final
category in Table 17—model integrity—was less frequently cited by participants.
However, general observations of the partnerships examined in the case studies
suggested the inevitable challenges of new partnerships could be minimised
somewhat if due process was given to establishing model parameters first.
The factors identified by the present study are consistent with factors reported by
other researchers. For example, Ouwens et al. (2005) identified shared agreement on
the nature of integration and commitment and support from management as key
enablers of successful integration. In the present study, commitment was considered
an important attribute of front-line workers in addition to managerial staff; this was
often explained with regard to the development of relationships among workers with
direct responsibility for addressing client need.
Case study participants considered integration to be more harmonious and less
difficult if partners shared similar values and common ways of working with clients.
Consistent with this finding, Gröne and Garcia-Barbero (2002) acknowledged that
entrenched professional values and approaches could impede integration. The
findings of the present study suggest that this barrier can be overcome with the
establishment of good relationships. In particular, case study participants talked
enthusiastically about the gaining of new understandings and insights of how to work
with clients when involved in multi-agency and cross-sectoral partnerships.

70
Table 17: Critical ingredients for integration
Streamlined assessments
Single entry point; else multiple entry points linked to efficient referral system
Assessments that follow a client through the system
Multi-disciplinary assessments, for example psychologist and psychiatrist assessing a
client together
Formal arrangements (e.g. MOUs) for the acceptance of assessments from referring
agencies, for example suicide risk
Facilitated referrals
On-the-spot referrals in the presence of the client
Transporting clients to referrals (predominantly between agencies but also walking a client
from one service to another within an agency)
Attending initial appointments with clients (particularly within mainstream health settings)
Preparing the client about the referral (e.g. assessment processes of service being
referred to, reason for referral) and following up with the client afterwards regarding the
outcome of the referral
Negotiating the referral on behalf of the client; minimally this involves researching referral
options and establishing the eligibility criteria and assessment processes with services
before referring a client
Assertive referral of clients back to the referring agency at the end of an episode of care
(e.g. post-treatment care plans, discharge summaries)
Case review and supervision
Secondary consultation to staff from outside own area of expertise
Regular case/clinical review meetings involving multi-disciplinary or multi-sectoral staff
(e.g. mental health clinician attending the weekly case review meeting of homelessness
support workers)
Seeking advice from others, including consulting with expert partners within a partnership
or consulting with staff from co-located teams or services
Shared knowledge of how to work with a client (e.g. impact of mental health disorder on
capacity to engage)
Flexible and supportive governance
Ability to revise model parameters or approaches based on ongoing assessment of the
program/service in meeting the needs of the target population
Management support staff to undertake their role in such a way that enables them to meet
client needs (e.g. flexible work hours to accommodate after-hours support for clients)
Relationships and communication
Developing knowledge within the team including the exchange of knowledge from one
sector to another
Developing awareness and understanding of client need and service/program objectives
across sectors or specialty areas
Two-way accountability of relationships
Collaborative approach to working with others (involves trust and respect among partners)
Division of roles within a partnership to avoid ethical conflicts (e.g. housing support versus
tenancy management)
Multiple mechanisms for communication including formal meetings, electronic information
exchange and informal ‘as needed’ conversations
Established protocols for the protection of client privacy and shared understanding of
confidentiality

71
Staffing
Recruitment of the ‘right kind’ of people—committed, passionate, genuine
Low staff turn-over
Adequate staffing for the workload
Expertise and experience built up over time, including established relationships and
knowledge of the broader service landscape
Model integrity
Alignment of values and philosophies among partner agencies
Intensity of integration mapped to complexity of client need
Clearly articulated goals for the partnership
Governance structure including mechanisms for resolving conflicts
Shared approach to working with clients (e.g. adoption of a particular case management
model or therapeutic approach)
Linkages appropriate for the physical location of services, e.g. on-site clinics, satellite
sites, co-location of services
In addition to identifying the key dimensions of effective integration, Table 17
demonstrates the particular strategies most commonly practiced by case study
participants when engaging in integration practice. The breadth of strategies
employed underscores the importance of developing localised responses even within
a policy framework that establishes governance for an entire region. For example, the
ConnectED program commenced as a pilot between a single homelessness agency
and a single hospital emergency department to reduce the number of repeat
presentations among homeless clients. It was subsequently extended to include
additional hospital-support agency partnerships and although all participating
partnerships adhere to a single governance structure, each partnership has its own
protocol that specifies the relationship between the hospital and support agency.
Achieving a balance between top-down and bottom-up processes is an important
dynamic of integration.
There was clear evidence from the case studies that integration worked well where
there was strong leadership and commitment from stakeholders with clear authority
(e.g. government departments, agency management) and localised responses driven
by stakeholders with ground-level knowledge and expertise (e.g. front-line workers,
local networks). In this sense, integration appears to be driven by both top-down and
bottom-up processes and the tension between the two processes can create different
experiences of service and client integration.
5.3 Summary
This chapter used findings from the Integration Survey in relation to Perth and
Melbourne to paint a picture of the structure and functioning of integration of
homelessness, mental health and drug and alcohol services in selected regions of
Perth and Melbourne.
Our first important finding is that specialist homelessness, housing, drug and alcohol
and mental health services are providing programs of support in domains other than
their direct area of specialisation. Evidence of such support suggests a degree of
internal integration within the relevant agency, what we have termed ‘vertical
integration’. For example, 40 per cent of specialist homelessness services provide
mental health services and 35 per cent also provide drug and alcohol support.

72
We measured the depth of integration in the specified geographical areas using
Browne’s Integration of Human Services Network Measure (Browne et al. 2007). On a
scale from no integration through to excellent integration, Melbourne service
managers reported a good level of interaction, joint planning and communication
between services across the defined geographical area consistent with an active
program of communication and information sharing. In Perth, services reported a
lower moderate level of integration consistent with high levels of awareness but not
active communication. In both cases, expected (or desired) depth of integration
scores are somewhat higher than actual levels of integration indicating that service
managers wish to ratchet up the level of integration between services across the
relevant regions but only by a notch.
However, in both the Perth and Melbourne sites, both actual and desired levels of
integration fall short of the two highest levels of integration—namely, cooperation and
collaboration. Cooperation involves services across the region having an active
program of communication and information sharing, while collaboration involves
services working closely with each other to guide and modify their own service
planning. The evidence suggests that services want to work more closely than they do
in a given geographical area, but there are strict upper limits to integration across a
broad set of services in a given geographical region.
In addition to examining the depth of integration in the context of a given geographical
region, we also examined the extent to which individual services experienced the
highest level of integration of collaboration (a depth of integration score of 4 out of 4)
with at least one service in the region of interest. The vast majority of services in both
Perth and Melbourne do have collaborative relationships with one other service in the
same geographical region. In the Perth sample, for example, three-quarters of all
services reported having a strong collaborative relationship with at least one other
service in another domain. In the Perth sample, 55 per cent of homelessness services
had at least one collaborative relationship with another service included in the sample.
However, 40 per cent had a collaborative relationship with at least one drug and
alcohol service and none had collaborative relationships with mental health services.
Strong integrated relationships with other services are more likely with services in own
sector domains than with other services.
Services in both Perth and Melbourne who engaged in formal partnerships reported
relatively high scores across the various domains of synergy, leadership, partnership
efficiency, administration and management and resources. However, services
generally reported relatively low scores across critical ingredients of integration
thought to be important for success in sustaining and developing service integration
arrangements. Across the domains of sharing and participation between services;
client referrals; relationships between staff; and inter-agency functioning, services
were more likely to respond that they ‘never’ engage in the practices outlined and
least likely to respond that they ‘always’ engage in these practices.

73
6 CLIENT EXPERIENCES OF SERVICE INTEGRATION
Research Question 4: What can clients and the practitioners who work with them tell
us about clients' experiences of service integration and coordinated care within the
homelessness, drug and alcohol and mental health sectors?
Drawing upon the results from the Integration Survey and interviews with case study
participants and stakeholders, this chapter explores the issue of clients’ views on the
importance of service integration, their experiences of integration, difficulties with
accessing services, and outcomes of service provision. In short, this chapter is
concerned with the issue of client integration.
Client integration can be conceptualised in one of two ways: (1) how clients perceive
the service system and whether it works seamlessly in their eyes to meet their needs
in a timely, appropriate fashion; and, (2) how clients experience the service system
and whether it works seamlessly in actual practice to meet their needs in a timely
appropriate fashion. This chapter provides evidence on the former, ‘subjective’
reading of client integration, from the Integration Survey and the latter, ‘objective’
interpretation, indirectly, from expert opinion. It is for another study to provide direct
evidence, using service usage and outcomes data against need, on whether clients
actually do receive timely, appropriate, seamless service and how important service
integration is to that outcome.
Nevertheless, we examine, in some depth in the present chapter, the relationship
between perceptions of the quality of service delivery, including care coordination, and
client outcomes on the part of clients on the one hand, and the depth of service
integration exhibited by a service on the other.
6.1 Clients’ views on the importance of integration
The Integration Survey included several structured and open-ended questions that
sought to elicit accounts from clients on their understanding of the importance of
service integration. We draw on their responses in what follows.
Clients described an optimal service as one that delivered a ‘holistic package’ where
staff had an awareness of client needs and were proactive in following up with clients.
Other clients described the importance of services working together to deliver a
streamlined service and this was often linked to a need for better communication
between services.
The consequences of poor integration cited by clients were two-fold:
Continual re-telling of stories that clients found distressful and inhumane.
Confusion, partly related to the sheer number of different professionals involved, but also to poor delineation of roles among staff from different services.
Some clients felt a lack of integration was best overcome through the provision of on-
site care through a single service delivery model. Under this model, relevant
professionals would attend the client’s primary service rather than the client attending
a range of relevant services. Other clients felt a greater emphasis on information
sharing and care coordination would be of benefit, although they also recognised the
costs involved, as articulated by a drug and alcohol service client:
Every single service has helped but [you] have to repeat your set of
circumstances to each one, which can be hard, and I worry about who can
access this information.

74
Clients from each of the three service domains expressed similar views. A number of
them cautioned that care coordination and information sharing needed to be
transparent, confidential and consensual.
Many clients emphasised the qualities of workers as being critical to the service they
received. These qualities included a genuine regard for the client, expressed as
concern for the client’s wellbeing and a willingness to help that went beyond the mere
undertaking of a job; and a respectful attitude that made clients feel ‘like a person
needing a home rather than rubbish thrown on the streets’. The qualities of workers
had the potential of overcoming some of the deficits of a poorly coordinated system,
as noted by this housing service client:
I feel fortunate to have come into contact with some very good staff. Their
genuine caring nature has made all the difference despite any difficulties or
lack of with regard to services being coordinated. The quality and caring
nature of the staff has been the most effective factor in helping me to start
helping and caring for myself.
Indeed, there was recognition by some clients of the resource limitations of the
service system that restricted the ability of workers to address client’s needs.
Resources mentioned by clients included knowledge and awareness of other services
to facilitate referrals, adequate staffing to enable individualised assistance, and
additional accommodation places to improve access.
Client participants were asked to rate how important it was that different services
share information with each other about their needs. The majority of client participants
(65%) indicated that information sharing was quite or very important (see Figure 14);
28 per cent felt it was somewhat or a little important and only 9 per cent of clients
thought it was not important at all. Information sharing appears to be perceived as
most important for clients of specialist mental health services. Almost half of the
mental health clients rated it as ‘very important’ compared to 37 per cent of
homelessness clients and 43 per cent of drug and alcohol clients.
Figure 14: Degree of importance placed on information sharing by client participants of
the Integration Survey

75
Client participants were also asked to rate how important it was that they had
someone to help coordinate their access to different services. These results are
shown in Figure 15.
Similar to the findings for the importance of information sharing, the majority (66%) of
the total sample felt care coordination was highly important. Again, this was more
commonly endorsed by the mental health client participants (73%) and slightly less
often by the homelessness (64%) and the drug and alcohol (60%) clients. Of note, the
proportion of client participants who felt care coordination to be ‘very important’ was
similar across the three service domains; the difference in overall importance appears
to be driven by a greater proportion of mental health clients (26%) endorsing ‘quite
important’ compared to homelessness (19%) and drug and alcohol (18%) clients.
Figure 15: Degree of importance placed on care coordination by client participants of
the Integration Survey
In summary, both care coordination and information sharing appear to be important to
clients. Across all three service domains, fewer client participants felt care
coordination was not at all important compared to the proportion who endorsed this
category for information sharing.
6.2 Client-level indicators of integration
Evidence regarding clients’ experiences of integration was gathered via the
Integration Survey. Client participants were asked a series of questions regarding
their experience of integration over the previous three months.
Table 18 outlines the indicators of integration that were measured. Correlations
between each client integration indicator and the service depth of integration score
(Browne et al. 2004) were tested.
6.2.1 Case management
Depth of service integration was significantly related to the presence of a case
manager, such that clients from more integrated services were more likely to have a
case manager. Significant correlations were present in all three sectors:
homelessness (r = .22, p<.05), mental health (r = .27, p<.05) and drug and alcohol (r
= .29, p<.05). Given the importance of case management for helping clients with

76
complex needs to access relevant services, this finding suggests that more integrated
services can provide a more seamless approach to service delivery.
6.2.2 Awareness of need
Mental health problems
Within the homelessness client group, greater service integration was associated with
the provision of direct assistance for mental health issues (r = .34, p<.001). That is,
clients from more integrated homelessness services tended to report that the service
was directly helping them with their mental health needs. Findings from interviews
with case study participants (which will be outlined in the following section) further
expands on this finding, highlighting the importance of providing health services within
the homelessness setting (whether through outreach teams or co-location of services)
to overcome some of the barriers homeless clients face in accessing mainstream
health services. For drug and alcohol clients, when asked about the service’s
awareness of their mental health issues, clients from less integrated services tended
to respond ‘No, I don’t tell them or they don’t ask’ (r = -.29, p<.05). This suggests that
less integrated drug and alcohol services may not be actively seeking to identify other
issues that clients may have in other areas.
Table 18: Indicators of client integration measured in the Integration Survey
Indicator Item Response categories
Case management Do you have a case manager? Dichotomous: Yes/No
Awareness of need Do workers know about your: a) I don’t have a problem
Homelessness problems? b) No, I don’t tell and they don’t ask
Mental health problems? c) No, I receive support from another service
Drug and alcohol problems? d) Yes, but no-one is helping me
e) Yes, and they have referred me elsewhere
f) Yes, and they are helping me directly with this
g) Yes, but I am receiving support from another service
Coordinated care How often have providers of different services worked together to coordinate your care?
Range: ‘never’ to ‘always’
Duplicate information How often have you had to give different services the same information about yourself and your current situation?
Range: ‘never’ to ‘always’
Homelessness problems
In terms of direct assistance with homelessness, clients from mental health services
with lower levels of integration were more likely to report that they were receiving
support for their homelessness problems from another service (r = - .27, p<.05) and
that the service had referred them elsewhere for help with their homelessness
problems (r = - .22, p<.05). Clients from drug and alcohol services with lower levels of

77
integration were more likely to report that they have not told the service about their
homelessness problems, or the service has not asked (r = .29, p<.05). Again, this may
be indicative of a ‘don’t ask, don’t tell’ approach adopted by drug and alcohol services
that are not well integrated with other services in the network.
6.2.3 Care coordination
For homeless clients, a significant positive correlation was found between depth of
integration and care coordination (r = .57, p<.05). Clients from more integrated
homelessness services tended to report that providers of different services have
frequently worked together to coordinate their care over the past three months,
whereas clients from less integrated homelessness services reported less frequent
care coordination. No significant relationships were found between service integration
and care coordination for mental health or drug and alcohol clients.
6.2.4 Duplicate information
No significant relationship was found between service integration and the client
integration measure of duplicate information. This is surprising given client comments
regarding the continual re-telling of stories and confusion associated with different
workers and their roles (see Section 7.1). It is possible that the measure of duplicate
information used in the present study was not a particularly good indicator of client
integration or that it was not easily interpreted by clients and thus undermined the
study’s ability to detect a significant relationship. It is also highly likely that the
association between service integration and client integration is more complex than
the correlation of two indicators. For example, although many clients placed
importance on information sharing, they wanted this to be a transparent and
consensual process (see Section 7.1). This may moderate the association between
service integration and the client integration indicator of duplicate information.
6.3 Client access to services
6.3.1 Findings from the Integration Survey
Service participants in the Integration Survey were invited to consider the impact of
integrated care for their clients. Most responses suggested that integrated care
improved access to services and did so by providing clear directions to clients and
through the co-location of related services.
Results from the Integration Survey revealed that many clients had experienced
difficulties accessing services. Table 19 shows the percentage of clients reporting
access difficulties for the total sample, and for specialist homelessness, mental health
and drug and alcohol services. Clients responded to the question: ‘In the past three
months, have you experienced any of the following difficulties in accessing help for
housing, mental health and/or drug and alcohol problems?’

78
Table 19: Difficulties with access for total group and total service domains
Item Total Yes/No
Homelessness Yes/No
Mental health Yes/No
AOD Yes/No
Not willing to go to more than one service
12% / 88% 13% / 87% 11% / 89% 10% /90%
Services are not coordinated 26% / 74% 19% / 81% 28% / 72% 38% / 62%
Excluded because of drug and alcohol use
10% / 90% 2% / 98% 7% / 93% 34% / 66%
Excluded because of mental health problem
10% / 90% 5% / 95% 13% / 87% 18% / 82%
Excluded because of legal or criminal problems
5% / 95% 2% / 98% 6% / 94% 12% / 88%
No relevant service in local area
15% / 85% 13% / 87% 12% / 88% 28% / 72%
Limited access to transport 27% / 73% 22% / 78% 24% / 76% 44% / 56%
Waiting lists 49% / 51% 48% / 52% 47% / 53% 58% / 42%
Cost of service 23% / 77% 21% / 79% 21% / 79% 32% / 68%
Don’t know how to access service
29% / 71% 27% / 73% 26% / 74% 40% / 60%
Difficult to negotiate service system
29% / 71% 24% / 76% 25% / 75% 47% / 53%
For the total sample, the most notable difficulties experienced were those of waiting
lists, lack of knowledge of how to access a service, difficulty in negotiating the service
system, limited access to transport, and lack of coordination of services. Nearly half of
the clients surveyed had difficulties with waiting lists. Additionally, the AOD clients
experienced the highest frequency of difficulties compared to the other two client
groups (homelessness and mental health), demonstrating that access difficulties are
particularly prevalent in the drug and alcohol sector.
To test whether greater integration was associated with better access for clients,
correlational analyses were conducted between the depth of integration score
(Browne et al. 2004) as measured in the Service survey and the index of access
difficulty as measured in the Client survey. Only the significant correlations are
presented here. Results are presented for the total sample of client participants and
for the specific client groups of homelessness, mental health and drug and alcohol.
In the total sample, the degree of service integration was correlated with two forms of
difficulty. Clients from services with lower depth of integration scores (i.e., less
integrated services within the local network) were more likely to report greater
difficulties accessing help due to services not being coordinated (r = - .14; p<.05) and
due to a lack of understanding of how to access services (r = - .15, p<.05).
There were differences in the relationship between service integration and client
access across the three client groups. The significant relationship between service
integration and access difficulties due to poor coordination was seen for both mental
health clients (r = - .23; p<.05) and drug and alcohol clients (r = - .46; p<.01) but not
homeless clients. For both mental health and drug and alcohol clients, there was a
significant association between service integration and access difficulties due to
clients not knowing how to access relevant services (r = - .27, p<.01, and r = - .28,
p<.01, respectively). Additionally, for drug and alcohol clients, low service integration

79
was significantly associated with difficulties negotiating the service system (r = - .33;
p<.05). Furthermore, for mental health clients, low service integration was correlated
with access difficulties due to there being no perceived relevant service in their local
area (r = .29, p<.01).
Access difficulties: Perth
Results from the Integration Survey for the Perth sample of clients are presented in
Table 20. In accordance with the findings for the total sample, the most prominent
difficulties experienced were waiting lists, lack of knowledge of how to access a
service, difficulty in negotiating the service system, limited access to transport, and
lack of coordination of services.
Table 20: Difficulties with access for total group and service domains within Perth
sample
Item Total Yes/No
Homelessness Yes/No
Mental health Yes/No
AOD Yes/No
Not willing to go to more than one service
12% / 88% 14% / 86% 11% / 89% 11% /89%
Services are not coordinated 28% / 72% 19% / 81% 37% / 63% 40% / 60%
Excluded because of drug and alcohol use
11% / 89% 2% / 98% 9% / 91% 34% / 66%
Excluded because of mental health problem
10% / 90% 4% / 96% 20% / 80% 19% / 81%
Excluded because of legal or criminal problems
6% / 94% 3% / 97% 9% / 91% 10% / 90%
No relevant service in local area
17% / 83% 12% / 88% 20% / 80% 25% / 75%
Limited access to transport 28% / 72% 21% / 79% 29% / 71% 45% / 55%
Waiting lists 51% / 49% 46% / 54% 57% / 43% 60% / 40%
Cost of service 23% / 77% 17% / 84% 31% / 69% 32% / 68%
Don’t know how to access service
32% / 68% 26% / 74% 40% / 60% 40% / 60%
Difficult to negotiate service system
30% / 70% 22% / 78% 31% / 69% 48% / 52%
To test whether service integration was related to improved access for clients in the
Perth sample, correlational analyses were again conducted between the depth of
integration score (Browne et al. 2004) and indices of access difficulty. Although there
were no significant results for the total client group in Perth, relationships between
service integration and access difficulties did emerge for the mental health and drug
and alcohol client groups.
Mental health clients from less integrated services were more likely to report being
excluded from services in the past three months due to drug and alcohol use (r = -.40,
p<.05) and that there was no relevant service in their local area (r = -.40, p<.05). Drug
and alcohol clients from less integrated services have encountered greater access
difficulties due to services not being coordinated, (r = -.36, p<.05), a lack of knowledge
as to how to access relevant services (r = .34, p<.05), and problems negotiating the
service system (r = .37, p<.01).

80
Access difficulties: Melbourne
Results from the Integration Survey for the Melbourne sample of clients are presented
in Table 21. For clients in this sample, the most prevalent access difficulties were
waiting lists, lack of knowledge of how to access a service, difficulty in negotiating the
service system, limited access to transport, cost of the service, and lack of
coordination of services.

81
Table 21: Difficulties with access for total group and service domains within Melbourne
sample
Item Total Yes/No
Homelessness Yes/No
Mental health Yes/No
AOD Yes/No
Not willing to go to more than one service
11% / 89% 12% / 88% 11% / 89% 0% /100%
Services are not coordinated 20% / 80% 19% / 81% 22% / 78% 0% / 100%
Excluded because of drug and alcohol use
7% / 93% 6% / 94% 6% / 94% 33% / 67%
Excluded because of mental health problem
10% / 90% 12% / 88% 8% / 82% 0% / 100%
Excluded because of legal or criminal problems
8% / 92% 0% / 100% 4% / 96% 33% / 67%
No relevant service in local area
11% / 89% 18% / 88% 6% / 94% 66% / 33%
Limited access to transport 23% / 77% 29% / 71% 21% / 79% 33% / 67%
Waiting lists 44% / 56% 59% / 41% 40% / 60% 33% / 67%
Cost of service 22% / 78% 47% / 53% 13% / 87% 33% / 67%
Don’t know how to access service
22% / 78% 35% / 65% 17% / 83% 33% / 67%
Difficult to negotiate service system
25% / 75% 35% / 65% 21% / 79% 33% / 67%
There are several differences in the results for the Perth and Melbourne client
samples. Chi-square tests revealed that homeless clients in Melbourne were
significantly more likely to cite the cost of the service as representing an access
difficulty than homeless clients in Perth (p<.01). In contrast, mental health clients in
Perth were significantly more likely to report access difficulties due to service costs
than were mental health clients in Melbourne (p<.05). This issue was not explored
further in the client questionnaire. However, It may possibly reflect different funding
and governance structures between the two regions. Compared with those in
Melbourne, mental health clients in Perth were also significantly more likely to report
difficulties accessing help due to a lack of knowledge of how to access relevant
services (p<.05).
In contrast to the combined Perth and Melbourne and Perth alone samples, for the
Melbourne sample, there were no significant correlations between service integration
(using the depth of integration measure) and indicators of access difficulty. This may
be a result of insufficient statistical power due to the smaller sample size in Melbourne
(74 clients) compared to Perth (195 clients) and the total sample (269 clients).
6.3.2 Findings from interviews with case study participants
Interviews with case study participants (i.e., practitioners who work with clients of
homelessness, mental health and drug and alcohol services) described a number of
issues that clients encounter in terms of accessing services, and outlined how an
integrated service delivery approach can help to improve ease of access.
Improved access to services was described as being driven by engagement and
relationships, both with the client and between workers. From the client perspective,

82
this was primarily about building trust as explained by a health case study participant
involved in health outreach:
Often they’re unlikely to access mainstream health services due to a number
of reasons. I think they may have had negative experiences with the health
care system. So I think it’s my role just to be out there continually, regularly be
a face that these guys learn to trust, and then I can try and discuss some of
their health care needs, and try and link them where appropriate or try and
help them then and there.
The lack of trust was explained by a homelessness case study participant as a result
of previously stressful interactions with the health system. Homelessness case study
participants commonly raised the provision of both physical and mental health care via
on-site clinics as an effective means of overcoming the distrust and
uncomfortableness often felt by their clients when attending mainstream health
services.
You’ve got the issues of paranoia as well, as: ‘Last time I saw a doctor they
threw me into hospital and I couldn’t get out!’… It’s one of the reasons why it’s
really important that we have medical and psychiatric services here because
the guys can access them in a situation that’s familiar to them, they don’t feel
like they’re going to get dragged off to hospital straight away, particularly in the
case of mental health issues.
Many homelessness case study participants considered that access into the mental
health system was particularly difficult. This was the focus of a number of integration
initiatives examined as part of the case studies for the present study. Integration
strategies that demonstrated benefit in this regard included co-location of mental
health services with homelessness services, either through the direct employment of a
mental health professional (e.g., a psychologist) or through establishing links with
local mental health teams to deliver weekly clinics on-site. Although there were
additional benefits to an agency in employing their own mental health professional,
both strategies resulted in improved access into the health system as well as a
temporary accommodation system. For example, a health case study participant
involved in mental health outreach commented:
If a client wants to access crisis accommodation, say [the service] has noted
that they've got a history of mental illness and they haven't seen the
psychiatrist in a long time and aren't on any medication. What we'd be able to
do is provide that assessment and find out some of the background and
provide a report which they [the client] can take to the right refuge which will
enable them to get into the service. We're also able to go out and know where
someone is and able to arrange to assist them to come into their
appointments. So, to help them navigate the services, in a way. I think one of
the big problems is the NGOs have had issues getting crisis intervention for
some of their customers because of the inclusion criteria of the acute mental
health services, where we've been able to assist the NGOs into framing their
requests into a way that is understandable for acute care.
In the above quote, the outreach health professional operates as a link between the
two systems to create more effective referral pathways from one sector to another.
This link works on multiple levels—restoring a client’s trust in the system; increasing
tolerance in the health system for chaotic presentations; extending the reach of
mainstream health professionals into the homelessness sector; negotiating eligibility
criteria so that appropriate referrals are not excluded unnecessarily; and acting as a

83
translator so that real communication between health and homelessness workers can
occur.
Importantly, integration had an impact on appropriate access (as opposed to any
access). One aspect of the service utilisation by homeless people with complex needs
is the use of multiple services. Improved communication between services reduces
duplicate service provision and this benefits clients because it improves appropriate
access, as explained by a health case study participant:
I think that benefits the client, that they know what the particular services are
able to deliver so that they get the appropriate care delivery from the
appropriate service They become more aware where they get appropriate
service and also it helps open the doors for them to the services. … Our team,
for myself, by getting that assessment and getting a report done enables them
to access services which they wouldn't previously possibly have not been able
to access.
Sometimes, facilitating access to health care (rather than improved health outcomes
per se) was a key objective of integrated practice, as can be seen in the following
quote from a health case study participant:
To provide specialist health care to people who aren’t otherwise accessing it.
And, in the provision of that health care, obviously you’re improving people’s
quality of life, but also preparing people to access mainstream health. So, it’s
not necessarily that we’re here to resolve all health issues; it’s that we’re a
vehicle to help people to access mainstream health.
In this sense, coordination plays a significant role in identifying individual needs and
mapping those needs to the relevant part of the system in order that the system can
be most effective in doing what it is meant to do (i.e. address need). This is not only
true for services that interact across different systems (e.g. a hospital and a housing
support service), but also for individual agencies with multiple services. Coordinated
assessment and referral processes were seen as critical to effective service delivery.
Strategies included single entry points for triage and the separation of the assessment
process from service delivery. This enabled the development of a comprehensive
treatment plan with all referrals (both internal and external) being organised at the
point of assessment and coordinated or structured in such a way that the client moved
seamlessly through the required services according to need.
The waiting list was considered an important indicator of integration for some services
and made an organisational priority through the formation of committees designed to
review wait times on a regular basis and develop strategies to achieve immediate
access for clients. Improved access was also achieved through the facilitation of
referrals, described by a health service as ‘assertive’ referrals. This view was typically
associated with the assertive case management model and targeted at clients with
multiple and complex needs. Within the health sector, facilitation of referrals was often
necessary between treatment stages because of the high degree of specialisation
within the health sector. This can be seen in the following quote from a health case
study participant:
Well, we’re not linked to any other agency. But we certainly try and work with
other agencies if we know there’s a plan for that client. So, for example, we will
get clients coming through here who are hoping to go to rehab and they’ve got
a tentative bed date at rehab where it’s not confirmed until they do a
withdrawal. So, we’ll do a lot of liaison that way with the rehabs to try and
marry up that bed date with the rehab so they move straight through. It can be

84
quite difficult, again, ’cause of waiting lists of other agencies. So it often isn’t a
seamless service. That can be quite frustrating.
6.4 Client outcomes
While it is beyond the scope of the present study to undertake a robust assessment of
the overall effectiveness or impact of service integration on client outcomes, there are
some interesting findings in this direction both from the Integration Survey and from
the qualitative analysis in terms of the perceptions of clients of outcomes.
6.4.1 Findings from the Integration Survey
To test whether greater integration was associated with better outcomes, client
participants were asked to indicate how helpful their current service had been in
addressing their needs. Response categories ranged from ‘not at all helpful’ to
‘extremely helpful’. This score was than correlated with the depth of integration score
(Browne et al. 2004) for the service from which the client was recruited. There was no
evidence of a significant relationship between level of service integration and client
ratings of met need for the total sample. When examined by service domain, the only
significant association was found for specialist homelessness services: a higher depth
of integration score was associated with client reports that the service had been more
helpful in addressing the client’s needs (r = .21, p<.05).
Client outcomes were also considered from the service managers’ perspective, via
open-ended questions in the Integration Survey. Responses from service participants
were limited to general endorsement of integrated practices in improving client
outcomes. Few responses mentioned specific outcomes that were likely to improve
because of integration. One service participant suggested clients experienced
improved feelings of support. Greater mention was made of the mechanisms by which
integration achieved better client outcomes and this included an enhanced ability to
identify and manage client needs.
6.4.2 Findings from interviews with case study participants
There were two major themes identified from the case study interview data. The first is
concerned with the specification of client outcomes and this was reflected at the level
of policy and practice. The second theme relates to the specific outcomes commonly
targeted by integrated interventions and programs for homelessness. Participants
commonly discussed four outcomes—engagement, housing, health and wellbeing.
Each of these themes are discussed in turn in the sections following.
Identifying outcomes
Case study participants found it difficult to define client outcomes primarily because
they were often highly individualised, as indicated in the following quote from a
homelessness case study participant:
All those little steps that get the person so they can keep their housing and
they are paying rent and they are not fighting with neighbours and not going
back into custody, all that kind of stuff. Same with recidivism as well, all those
bits and pieces come together to make the person more stable so that they
aren’t going to go back to re-offend and aren’t going to be put back into
custody. So it is a hard one to define because it is so different with every client
and there is no prescriptive way that is going to work with everyone.
Although program outcomes necessarily focus on population-level indicators such as
treatment completion, client outcomes were typically broken down into smaller units
and addressed one at time and at a pace determined by the client (as mentioned in

85
the preceding section on improved access). Moreover, the identification of client
outcomes was commonly negotiated between a client and their worker and in this
sense was sometimes antagonistic with service integration goals—for example, the
benefits ascribed to comprehensive, single point assessments. This tension was
described by a health case study participant as follows:
So, but I think that that's the hardest part is that every service has their own
little way of dealing with certain things and that when you get all together, the
outcome needs can also be different; sometimes it might be the government
that's actually ruling it because they want funding in a particular way.
One other thing of note regarding the evidence for client outcomes is the fact that
service providers are not always privy to outcomes. For example, a homelessness
case study participant involved in a formal partnership with the local hospital
commented on the transient lifestyle and multiple service use of many homeless
clients with complex needs and the possibility they will re-present at a different
hospital. This can only be addressed with longitudinal research methods or a shared
information system that would allow for the tracking of individual clients across
services. Additionally, service providers are more likely to learn of the not-so-good
outcomes of clients:
We very rarely hear of the stories of the clients who have got on with their
lives, are going on to paid employment, got married. We don’t hear their
stories. What we do see is the clients who relapse, who come back through,
we see them, but we never see our clients who do really well. And that’s quite
a shame really.
In some circumstances, however, repeat presentations could be considered as
positive outcomes as explained by one homelessness case study participant:
But in some ways they are touching base with us because they had that
trusting relationship, we were able to support them, and now something is
going on and they think maybe [program name] can help me.
Finally, sometimes staff had to accept the absence of outcome as described in the
following quote from a homelessness case study participant:
The important thing is that a lot of homeless people don’t want to engage, they
actually don’t want any help, they want to sleep out in the streets. And a lot of
the time the accommodations aren’t appropriate and they are not safe enough
too. So they prefer to sleep in the streets. And we understand that, but it is at
least trying to get to the core of what is actually happening, to engage with the
service, to actually just take some time to sit down and talk to someone and
see what we can actually do with the issues. A lot of the times it’s non-
responsive and that’s fine. This person actually does have a few crisis
admissions and sometimes we have to accept that. But a lot of the time it
actually does work. They then know they have got [support worker] to talk to in
relation to their homelessness and trying to seek alternative accommodation.
Engagement
Many case study participants considered that engagement was a key goal of
integrated programs for clients with multiple and complex needs. This could occur at
multiple levels, including engagement with a particular service or program,
engagement within their local community, or engagement with the mainstream service
system. For example,

86
[The goal is to] develop relationships so they’ve got the confidence in you, and
they want to change, and facilitating that.
Staff qualities were critical in this regard; specifically, patience, tolerance and
understanding were key drivers of successful engagement with clients, as noted by a
mental health case study participant working with clients experiencing homelessness:
We’re quite flexible about times, locations, how we deliver the services.
Patience as well, I think we take time to build a relationship with the client. The
other part of what we deliver is knowledge about homelessness and
experience in the homeless sector; that we understand their issues and we
understand what the pressures may be and how to tailor a response to that.
Significant investment in inter-agency liaison in addition to an assertive outreach
approach was often required to build engagement with highly transient and complex
needs clients:
It was also bringing in all the other agencies that might be involved. So we are
talking about it being assertive, but it was also the inter-agency (the client may
be known to quite a few agencies). And so a care plan could be developed
prior to building that relationship with the client. These other agencies knew
what the goal was and would be involved in trying to draw that client back into
the project. And it did work quite successfully.
Housing
Although the aim of many integrated programs was an exit out of homelessness, this
was not always possible and the pragmatic aim was for the least-worst homelessness
state. For example, a homelessness case study participant involved in a formal
partnership with the local hospital commented:
The aim of the program is for people not to be discharged into homelessness.
We’re having to refer to boarding houses which is tertiary homelessness, but
not everyone is referred into the most appropriate housing because that’s not
available. Success would be that we were able to place them in
accommodation where they felt safe and secure, that was affordable, and they
were linked to appropriate services of their choosing.
One health case study participant explained that they’d given up on housing as it just
wasn’t a realistic outcome:
I guess I don’t always see it in terms of housing success now; I measure
success in terms of relative success, from where they were from the point at
which they first accessed the service to where they are now and what their
level of engagement is …
The key impediment to achieving positive housing outcomes was capital resources.
Programs that were able to resource appropriate housing options demonstrated
significant success:
We have 50 transitional properties where we are able to place clients … our clients do exceptionally well in the transitional properties. We’ve had clients who have stayed for 15 months and that stability has ensured that they have got back into uni or back into employment, and none of those clients have come back into the criminal justice system.
Aside from sufficient resources, programs with strong partner relationships also
demonstrated highly successful outcomes as noted by a health case study participant
involved in a partnership with a homelessness support service:

87
But, of course, as an [integrated] service, we’re also housing people. So
supporting people into accommodation, and then making sure they don’t fall
out the other side. So, providing really a secure kind of wrap-around service to
people that as they go into housing and have huge life changes that are often
positive but can be quite stressful. So, we’re—we’re there to provide that
throughout.
Health
Many health-homelessness partnerships demonstrated improvements in treatment
adherence and treatment retention. For example, outreach health clinics offered
alternative means of addressing breached Community Treatment Orders (CTOs) and
avoided the more invasive process of having the client forcibly brought into the mental
health service for their scheduled medication. This was possible because the outreach
health professional had opportunistic access to clients. In the case of a
homelessness-specific health service, this outreach model was enhanced through
remote access to the hospital client information system, enabling the outreach health
professional to make the most of opportunistic contact with clients:
But I can check what’s happened, the latest notes in terms of the mental
health service, where they’re up to with things, and to contact the necessary
person, ascertain exactly what’s going on.
With regard to treatment retention, one health case study participant revealed that the
proportion of clients completing treatment improved following the implementation of a
single agency-wide assessment process. The new process involved a comprehensive
needs assessment and the generation of a coherent treatment plan specifying the
timing of referrals to the relevant programs and services within the agency. The
participant explains:
We’ve changed our assessment process, we’ve changed all our processes
over at [site name] and as a result of that, by the time the clients get here
they’re a lot more prepared and they stay the seven days. Whereas in the old
system, they weren’t prepared and they didn’t stay.
Another health participant described the improvement realised with a more client-
centred approach that involved taking the time to inform clients about the way in which
the health system worked and where they could best get their needs met:
But if they're given information and can make a good informed decision, things
work. That's when their health can actually improve.
Health-homelessness partnerships also had a direct impact on client health outcomes
by way of secondary consultations with other professionals involved in the client’s
care. This was explained by a mental health case study participant:
And often patients are pretty chaotic and can’t adhere to what they’re told to
do … So we work with that. And it’s also allaying the anxieties of the treating
teams as well, [especially] if you’ve got a non-complying patient. We’re not
providing cotton wool for them, we’re not providing a place to stay, because
often we can’t, because they don’t want to go there. But at least we’re trying
our best to be a familiar face for patients, and they’re less anxious when
seeing the medical team.
A specific example of the success of this approach was described by a health case
study participant attempting to engage with a homeless client who required surgery
but had repeatedly failed to return phone calls or attend appointments. Because they
were able to liaise directly with admissions staff, the client’s referral remained active,

88
well after the usual referral mechanisms had been exhausted. Additionally, they took
the time to introduce the client to the nursing staff on the ward and in this way
alleviated much of the anxiety that was driving the client’s non-responsiveness. As a
result, surgery was successfully undertaken and the client’s ongoing pain issues were
resolved.
6.5 Summary
This chapter provides findings from the Integration Survey on the views of clients on
forms of service integration practice and their experience of integration in the service
system using a set of measures of client integration. We assess the correlation
between a given client integration indicator and the extent to which the service is
integrated with other services using the service depth of integration score (Browne et
al. 2004). The chapter also provides insights from interviews with case study and
stakeholder participants on the impact of service integration on client outcomes.
The majority of client participants from the Integration Survey indicated that both
information sharing and care coordination between services was very important. This
was particularly the case for clients of specialist mental health services.
Clients from more integrated services (using the Browne depth of integration
measure) were generally more likely to report positive outcomes across a range of
client integration measures than were clients of less integrated services. For example,
across all sector domains, clients of more integrated services were more likely to have
a case manager than clients from less integrated services. Given the importance of
case management for supporting clients with complex needs to access relevant
services, this suggests that more integrated services can provide a more seamless
approach to service delivery. Clients from more integrated homelessness services
reported that the service was directly helping them with their mental health needs. In
contrast, clients from drug and alcohol services with lower levels of integration were
more likely to report that they had not told the service about their homelessness
problems, or the service had not asked. Clients from more integrated homelessness
services were more likely to report that providers of different services have frequently
worked together to coordinate their care over the past three months.
Clients listed the following key problems in accessing help for housing, mental health
and/or drug and alcohol problems—long waiting lists, lack of knowledge of how to
access a service, difficulty in negotiating the service system, limited access to
transport, and lack of coordination of services.

89
7 EVALUATING THE INTEGRATED SERVICE DELIVERY APPROACH
Research Question 5: What are the views of homelessness, drug and alcohol and
mental health services about the pros and cons of service integration and its overall
effectiveness, particularly in relation to the delivery of services for homeless people?
This chapter presents and examines the views of service managers, policy-makers,
and senior industry representatives in relation to the benefits and drawbacks of
service integration. The findings from interviews and the Integration Survey provides
indirect and non-conclusive data about what this means in terms of the effectiveness
of an integrated service delivery approach.
Service providers’ perceptions of the benefits and drawbacks of integration were
measured using the Weiss et al. (2002) Partnership Synergy Self-Assessment Tool,
as part of the Integration Survey. Lasker, Weiss and Miller’s (2001) review of the
relevant literature suggests that one of the factors influencing whether or not agencies
integrate with others in a network is their perception of the benefits and drawbacks of
such activities. The Weiss et al. (2002) 1-item Comparing Benefits and Drawbacks of
Participation scale, 11-item Benefits of Participation scale and 6-item Drawbacks of
Participation scale were used to measure service managers’ perceptions of the pros
and cons of integrating within the Perth and Melbourne networks.
In regard to comparing benefits and drawbacks, respondents were asked to rate on a
5-point scale how the benefits of participating in their chosen partnership compared to
the drawbacks (with 1 representing ‘drawbacks greatly exceeds the benefits’ and 5
representing ‘benefits greatly exceeds the drawbacks’).
Table 22 shows that, on average, for the total sample, service participants perceived
the benefits of participation exceeding the drawbacks (M= 3.91). This was also true
for each of the separate service domains. A one-way ANOVA showed that there were
no significant differences between the service domains on this measure.
Table 22: Comparison scores for benefits and drawbacks of participation among
service participants
Dimension Total Homelessness Mental health Drug & alcohol
Comparing benefits and drawbacks
3.91 3.87 3.80 4.14
A more detailed analysis of service managers’ perceptions of the benefits of
participation with other services can be drawn from a series of yes/no questions put to
service managers asking them whether they had received a professional benefit (e.g.
enhanced ability to report a chosen issue) as a result of participating in a partnership
with other services.
Figure 16 shows that for the total sample, the majority of service managers reported
that they had received (in order of benefit):
The ability to have a greater impact than I could have on my own.
The ability to make a contribution to the community.
Enhanced ability to meet the needs of my constituency or clients/consumers.
Development of valuable relationships.

90
Acquisition of useful knowledge about services, programs, or people in the community.
Increased utilisation of my expertise or services.
Enhanced ability to address an important issue.
The development of new skills.
Figure 16: Proportion of service participants reporting different benefits of participation,
stratified by service domain

91
Half of the sample experienced a heightened public profile, and only just over a third
reported an enhanced ability to effect public policy and the acquisition of increased
financial support.
The entire sample of specialist homelessness service managers reported that they
found that participation enhanced their ability to meet the needs of their constituency
or clients/consumers, gave them the ability to have a greater impact than they could
have on their own, and gave them the ability to make a contribution to the community.
For mental health services, all service managers reported that participation gave them
the ability to have a greater impact than they could have on their own. Finally, drug
and alcohol service managers reported that participation gave them the ability to
make a contribution to the community. However, it appears that the experience of
participation for this domain is time consuming, with most reporting that participation
results in a diversion of time and resources away from other priorities and obligations
(75%; see Figure 17).
Figure 17: Proportion of service participants reporting different drawbacks to
participation, stratified by service domain

92
In the Integration Survey, services also had the opportunity to provide their opinion on
the organisational costs of providing integrated care and the extent to which they
considered ‘integrated care’ to be always desirable.
Figure 18 documents the pros and cons of integration described by service managers
who completed the Integration Survey. The benefits of integration included an
enhanced ability to meet client needs, capacity to provide holistic care and a common
entry point into the service system. Additionally, service participants felt integration
was most beneficial when there were clearly articulated goals. The drawbacks to
integration included less organisational flexibility, loss of organisational identity, and
client preferences for specialist services.
Figure 18: Benefits and drawbacks to integration articulated by service participants in
the Integration Survey
Responses from interviews with stakeholders and case study participants were
consistent with these findings. Given the potential drawbacks to integration, a number
of stakeholders and case study participants commented that the benefits of integration
needed to be acknowledged and communicated to all stakeholders up-front in order to
promote commitment and cooperation among partners. These concerns were
expressed by a homelessness policy stakeholder as follows:
I think it’s about properly selling the message to the services working out what
these things really mean. What are the implications for them? What are the
benefits? What are the sacrifices they’re going to have to make and why is it
useful? No one ever talks with any courage to services about the sacrifices
that might go with doing any of this. You know: ‘if you take this on, you might
have to give this up for the greater good’. If you’re going to work together as
one holistic unit, in theory, it may be that actually we need to move resources
away from here and put them over here because this is a better place for
them. And, you know, that’s where you come up against immovable forces,
and I don’t think you can really achieve integration if you are working against
immovable forces protecting vested interests. So, how do you reassure the
services?

93
Likewise, a housing policy stakeholder explained that the significant investment in
highly integrated service responses needed to be weighed carefully against the
expected benefits for the target population:
There is an element of it that is worthwhile: coalescing specialists or experts
around a client, or a group of clients that need that high level of personal
management of their support needs. But to make that work, there’s a high
level of effort and a high level of investment and responsibility and
accountability. One of the reasons why I think that they’re bound to fail at
some stage is that you can’t sustain that level of effort required for all clients.
So it works because people are coalesced around a high-risk situation and
therefore have the desire and the ability to put enough emphasis on making
things work and doing the stuff that’s hard and making the system change.
This works for those few clients. It will work for 20, it might work for 50, but will
it work for 500? And that’s where to me it becomes unsustainable. There’s a
tipping point at which people cannot sustain the effort to help making change
happen. That’s where the systemic change needs to occur for the more ‘run of
the mill’ cases where the person just has the general homelessness issues
with a couple of key risk elements, but are not in crisis in every scenario.
One health case study participant suggested there could also be negatives from a
client perspective:
I think sometimes the clients might feel it's not beneficial. So I think sometimes
they're used to accessing various different services in separate ways and
maybe playing off services against each other. With service communication,
they get less than they're used to and they can find that frustrating because
they're not inappropriately accessing services anymore. So I think that that
might be the only drawback from a client's point of view.

94
8 SUMMARY AND POLICY DISCUSSION
Research Question 6: In what ways can the findings of this study inform policy with
respect to service integration and the practice of integrated service delivery for
homeless people?
This mixed-methods study on service integration brings together a rich array of
evidence to further inform our understanding on current practices, experiences and
attitudes toward service integration in the homelessness, mental health and drug and
alcohol sectors in Australia. The results of the multi-level Integration Survey,
interviews with key stakeholders and the case studies help to give a comprehensive
and multi-layered picture of the features, challenges and opportunities of this
approach to service delivery. It also covers conceptual issues as to the meaning of
integration as well as evidence on the extent, scope and depth of integration, and the
workings and functioning of integration and formal partnerships. The views and
experiences of policy makers, agency managers and service managers were
important in gathering this information. However, as the aim of a more integrated
service system is to improve client outcomes we have put the views and experiences
of clients at the core of our work. The inclusion of clients as participants in the study
proved to be an important and useful component.
The concept of integration remains an area of debate as evident in the review of the
literature presented in Chapter 2. However, it is clear from the responses of
stakeholders and from the case study evidence that integration is conceptualised by
key Australian practitioners and policy-makers primarily as the process of the
coordination of a network of services—as ‘joined up’ services that focus on client need
and client outcomes. Central to the idea of a client-centred approach to integration, as
defined by the key stakeholder and case study participants, are notions of ‘no wrong
door’ and the undertaking of a comprehensive needs assessment of clients upon
intake, with professionals considering how the multiple needs of clients should be met,
rather than dealing only with those issues that sit within their area of expertise.
The findings from the Integration Survey indicate the importance of service integration
to clients themselves. Clients expressed the view that it was important for services to
work together to deliver a streamlined service and spoke of the consequences of
services not integrating well. The continual re-telling of their stories and confusion
about the workings of the service system were expressed as undesirable
consequences of a less integrated service system. The majority of client participants
in the Integration Survey indicated that information sharing among service providers
and effective care coordination was important to them. At the same time, however,
they were also concerned with privacy issues, which indicates that the whilst
information should be shared on a ‘need to know’ basis, expected principles of
informed consent, privacy and confidentiality should still be applied in an integrated
service system. Therefore, organisational mechanisms need to be in place to support
service providers in their pursuit of service integration, particularly in the area of
providing direction around how to engage in client information sharing with other
service providers.
An important finding of the current study was that clients from more integrated
services were more likely to report positive outcomes across a range of client
integration measures than were clients of less integrated services. Clients of more
integrated homelessness services, for example, were more likely to have a case
manager than clients from less integrated services. Case management type
approaches to service delivery are considered important components of service
integration, especially for clients with complex needs as case management aims to

95
place the client at the centre of service delivery by working towards a seamless
delivery of services and ensures that the needs of clients are being met by relevant
services. As a further reflection of this type of approach, clients of more integrated
homelessness services were also more likely to report that providers of different
services had more frequently worked together to coordinate their care.
The findings from the Integration Survey in relation to the Perth and Melbourne sites
suggest that services in the homelessness, mental health and drug and alcohol
domains are fully aware of other services in the region and often engage in an active
program of communication and informal information sharing with them. However, at
the broad regional level, services stop short of more developed and structured forms
of integration, including ‘cooperation’ and ‘collaboration’. Cooperation involves
services using their knowledge of other services to guide and modify their own service
planning, while collaboration involves services jointly planning policies and/or services
and actively modifying service activity based on advice and input from mutual
discussions.
However, while services may not act in a ‘collaborative’ fashion with the full set of
services in their region, many do have a close collaborative relationship with at least
one other service in the relevant geographical space. In the Perth sample, for
example, around half of all homelessness services had at least one collaborative
relationship with another service with 40 per cent having a collaborative relationship
with at least one drug and alcohol service, but none with mental health services. The
findings from the Integration Survey also paint a picture of vertical integration in a
number of agencies with services providing homelessness, housing, drug and alcohol
and mental health services outside their direct area of specialisation. Moreover,
services who do engage in formal partnerships report relatively high strong
relationships across the various domains of synergy, leadership, partnership
efficiency, administration and management and resources.
One of the interesting features of the study was that the desired depth of integration is
somewhat higher than actual levels of integration suggesting a wish among service
managers to increase the level of integration between services across relevant
regions, but only by a notch. There is not a desire to increase levels of integration
across the full range of services in a region consistent with full collaboration.
Services generally reported relatively low scores across critical ingredients of
integration thought to be important for success in sustaining and developing service
integration arrangements. Across the domains of sharing and participation between
services; client referrals; relationships between staff; and, inter-agency functioning,
services were more likely to respond that they ‘never’ engage in the practices outlined
and least likely to respond that they ‘always’ engage in these practices.
Do services overall see a net benefit from participating with other services in the
delivery of support to clients? The broad answer is that, in the main, service
participants perceived the benefits of participation exceeding the drawbacks and this
was true for each of the separate service domains. The key benefits from greater
participation as perceived by service managers was that services felt that they were
able to have a greater impact than they could on their own, make a contribution to the
community, meet the needs of clients better, develop valuable relationships, and
acquire useful knowledge about services, programs, or people in the community.
Nevertheless, services do report drawbacks from integration, including less
organisational flexibility, loss of organisational identity, time involved and the fact that
clients may prefer more specialist services.

96
Taking into account the potential benefits and costs of integration, there are clearly
some possible tipping points in terms of individual services and their participation in
integrated networks of support,. Resource implications and potential issues
surrounding the leadership of the network and the autonomy of individual services and
agencies needs to be considered when services consider more structured
relationships. There are clearly other major issues to consider as well in terms of
integrated service delivery approaches. These include the role of systems-level
integration, the support of government and the funding of the additional resource
costs of integration, and the role that government health providers play in integrated
frameworks.
This study has only touched on the question of the impact of integration on client
outcomes and there remains a significant research agenda ahead before a more
definitive assessment of client impact is possible. Whilst our findings do show that
clients desire the benefits of what an integrated service system brings (i.e., care
coordination), our research also suggests that some clients continue to experience
difficulties with access to the services they need. Whilst there was evidence to
suggest that greater depth of integration is associated with stronger case
management and access to service benefits, wider client impacts are difficult to
discern and lay beyond the scope of the present study.
Service integration has been a major plank of Australian policy discussions and
settings in all jurisdictions in Australia. The White Paper, The road home, and
subsequent homelessness plans implemented by state and territory jurisdictions refer
to the importance of service integration in achieving an end to homelessness for
clients. A similar focus on service integration is evident in the mental health and drug
and alcohol domains.
Based on the findings of this report, there are a number of issues that can be
identified as relevant for consideration in future policy settings and by services
themselves.
The most important conclusion to be drawn from the study from a policy perspective is
that there is a desire on the part of both clients and service managers for greater
levels of service integration and that service integration is associated with improved
client integration as perceived by clients. What this means is that there is significant
support for the broad service integration agenda on the part of clients and services,
the two ‘actors’ that matter the most.
However, beyond this, there are significant implications of the findings as to the form
that service integration should take and the role governments may play in supporting
integration.
First, it is clear that some agencies have themselves expanded the range of services
they provide so that integrated responses may come from within rather than from
other agencies. In other words, integrated care, provided by a single agency with
multiple service functions, may prove particularly effective. Moreover, the majority of
services have developed close collaborative relationships with at least one other
service and so bottom-up approaches are flourishing. At the same time, some
services did not have a collaborative relationship and there was greater likelihood of
collaboration within the same service domain than between service domains. The
evidence from the Integration Survey is that these close collaborative relationships
and formal partnerships are producing positive net benefits. So service integration
should not be viewed through a quantitative lens alone (i.e., that services are
collaborating with all other services in a given geographical area), but rather should be
assessed through the quality of integrated relationships or approaches and how these

97
meet the needs of the clients that they serve. Services, therefore, should be
supported in the method that suits their particular situation best, and not supplanted
by rigid, externally-imposed programs of integration.
Second, while services wish to increase the levels of integration across a broad set of
services in a region, they wish to do so while clearly retaining their independence and
not to the point of joint planning and delivery of support functions. There are limits to
desired integration and these limits should be recognised in government initiatives.
Third, service integration is highest between services in the same domain rather than
between services in different domains. Governments and peak bodies may play a role
in increasing connections between different service domains. The profile of clients in
the three service domains examined indicates significant overlap in terms of client
profile and hence a need for greater cross-sectoral dialogue.
Fourth, despite the fact that services perceive a net benefit from service integration;
services identified a number of issues around governance and resource support. The
role of systems-level integration, the support of government and the funding of the
additional resource costs of integration, as well as the role of government health
providers in integrated frameworks, need to be considered.
Fifth, the evidence presented in terms of the functioning of integration suggests that
integration practices remain relatively thin around sharing of information, relationships
between staff in different services and so on, and may need support to strengthen
them before they are effective.
Future research directions may include a deeper investigation of effective models of
integration for clients experiencing homelessness, drug and alcohol and/or mental
health issues in other Australian regions, especially in relation to improved client
outcomes. Identifying existing structural mechanisms within networks that assist with
the sharing of protocols, policies and client-care plans in order to meet the needs of
such clients and improve client outcomes would be of benefit to the continued growth
in integration practices in the period ahead.

98
REFERENCES
Ahgren, B & Axelsson, R 2005, ‘Evaluating integrated health care: A model for
measurement’, International Journal of Integrated Care, [serial online
<http://www.ijic.org>
Allen, C & Stevens, S 2007, ‘Health service integration: A case study in change
management’, Australian Health Review, vol. 31, pp.267–75.
Australian Government 2004, The National Drug Strategy, Australia’s integrated
framework, 2004–2009, Ministerial Council on Drug Strategy, Australian
Government, Canberra.
—— 2008, Which way home? A new approach to homelessness, the Australian
Government’s Green Paper on Homelessness, Australian Government,
Canberra.
—— 2009a, The road home, A national approach to reducing homelessness, the
Australian Government’s White Paper on Homelessness, Australian
Government, Canberra.
—— 2009b, Fourth National Mental Health Plan, An agenda for collaborative
government action in mental health 2009–2014, Australian Government,
Canberra.
—— 2011, National Drug Strategy 2010–2015. A framework for action on alcohol,
tobacco and other drugs, Australian Government, Canberra.
Brazil, K, Whelan, T, O’Brien, MA, Sussman, J, Pyette, N & Bainbridge, D 2004,
‘Towards improving the co-ordination of supportive cancer care services in the
community’, Health Policy, vol. 70, no. 1, pp.125–31.
Brindis, CD, Loo, VS, Adler, NE, Bolan, GA & Wasserheit, JN 2005, ‘Service
integration and teen friendliness in practice: A program assessment of sexual
and reproductive health services for adolescents’, Journal of Adolescent
Health, vol. 37, no. 2, pp.155–62.
Browne, DT, Rokeach, A, Wiener, J, Hoch, JS, Meunier, JC & Thurston, S 2012,
‘Examining the family-level and economic impact of complex child disabilities
as a function of child hyperactivity and service integration’, Journal of
Developmental and Physical Disabilities, pp.1–21.
Browne, G, Kingston, D, Grdisa, V & Markle-Reid, M 2007, ‘Conceptualization and
measurement of integrated human service networks for evaluation’,
International Journal of Integrated Care, [serial online <http://www.ijic.org>,
p.7.
Browne, G, Roberts, J, Gafni, A, Byrne, C, Kertyzia, J & Loney, P 2004,
‘Conceptualizing and validating the human services integration measure’,
International Journal of Integrated Care, [serial online <http://www.ijic.org>,
p.4.
Care Services Improvement Network, Integrated Care Network 2009, Bringing the
NHS and local government together: A practical guide to integrated working,
<http://www.icn.csip.org.uk/practicalguidetointegratedw>.
Compton, W, Conway, K, Stinson, F, Colliver, J & Grant, B 2005, ‘Prevalence,
correlates, and co-morbidity of DSM-IV antisocial personality syndromes and
alcohol and specific drug use disorders in the United States: Results from the

99
National Epidemiologic Survey on Alcohol and Related Conditions’, Journal of
Clinical Psychiatry, vol. 66, pp.677–85.
Conway, K, Compton, W, Stinson, F & Grant, B 2006, ‘Lifetime co-morbidity of DSM-
IV mood and anxiety disorders and specific drug use disorders: Results from
the National Epidemiologic Survey on Alcohol and Related Conditions’,
Journal of Clinical Psychiatry, vol. 67, pp.247–57.
Dickinson, H 2006, ‘The evaluation of health and social care partnerships: An analysis
of approaches and synthesis for the future’, Health and social care in the
community, vol. 14, no. 5, pp.375–83.
Fischer, P, & Breakey, W 1991, ‘The epidemiology of alcohol, drug, and mental
disorders among homeless persons’, American Psychologist, vol. 46,
pp.1115–28.
Flatau, P, Conroy, E, Clear, A & Burns, L 2010, The integration of Homelessness,
Mental Health and Drug and Alcohol Services in Australia, AHURI Positioning
Paper No. 132.
Flatau, P, Conroy, E, Marchant, T, Burns, L, Spicer, B, Di Nicola, K, Edwards, R,
Bauskis, A, Athanassios, M & Larsen, K 2012, The Michael Project, 2007–
2010, New perspectives and possibilities for homeless men, Mission Australia.
Fazel, S, Khosla, V, Doll, H, Geddes, J 2008, ‘The prevalence of mental disorders
among the homeless in western countries: Systematic review and meta-
regression analysis’, PLoS Medicine, vol. 5, no. 12: e225.
doi:10.1371/journal.pmed.0050225.
Gillies, RR, Shortell, SM, Anderson, DA, Mitchell, JB & Morgan, KL 1993,
‘Conceptualising and measuring integration: Findings from the Health Systems
Integration Study’, Hospital & health services administration, vol. 38, no. 4,
p.467.
Glasby J 2005, ‘The integration dilemma: How deep and how broad to go?’, Journal of
Integrated Care, vol. 13, pp.27–30.
Goodwin, N 2008, ‘Are networks the answer to achieving integrated care?’, Journal of
Health Services Research and Policy, vol. 13, pp.58–60.
Granner, M & Sharpe, P 2004, ‘Evaluating community coalition characteristics and
functioning: A summary of measurement tools’, Health Education Research,
vol. 19, no. 5, pp.514–32.
Gröne, O & Garcia-Barbero, M 2002, Trends in integrated care: Reflections on
conceptual issues, World Health Organization, Regional Office for Europe,
Copenhagen.
Herrman, H, Evert, H, Harvey, C, Gureje, O, Pinzone, T & Gordan, I 2004, ‘Disability
and service use among homeless people living with psychotic disorders’,
Australian and New Zealand Journal of Psychiatry, vol. 38, pp.965–974.
Jablensky, A, McGath, J, Herrman, H, Castle, D, Gureje, O, Morgan, V & Korten, A
1999, People living with psychotic illness: An Australian study 1997–1998,
National Survey of Mental Health and Wellbeing Report 4, Commonwealth of
Australia, Canberra.
Keast, R, Brown, K & Mandell, M 2007, ‘Getting the right mix: Unpacking integration
meanings and strategies’, International Public Management Journal, vol. 10,
pp.9–33.

100
Keast, R, Waterhouse, J, Brown, K, & Murphy, G 2008, Closing the gaps and opening
the doors: The function of an integrated homelessness service system, Place-
based Network Analysis and Case Studies, Queensland Department of
Communities ISBN: 978 1 74107 280 8.
Kessler, R 2004, ‘The epidemiology of dual diagnosis’, Biological Psychiatry, vol. 56,
pp.730–37.
Kodner, D & Spreeuwenberg, C 2002, ‘Integrated care: Meaning, logic, applications
and implications—A discussion paper’, International Journal of Integrated
Care, [serial online <http://www.ijic.org/>, p.2.
Koegel, P, Burnham, M, & Farr, R 1988, ‘The prevalence of specific psychiatric
disorders among homeless individuals in the inner city of Los Angeles’,
Archives of General Psychiatry, vol. 45, pp.1085–92.
Konrad, E 1996, ‘A multidimensional framework for conceptualising human services
integration initiatives’, New Directions for Evaluation, vol. 69, pp.5–19.
Lasker, D, Weiss, E, & Miller, R, 2001, ‘Partnerhsip synergy: A practical framework for
studying and strengthening collaborative advantage’, The Milbank Quarterly,
vol. 79, p.2.
Leutz, W 1999, ‘Five laws for integrating medical and social services: Lessons from
the United States and the United Kingdom’, The Milbank Quarterly, vol. 77,
pp.77–110.
Lloyd, J & Wait, S 2006, Integrated care. A guide for policymakers, International
Longevity Centre–UK, <http://www.ilcuk.org.uk/files/pdf_pdf_7.pdf> accessed
7 February 2009.
Mares, A, Greenberg, G & Rosenheck, R, 2008, ‘Client-level measures of services
integration among chronically homeless adults’, Community mental health
journal, vol. 44, no. 5, pp.367–376.
Ouwens, M, Wollersheim, H, Hermens, R, Hulscher, M & Grol, R 2005, ‘Integrated
care programmes for chronically ill patients: A review of systematic reviews’,
Int J QualHealth Care, vol. 17, pp.141–6.
Phillips, R, Milligan, V & Jones, A 2009, Integration and social housing in Australia:
Theory and practice, AHURI Final Report No. 129, AHURI, Melbourne.
Provan, KG & Milward, HB 1995, ‘A preliminary theory of interorganisational network
effectiveness: A comparative study of four community mental health systems’,
Administrative Science Quarterly, vol. 40, pp.1–33.
—— 2002, ‘Do networks really work? A framework for evaluating public‐sector
organisational networks’, Public administration review, vol. 61, no. 4, pp.414–
23.
—— 2006, ‘Health services delivery networks: What do we know and where should
we be headed?, Healthcare papers, vol. 7, no. 2, pp.32–6.
Provan, KG, Veazie, MA, Teufel-Shone, NI & Huddleston, C 2004, ‘Network analysis
as a tool for assessing and building community capacity for provision of
chronic disease services’, Health Promotion Practice, vol. 5, no. 2, pp.174–81.
Ramsay, A, Fulop, N & Edwards, N 2009, ‘The evidence base for vertical integration
in health care, Journal of Integrated Care, vol. 17, pp.3–12.

101
Reilly, J, Herrman, H, Clarke, D, Neil, C & McNamara, C, 1994, ‘Psychiatric disorder
in and service use by young homeless people’, Medical Journal of Australia,
vol. 161, pp.429–32.
Rosenheck, R, Morrissey, JP, Lam, J, Calloway, MO, Johnsen, M, Goldman, H,
Randolph, F, Blasinsky, M, Fontana, A, Calsyn, R & Teague, G 1998, ‘Service
system integration, access to services, and housing outcomes in a program for
homeless persons with severe mental illness’, American Journal of Public
Health, vol. 88, pp.1610–15.
Strandberg-Larsen, M, & Krasnik, A 2009, ‘Measurement of integrated healthcare
delivery: A systematic review of methods and future research directions’,
International Journal of Integrated Care, vol. 9.
Suter, E, Oelke, ND, Adair, CE, Waddell, C, Armitage, GD & Huebner, LA 2007,
Health systems integration. Definitions, processes and impact: A research
synthesis,
<http://www.calgaryhealthregion.ca/hswru/documents/projects/HealthSystemsI
ntegration_Ju>
Teesson, M & Proudfoot, H (eds.) 2003, Comorbid mental disorders and substance
use disorders: Epidemiology, prevention and treatment, National Drug and
Alcohol Research Centre, University of New South Wales, Sydney, Australia.
Teesson M, Hodder T, Buhrich N 2000, ‘Substance use disorders among homeless
people in inner Sydney, Social Psychiatry and Psychiatric Epidemiology, vol.
35, pp.451–56.
—— 2004, ‘Psychiatric disorders in homeless men and women in inner Sydney’,
Australian and New Zealand Journal of Psychiatry, vol. 38, pp.162–68.
Thurston, S, Paul, L, Ye, C, Loney, P, Browne, D, Browne, G, Wong, M, Thabane, L,
& Rosenbaum, P 2010, ‘System integration and its influence on the quality of
life of children with complex needs, International Journal of Pediatrics, 2010.
Weiss, E, Miller, R & Lasker, R 2002, ‘Making the most of collaboration: Exploring the
relationship between synergy and partnership functioning’, Health Education
and Behaviour, vol. 29, pp.683–98.
Williams, P & Sullivan, H 2009, ‘Faces of integration’, International Journal of
Integrated Care, vol. 9, pp.1–13.
Ye, C, Browne, G, Grdisa, VS, Beyene, J & Thabane, L 2012, ‘Measuring the degree
of integration for an integrated service network’, International Journal of
Integrated Care, vol. 12, no. 5.

102
APPENDIX 1: CASE STUDIES
These case studies are examples of how good integration works in practice. Although
they may look very different to each other in terms of structure and function, they are
similar with respect to the attributes that enable integration. For example, they all have
an ability to move clients through their service in a streamlined manner and this is not
always dependent on having a single entry point into the service. Only two of the case
studies have this type of set-up. All of them, however, are able to capture clients
entering through a number of referral pathways (both internal and external) and move
clients through their service and the broader service system by taking a facilitated
referral approach. Facilitated referrals means the staff member provides whatever
assistance is required to get the client into the services they need—for example, by
making the telephone call with the client or walking them over to another part of the
service or attending the initial appointment with the client. This is predominantly
dependent on client need, but is also driven by an approach to dealing with others that
emphasises care and compassion. Facilitated referrals are also heavily dependent on
collaborative relationships (both formal and informal) and good communication.
Another common element across these case studies is the support and leadership of
management. This is critical in allowing staff to cross role and service boundaries so
they can be responsive to client need. As mentioned previously in this report, one of
the biggest barriers to integration is the distinct professional roles across the sectors
that create the silos and the gaps in the service system. A sympathetic and supportive
management team provides staff with the flexibility to be creative about the way they
deliver their services; they also trust their staff to make decisions about patient care
and manage their time accordingly.

103
A1.1 Homelessness Case Study (NSW): the Haymarket Foundation
The Haymarket Foundation is a specialist homelessness service in inner Sydney,
NSW. The case study involved the entire agency, including six services and a
capacity-building program. Figure A1 shows the organisation of services within the
Haymarket Foundation. The first three services are provided from the Chippendale
site; the remaining services/programs are provided from the East Sydney site.
Additionally, the Bourke Street Project has two transitional housing properties in East
Sydney. Key features of integration practice at the Haymarket Foundation are shown
in Table A1.
Table A1: Ingredients of integration: the Haymarket Foundation
Streamlined assessments
There are multiple entry points with each service responsible for their own assessments; this is in part due to the different target populations for the different services/programs.
Facilitated referrals
Facilitated referrals were evident across all clinical services, including transporting clients to appointments (including those for other Haymarket services); MOU with external agencies (e.g. local mental health team); and attending initial appointments with clients (including undertaking co-assessments). Additionally, a number of clinics are held on-site at the Haymarket Centre (e.g. Centrelink, primary health care, AOD group counselling).
Case review and supervision
Case review meetings are held within services. Additionally, clinical supervision of case management staff is provided by the Clinical Psychologist (AOD Counselling Service) and this improves mental health awareness/understanding among case management staff.
Flexibility and support
Management support staff to work outside their professional remit to meet the needs of clients.
Relationships and communication
Strong relationships are evident between Haymarket services/programs and this facilitates referrals. Strong relationships have also been developed with local GPs, local mental health teams, community health teams, and other homelessness agencies.
Staffing
Low staff turnover and retention of experienced staff were highlighted by participants. Additionally, all staff participated in co-morbidity capacity training.
Model integrity
The physical location of services across the two sites was rarely problematic, possibly facilitated by the availability of work vehicles. The different services shared similar values regarding the approach to working with clients and this was strongly linked to the leadership provided by management.

104
Figure A1: The Haymarket Foundation (2009)
Haymarket Centre
• Temporary accommodation service, including crisis beds, short-medium-term beds, and AOD stabilisation beds
Homelessness Intervention Project
• Intensive case management for clients with complex needs in partnership with other agencies
AOD/HIV Integrated Care
• Intensive case managemetnt for clients with HIV/AIDS, substance use disorder & one other complex need; in partnership with other agencies
Bourke Street Project
• Transitional housing (9-12 months) for clients leaving an AOD detox or rehab service
Alcohol & Other Drugs Counselling
Service
• Individual & group counselling
Primary Health Care
• Medical and nursing
• Needle & syringe program
EAST SYDNEY SITE CHIPPENDALE SITE
St Vincent’s
Hospital
Mental Health
Service Homelessness Intervention Project
(co-located team; provide advice to HIT re services available; address system barriers)
DoCS rep
Housing rep
Health rep
Homelessness Intervention Team
(2 teams of 3 case managers; weekly case review meetings)
Haymarket Foundation
Mission Australia
Case management model
(10 clients per team; 12 months duration; annual intake of new clients)
1. House 2. Stabilise
• Case management:
• HIV/AIDS
• general
• Physical health needs
• AIDS dementia complex
• Initial stabilisation
• Case management
• housing and drug & alcohol
• Entry point into model
• Needs assessment
ADAHPS Haymarket Foundation
Bobby Goldsmith Foundation
HIV Community
Team

105
A1.2 Health Case Study (VIC): Moreland Hall
Moreland Hall is a drug and alcohol treatment and education service provider in the northern
metropolitan region of Melbourne, Victoria. The case study focused on the Clinical Services
stream, the structure of which is represented in Figure A2. Clinical Services are delivered across
two physical locations (not including the satellite sites of outreach services, which are shaded
grey in Figure A2). Key features of integration practice at Moreland Hall are shown in Table A2.
Table A2: Ingredients of integration: Moreland Hall
Streamlined assessments
There is a single entry point into Moreland Hall Clinical Services. This is achieved by creating a separate service that focuses specifically on assessment and the development of an individualised treatment plan. This assessment follows the client through all internal referrals to Clinical Services and is updated as required as the client moves through the individual services.
Facilitated referrals
Facilitated referrals were evident across all clinical services, including walking clients between services to show them the facility and introduce them to the staff; assertive referral of clients back to the referring agency at the episode of care; and attending initial appointments with clients.
Case review and supervision
Case review meetings are held daily to discuss new assessments; these meetings are open to all staff. Weekly clinical review meetings are attended by a consultant from the Substance Use Mental Illness Treatment Team (SUMITT). Secondary consultation was sometimes formalised, e.g. Family Inclusive Practice via Family Counsellor. Additionally, there are two supervision groups that meet monthly; staff are randomly allocated to these groups (i.e. they are not team-based).
Flexibility and support
Management support staff to work outside their professional remit to meet the needs of clients. Management also support the implementation of projects initiated by staff (operational and management staff)
Relationships and communication
Informal relationships among the different service staff were prominent, including staff engaging in co-therapy with other clinical services.
Staffing
Low staff turnover and retention of experienced staff were highlighted by participants. Additionally, all staff participated in dual diagnosis capacity training.
Model integrity
The physical location of services across two sites was sometimes challenging for services wanting to facilitate referrals across sites. The different services shared similar values regarding the approach to working with clients and this was strongly linked to the leadership provided by management. The majority of services were delivered on-site with the exception of some outreach programs (e.g. prison contracts).
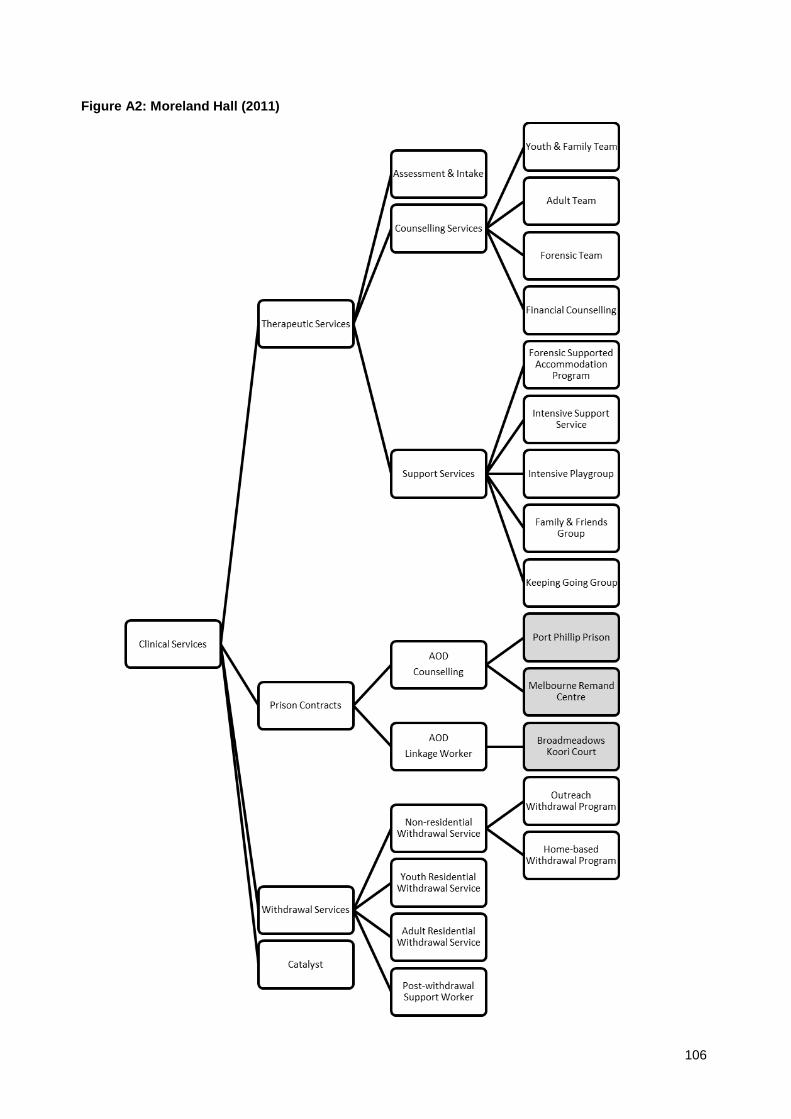
106
Figure A2: Moreland Hall (2011)

107
A1.3 Health Case Study (NSW): the Homeless Health Service
The Homeless Health Service is a department of St Vincent’s Hospital in Sydney. It is co-located
with the departments of Community Health, Mental Health and Drug and Alcohol under the
umbrella of Inner City Health (see Figure A3). Key features of integration practice at Homeless
Health are shown in Table A3.
Table A3: Ingredients of integration: the Homeless Health Service
Streamlined assessments
Single entry point through the Assessment and Coordination Team acts as a one-stop shop for all enquiries from the public, community organisations, other departments within the hospital and homeless persons themselves. Provides an avenue into mainstream health care for the homeless.
Additionally, Way2Home conducts joint intake with the two external partner agencies.
Facilitated referrals
Strong emphasis on walking a client through the hospital system by attending appointments with the client or introducing clients to hospital staff prior to surgery. This approach essentially provides a client with their own care coordinator or health ‘case manager’; a familiar face throughout the hospital system and someone that they trust.
Case review and supervision
Homeless Health Service has a weekly case review meeting which is also attended by staff from the other services within Inner City Health (e.g. drug and alcohol). Additional, ad hoc clinical review meetings involving staff from all services involved in a client’s care are held as needed. Homeless Health staff also attend ward rounds.
Flexibility and support
The homeless health services creates flexibility in an otherwise highly controlled system; for example, negotiating extended stays in the drug and alcohol detoxification unit or the ED, or keeping staff from different departments engaged in a client’s care despite repeated failures to attend scheduled appointments or inability to contact clients.
Relationships and communication
Co-location enables informal conversations to take place between Homeless Health and the three other services that make up the Inner City Health Service. Outreach staff can remotely log into the patient database and access, for example, mental health notes so that opportunistic health contacts with homeless clients can be maximised. This avoids escalation e.g. police becoming involved in enforcing requirements of community treatment orders. Regular meetings between the managers of the four services in Inner City Health (homeless health, community health, drug and alcohol, mental health) which focus on the structures and processes that maintain integration.
Staffing
The service was purposely developed with integration in mind hence staff were recruited with the expectation that outreach and other integration strategies would be a key component of their role.
Model integrity
Co-location facilitates knowledge sharing and a multi-disciplinary team approach to patient care. The single patient record also enabled continuity of care between the inpatient, community and outreach forms of service provision. Focus on integration within the health system (i.e. between hospital departments) as well as between the health system and specialist homelessness services.

108
Figure A3: Homelessness Health Service, St Vincent’s Health Network (2011)
Inner City Health Service
Community Health
Homeless Health
Assessment & Coordination
Team
ED Coordinated Exit Planner
Psychiatry Outreach
Team Way2Home
Mental Health
Drug & Alcohol
Emergency Department
Hospital Wards
Wayside Chapel
Norman Andrews
Vincentian Lodge
The Station
Neami Aboriginal Outreach
Camperdown Project

109
APPENDIX 2: CONGRUENCE AND RECIPROCITY
A2.1 Congruence
The following graphs present the difference between the observed and expected depth of integration scores within each individual service in
the Perth and Melbourne networks (group-reported congruence). A shorter bar indicates greater agreement. For both networks, the level of
expected integration is consistently higher than the level of observed integration.

110

111
A2.2 Reciprocity
The following graphs display the difference between each individual service’s self-reported depth of integration score and the group-reported
depth of integration score (observed and expected reciprocity), for the Perth and Melbourne networks.

112

113

114

AHURI Research Centres
AHURI Research Centre—Curtin University
AHURI Research Centre—Monash University
AHURI Research Centre—RMIT University
AHURI Research Centre—Swinburne University of Technology
AHURI Research Centre—University of New South Wales
AHURI Research Centre—University of Queensland
AHURI Research Centre—University of Tasmania
AHURI Research Centre—University of Western Australia
AHURI Research Centre—University of Western Sydney
Australian Housing and Urban Research Institute
Level 1, 114 Flinders Street, Melbourne Victoria 3000
Phone +61 3 9660 2300 Fax +61 3 9663 5488
Email [email protected] Web www.ahuri.edu.au


![Homelessness and Mental Health[4]€¦ · Homelessness and Mental Health: Psycho-social Factors Relating to Homelessness in Canada Ruwan M Jayatunge Housing is a basic human right](https://img.dokumen.tips/doc/110x75/5f054dbb7e708231d4124c1b/homelessness-and-mental-health4-homelessness-and-mental-health-psycho-social.jpg)