Embed Size (px)
Citation preview

annual report 2014
how I became...

annual report 2014 − Randstad Holding nv
overview
2014 at a glance 2
Message from the CEO 6
Profile 10
Our business environment 14Structural growth drivers 14Agency Work Directive 17Legislative differences 17
value proposition & strategy
How we create value 22
Strategic priorities and targets 24
Sustainability framework 28
Value for our clients and candidates 30Our value for clients 30Our value for candidates 31Our strategy: strong concepts 32Our strategy: excellent execution 36Our strategy: superior brands 38Engaging with our clients and candidates 38
Value for our employees 44Our strategy: best people 44Making strong concepts work 44Recruiting the best people 44Developing the best people 45Retaining the best people 47A healthy and safe environment 48Diversity and inclusion 49
Value for society 52Our role in society 52Stakeholder dialogue 52Industry involvement 53Partnerships and social involvement 54
Sustainability basics 56
performance
Introduction 63
Financial performance 66
Country performance 73
Performance by revenue category 81
Investor relations & share performance 83Investor relations 83Capital structure 83Share performance 85
Risk & opportunity management 87Risk profile 87Risk & Control management approach 87Risk appetite 88Risk & Control framework 88Our main risks 91Conclusions 94
governance
Executive Board 96
Supervisory Board 98
Report of the Supervisory Board 100Composition, diversity and independence 100Induction, training and performance assessment 101Supervisory and advisory activities in 2014 101Supervisory Board Committee activities in 2014 103Supervisory Board remuneration 105Report of the Annual General Meeting of Shareholders 106Financial statements for 2014 106
Remuneration report 107Remuneration policy 107Executive Board remuneration 2014 and 2015 107Supervisory Board remuneration 2014 and 2015 110
Corporate governance 111Principles 111Executive Board 111Supervisory Board 111Annual General Meeting of Shareholders 113Exceptions to the code 114Legal transparency obligations 114
financial statements 117
supplementary information
Summary quarterly income statement 2014 176Summary quarterly statement of cash flows 2014 177Ten years of Randstad 178Glossary 180VSO partnership at a glance 185Sustainability and industry memberships and partnerships 186Certifications, rankings, and awards 187Financial calendar 190
how I became
How I became - introduction 9How I became - clients 26How I became - candidates 43How I became - employees 51How I became - society 61
The following sections are considered to be part of the Executive Board report: overview, value proposition & strategy, performance, Executive Board,remuneration report and corporate governance.
contents

1
2 2014 at a glance
4 Key figures
5 Core data
6 Message from the CEO
10 Profile
14 Our business environment
20 Safe harbor statement
overview

2
annual report 2014 − Randstad Holding nv
JanuaryRevenue of Randstad China in January grewby 100% year-on-year.
FebruaryWith an outstanding track record, BenNoteboom hands over leadership to Randstadveteran Jacques van den Broek.
MarchSet up to explore innovative HR technologies,Randstad Innovation Fund makes its firstinvestment in Gigwalk.
AprilAt the AGM, Chris Heutink is appointed to theExecutive Board, responsible for alloperations in the Netherlands.
MayBMW wins the first Global Randstad Award asthe most attractive employer worldwide.
June72% of employees see temp work as astepping stone to a permanent job (RandstadWorkmonitor).
2014 at a glance
3
annual report 2014 − Randstad Holding nv
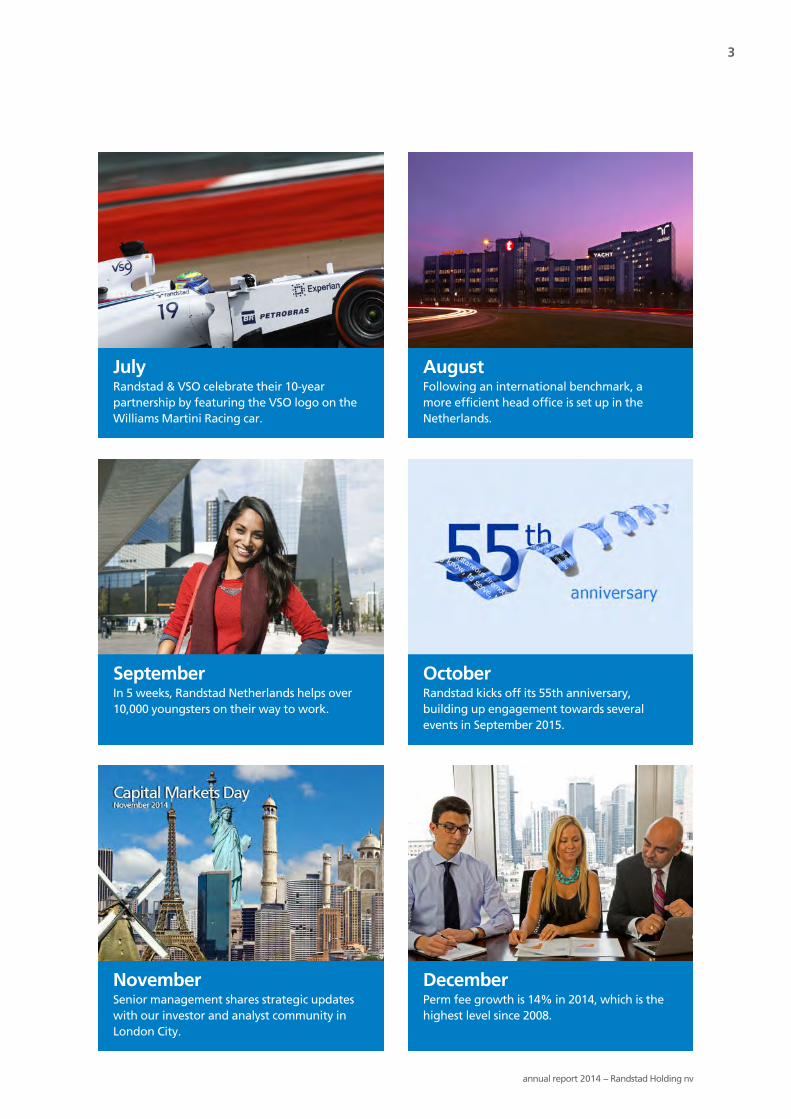
JulyRandstad & VSO celebrate their 10-yearpartnership by featuring the VSO logo on theWilliams Martini Racing car.
AugustFollowing an international benchmark, amore efficient head office is set up in theNetherlands.
SeptemberIn 5 weeks, Randstad Netherlands helps over10,000 youngsters on their way to work.
OctoberRandstad kicks off its 55th anniversary,building up engagement towards severalevents in September 2015.
NovemberSenior management shares strategic updateswith our investor and analyst community inLondon City.
DecemberPerm fee growth is 14% in 2014, which is thehighest level since 2008.

4
annual report 2014 − Randstad Holding nv
Revenue in € million
17,249.8 66
Underlying EBITAmargin (%)
4.1 69
Adjusted net incomein € million
459.9 70
Free cash flow in€ million
487.7 72
Leverage ratio
0.5 71
Proposed dividendper ordinary share(€)
1.29 85
Net Promotor Score(no. of countrieswith Top-3positions)
10 38
Average number ofcandidates
580,300 73
Employeeengagement(on a 10-point scale)
7.6 48
% women in seniormanagement
45.2 49
Number of VSOvolunteer hours
10,300 54
Number ofemployees trained inbusiness principles
8,500 56
key figures

5
annual report 2014 − Randstad Holding nv
in millions of €, unless otherwise indicated 2014 2013 Δ%
Key financials
Underlying 1
Revenue 17,249.8 16,568.3 4
Gross profit 3,180.0 3,011.6 6
EBITA 2 706.0 578.8 22
Actual
Revenue 17,249.8 16,568.3 4
Gross profit 3,177.6 3,010.0 6
EBITA2 660.7 529.7 25
Net income 340.1 230.7 47
Free cash flow 3 487.7 292.9 67
Net debt 4 422.0 761.0 (45)
Shareholders' equity 3,313.1 2,907.8 14
Ratios (in % of revenue)
Underlying1
Gross margin 18.4 18.2
EBITA margin 4.1 3.5
Actual
Gross margin 18.4 18.2
EBITA margin 3.8 3.2
Net income margin 2.0 1.4
Share data
Basic earnings per ordinary share (in €) 1.83 1.25 46
Diluted earnings per ordinary share (in €) 5 2.54 2.07 23
Dividend per ordinary share (in €) 1.29 0.95 36
Payout per ordinary share (in %) 6 50 45 11
Closing price, year-end (in €) 40.06 47.15 (15)
Market capitalization, year-end 7,215.2 8,366.0 (14)
Enterprise value, year-end 7 7,637.2 9,127.0 (16)
Employees/outlets
Average number of candidates 580,300 567,700 2
Average number of corporate employees 28,720 28,030 2
Number of branches, year-end 8 2,816 3,161 (11)
Number of Inhouse locations, year-end8 1,595 1,426 121 Underlying: actual gross profit and EBITA adjusted for one-offs, such as restructuring, integration costs, and acquisition-related expenses.2 EBITA: operating profit before amortization and impairment of acquisition-related intangible assets and goodwill, and badwill.3 Free cash flow is the sum of net cash from operating and investing activities, excluding the acquisition and disposal of subsidiaries and associates.4 Net debt: cash and cash equivalents minus borrowings.5 Before amortization and impairment of acquisition-related intangible assets and goodwill, badwill, integration costs, and one-offs.6 Payout per ordinary share in %: dividend per ordinary share on basic earnings per ordinary share adjusted for the net effect of amortization and impairment of acquisition-
related intangible assets and goodwill, badwill, integration costs, and one-offs.7 Enterprise value: the total of market capitalization and net debt.8 Branches are outlets from which various clients are served with a various number of services and which are located in residential/commercial areas. Inhouse locations are outlets
from which one client is served with a limited number of job profiles and which are located on the site of the client.
core data
6
message fromthe CEO

7
annual report 2014 − Randstad Holding nv
Dear Stakeholder,
Since I joined Randstad as a branch manager in 1988, the scaleat which we operate has increased dramatically, and theworld has become a much faster-paced place. Today, we findjobs for 2 million people annually, in 39 countries across theglobe.
However, in essence, the activities of a Randstad consultantare not all that different than they were 27 years ago, when Istarted. Technology had then − and still has now − a majorimpact on our service offering, as well as on the way we workand engage with our stakeholders. But still, helping clientsfind the best people to enable them to reach company goals,and propelling the careers of candidates, is just as rewardingnow as it was in 1988, when I made my first placement.
Despite divergent trends in 2014, our revenue increased 4%,and EBITA was up 23% organically, with an EBITA marginimprovement to 4.1%. We reported accelerated growth in theUS, where Staffing in particular saw good take-up throughoutthe year. In Europe, our business improved, though thepicture was mixed, with many of our major markets impactedby a lack of economic growth. At the same time, we sawexponential growth in our emerging markets. A goodexample is China, where we grew 60%, improved ourproductivity, and now employ a workforce of more than 500employees.
Our global focus in 2014 was on improving the productivityand sales effectiveness of our existing operations, by usingwhat we call activity-based field steering (ABFS). The results sofar look satisfactory, but we can still see plenty of room forimprovement, especially in the service we provide to SMEclients.
We also see many opportunities for growth. Our MSP andRPO offering, for instance, delivered double-digit growth in2014. And permanent placements, which is one of ourstrategic priorities, showed an increase of 14% in the numberof placements. These business lines, together with ourProfessionals offering, provide solid structural growthalongside our Staffing business. With Total Talent Architecture(TTA), which is our consultative approach towards largeclients, we aim to increase our presence in higher-value-addedservices (such as Professionals and permanent placements).
We continue to adapt our organization to changing marketcircumstances. Having aligned our head and back offices inBelgium, Spain, and Italy in 2013, this year we presented theresults of a global back offices/support staff benchmarkingstudy. The aim is to bring our cost levels down by € 60−70million in 2015/16. Our Dutch operations will be a keycontributor to this target (€ 20−23 million). Here we created anew organization at the end of 2014, with one integratedmanagement team for all business lines, and a streamlinedsupport and back office structure. These developments havehad a major impact on our Dutch head office staff, and I want
to thank everyone for their patience and dedication duringthis time.
One of the company's highlights this year was the launch ofthe Randstad Innovation Fund (RIF). RIF invests in innovativecompanies that will support Randstad in shaping the world ofwork. The mission of the Fund is to contribute to corporatetechnology innovation in order to deliver client value andaccelerate corporate growth.
As one of the pioneers in HR services, we believe we have theobligation to influence and improve the world of work. Weknow better than anyone the challenges one can face whendealing with HR-related issues. We are in the best position tobring solutions to the table that will make the world of workbetter regulated, more efficient, and more sustainable, withmore opportunities for everyone involved − not only in the
Revenue
2014
2013
2012
2011
∆%
4
(3)
5
1416,224.9
17,086.8
17,249.8
in millions of €
16,568.3
Gross profit, underlying
2014
2013
2012
2011
Margin
18.4%
18.2%
18.2%
18.2%
2,957.1
3,102.0
3,011.6
3,180.0
in millions of €
EBITA, underlying
2014
2013
2012
2011
Margin
4.1%
3.5%
3.3%
3.7%600.6
562.9
578.8
706.0
in millions of €
Net debt
2014
2013
2012
2011
Leverage ratio
0.5
1.2
1.7
1.81,302.6
1,095.7
761.0
422.0
in millions of €

8
annual report 2014 − Randstad Holding nv
markets in which we operate, but also by extending ourknowledge to partners such as VSO, who place professionalsin developing countries. We are proud to mention that, in2014, we celebrated the 10th anniversary of our partnershipwith VSO. The celebrations culminated in a field trip to Nepalin November. Several Randstad employees learned first-handwhat we can contribute to and learn from communities invarious stages of development.
Our financial position was further enhanced, as witnessed by adrop in the leverage ratio from 1.2 to 0.5. For 2014, wepropose a dividend of € 1.29 per ordinary share (2013: € 0.95),representing a payout of 50% (2013: 45%). Shareholders willagain be able to choose to be paid in shares or cash.
Looking back on 2014, I want to thank all our clients,candidates, and other stakeholders, as well as ourshareholders, for the continued trust they placed in us in 2014,and for the often longstanding relationships we have withthem. I want to express my thanks and gratitude in particularto all our corporate staff worldwide, as they are what makesRandstad such a unique and great company. Lastly, I wouldlike to thank my predecessor Ben Noteboom for hisoutstanding contribution to Randstad, especially in his 11years as CEO, handing over a company that is in excellentshape to face any future challenges with confidence. I amlooking forward to 2015, which will mark our 55thanniversary. I trust we will be able to further improve as acompany, finding more jobs for more candidates, and helpingour clients to become even more successful.
Good to know you,
Jacques van den Broek
message from the CEO

9
'We present fourviews on how wehelp people andcompanies tobecome the bestthey can be.'
When we look at the worldaround us, one question thatoften comes to mind is howsomeone or something got towhere they are today. Thisannual report will tell youhow we got to where we aretoday as a company. But thereis more to our story than that.We have grown into one ofthe most influential globalfirms in the world of work.And work is a definingelement in society as a whole.It touches everything. So infour brief sketches, we wouldlike to invite you to reflect fora moment on how we helppeople and companies tobecome the best they can be.
These views come from theperspectives of our ownemployees, our clients, ourcandidates, and finally, societyand our investors.
We hope you will be asinspired as we are!
how I became

10
annual report 2014 − Randstad Holding nv
Who we are
Randstad specializes in solutions in the field of flexible workand HR services. We are a sparring partner on total workforcemanagement. Our services include regular temporary staffingand permanent placement of candidates. Through our uniqueInhouse Services concept, we also offer dedicated on-siteworkforce management. In addition, we provide many otherHR solutions, such as Recruitment Process Outsourcing (RPO),Managed Services Programs (MSP), payroll services andoutplacement. We take the lead in shaping the world ofwork, by matching people with companies that will help themdevelop their potential, and matching companies with peoplewho will work to develop their business.
Founded in 1960 in the Netherlands, Randstad is a globalleader in HR services. In 2014, Randstad generated revenue of€ 17.2 billion, employing 28,720 corporate employees workingin over 4,400 branches and Inhouse locations in 39 countries.On average, we employed almost 600,000 candidates per dayin temporary jobs, while we placed over 100,000 candidates inpermanent positions. This means that we find jobs for about 2million people annually.
Our core values and culture
We continue to adhere to and live by five core values,established in the company's early days: to know, to serve, totrust, striving for perfection, and simultaneous promotion ofall interests. Our values shape our culture, and help us tobetter serve our stakeholders.
We can only promote the interests of all our stakeholders ifwe know them well. Our thorough knowledge of them andour business experience enables us to serve them better. Ourengagement with our stakeholders and the service weprovide them builds mutual trust. This trust is enhanced bycontinuously striving for perfection and simultaneouslypromoting the interests of all our stakeholders and society asa whole. We believe that this creates an essential foundationfor our business.
The values we share serve as a compass for everyone atRandstad, guiding our behavior and representing thefoundation of our culture. Our continuing success, and ourreputation for integrity, service and professionalism, are basedon these values.
'Good to know you'Our shared culture, expressed through our behavior, is a clearindicator of the way we live our values. At Randstad, webelieve that creating the best solutions in HR services meansalways doing more, going further. This starts withcontinuously deepening our understanding of theenvironment and marketplace in which we operate. We needto understand the present and future needs of our clients,candidates, shareholders and other stakeholders. Manycompanies say that their people are their most importantasset. As we are in the people business and one of the world'sbiggest employers, we could not agree more. As successdepends largely on the people you employ, it also depends onthe people you employ to find them. The better we know ourclients and candidates and the better our rapport with them,the better we are at matching their needs and exceeding theirexpectations. They should experience us as friendly and open,as well as professional and driven. After 54 years, 'Good toknow you' continues to represent the Randstad culture – whatwe stand for, and how we behave. It invokes our core valuesof to know, serve and trust.
Our core valuesTo knowWe are experts. We know our clients, their companies, ourcandidates and our business. In our business it is often thedetails that count.
To serveWe succeed through a spirit of excellent service,exceeding the core requirements of our industry.
To trustWe are respectful. We value our relationships and treatpeople well.
Striving for perfectionWe always seek to improve and innovate. We are here todelight our clients and candidates in everything we do.This gives us the edge.
Simultaneous promotion of all interestsWe see the bigger picture, and take our socialresponsibility seriously. Our business must always benefitsociety as a whole.
As one of the global leaders in HR services, Randstad provides jobsfor about 2 million people annually
profileprofile

11
annual report 2014 − Randstad Holding nv
What we do
By helping candidates find suitable careers, and by findingemployers the people who best fit into their organization, wecreate value for society as a whole. It is our ambition to be anemployer of choice, and attract, retain and develop the bestpeople, who will in turn provide our clients with excellentservice. We ensure first-class service delivery by using bestpractices and proven standardized business models across ourinternational network. We contribute to a better society byleveraging the experience and expertise in the labor marketwe have gained over 54 years. As such, we help to maximizefuture employment and economic growth.
Our service concepts
Staffing
In Staffing, our largest business, we focus on recruiting candidates with a secondary education or equivalent. The conceptcovers temporary staffing and permanent placements.
Professionals
For middle and senior management positions, we recruit supervisors, managers, professionals, interim specialists andconsultants with an academic or equivalent qualification from a wide range of disciplines. These include engineering, IT,finance, healthcare and other disciplines, such as HR, education, legal affairs, and marketing & communications. This conceptcovers both temporary and permanent placements.
Inhouse Services
Inhouse Services is a unique solution for managing a highly efficient workforce with specific skill sets for which there is afluctuating level of demand. It is aimed at improving clients’ labor flexibility, retention, productivity, and efficiency. ForInhouse Services clients, we work on-site, exclusively for them, providing a large number of candidates. We frequently workwith the client to determine specific performance criteria, and provide total HR management, including recruitment andselection, training, planning, retention, and management reporting.
HR Solutions
Through HR Solutions, we provide clients with a range of services, including Recruitment Process Outsourcing (RPO),Managed Services Programs (MSP), payroll services, and various other services, such as outplacement, outsourcing, andconsultancy. As a part of RPO, we take on primary responsibility for the recruitment and selection of a client's workforce. MSPis one of our key offerings, whereby we take on primary responsibility for the organization and management of a client'scontingent workforce. Our payroll services take over clients' administrative burden, so that they can focus on their corebusiness.

12
annual report 2014 − Randstad Holding nv
Germany- Revenue € 1,949.3 million- 2,610 corporate staff- 46,600 candidates- 555 outlets, of which 270 Inhouse locations
Belgium & Luxembourg- Revenue € 1,283.3 million- 1,750 corporate staff- 40,000 candidates- 310 outlets, of which 138 Inhouse locations
United Kingdom- Revenue € 821.7 million- 1,530 corporate staff- 17,200 candidates- 140 outlets, of which 51 Inhouse locations
North America - Revenue € 3,765.9 million- 6,220 corporate staff- 106,400 candidates- 1,084 outlets, of which 380 Inhouse locations
France- Revenue € 2,726.2 million- 3,390 corporate staff- 70,400 candidates- 741 outlets, of which 177 Inhouse locations
Netherlands- Revenue € 2,794.7 million- 4,350 corporate staff- 75,600 candidates- 689 outlets, of which 368 Inhouse locations
our global presence
We have the following alliances to expand our reach: Adcorp (several African countries), Ancor (Russia and Commonwealth of Independent States) and Barona (Finland).
profile

13
annual report 2014 − Randstad Holding nv
Iberia- Revenue € 1,086.1 million- 1,560 corporate staff- 58,100 candidates- 292 outlets, of which 76 Inhouse locationss
Other European countries- Revenue € 1,371.3 million- 2,450 corporate staff- 55,800 candidates- 391 outlets, of which 113 Inhouse locations
Rest of the world - Revenue € 1,451.3 million- 4,660 corporate staff- 110,200 candidates- 209 outlets, of which 22 Inhouse locations
our global presence
1%
9%
9%
9%
Geographic spread of Staffing revenue (incl. HR Solutions)
Staffing revenue: € 10,202.8 million
17%
19%
17%10%
9%
Geographic spread of Professionals revenue
Professionals revenue: € 3,424.5 million
16%
8%2%1%
40%
10%9%
11%
3%
Geographic spread of Inhouse Services revenue
Inhouse Services revenue: € 3,622.5 million
4%
7%
9%
5%
19%
12%
20%16%
8%
2014: Total revenue € 17,249.8 million
Split by geography
8%
6%
5%
8%
11%16%
16%
22%
8%
North America Germany Iberia
France Belgium & Luxembourg Other European countries
Netherlands United Kingdom Rest of the world

14
annual report 2014 − Randstad Holding nv
Introduction
Randstad operates in an industry with structural growthpotential. In this section, we explain the structural growthdrivers and legislative differences in our markets. Incombination, these form the foundations of our strategythrough which we create value for our stakeholders.
The world of work is constantly changing. HR servicesrepresent one of the world’s fastest-growing industries, with aglobal market size of about € 322 billion (up by an estimated4% compared to last year). In many major economies, staffingand other HR services are still in development. As one of theglobal leaders in HR services, we see it as our responsibility totake an active role in developing the industry in the longterm. Changing labor market trends and client needs,including an aging population, shifting surpluses andshortages, and increased flexibility, require the developmentof new solutions. By finding the right balance between thechanging needs of employers and employees, we will bringsupply and demand together.
€ 213 billion
€ 99 billion
€ 10 billion
Global HR services market 2014
Staffing Professionals Executive search
Source: Randstad estimates
The HR services industry is divided roughly into three mainsegments: staffing, professionals and executive search.Randstad is primarily active in the first two. The global staffingmarket is worth an estimated € 213 billion, and accounts foraround 53% of our revenue. Staffing focuses predominantlyon recruiting white-collar and blue-collar workers with at leastsecondary education or equivalent for temporary orpermanent placements. This segment also includes InhouseServices (21% of our revenue), which provides on-siteworkforce solutions, and HR Solutions (around 6% of ourrevenue). Through the latter, we offer other HR services, suchas Recruitment Process Outsourcing (RPO), Managed ServicesPrograms (MSP), payroll services, career transition services, andoutplacement. The global professionals market is wortharound € 99 billion, and accounts for around 20% of ourrevenue. This segment includes permanent and temporaryplacement of qualified professionals and candidates with a
university or equivalent education. Many candidates haveprevious work experience.
Structural growth drivers
Geographically, Randstad is active in countries representingover 90% of the global HR services market, and our strategyhas been designed to capitalize on the structural growth inthese markets. Randstad has defined four structural growthdrivers for our industry. These are a need for greater flexibilityand outsourcing, changing demographics, regulation, and anincreased demand among our clients for a total offering. Webelieve these structural growth drivers will define the HRservices market for decades to come. We have designed ourstrategy to anticipate and respond to these drivers,throughout economic cycles, as effectively and agilely aspossible.
Structural growth drivers
mid-term market
market 2014€ 322 billion
83%
Global market share 2014
AdeccoRandstad Manpower
5%6%
6%
Rest of the market
Source: Randstad estimates
our business environmentour business environment

15
annual report 2014 − Randstad Holding nv
Flexibility and outsourcingOne of the most important drivers of long-term structuralgrowth in our industry is the need for increased flexibilityamong our clients and our candidates. A more flexibleworkforce helps our clients improve their productivity andcompetitiveness. Moreover, outsourcing is a key driver for ourindustry, as clients increasingly focus on core activities andthey realize that outsourcing certain HR functions results inefficiency gains. We see that flexibility and outsourcingcontinue to rise on our clients' strategic agenda for the yearsahead. Clients need to take care of their long-term planning,while they are also required to adjust their workforce evenduring the course of a day. As a result, they are activelymanaging the flexible component of their workforce, alsodepending on the macroeconomic circumstances. There is alsoa growing demand for more flexibility among candidates, inline with a growing interest in working from home, self-employment, part-time work, and working alternative hours.
Some countries still maintain unjustified restrictions on flexiblework arrangements, and these will need to be reviewed andlifted. The recent economic crisis has shown that countrieswith unreformed labor markets that do not allow for enoughflexibility tend to have higher unemployment, lowerparticipation rates, and fewer new jobs, leading to a lowerrating on the World Economic Forum/WEF competitivenessindex. This in itself provides a strong case for reform, as thereis a clear correlation between labor market effectiveness andcompetitiveness.
The penetration rate, i.e., the number of temporary workersas a percentage of a total labor force, is an importantindicator of the structural growth of our industry. The graph'Staffing penetration rates' shows the growth trend for thelargest markets. As we strive to improve global employmentparticipation, we use the development of penetration rates toreport on our performance in this area. Penetration rate is ametric that we have identified as an employment-market KPIin our sustainability framework.
Penetration rates are usually higher in mature markets, wherestaffing has long been a reputable solution for flexibility inthe workplace. Growth in such markets is achieved in differentways, because they are ready for differentiated propositions instaffing and professionals, as well as additional added-valueservices, such as outplacement, RPO, and MSP.
DemographicsA number of academic studies commissioned by Randstad andcarried out by SEO Economic Research ('The Gap' series2007-2012) reveal that aging and declining population growthis set to lead to an enormous potential shortage of peoplewith vital skills in most developed countries. In addition, thereis a growing mismatch between the qualifications and skills ofworkers and the rapidly evolving demands of the labormarket. The study 'Into the Gap' suggests that in 2020, both inthe EU and the US, there will be a surplus of medium-skilledworkers, a substantial shortage of highly skilled workers, and
a steady demand for those with elementary skills. Thisdevelopment is often characterized as the 'squeezed middle'.At the same time, labor market demands are also changing,driven by the continuous development of technology. This iscreating new jobs, while making others obsolete.
These studies predict that unless we can improve laborparticipation rates, education and training, productivity, andemployee mobility, the potential employment gap is set togrow beyond 35 million people by 2050 in the EU alone. Thecurrent economic environment in Europe and the consequentslowdown in the creation of new jobs will lead to fewer jobvacancies in the next decade. The long-term shortfall is still setto be dramatic, unless governments take action.
Clients are looking for a total offeringClients are not only looking for fewer suppliers of HR services;they are also looking for a broader range of HR services fromthe suppliers they use, ranging from temporary staffing andpermanent placements to outsourcing and managed services.We have noticed that an increasing number of our clients arelooking for a long-term customized talent strategy that coverstheir total workforce. This offers us a unique opportunity toengage our clients in a strategic discussion about their HRstrategy and how they may be able to further optimize theirentire workforce. We call this Total Talent Architecture.Randstad is well-positioned to provide total talent solutionsbased on our broad service offering and internationalcoverage, as well as on our labor market knowledge on globaland national level. In many cases, we can build on long-standing relationships with clients to whom we alreadyprovide part of our service offering.
5%
4%
3%
2%
1%
0%
2013
2012
2011
2010
2009
2008
2007
2006
2005
2004
2003
2002
2001
2000
1999
US
Germany JapanFrance
Belgium UKNetherlands
Staffing penetration rates
Source: Ciett - World of Work

16
annual report 2014 − Randstad Holding nv
We analyze future needs and developments from both themacro and the micro perspective. This is necessary to play aninfluential role in the regulating process. By applying ourpublic affairs and labor market knowledge, we translategeneral economic trends into labor market needs and issues.Following these analyses, we provide guidance to society on amacro level and to our clients on a micro level.
Many international clients are looking for global or multi-country solutions, and Randstad's Global Client Solutions team
leverages the Group's knowledge and capabilities across localmarkets to successfully meet this demand. We have dedicatedteams of specialists focusing on specific industries to provide afull range of service concepts in both established andemerging markets. Today, international clients generatearound 25% of our revenue.
RegulationAnother important driver of market growth is regulation. Ithas been proven that well-regulated markets that encouragetemporary employment recover more quickly from economicdownturns, and also have lower unemployment rates. Wesupport this move towards more balanced legislation, and tryto influence it in positive ways. It is important to stress thatRandstad is not looking for a system without rules, but ratherthat we would like to see the lifting of unjustified restrictionsin over-regulated markets. Obviously, we would also like tosee a fair and effective regulatory environment in marketswhere this has yet to be introduced. New opportunities arearising as an increasing number of governments arerecognizing the need for flexibility in their labor markets.
We believe the best way of finding the most appropriatebalance of regulations for our services is through constructivesocial dialogue. This is in line with our core value of'simultaneous promotion of all interests', which lies at theheart of our labor market relationships and stakeholderdialogue. Through proactive collaboration with governmentalauthorities, industry associations, unions, and others, we canhelp influence legislation and regulations in positive ways that
Strong talent shortage trend
Talent shortage trend
Low / no shortage trend
Talent gap trend2010-20 2020-30
Strong employability challenge
Medium employability challenge
Source: Boston Consulting Group Analysis
Note: Color codes based on compound annual growth rates of talent supply and demand by 2020 and 2030
Talent gaps by 2020 and beyond
our business environment

17
annual report 2014 − Randstad Holding nv
stimulate sustainable growth, employment, flexibility, andequal opportunities. We strongly believe that our businessmust always benefit society as a whole.
Randstad believes government authorities will have to takemeasures to encourage the creation of jobs and participationin the labor market. Key to this will be the stimulation of life-long learning and flexible labor contracts. Randstad could playa vital role as transition manager here, as we move to the nextstage in the evolution of labor markets. As an example, the'Flexibility@work 2014' study reported on the drivers ofundeclared (informal) work. It shows that in advancedeconomies, the size of the undeclared economy varies widely– from less than 10% in countries such as the US, the UK,Japan, and the Netherlands, to more than 25% in parts ofSouthern and Eastern Europe. Countries with a smallerundeclared economy are typically those in which it is easier forcompanies to resort to temporary employment to meet labordemands. At the same time, these countries also provide asocial safety net in the form of labor market policies thatprotect and support vulnerable groups of workers.Apparently, by creating the right environment − in whichtemporary work plays a significant role − these relativelysuccessful economies reduce the supply and demand ofundeclared work by providing both employers and workerswith better alternatives.
Agency Work Directive
In a labor market where flexibility and security are combined,it will be much easier to create more and better jobs, with afocus on the well-being and protection of workers, whocontribute to the best of their ability. This will lead to greaterworker commitment, which will, in turn, enhance productivityand economic growth. In order for businesses, and indeedeconomies, to remain innovative and competitive in today’senvironment, flexibility – and therefore flexible labor – will beimperative.
There is clearly a need for labor market policy to beapproached much more actively, with unjustified restrictionson temporary work being lifted and relevant interventionsstepped up. Governments, therefore, should be encouragedto create a mature system of social protection that not onlysupports workers who are ill or temporarily out of work, butalso encourages an accessible, well-regulated market fortemporary employment and temporary employmentagencies.
The EU Agency Work Directive (AWD) recognizes the positiverole of agency work and allows for greater flexibility, whichwe believe provides greater scope for further evolution. Theaim of the AWD is twofold: to identify and lift all unjustifiedand/or disporportionate restrictions on temporary agencywork, while also protecting the rights of temporary agencyworkers, including the right to equal treatment and equalpay.
The deadline for implementing the AWD was December 5,2011. In March 2014, the European Commission issued anapplication review on the transposition of the AWD, statingthat it had been correctly done by all Member States, and thatthere was no need for the Directive to be revised. However,the process of lifting unjustified restrictions in regulations andcollective labor agreements (CLAs) has by no means beencompleted. Eurociett has developed an action plan to addressthe remaining unjustified restrictions. Meanwhile,jurisprudence is in the making: a ruling of the European Courtof Justice is expected before summer 2015 regarding a Finnishcase dealing with the kinds of restrictions that could bejustified within the limits of the AWD. We are confident thatmore restrictions will be removed in the coming years.
One of the reasons for this confidence is that, over the pastdecade, governments, and notably European trade unions,have consistently shown greater awareness and acceptance ofthe benefits and added value of temporary agency work forthe labor market. They increasingly recognize the positivecontribution that the staffing industry makes to the labormarket − managing transitions, creating a stepping-stonefunction, contributing to job creation, and decreasing long-term unemployment and undeclared work.
An increasing number of countries are also accepting that awell-regulated market for agency work actually offerstemporary workers a great deal of protection, and reducesthe amount of undeclared work. In addition, they recognizethat HR service providers, such as Randstad, can play a positiverole in job creation, the protection of workers' rights, andoverall economic growth.
Legislative differences
We believe that regulation should aim at the right balancebetween labor market flexibility and employment security.More balanced regulation facilitates helping more people tofind work.
The global HR services industry is regulated by theInternational Labour Organization (ILO) Convention 181 andRecommendation 188. This Convention defines minimumstandards for staffing and recruitment, especially recognizingthe importance of flexibility in the functioning of labormarkets. Since the Convention was adopted in 1997, it has sofar been ratified by 28 countries worldwide, of which 14countries are in Europe. One new ratification took place in2014, and Ciett and ILO are promoting further ratifications.
There are major differences in the levels of legislation aroundthe globe. In mature staffing markets, temporary agency workis regulated, with the nature of the regulation varying fromlight to heavy. Nationally, staffing is regulated by generallabor law, supplemented by specific staffing regulationsregarding employment conditions and/or service provision.

18
annual report 2014 − Randstad Holding nv
This is complemented by collective labor agreements (CLAs)and industry self-regulation, such as codes of conduct.
From a legal and socio-economic perspective, our markets canbe clustered into four types with different characteristics (seetable 'Legislative differences'):1. Market-driven;2. Social-dialogue-based;3. Legislator-driven;4. Emerging markets.
Market-driven countries such as the US, the UK and Australia,as well as some of the social-dialogue-based countries, such asthe Netherlands and Japan, have the world's most liberalrecruitment and staffing markets in terms of legalenvironment.
We have drawn up an overview ('State of play on staffingregulation and trends') with the status of regulation and theregulatory trends in the main countries where Randstad isactive. Given our strong involvement in national andinternational employment institutions, we use this overviewto show our performance with regard to the employment-market KPI: contribution to the regulation/deregulation oflabor markets. For this year's overview, we used a neutral andobjective source: the OECD Employment Protection Legislation(EPL) for temporary agency work. The EPL for temporaryagency work shows the stringency of regulation fortemporary agency work in OECD and G20 countries. In theremainder of this section, we share more detailed informationon the recent developments and trends around regulation inthe different countries in which we operate.
Market-driven marketsDuring 2014, no major changes were noted in the Anglo-Saxon market-driven markets. However, it is worth notingthat in the US the 'Affordable Care Act' (ACA) came into forceat the start of 2015, mandating that everyone in the USmaintains health insurance coverage. While this does add tothe regulatory burden, we see this as a positive amendmentthat should lead to further acceptance of temporary agencywork.
Social-dialogue-based marketsFollowing the December 2014 elections in Japan, furtherpositive amendments to the 2012 Labor Dispatch Law will bediscussed by a new government. These amendments are likelyto lift restrictions on assignment length and could open up themarket for more job profiles. Randstad is closely involved inthe legislative process, which may lead to a more liberaloperating environment for staffing as from 2015-2016.
The 2012-2017 CLA for the staffing industry in theNetherlands stipulates that, as from April 2015, the equal-payprinciple will be introduced for temporary staff from the startof their assignment. However, derogation from the equal-payprinciple will apply to certain groups of people, primarilythose who are particularly difficult to place, as well astemporary staff with a permanent employment contract. Thecurrent Work and Security Act will be amended as from 2015.In combination with the current CLA, this new legislation willlead to an extended flexibility period from 3.5 years to 5.5years. Furthermore, the unions have clearly stated thattemporary agency work is their preferred form of externalflexibility.
Legislative differences
Market type Countries Cluster characteristics
Market-driven Europe UK - Rapid agency work (AW) development with appreciable drop-off in the crisis- Open regulatory environment with limited restrictions- Liberal economies favoring flexibility over security
Non-Europe US, Australia,
New Zealand
Social-dialogue-
based
Western Europe Netherlands,
Switzerland,
Austria, Germany
- Above-average AW penetration in relatively mature markets- Moderately regulated, varying balances of flexibility and security- Labor market organized and regulated by collective agreements between social
partnersNordics Sweden, Norway,
Denmark, Finland
- Historically low AW penetration and slow industry development- Unique Nordic social and economic system
Asia Japan - Generally liberal economies but high value placed on security and social acceptancechallenges
Legislator-driven Western Europe France, Belgium,
Luxembourg
- Penetration depending on level of industry development, ranging from below toabove average
- Highly regulated, weighted towards job security rather than flexibility- Historically labor markets with high unemployment relative to social-dialogue peers
Mediterranean Italy, Greece
Spain, Portugal
Emerging markets Europe Eastern Europe - Developing industries with AW legally recognized only recently- Regulatory policies still in development- Economic policies and market dynamics still evolving
Latin America Latin America
Asia India, China
our business environment
19
annual report 2014 − Randstad Holding nv
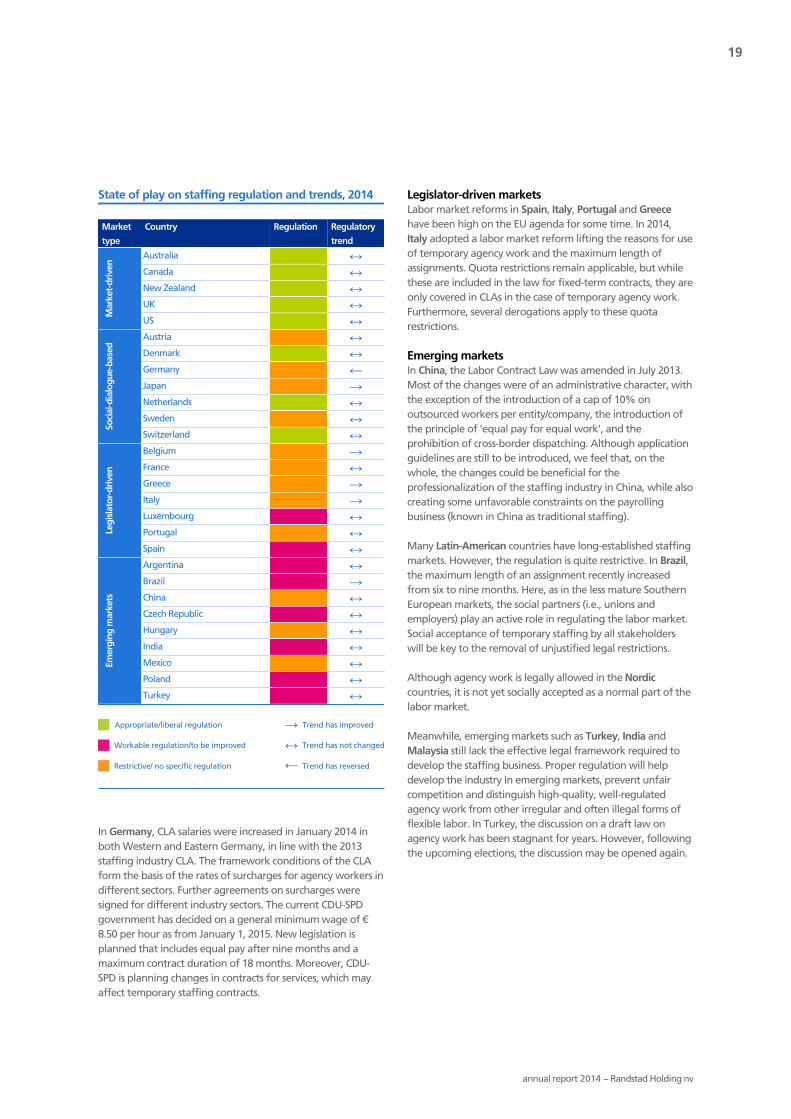
In Germany, CLA salaries were increased in January 2014 inboth Western and Eastern Germany, in line with the 2013staffing industry CLA. The framework conditions of the CLAform the basis of the rates of surcharges for agency workers indifferent sectors. Further agreements on surcharges weresigned for different industry sectors. The current CDU-SPDgovernment has decided on a general minimum wage of €8.50 per hour as from January 1, 2015. New legislation isplanned that includes equal pay after nine months and amaximum contract duration of 18 months. Moreover, CDU-SPD is planning changes in contracts for services, which mayaffect temporary staffing contracts.
Legislator-driven marketsLabor market reforms in Spain, Italy, Portugal and Greecehave been high on the EU agenda for some time. In 2014,Italy adopted a labor market reform lifting the reasons for useof temporary agency work and the maximum length ofassignments. Quota restrictions remain applicable, but whilethese are included in the law for fixed-term contracts, they areonly covered in CLAs in the case of temporary agency work.Furthermore, several derogations apply to these quotarestrictions.
Emerging marketsIn China, the Labor Contract Law was amended in July 2013.Most of the changes were of an administrative character, withthe exception of the introduction of a cap of 10% onoutsourced workers per entity/company, the introduction ofthe principle of 'equal pay for equal work', and theprohibition of cross-border dispatching. Although applicationguidelines are still to be introduced, we feel that, on thewhole, the changes could be beneficial for theprofessionalization of the staffing industry in China, while alsocreating some unfavorable constraints on the payrollingbusiness (known in China as traditional staffing).
Many Latin-American countries have long-established staffingmarkets. However, the regulation is quite restrictive. In Brazil,the maximum length of an assignment recently increasedfrom six to nine months. Here, as in the less mature SouthernEuropean markets, the social partners (i.e., unions andemployers) play an active role in regulating the labor market.Social acceptance of temporary staffing by all stakeholderswill be key to the removal of unjustified legal restrictions.
Although agency work is legally allowed in the Nordiccountries, it is not yet socially accepted as a normal part of thelabor market.
Meanwhile, emerging markets such as Turkey, India andMalaysia still lack the effective legal framework required todevelop the staffing business. Proper regulation will helpdevelop the industry in emerging markets, prevent unfaircompetition and distinguish high-quality, well-regulatedagency work from other irregular and often illegal forms offlexible labor. In Turkey, the discussion on a draft law onagency work has been stagnant for years. However, followingthe upcoming elections, the discussion may be opened again.
State of play on staffing regulation and trends, 2014
Market
type
Country Regulation Regulatory
trend
Mar
ket-
driv
en
Australia ↔Canada ↔New Zealand ↔UK ↔US ↔
Soci
al-d
ialo
gue-
base
d
Austria ↔Denmark ↔Germany ←Japan →Netherlands ↔Sweden ↔Switzerland ↔
Legi
slat
or-d
riven
Belgium →France ↔Greece →Italy →Luxembourg ↔Portugal ↔Spain ↔
Emer
ging
mar
kets
Argentina ↔Brazil →China ↔Czech Republic ↔Hungary ↔India ↔Mexico ↔Poland ↔Turkey ↔
Appropriate/liberal regulation Trend has improved
Workable regulation/to be improved Trend has not changed
Restrictive/ no specific regulation Trend has reversed

20
safe harborstatement
This annual report containsforward-looking statementson Randstad Holding nv’sfuture financial performance,results from operations, andgoals and strategy. Bydefinition, forward-lookingstatements generate risk anduncertainty because they referto events in the future anddepend on circumstances thatcannot be foreseen inadvance. Numerous factorscan contribute to materialdeviation from results anddevelopments indicated inforward-looking statements.
Such factors can includegeneral economiccircumstances, scarcity on thelabor market and the ensuingdemand for (flexible)personnel, changes in laborlegislation, personnel costs,future exchange and interestrates, changes in tax rates,future corporate mergers,acquisitions and divestments,and the speed of technicaldevelopments. You shouldnot place undue reliance onthese forward-lookingstatements. They are made atthe time of publication of
the annual financialstatements of the companyand in no way provideguarantees for futureperformance. All operatingand business environmentsare subject to risk anduncertainty. For this reason,we can offer no assurancesthat the forward-lookingstatements published here willprove correct at a future date,and the company assumes noduty to update any suchforward-looking statements.

21
22 How we create value
24 Strategic priorities and targets
27 Sustainability at Randstad
28 Sustainability framework
30 Value for our clients and candidates
44 Value for our employees
52 Value for society
56 Sustainability basics
value proposition& strategy

22
annual report 2014 − Randstad Holding nv
Introduction
Having as many people as possible in jobs is a good thing forsociety as a whole. It makes companies productive and itprovides people with a fulfilling life. It is our ambition to bean employer of choice ourselves, so that we can continue toattract the best people, who in turn will provide our clientswith the excellent execution they need. In this way, we cancontribute to a better society, leveraging the experience andexpertise we have gained over more than 50 years. As such,we help to maximize future employment and economicgrowth. On a daily basis, Randstad helps some 600,000 peopleto find work, with over 100,000 people placed into permanentpositions each year.
Since the introduction of our core values, we have aspired togrow sustainably, our aim being to safeguard the businessand its long-term viability, while taking the interests of allstakeholders into account, and making our businessincreasingly relevant to all parties involved. This aspiration isclearly reflected in our core value of 'simultaneous promotionof all interests'. As a result, we adhere to the integratedreporting guidelines for the structure of this annual report.
Helping more people to find work
#7
1994
#16
2004 2008
#39#53
2014
Average number of candidates (r.h.a.)Revenue (in millions of €)
20,000
17,500
15,000
12,500
10,000
7,500
5,000
2,500
0
1,000,000
900,000
800,000
700,000
600,000
500,000
400,000
300,000
200,000
100,000
0
Number of countries Randstad operates in#
Creating value through ourstrategy
Geographically, Randstad is active in countries representingover 90% of the global HR services market. As described in thesection ‘Our business environment’, in these geographies, weaim to capitalize on the structural growth drivers of ourindustry:- Flexibility and outsourcing;- Demographics;- Clients are looking for a total offering;- Regulation.
We believe that these structural growth drivers will define theHR services industry for decades to come. We have designedour strategy to anticipate and respond to these drivers,throughout economic cycles, as effectively and agilely aspossible. Our strategy to capture these growth opportunitiesconsists of four strategic building blocks, which correlate withthe structural growth drivers:- Strong concepts;- Best people;- Excellent execution;- Superior brands.
These strategic building blocks will be explained in moredetail in the following sections, where we describe how wecreate value for our stakeholders. The combination of ourstrategic building blocks will enable us to serve the interests ofour stakeholders and to create real and lasting value for all ofthem. Our four stakeholder groups are:- Clients;- Candidates;- Employees;- Society (including shareholders).
As helping people to find work is the key driver, it supportsthe role of Randstad towards society. The same objective alsodirectly translates into the company's financial ambitions. Thisconnection is a huge inspiration for our corporate employees.
The diagram 'Creating value through our strategy' shows howour strategic building blocks and our stakeholders relate toeach other.
In this annual report, we describe how Randstad adds value toeach of its stakeholders. We outline the strategy we have putin place to achieve our goals, and report relevant KPIs thatreflect our performance.
how we create value

23
annual report 2014 − Randstad Holding nv
financial targets
- EBITA margin of 5% to 6% over time, through revenue growth and mix improvement- continuous profitable market share gains
- sound financial position with a leverage ratio between 0 and 2
Our strategy
strategic building blocks
- strong concepts
- best people
- excellent execution
- superior brands
value for our stakeholdersstructural growth drivers
Randstad core values: to know, serve and trust, striving for perfection and the simultaneous promotion of all interests
optimal workforcesfor clients
the best jobs for candidates
expertise for a better society and shareholder return
the employer ofchoice for our employees
- flexibility & outsourcing
- demographics
- clients look for a total offering
- regulation
sustainability basics
strong concepts
we create and
manage a balanced
workforce by
connecting
candidates with
suitable employment
opportunities
we attract bright,
agile and adaptable
employees and
challenge them
to outperform
towards clients
and candidates
simultaneous promotion of all interests: we help to maximize future employment and economic growth
and we create shareholder value
best people excellent execution
we aim to be the
most attractive
employer for
our employees
our strong concepts
drive excellent
development
opportunities for
our employees
Creating value through our strategy
clients
employees
societyincluding shareholders
candidates
we use best practices
and proven procedures
to ensure candidate
engagement and first-
class service delivery
superior brands
we guarantee to our clients
that they will receive the
highest quality service and get
access to the best candidates
we are well-known for making
the best jobs available and
giving people the opportunity
to develop their talents
superior brands help us to
attract, recruit and retain
the best people
strategic building blocks
stakeh
old
ers
our high-performance
culture helps us to
recruit, retain and
develop the best people

24
annual report 2014 − Randstad Holding nv
Strategic priorities 2015-2016
In this section, we describe our strategic priorities and theroadmap that will enable us to capitalize on the structuralgrowth drivers in our markets. We have set the followingstrategic priorities, which will support us in realizing ourtargets:- Capture profitable growth opportunities;- Apply activity-based field steering to drive commercial
excellence and productivity to ensure adaptability;- Focus on segment-specific delivery, where necessary
modifying our delivery models for clients;- Further improve our business mix: Focus on SMEs,
Professionals and permanent placements;- Achieve an efficient cost structure and drive conversion of
gross profit into EBITA;- Maintain capital discipline: through a simplified EVA
method, operating companies are charged for their use ofoperating working capital.
To further guide this process, we have formulated thefollowing financial targets:- EBITA margin of 5% to 6% over time, through revenue
growth and mix improvement;- Continuous profitable market share gains;- A sound financial position with a leverage ratio between
0 and 2.
Our dividend policy remains unchanged from the oneintroduced in 2013: a payout ratio of 40%-50% of adjustedearnings per share. We aim at a payout ratio of 40%, unlessour financial position allows for a higher payout. We offershareholders a choice between shares and cash. For a further
elaboration on this topic please refer to the Investor relationssection.
We have defined five components that will enable us toachieve our financial strategic targets:
At the heart of our operations, we apply activity-based fieldsteering (ABFS) to drive commercial excellence. The ABFSmodel also enables us to easily adapt our organization tochanging market circumstances. We have been applying ourABFS model across all countries to guarantee the quality ofour execution. This is a continuous process, ensuring agility inour organization and driving productivity across the Group.The changing environment also requires us to take a morededicated client approach. By monitoring and analyzing theneeds of our clients, we ensure that we use the right deliverymodel. The solid progress we have booked with ABFS this yearis evidenced by the fact that activity levels are up some 30%compared to last year. See the section 'Our strategy: excellentexecution' for a more detailed explanation.
Our aim is to have an optimized organizational (Org) structurein place, with 'world league' people that drive a highperformance culture. This requires continued evaluation. Seethe section 'Value for our employees' for a further elaborationon our HR policy, which is a key ingredient of ourorganizational development.
With Total Talent Architecture (TTA), we aim to createquantifiable business impact by addressing the entireworkforce of our clients. TTA is our new consultative approachtowards our big clients (roughly 1,000 accounts). As a globalHR services provider, we are well-positioned, and we have alldelivery models in place to support our clients in their HR
Strategic roadmap driven by strategic building blocks
Today
ABFS
Org
TTA
Tech
M&A
Goals
financial targets
- EBITA margin of 5% to 6% over time, through revenue growth and mix improvement- continuous profitable market share gains
- sound financial position with a leverage ratio between 0 and 2
Our strategy
strategic building blocks
- strong concepts
- best people
- excellent execution
- superior brands
value for our stakeholdersstructural growth drivers
Randstad core values: to know, serve and trust, striving for perfection and the simultaneous promotion of all interests
optimal workforcesfor clients
the best jobs for candidates
expertise for a better society and shareholder return
the employer ofchoice for our employees
- flexibility & outsourcing
- demographics
- clients look for a total offering
- regulation
sustainability basics
strategic priorities and targetsstrategic priorities and targets

25
annual report 2014 − Randstad Holding nv
needs and challenges across all layers of their organization.Internally, TTA connects all our business lines, where we seeample opportunities to increase our presence in higher-value-added services (such as Professionals and permanentplacements). See the section 'Our value for clients' for afurther elaboration on TTA.
Technology (Tech) has played, and will continue to play, animportant role in the development of our industry. We aim tobe the most agile integrator of technology in our industry.The Randstad Innovation Fund ensures that we are on top ofpotential (disruptive) developments in the HR space. See thesection 'Randstad Innovation Fund' for further details.
Mergers & acquisitions (M&A) have enabled us tocomplement our offering and mix. Our last three deals wereEVA positive within two years (FujiStaff, SFN and parts of USGPeople), in line with our target. We aim to continue thisapproach in the future in the form of bolt-on acquisitions, aswe believe there is room for further consolidation.
Targets within reach
As the Group sustained growth throughout 2014 (see thesection 'Performance'), our focus is on leveraging our strategicinitiatives and improving our profitability. These initiativesshould help us to improve our business mix by acceleratinggrowth in the Professionals segment, permanent placementsand small and medium-sized enterprises (SMEs). Given thetrends in our industry, these segments will play a greater rolein our markets, and we are ready to capture growth in thesesegments. In Staffing, we aim to grow in the SME segment ofthe market by focusing on specialties and permanent
placements. For Professionals, we have modified our approachto accelerate profitable growth. In mature markets, we willapply a verticals approach, allowing us to better align ourdelivery models to the dynamics of the core segments of IT,finance and engineering. We will 'copy and paste' these bestpractices globally to ensure our consultants reach the desiredproductivity levels faster. In new and emerging markets, wewill focus on accelerating growth by providing our companieswith standardized toolkits to ensure strong growth in thestart-up phase. At the same time, we aim to broaden ourservice offering by stepping up growth in other HR services,such as MSP, RPO, and outsourcing.
On our Capital Markets Day (held on November 20, 2014), weindicated that our 5-6% EBITA margin target could comewithin reach assuming:- we will have two years of mid-single-digit sales growth;- increased productivity through ABFS;- € 60-70 million cost savings which are the result of our
global headquarters and back-office benchmark study;- continued mix changes towards permanent placements,
Professionals, and SME.
Targets within reach
ABFS
cost
businessmix
topline
growth
2015-2016
€ 30-35 million
savings in 2015 and
€ 30-35 million in 2016
assumptions:
mid-single-digit sales
growth in 2015 and 2016
more permanent placements,
Professionals and SME
5.0% - 6.0% target within reach4.4% - 4.6% EBITA margin
improved
productivity
businessmix
2015-2016
2015 2016
26
'The added valueprovided byRandstad has beenan importantfactor in howmany clientorganizations havebecome thesuccesses they aretoday.'
When you ask leaders whatthey do to create successfulorganizations, the vastmajority of them first mentionhow they have always scoutedfor the right people in theright places. Yet, this is easiersaid than done. Shaping yourorganization for successrequires a good grasp of whatwe, at Randstad, call 'TotalTalent Architecture'. Thisinvolves establishing a balancebetween core talent with longtenures on the one hand, andoptimal flexibility to matchmarket changes on the other.Our services are designed tohelp organizations achieveexactly that.
At the most basic level, aconsultant in a branchpersonally interviews andplaces more people per yearthan most managers do intheir whole career. They cando it faster and moreefficiently, and they are alsolikely to do it better. This isone way we add massivevalue for our clients. But itdoes not stop there. Weconstantly analyze the labormarkets and the evolution ofHR science. From this, newservices are emerging all thetime. Take our very successfulRandstad Inhouse Services.This concept is a goodexample of how we form true
partnerships with our clientsto make them more efficient.Another example is ourleadership position withRandstad Sourceright, wherewe provide a full suite ofservices in Recruitment ProcessOutsourcing and ManagedServices Programs. The addedvalue thus provided byRandstad has been animportant factor in how manyclient organizations, small orlarge, have become thesuccesses they are today.
how I becameclients

27
annual report 2014 − Randstad Holding nv
This is an integrated annual report. Randstad Holding hasbeen participating in the pilot of the International IntegratedReporting Council (IIRC), which released a global reportingframework at the end of 2013. This global framework aims tobring greater cohesion and efficiency to the reporting process,and to improve the quality of information available toinvestors, with a clear focus on value creation. Following areview of annual reports and external communications of IIRCpilot participants, Randstad Holding was nominated for theBuilding Public Trust Awards 2014, in the categoryInternational Award for Excellence in Integrated Reporting.
With regard to sustainability, until 2011, we reported on anumber of sector-specific topics, based on indicators proposedby GRI (Global Reporting Initiative) and the United NationsGlobal Compact. In 2012, we published our Randstad-specificsustainability framework, which still sets the direction for ourambitions. It is based on a series of dialogues with multiplestakeholders, as a result of which we identify our keystakeholders (pillars). The Executive Board and SupervisoryBoard were closely involved in developing the framework,which forms the heart of our value proposition and thereforereflects our activities from the perspective of our clients,candidates, employees, shareholders, society, andemployment markets.
We have been communicating and promoting oursustainability framework across all layers of the organization.Several of our larger operating companies publish their owndetailed sustainability report (in addition to the Randstadannual report) to facilitate their local stakeholder dialogue.
Our Executive Board bears ultimate responsibility for theGroup's sustainability policy, while sustainability-related topicsare discussed regularly by the Supervisory Board and itsCommittees. Our operating companies have their owndedicated Sustainability Managers or a coordinator forsustainability matters, depending on their size. At Group level,a Sustainability Manager is responsible for the aggregatedreporting process.
Given the relevance of sustainability for Randstad's business,its ambition, and long-term viability, the Supervisory Boardhas added KPIs from the sustainability framework − one fromeach pillar − to the Executive Board's long-term incentiveperformance targets, in a ratio of 80% Total ShareholderReturn (TSR) and 20% sustainability. For the performanceperiod 2014-2016, the performance targets are (1) our NetPromoter Score; (2) candidate engagement; (3) internalmanagement appointments; (4) the number of employeesinvolved in VSO; and (5) the full rollout of the sustainablesupplier code throughout the company worldwide.
2014 was the third full year for which our operatingcompanies reported on sustainability through the reportingsystem, and on a quarterly basis. Our non-financial reporting isnow embedded in the planning and control cycle of theorganization, and CFOs of operating companies bear final
responsibility for its quality and completeness. Elementsrelated to sustainability reporting are explicitly included in ourkey control framework. In the course of 2014, this key controlframework was extended to cover risks related tosustainability principles and health and safety management.
Our sustainability framework contains key performanceindicators (KPIs). Several of these KPIs have already been inplace for years; other KPIs are under development. New KPIswill be added, while others may be relinquished if they turnout to have become obsolete. Assessing KPIs for feasibility,and validating them in light of developments in the companyand society, has become a continuous process. In principle, allour main operating companies report on these KPIs that areassessed on reasonability at Group level.
In the area of sustainability in the workforce, Randstadfocuses on several key topics in dialogue with a number ofhighly influential global companies, to identify the principalglobal dilemmas facing the world of work in 2015 andpossible solutions. These dilemmas include:- Knowledge transfer: With an aging skilled workforce, in
which a generation is currently retiring at 10,000 workersper day, how can companies retain the knowledge andexperience of those retirees?
- Leadership skills: How can we build the necessary bridgesto the younger generations of future workers in order tounderstand their desires, the expectations of their futureemployers, and their career tracks?
sustainability at Randstad

28
annual report 2014 − Randstad Holding nv
we strive for the simultaneous promotion of all interestspillar vision 2020 measures of success key drivers 2012 - 2020 KPIs
shap
ing
the
wor
ld o
f w
ork
optimalworkforces forclients
We are the leading HR solutions partner and support our
clients in creating a balanced workforce, and in becoming
more attractive employers and effective organizations,
now and in the coming years.
Through their behavior, clients indicate that our core
values and innovative concepts are a differentiator, and
that they prefer us over others.
Clients program - We provide innovative concepts for flexibility, based on our core values- We support diversified workforces at our clients- We have a continuous dialogue with and advise clients on the
simultaneous promotion of all interests- We provide clients with the best candidates- We measure our success through surveys
Clients KPIs - # of matches- % of orders filled- # of successful placements in our permanent placement business- Net Promoter Score- Client consideration, preference; client retention- Market share- % of flexible workforce in our markets
the best jobs forcandidates
We give as many people as possible access to jobs,
providing them with options to develop themselves, with
equal opportunities for all, with respect for health and
safety, and with unyielding integrity. We also play a
crucial role in guiding people from unemployment to
employment.
Through their behavior and through survey results,
candidates show that we are preferred because of our
ability to provide them with the right jobs.
Candidates program- We advance the employability of candidates- We provide candidates with the right jobs- We make sure that our candidates work in a safe and healthy environment- We guide people from unemployment to employment- We measure our success through surveys
Candidates KPIs- # of matches and placements- Candidate consideration, preference; candidate engagement- Injuries and fatalities during work- Sickness as % of total hours worked- # of candidates with disabilities placed; candidates from minority groups
placed- # of people we guide from unemployment to employment- # of training hours; training costs
the employer ofchoice for ouremployees
We want to be an attractive employer with equal
opportunities for everyone in an environment in which
knowledge, trust and diversity are highly valued. We are
aware that we can only achieve this through serving
others.
Potential and current employee survey scores show that
we offer a working environment that is highly rated in
terms of safety, health and personal development, with
equal opportunities for all.
Employees program- We attract, recruit, develop and retain the best people- The composition of our workforce is such that employees are able to understand
and work with the diverse groups that make up our markets- We insist on ethical behavior and further embed business principles in our global
organization (e.g., health and safety, human rights and environment)- We measure our success through surveys
Employees KPIs- Internal management appointments as % of total- Management development participation- Proportion of male and female employees- Proportion of male and female in middle and senior management- Proportion of full-time and part-time employees- # of training hours; training costs - Injuries and fatalities during work- Sickness as % of total hours worked- Employee retention rate- Engagement score
expertise for abetter society andvalue for ourshareholders
We aim to shape a better society by activating our
knowledge and expertise. This is focused on (but not
limited to) our knowledge of employment markets. We
advocate developments which benefit individuals as well
as society at large.
We are recognized as a key contributor to public debates
relating to employment markets.
Employment-market program- We contribute to the removal of barriers for global mobility- We strive to improve global employment participation- We strive to increase our role in the regulation/deregulation
of employment markets- We contribute to the social dialogue at key forums- We engage in a proactive and continuous stakeholder dialogue- We create partnerships that enable us to use our knowledge to benefit society
We create value for our shareholders
Employment-market KPIs- Staffing penetration rates in our markets- Contribution to the regulation/deregulation of labor markets- # of employees active in national and international employment
institutions- Involvement within other key forums- # of hours and employees involved in VSO- Other community engagements
Shareholder KPIs- EBITA margin of 5% to 6% over time- Payout ratio of 40% to 50% of net profit
sustainabilitybasics
We aim to have a set of management tools, business
principles and policies in place that are in line with or
exceed the standard for our industry and that
enable accountability for all elements of our sustainability
framework.
We are recognized as a leader in sustainability
management in our industry.
Basics program - We create mechanisms to safeguard our core values, business principles
and good governance- We strive for a responsible supply chain- We strive to limit our environmental footprint by using sustainable energy sources,
reducing use of water and paper
Basics KPIs- # of employees trained in business principles- # of business principles incidents (misconduct reporting procedure)- % of vendors who have agreed to our sustainable vendor policy, % of
purchase value- Environmental footprint measures on consumption of energy,
% of use of green energy sources, water and paper

29
annual report 2014 − Randstad Holding nv
we strive for the simultaneous promotion of all interestspillar vision 2020 measures of success key drivers 2012 - 2020 KPIs
shap
ing
the
wor
ld o
f w
ork
optimalworkforces forclients
We are the leading HR solutions partner and support our
clients in creating a balanced workforce, and in becoming
more attractive employers and effective organizations,
now and in the coming years.
Through their behavior, clients indicate that our core
values and innovative concepts are a differentiator, and
that they prefer us over others.
Clients program - We provide innovative concepts for flexibility, based on our core values- We support diversified workforces at our clients- We have a continuous dialogue with and advise clients on the
simultaneous promotion of all interests- We provide clients with the best candidates- We measure our success through surveys
Clients KPIs - # of matches- % of orders filled- # of successful placements in our permanent placement business- Net Promoter Score- Client consideration, preference; client retention- Market share- % of flexible workforce in our markets
the best jobs forcandidates
We give as many people as possible access to jobs,
providing them with options to develop themselves, with
equal opportunities for all, with respect for health and
safety, and with unyielding integrity. We also play a
crucial role in guiding people from unemployment to
employment.
Through their behavior and through survey results,
candidates show that we are preferred because of our
ability to provide them with the right jobs.
Candidates program- We advance the employability of candidates- We provide candidates with the right jobs- We make sure that our candidates work in a safe and healthy environment- We guide people from unemployment to employment- We measure our success through surveys
Candidates KPIs- # of matches and placements- Candidate consideration, preference; candidate engagement- Injuries and fatalities during work- Sickness as % of total hours worked- # of candidates with disabilities placed; candidates from minority groups
placed- # of people we guide from unemployment to employment- # of training hours; training costs
the employer ofchoice for ouremployees
We want to be an attractive employer with equal
opportunities for everyone in an environment in which
knowledge, trust and diversity are highly valued. We are
aware that we can only achieve this through serving
others.
Potential and current employee survey scores show that
we offer a working environment that is highly rated in
terms of safety, health and personal development, with
equal opportunities for all.
Employees program- We attract, recruit, develop and retain the best people- The composition of our workforce is such that employees are able to understand
and work with the diverse groups that make up our markets- We insist on ethical behavior and further embed business principles in our global
organization (e.g., health and safety, human rights and environment)- We measure our success through surveys
Employees KPIs- Internal management appointments as % of total- Management development participation- Proportion of male and female employees- Proportion of male and female in middle and senior management- Proportion of full-time and part-time employees- # of training hours; training costs - Injuries and fatalities during work- Sickness as % of total hours worked- Employee retention rate- Engagement score
expertise for abetter society andvalue for ourshareholders
We aim to shape a better society by activating our
knowledge and expertise. This is focused on (but not
limited to) our knowledge of employment markets. We
advocate developments which benefit individuals as well
as society at large.
We are recognized as a key contributor to public debates
relating to employment markets.
Employment-market program- We contribute to the removal of barriers for global mobility- We strive to improve global employment participation- We strive to increase our role in the regulation/deregulation
of employment markets- We contribute to the social dialogue at key forums- We engage in a proactive and continuous stakeholder dialogue- We create partnerships that enable us to use our knowledge to benefit society
We create value for our shareholders
Employment-market KPIs- Staffing penetration rates in our markets- Contribution to the regulation/deregulation of labor markets- # of employees active in national and international employment
institutions- Involvement within other key forums- # of hours and employees involved in VSO- Other community engagements
Shareholder KPIs- EBITA margin of 5% to 6% over time- Payout ratio of 40% to 50% of net profit
sustainabilitybasics
We aim to have a set of management tools, business
principles and policies in place that are in line with or
exceed the standard for our industry and that
enable accountability for all elements of our sustainability
framework.
We are recognized as a leader in sustainability
management in our industry.
Basics program - We create mechanisms to safeguard our core values, business principles
and good governance- We strive for a responsible supply chain- We strive to limit our environmental footprint by using sustainable energy sources,
reducing use of water and paper
Basics KPIs- # of employees trained in business principles- # of business principles incidents (misconduct reporting procedure)- % of vendors who have agreed to our sustainable vendor policy, % of
purchase value- Environmental footprint measures on consumption of energy,
% of use of green energy sources, water and paper

30
annual report 2014 − Randstad Holding nv
Introduction
In this section, we explain our value proposition for clients andcandidates. We will analyze a number of non-financial KPIs aspresented in our sustainability framework. This section alsoincludes an overview of our strategic building blocks, whichensure value creation for our clients and candidates.
Our value for clients
We help our clients to create and manage a balancedworkforce, with employees who have the right skills,competencies and cultural fit. And we help our clients to bemore attractive as employers and more effective asorganizations. In short, we play a key role in managing ourclients' key assets: their people. Companies continue tocompete for the best talent to drive organizational strategy,workforce productivity, and business performance. Tocompete, they increasingly look for a strategic talent partnerwith the expertise and scope to provide holistic HR solutions.
By finding the candidates with the talents and skills our clientsneed, when they need them, we give our clients the necessaryflexibility and agility to improve their productivity andcompetitiveness. We provide our clients with a large range ofservices, partnering with them throughout economic cyclesand structural changes in their organization. Our clients arerequired to adjust capacity during a day, week, month or year.We help them to address these challenges. Moreover, ourclients are increasingly outsourcing their HR processes to us. Inaddition, we provide value by putting our knowledge of localemployment markets at our clients' disposal. In short, ourpeople's knowledge and services shape our clients' businessesfor the better.
Our range of services includes regular temporary staffing andthe permanent placement of candidates. We also offerdedicated on-site workforce management with InhouseServices – an offering unique in our industry – as well as otherHR solutions, such as Recruitment Process Outsourcing (RPO),managed services programs (MSP), payroll services, andoutplacement. We deliver our services in multiple ways, usingmultiple service concepts. Our service concepts, which areexplained in the section 'Our strategy: strong concepts', offera wide range of solutions and are always based onstandardized best practices and proven procedures.
Total Talent Architecture (our large-client approach)Total Talent Architecture (TTA) is a large-client approach(roughly 1,000 accounts), by which a company builds a holistictalent strategy with the optimal balance and supply ofpermanent, contingent, and freelance talent, making ameasurable impact on business goals and growth. Achievingthis requires a rigorous approach and deeply unifiedorganizational behavior.
Traditional talent acquisition is typically executed in silos bymany stakeholders concerned only with filling their particulartalent needs at a certain moment. Hiring managers mayutilize insourced, outsourced, or a mix of such services toacquire talent. As a result, process overhead is unavoidable,and the lack of transparency and internal communication canlead to cost, quality and compliance issues.
TTA encompasses much more than a set of services. It starts byexamining an organization’s business objectives and requiresan in-depth analysis of the workforce planning andforecasting to deliver a talent strategy aligned to growthambitions and profitability targets. This strategy may comprisevarious and flexible talent supply models based on differencesin business needs, geography, and workforce demographics.Employers may adopt these models in local businessoperations, across multiple geographies, or even globally.
Randstad is well-positioned to provide these total talentsolutions based on our broad service offering andinternational coverage. TTA connects all our business lines,where we see ample opportunities to increase our presence inhigher-value-added services (such as Professionals andpermanent placements). In most cases, we build on existing,long-standing relationships with clients. Through acomprehensive customer and market intelligence exercise, wereview all internal and external data sources available in orderto compare their results with those of other companies in thesame industry. We review with clients their organizationalperformance and current HR/talent state with their desiredfuture position. Drawing up a roadmap, we proactively showthem their future talent strategy, demonstratingopportunities and barriers to success and potential businessimpact in terms of growth, financials, and competitiveposition.
Executive Board
Staffing Inhouse MSP & RPO
Profsnon-tech
Profs tech
Managing Director operating company
Marketing, HR, BCD - concept-specific
Support SSC (Finance, IT, Legal, Facilities)
Total Talent Architecture
Total Talent Architecture
value for our clients and candidatesvalue for our clients and candidates
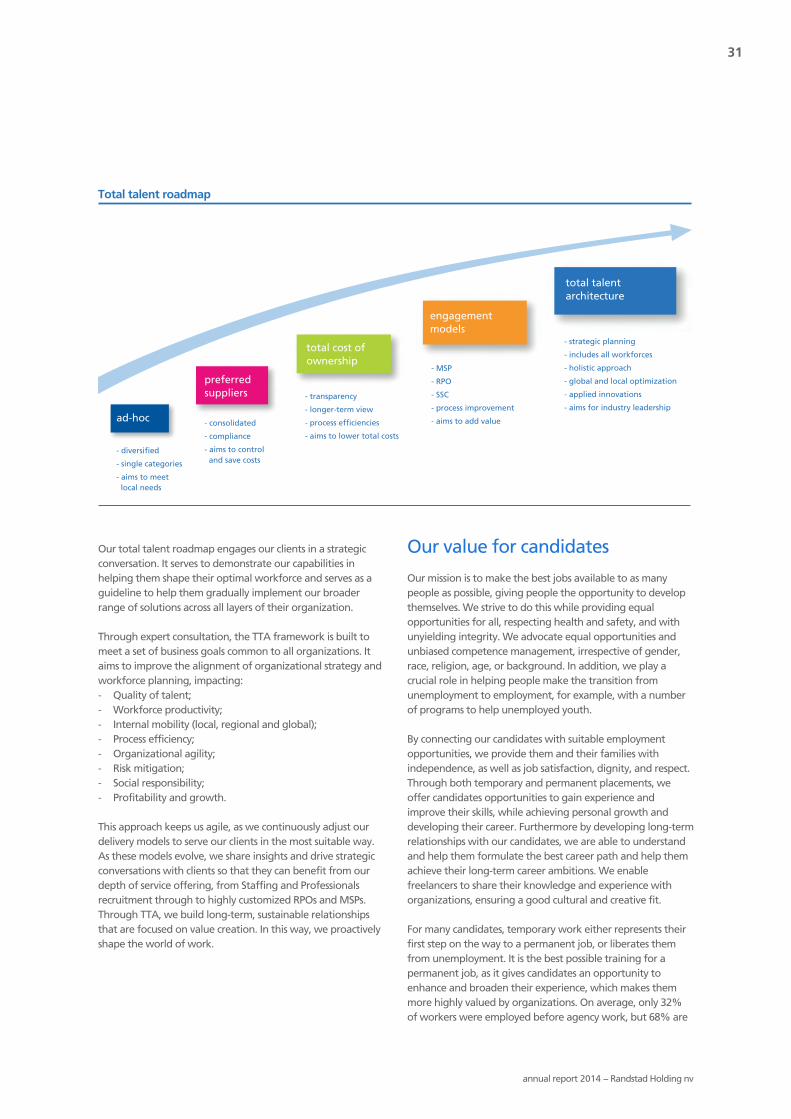
31
annual report 2014 − Randstad Holding nv
Our total talent roadmap engages our clients in a strategicconversation. It serves to demonstrate our capabilities inhelping them shape their optimal workforce and serves as aguideline to help them gradually implement our broaderrange of solutions across all layers of their organization.
Through expert consultation, the TTA framework is built tomeet a set of business goals common to all organizations. Itaims to improve the alignment of organizational strategy andworkforce planning, impacting:- Quality of talent;- Workforce productivity;- Internal mobility (local, regional and global);- Process efficiency;- Organizational agility;- Risk mitigation;- Social responsibility;- Profitability and growth.
This approach keeps us agile, as we continuously adjust ourdelivery models to serve our clients in the most suitable way.As these models evolve, we share insights and drive strategicconversations with clients so that they can benefit from ourdepth of service offering, from Staffing and Professionalsrecruitment through to highly customized RPOs and MSPs.Through TTA, we build long-term, sustainable relationshipsthat are focused on value creation. In this way, we proactivelyshape the world of work.
Our value for candidates
Our mission is to make the best jobs available to as manypeople as possible, giving people the opportunity to developthemselves. We strive to do this while providing equalopportunities for all, respecting health and safety, and withunyielding integrity. We advocate equal opportunities andunbiased competence management, irrespective of gender,race, religion, age, or background. In addition, we play acrucial role in helping people make the transition fromunemployment to employment, for example, with a numberof programs to help unemployed youth.
By connecting our candidates with suitable employmentopportunities, we provide them and their families withindependence, as well as job satisfaction, dignity, and respect.Through both temporary and permanent placements, weoffer candidates opportunities to gain experience andimprove their skills, while achieving personal growth anddeveloping their career. Furthermore by developing long-termrelationships with our candidates, we are able to understandand help them formulate the best career path and help themachieve their long-term career ambitions. We enablefreelancers to share their knowledge and experience withorganizations, ensuring a good cultural and creative fit.
For many candidates, temporary work either represents theirfirst step on the way to a permanent job, or liberates themfrom unemployment. It is the best possible training for apermanent job, as it gives candidates an opportunity toenhance and broaden their experience, which makes themmore highly valued by organizations. On average, only 32%of workers were employed before agency work, but 68% are
Total talent roadmap
- strategic planning
- includes all workforces
- holistic approach
- global and local optimization
- applied innovations
- aims for industry leadership
- MSP
- RPO
- SSC
- process improvement
- aims to add value
- transparency
- longer-term view
- process efficiencies
- aims to lower total costs
- consolidated
- compliance
- aims to control
and save costs- diversified
- single categories
- aims to meet
local needs
ad-hoc
preferred
suppliers
total cost of
ownership
engagement
models
total talent
architecture

32
annual report 2014 − Randstad Holding nv
employed after agency work (source: Ciett, Economic Report2014). For other candidates, the services we provide enablethem to build a career, to earn additional income, or to adjusttheir work/life balance to their own circumstances, needs andwishes.
By finding work for people, we contribute to the optimizationof talent allocation. By helping candidates manage their initialexpectations and ambitions in terms of sector, client and jobprofiles, and by providing training where necessary, we helpthem adapt to changing requirements. We recognize thatvarious groups of people in society are distanced from work.We run a variety of local job- and skills-oriented trainingprograms designed to help these people integrate orreintegrate into the employment market.
Our strategy: strong concepts
strong concepts
we create and
manage a balanced
workforce by
connecting
candidates with
suitable employment
opportunities
we attract bright,
agile and adaptable
employees and
challenge them
to outperform
towards clients
and candidates
simultaneous promotion of all interests: we help to maximize future employment and economic growth
and we create shareholder value
best people excellent execution
we aim to be the
most attractive
employer for
our employees
our strong concepts
drive excellent
development
opportunities for
our employees
Creating value through our strategy
clients
employees
society
candidates
we use best practices
and proven procedures
to ensure candidate
engagement and first-
class service delivery
superior brands
we guarantee to our clients
that they will receive the
highest quality service and get
access to the best candidates
we are well-known for making
the best jobs available and
giving people the opportunity
to develop their talents
superior brands help us to
attract, recruit and retain
the best people
strategic building blocks
stakeh
old
ers
our high-performance
culture helps us to
recruit, retain and
develop the best people
we attract bright,
agile and adaptable
employees and
challenge them
to outperform
towards clients
and candidates
simultaneous promotion of all interests: we help to maximize future employment and economic growth
and we create shareholder value
we aim to be the
most attractive
employer for
our employees
we use best practices
and proven procedures
to ensure candidate
engagement and first-
class service delivery
we guarantee to our clients
that they will receive the
highest quality service and get
access to the best candidates
we are well-known for making
the best jobs available and
giving people the opportunity
to develop their talents
superior brands help us to
attract, recruit and retain
the best people
our high-performance
culture helps us to
recruit, retain and
develop the best people
societyincluding shareholders
To ensure value creation for clients and candidates, we offerthem our strong concepts:- Staffing;- Inhouse Services;- Professionals;- HR Solutions.
These concepts are based on best practices and provenprocedures. This ensures efficient working methods and first-class service delivery. The concepts can be rapidly replicatedand leveraged in other markets, and are relatively easy toadapt to meet specific needs. Our service concepts are well-known for the consistency and quality of their delivery. As aresult, all of our clients know they can trust Randstad to meettheir needs throughout the world. Our concepts offer clientsin-depth knowledge of their business and provide them withthe right talent at the right time. Addressing the need of ourclients for increased flexibility is something we do every day.
In 2014, we continued to focus on implementing the rightdelivery models for clients and on client profitability. For smalland medium-sized clients, we offer Staffing and Professionalsservices through our branch network. Our units or teams inthese businesses each focus on a specific market segmentand/or job profile, offering temporary staffing and/orpermanent placements. For larger clients requiring highervolumes, we have developed segment-specific deliverymodels. As the profiles of our clients continue to change, weadapt our service offering accordingly. Two good examplesare Randstad Inhouse Services and Randstad Sourceright. Thelatter focuses on Recruitment Process Outsourcing (RPO) andManaged Services Programs (MSP).
Across the Randstad Group, we periodically analyze ourclients' needs. During these analyses, we assess whether theexisting delivery model is the most effective and efficient oneto meet our clients' needs. In addition, we analyze whetherthe existing contract and delivery models generate the desiredprofitability. Based on this assessment, clients may betransferred to a new delivery model to ensure we continue totailor our services to their specific needs and challenges. Forexample, we may transfer a large Professionals client, servicedthrough our office network, to RPO, so that we can handlerecruitment at the client's premises. Other examples involvelaunching an MSP for a large client to manage its supplier
client
large account
segment-specific
SME
traditional model
permtemppermtemp Profsnon-tech
Profstech
MSP & RPO
InhouseStaffing
Professionalsverticals
Total Talent ArchitectureStaffing
specialties
Client strategy
value for our clients and candidates

33
annual report 2014 − Randstad Holding nv
base, transferring Staffing from the branch network toInhouse Services, or centralizing the recruitment ofcandidates.
Such a dedicated delivery model increases the fill rate of theorders and hence leads to greater efficiency and clientsatisfaction. What is more, by transferring a larger client fromthe branch network to a segment-specific delivery model, wealso ensure that the units and teams at the branches arebetter able to focus on their SME market segments andrelated job profiles.
To support the continuous improvement of our concepts andto create new delivery models, we innovate by being the mostagile integrator of HR technology. Some of the HR technologytrends we see are big data analytics, social sourcing, talentnetworks, and human cloud platforms. We are runningseveral projects to embrace these new trends, which allows usto use these technologies in our service delivery to clients. Inthis context, the Randstad Innovation Fund (RIF) plays animportant role.
We offer four distinct service concepts: Staffing, InhouseServices, Professionals and HR Solutions. Within each serviceconcept, we have multiple ways of delivering our services toour clients. A detailed explanation of our service offering andthe structure we deploy to render these services is given in thefollowing sections. An overview of our performance byrevenue category in 2014 is given in the section 'Performance'.
StaffingIn Staffing, our largest business, we focus on recruitingcandidates whose highest level of schooling is secondaryeducation or equivalent. The concept covers both temporary
staffing, where we charge our clients based on the hoursworked, and permanent placements, where we charge ourclient a fee based on the candidate's salary. In 2014, wesuccessfully increased our focus on permanent placements. Ina growing number of countries, we now have blended unitsthat offer both temporary staffing and permanentplacements.
Our Staffing service offering includes a range of specialties,with dedicated units that focus on staffing for certain marketsegments that require specific skills or experience (e.g.,logistics, airports, and call centers).
In the majority of our markets, we operate a unit structure inthe Staffing segment. Each unit typically consists of twoconsultants who work within a given geographical area orindustry and are jointly responsible for client service,candidate selection, and the matching of clients andcandidates. The consultants work as a team, ensuring that, atall times, at least one of them is available to assist our clientsand candidates. All consultants are experts in their local labormarket, and become experts in their clients' businesses,understanding client needs and the candidate profiles thatwill best meet their requirements. Because consultants arededicated to clients and know what to expect − which enablesthem to predict what clients will need and when they willneed it − they achieve maximum fill rates for vacancies. Byhaving in-depth knowledge of the indicators and our clients,we can anticipate our clients' needs. This is one of Randstad’sgreatest differentiators, and provides a major boost to teamperformance and directly impacts productivity. The structureenables our consultants to dynamically address changingclient demands as they arise. This sets us apart from manycompetitors who operate separate sales and recruitmentforces. As clients' needs change, we may implement differentways of delivering services, such as centralizing therecruitment of candidates and digitizing parts of our services.
Inhouse ServicesRandstad has developed Inhouse Services to meet thestructural needs of companies requiring large-volumeworkforces with client-specific skill sets.
We provide dedicated consultants and process managers whowork on-site, tailoring our processes to our clients' specificneeds, and improving workforce flexibility, productivity, andefficiency. We focus mainly on the following segments: fast-moving consumer goods (FMCG), call centers, manufacturing,and logistics. By providing a flexible work solution designedexclusively for each client, we optimize the workforce anddrive cost effectiveness. This results in a number of notableclient benefits, including improved labor flexibility andproductivity, increased employee retention, and strongeremployee engagement.
Being on-site is as close to a client as we can get, and itprovides us with a unique opportunity to obtain a thoroughunderstanding of how their business operates and what they
Adaptability of the client-delivery model
client
analysis
delivery model
tran
sfer
criter
ia
del
ivery
cri
teri
a

34
annual report 2014 − Randstad Holding nv
need to do in order to become more agile, efficient andsuccessful. As a result, hidden needs are easier to discover, andrelationships often become long-lasting, providing a high levelof trust, enabling clients to focus on core strategic issues,confident in the knowledge that their staffing needs arebeing met.
Over the years, we have gained valuable experience inproviding Inhouse solutions across the industrial segments ofour markets. We are now also focusing on implementing ourInhouse Services concept in the administrative segments andin Professionals. In addition, we are seeing an increasingdemand for permanent placements through the Inhouseconcept.
ProfessionalsFinding and retaining talent is an ongoing challenge for manyof our clients. Even in volatile times with increasedunemployment, there are many scarce profiles (especially ITand engineering professionals with at least a universitydegree). We know where to find the talent with the rightskills and competencies, and are able to support ourprofessionals in gaining additional skills through training ifrequired. Our professionals, both those placed on temporaryprojects and those added as permanent staff, will add valuefrom the moment they start the job and help achieve ourclients' business goals.
Within Professionals, we use units of at least two consultants,who concentrate on a specific segment or a number of jobprofiles. Our experienced consultants are experts in their ownspecific fields, and have well-developed networks of contacts.We source professionals and executives across a range ofsectors, including engineering, IT, finance and accounting,healthcare, and other disciplines, such as HR, education, legalaffairs, and marketing. We place candidates on a temporaryor interim basis, as well as on permanent placements.
In 2014, we took a closer look at our strategic approach forProfessionals. We see a big opportunity to leverage the strongrelationships with our existing client base, where we alreadyhave a solid exposure to their staffing spend. Going forward,we will focus on verticals in mature markets, while aiming ataccelerating growth in emerging markets based on a moregeneric approach.
Our verticals approach to mature markets is initially focusedon the larger Professionals markets: IT, finance andengineering. The emphasis is to further tailor our Professionalsconcept to the dynamics of these markets and making use ofthe in-depth knowledge and experience in the most matureoperating companies. On that basis, we 'copy and paste' thesebest-practice concepts. Special attention is paid to on-boarding programs for new consultants and helping them toget to desired productivity levels faster. Our field steeringmodel further supports our growth in these markets. In theNetherlands, as part of the restructuring, all Professionalsactivities will be combined under the Yacht brand.
In emerging markets, we apply a more generic approach, andwe have standardized toolkits available for acceleratinggrowth across these markets. These toolkits include blueprintsfor processes, databases, and dashboards. Special attention ispaid to people, training, and development, including seniormanagement appointments, to ensure we have the right levelof expertise on board. By making use of the standardizedtoolkit, we ensure that best practices and proven proceduresare used. Once these businesses grow in maturity, theactivities will be aligned with the verticals approach, asexplained above.
HR SolutionsHR Solutions frees up the time of our clients' HR managers bytaking over several of their tasks, enabling them toconcentrate more on their company's strategic HR issues.These services, which have been developed on the basis of ourextensive experience in this field, are typically complementaryto Staffing and Professionals, especially with long-standingclient relationships. In addition, our HR Solutions offeringprovides an ideal opportunity to establish and deepen newclient relationships. Sometimes we start a client relationship byproviding payroll services, and we also have many exampleswhere we first provided outsourcing or other HR services.Sharing our expertise and added value enables us to expandour service offering to Staffing and Professionals. We provideclients with a number of key HR Solutions, which aredescribed below.
In 2014, Randstad Sourceright continued to build on its successin addressing client demand for strategic talent solutions.Through ongoing consultation and extensive partnerships, wehelped organizations navigate constant market changes withthe critical skills required to compete and succeed. Our insight,deep expertise, and services help clients fulfill their strategicbusiness vision through a commitment to shaping anorganization's 'talent readiness'. By delivering the right talentat the right time in the right modes of employment and at theright cost, we drive quantifiable and lasting business impactfor our clients.
As clients seek new ways to stay ahead of the competition andsecure the best talent faster, we are seeing growth in marketopportunities in Recruitment Process Outsourcing (RPO) andManaged Services Programs (MSPs).
Key figures by revenue categoryin millions of €
revenue growth%
2014 2013 total organic
Staffing (incl. HR Solutions) 10,202.8 10,037.9 2 1
Professionals 3,424.5 3,306.9 4 4
Inhouse Services 3,622.5 3,223.5 12 12
Total 17,249.8 16,568.3 4 4
value for our clients and candidates

35
annual report 2014 − Randstad Holding nv
Within the solutions sector, the global RPO market continuesto see strong demand at 15-20% growth annually. The largestmarket is North America, followed by EMEA, Asia Pacific, andLatin America. As the market matures, RPO buyers are lookingbeyond traditional drivers, such as flexibility, scalability, andcost. In addition, they are attaching greater importance tobusiness impact – including improving quality of hire, reducingtime-to-hire of business-critical talent, measurable processimprovement, and greater visibility and insights.
Recruitment Process Outsourcing (RPO)RPO is designed to increase the quality of a client's process ofhiring permanent employees, and to reduce theiradministrative burden and costs. Our RPO services take controlof a client's entire recruitment and talent acquisition process.We provide tailor-made, own-branded, and on-site HR servicesto deal with:- Management of all vacancies;- Response screening and assessment;- Selection and management of external agencies;- Cross-border services.
RPO is used by large, multinational organizations seekingstrategic, operational and financial benefits. RPO was a well-established service offering provided by SFN Group, a US-based company we acquired in 2011. In line with our 'copyand paste' strategy, we are implementing this concept inother countries outside the US.
Today, clients need an RPO provider that can alignorganizational strategy with the workforce plan, adding valuethrough innovative services around strategic sourcing,employer branding, diversity, talent community management,workforce planning, and talent analytics. RandstadSourceright is well-positioned to capitalize on thesedevelopments through our global capabilities, our network ofrenowned thought leaders, and expert communities, as wellas the innovation demonstrated by our centralizedrecruitment centers in the US, UK, Hungary, India, China andMalaysia.
Managed Services Programs (MSP)In our Managed Services Programs, we take primaryresponsibility for the organization and management of aclient's contingent workforce.
We manage the entire supply chain of all staffing providers onbehalf of the client. This gives clients greater control of theirrecruitment activities and greater transparency regarding theirspending. These services are particularly useful for companieswanting a single point of contact in order to ensure greatertransparency and compliance in managing large volumes ofprofessional skills from many different suppliers. We regularlyoperate in more than one country. We have experience withmost Vendor Management System technologies that are usedto automate the hiring process and to provide clients withstatistical management information.
The MSP market continues to evolve rapidly, showing globalgrowth of 15−20% in 2014. The largest MSP market is inNorth America, followed by EMEA, Asia Pacific, and LatinAmerica. Besides the traditional MSP adoption drivers (such ascost reduction, improved compliance, and greater spend andworkforce visibility), new drivers focusing on optimizing theblend of permanent and temporary workers and talentquality are also emerging. This development is driving changein MSP solutions, such as roles and functions in scope, deliverymodels, pricing approaches, geographic coverage, and theservice provider landscape. Organizations are starting to lookat talent holistically, with talent acquisition encompassing thetemporary, contracting, freelance, and permanent workforce,as well as statement of work consultants. As organizationscontinue to recognize the value contributed by contingentworkers, they are paying more and more attention to thequality of hires and the satisfaction levels of hiring managers.
Both RPO and MSP are offered under the global RandstadSourceright brand. Randstad Sourceright has seen rapidadaptation and expansion in Anglo-Saxon markets over thelast few years, as clients become increasingly aware of thebenefits. The long-term growth potential in Europe and theincreasing proportion of multi-country deals has recently ledus to realign our EMEA organization to capture this growth.
Payroll ServicesOur Payroll Services take over our clients' administrativeburden so that they can focus on their core business needs.We provide a broad range of services, including:- Taking care of the entire personnel administration, payroll
accounting, and contract management;- Monitoring and addressing absenteeism;- Providing a 24/7 service portal, which enables clients to
register new employees, make changes, or find specificmanagement information.
OutplacementWithin Outplacement, we advise and support organizations insituations in which employment contracts need to be endeddue to a strategic decision or for other reasons. We helpemployees to find suitable new employment, and try to makethe transition as smooth as possible. In this segment, we aremarket leader in the Netherlands and Belgium.
OutsourcingIn Outsourcing, we take over several client activities withoutput responsibility in both production/logistics andadministrative environments, while we also have a largeoutsourcing business in IT.
ConsultancyThrough our Consultancy services, we support clients byproviding expert advice on organizational development andpersonal improvement, which includes:- Personal employee development and coaching;- Optimization of HR processes and policies;- Strategic workforce planning.

36
annual report 2014 − Randstad Holding nv
Our strategy: excellent execution
strong concepts
we create and
manage a balanced
workforce by
connecting
candidates with
suitable employment
opportunities
we attract bright,
agile and adaptable
employees and
challenge them
to outperform
towards clients
and candidates
simultaneous promotion of all interests: we help to maximize future employment and economic growth
and we create shareholder value
best people excellent execution
we aim to be the
most attractive
employer for
our employees
our strong concepts
drive excellent
development
opportunities for
our employees
Creating value through our strategy
clients
employees
candidates
we use best practices
and proven procedures
to ensure candidate
engagement and first-
class service delivery
superior brands
we guarantee to our clients
that they will receive the
highest quality service and get
access to the best candidates
we are well-known for making
the best jobs available and
giving people the opportunity
to develop their talents
superior brands help us to
attract, recruit and retain
the best people
strategic building blocks
stakeh
old
ers
our high-performance
culture helps us to
recruit, retain and
develop the best people
we create and
manage a balanced
workforce by
connecting
candidates with
suitable employment
opportunities
we attract bright,
agile and adaptable
employees and
challenge them
to outperform
towards clients
and candidates
simultaneous promotion of all interests: we help to maximize future employment and economic growth
and we create shareholder value
we aim to be the
most attractive
employer for
our employees
our strong concepts
drive excellent
development
opportunities for
our employees
we guarantee to our clients
that they will receive the
highest quality service and get
access to the best candidates
we are well-known for making
the best jobs available and
giving people the opportunity
to develop their talents
superior brands help us to
attract, recruit and retain
the best people
societyincluding shareholders
Our building block 'excellent execution' is based on bestpractices, which we have made the cornerstone of all ouractivities. We take best practices that have either beendeveloped centrally at Group level or in any one of ouroperating companies, and translate them into standardizedwork processes that we can use right across our business. Thismeans we can spend more time with clients and candidates,increasing client and candidate engagement and enabling usto gain market share. By standardizing, we can rapidly ‘copyand paste’ our concepts across markets around the world,because the required processes and execution are fullydeveloped, and we can replicate them with only minoradjustments to take account of local business practices orlabor market culture.
Activity-based field steering (ABFS)Our activity-based field steering model (ABFS) is designed tooptimize adaptability and to drive productivity, which isessential in generating a strong conversion of gross profit intoEBITA. ABFS is an enhanced, input-driven (calls, visits) versionof our existing field steering model. As such, it drives our dailyoperational activities, and enables us to improve ourorganizational readiness.
One of our core strengths is being able to adjust to changingmarket circumstances quickly and adeptly, enabling us toprovide clients with the services they need, when and wherethey need them. Building on the foundation of our strongconcepts, we use our ABFS model to manage and directperformance across our businesses.
Our ABFS model drives decisions to exploit profitable growthpotential or to reduce costs when needed. Both may apply inparallel – even in a growing operating company – which iswhy we align those decisions with local operationaldevelopments and local market trends at the lowest level inour organization. This means that we do not manage on thebasis of averages or predictions, but on actual real-time,bottom-up figures. Furthermore, by embedding operationalperformance tools at every level of our organization, the ABFSmodel also helps operational managers to take the rightdecisions, at the right time, and translate them into action.Managers receive up-to-date, accurate reports on a weekly
basis, covering a range of key performance indicators. Theconsolidated data enables them to manage their units andteams in the field by adapting to changing client and marketdemands as they occur. The field steering model also helps usidentify best practices, which can then be rolled out globallyas part of our strong concepts.
By ensuring the adaptability of the field organization, ourfield steering model helps us to achieve an efficient front-staffcost structure. In addition, we closely monitor the productivityand efficiency of the whole organization, including overheadand head-office costs. As we return to growth, our focus willbe on the conversion of this additional gross profit into EBITA.Overall, we aim to achieve an incremental conversion ratio of50%. However, in the first phase of a recovery this should behigher, as growth will be realized using the existing capacity.This will be supported by limited investments in marketingand bonus costs. In the second phase of a recovery, we willneed to hire consultants to achieve profitable growth. In thatphase, our incremental conversion ratio will be around 50%.
Best practices for field and back-office activitiesWe standardize both front-office and back-office processesand, where possible, marketing processes. This improves theconsistency and quality of our business and our execution. Wehave created and implemented a ‘contract-to-cash’ blueprintacross our companies. This blueprint, which is derived frombest practices used by our operating companies around theworld, includes guidance for contract terms and describes bestpractices for invoicing and collection processes. By using thisblueprint, we ensure efficient use of working capital acrossthe Group. Our average Days Sales Outstanding (DSO) was51.7 days in 2014 (2013: 51.8).
IT strategyBy integrating services and technology, Randstad aims tocontinuously increase the value it creates for its clients,candidates, and employees. Given the fast pace oftechnological developments, Randstad strives for maximumagility to ensure that new technologies are integrated quickly,both locally and globally.
To increase agility and to reduce time-to-market for newdevelopments, Randstad is moving its current physicalinfrastructure into 'the cloud'. This follows the successfulrollout of Google for Work as our email and collaborationplatform.
Randstad's application landscape is a balanced mix of globaland local (per country) elements. Given the vast variety inregulatory environments, we choose to select one corestaffing and compliance platform per country. In addition toenabling compliance with local regulations, these local coresystems are selected and configured to support Randstad'sbusiness concepts and other standards (e.g., our Blue2 webportal standard).
value for our clients and candidates

37
annual report 2014 − Randstad Holding nv
Local IT directors have significant discretion to optimize andextend these local platforms (e.g., by integrating componentsnewly available on the market). Randstad aims to have arepository of (mostly external) components that operatingcompanies can integrate locally with relatively little effort. Weare continuously scanning the HR technology market forpromising new components and ideas. The RandstadInnovation Fund plays an important role in identifying newtechnologies and inspiring ideas. Given this focus, localRandstad IT staff are selected for and trained in businessacumen and integration skills.
Randstad's Group-wide systems are geared, among otherthings, to consolidate financial and operational data andprovide relevant management information to ourinternational clients. Randstad aims to keep this internationallayer of systems relatively light and flexible, and non-intrusiveto local operating company developments.
Randstad recognizes that the traditional way of doingbusiness through our branch network is evolving. While ourbranch network remains an important way of connecting toboth our clients and candidates, our visibility and presence isenhanced through the use of other sales and deliverychannels. These include our online presence and the use ofmobile (location-based) devices.
Randstad Innovation Fund (RIF)As a strategic corporate venture fund dedicated to HR, RIFaims to find early-stage to expansion-stage companies thatare strategically relevant to Randstad. The Fund explorestargeted areas, such as social sourcing, online platforms, andmobile and virtual solutions. Our goal is to take minorityparticipations, preferably together with venture capital firmsor other investors. A typical investment is between € 0.5 and €5 million. Since its launch in March 2014, RIF has reviewed over300 opportunities across the HR technology landscape andmade four minority investments: Gigwalk (March), twago(July), RolePoint (September), and VONQ/Qandidate.com(October).
San Francisco-based Gigwalk provides a mobile platform forautomatically managing on-demand workforces according toconfigurable parameters and geolocalization. Berlin-basedtwago is Europe’s largest marketplace for freelancers, withover 230,000 experts in 200 countries. RolePoint,headquartered in San Francisco, provides an employee referralsoftware suite to SMEs and Fortune 100 companies tomaximize engagement and leverage communities andnetworks.
VONQ is Europe's largest provider of online recruitmentmarketing services. Qandidate.com, launched by VONQ,
HR technology landscape
job alerts workforce management outplacement job board work scheduling (time/absence) aggregators
social career payrolling HR-management collaboration advice system
mobility skill assessment
video interviewing
compliance & verification
gamification scheduling
assessment tools candidate shortlisting
professional & social networks e-staffing résumé parsing software
job search profile aggregation job marketing college recruiting
organizers & distribution
social job software résumé builder talent network talent community predictive
& social search management software analytics
matching
• online platforms
• service platforms
• integrated tools/solutions
• big data / analytics
• applicant tracking systems
• freelancing / outsourcing platforms
e-learning onboarding
tools
enables innovative offerings in multiple strategic fields
talent employer
acquiri
ng talent
managing & developing talent

38
annual report 2014 − Randstad Holding nv
provides a free platform for easily setting up a career site,reflecting the client's own identity and market. It enablesthem to track vacancies on thousands of job sites and socialmedia.
Randstad continuously incorporates into its business strategythe learnings and expertise acquired by RIF.
RIF is investing in and/or cooperating with innovativecompanies that can support Randstad in shaping the world ofwork. RIF's mission is to fuel corporate technology innovationin order to enhance client value and accelerate corporategrowth. The extent to which we understand the HR industry,combined with our global brand and customer base, providesunique value to our stakeholders. As an integral part of ourinnovation strategy, RIF looks for developments externally. Akey pillar of our innovation strategy internally is to 'copy andpaste' successful concepts in a standardized way. Aninnovation board focuses on identifying promising units andpractices that have the potential of being rolled out.
Our strategy: superior brands
strong concepts
we create and
manage a balanced
workforce by
connecting
candidates with
suitable employment
opportunities
we attract bright,
agile and adaptable
employees and
challenge them
to outperform
towards clients
and candidates
simultaneous promotion of all interests: we help to maximize future employment and economic growth
and we create shareholder value
best people excellent execution
we aim to be the
most attractive
employer for
our employees
our strong concepts
drive excellent
development
opportunities for
our employees
Creating value through our strategy
clients
employees
candidates
we use best practices
and proven procedures
to ensure candidate
engagement and first-
class service delivery
superior brands
we guarantee to our clients
that they will receive the
highest quality service and get
access to the best candidates
we are well-known for making
the best jobs available and
giving people the opportunity
to develop their talents
superior brands help us to
attract, recruit and retain
the best people
strategic building blocks
stakeh
old
ers
our high-performance
culture helps us to
recruit, retain and
develop the best people
we create and
manage a balanced
workforce by
connecting
candidates with
suitable employment
opportunities
we attract bright,
agile and adaptable
employees and
challenge them
to outperform
towards clients
and candidates
simultaneous promotion of all interests: we help to maximize future employment and economic growth
and we create shareholder value
we aim to be the
most attractive
employer for
our employees
our strong concepts
drive excellent
development
opportunities for
our employees
we use best practices
and proven procedures
to ensure candidate
engagement and first-
class service delivery
our high-performance
culture helps us to
recruit, retain and
develop the best people
societyincluding shareholders
Our superior brands are a guarantee to our clients that theywill receive the highest quality service and the best employeesworldwide. Superior brands give us better pricing options andthe type of awareness that accelerates selling and prospecting,as well as the introduction of new services. Superior brandsalso help us attract, recruit, and retain the best people, whileenhancing our visibility and credibility with regulators andlegislators.
Randstad is our main brand in most of our markets. However,in a few markets where the market structure makes thisbeneficial, we use Tempo-Team as our second brand. Thisfocused, centralized brand strategy enables us to leveragebrand recognition, generate efficiency benefits for our onlinestrategy, and share experiences across the Group. It alsogenerates momentum behind our joint sponsorship initiatives,and we achieve significant cost reductions by sharingcampaign materials, photo databases and know-how.
International brand awareness rose slightly in 2014 (+1%),despite lower expenditures. This was attributable to a number
of marketing actions and a very good performance by theWilliams F1 team, resulting in much higher brand visibility.
In the Brand Finance Global 500 rating, compiled in the firsthalf of the year, Randstad remained the most valuable brandin our sector and was ranked #254 (2013: #218).
Global traffic to our websites continued to rise, partly inresponse to a larger percentage of our advertising budgetbeing spent online. The relative share of job board andrecruitment network spending decreased slightly.
Our international reports on the world of work continue theirrapid rise in visibility and popularity. The quarterly RandstadWorkmonitor is now used in 33 countries, and the RandstadAward, our independent employer branding assessment ofmajor employers in specific markets, has been extended to 23countries. In addition, we introduced the Global RandstadAward ranking (see the section 'Employment marketexpertise: Randstad Award').
According to Dow Jones Insight metrics, our global share ofvoice in press increased from 20% to 24%, strengthening ourstrong No. 2 position.
Engaging with our clients andcandidates
The level to which our clients are engaged with our activities issystematically measured and benchmarked in all majormarkets and in comparison with all major competitors.
Brand imageTNS Nipo has conducted the Randstad Brand Tracker surveysince 2004. This international study covers all countries inwhich Randstad is active. Its main purpose is to monitor thepositions of the Randstad brands twice a year, compared toour competitors and selected other benchmarks, by measuringawareness, consideration, preference, recommendation, andthe image of our brands.
We also measure our brand image using an internationalmethodology for rating brands in different productcategories. We ask our target groups to what extent theyassociate 48 attributes − such as innovation, integrity, socialresponsibility, and best brand − with Randstad and competingHR services companies.
Net Promotor Score (NPS)The Net Promoter Score represents the relationship betweentemporary employment agencies and their potential andactual candidates/clients. This indicator compares the numberof respondents who would not recommend the company inquestion with the number who would. Our goal is to alwayshave a Top 3 NPS score in our Top 15 markets (approx. 95% ofour total sales). In 2014, Randstad scored a Top 3 position in 10
value for our clients and candidates

39
annual report 2014 − Randstad Holding nv
countries (Belgium, Canada, India, Luxembourg, theNetherlands, Poland, Portugal, Spain, the UK, and the US),compared to six countries in 2013.
RepTrakIn addition, we use RepTrak, a standardized scorecard, toanalyze the company's reputation annually. This instrumentprovides us with detailed feedback on how our variousstakeholders perceive our company: how investors and clientsrate our performance, whether they are willing to support us,whether Randstad is a good place to work for employees andcandidates, and how Randstad is perceived in society in termsof governance, citizenship, and leadership. We have beenamong the Top 15 corporate brands in in the Netherlands formany years. The Reputation Institute's Global Pulse studymeasures 600 companies globally. Companies are rated intheir home country only. The graph below shows Randstad'sreputation within the global services industry (on a scale of 0to 100). Although scores have decreased somewhat comparedto 2013, Randstad still has the highest ranking in theinternational peer group.
Candidate engagementThe level of candidate engagement with our activities issystematically measured and benchmarked in all majormarkets and against all major competitors, by measuringcandidate awareness, consideration, and preference, as well asrecommendation through the Net Promoter Score. Inprinciple, the tools described for clients are also used withregard to candidates.
Several of our operating companies also monitor client andcandidate satisfaction through bespoke surveys, ISO and othercertification systems, and review meetings. If we do our jobwell, candidate engagement should be reflected in ourcandidate job satisfaction surveys. Candidates should valueRandstad for its reliability and the quality of its service, andrecognize it as an authority on the global employmentmarket.
Randstad WorkmonitorOne of our key measuring tools is the Randstad Workmonitorsurvey. This survey includes the Mobility Index, trackingemployee confidence and capturing expectations with regardto the likelihood that people will change employers withinthe next six months. The Randstad Workmonitor provides acomprehensive understanding of job market sentiments andemployee trends. In addition to measuring mobility, it alsomeasures employee satisfaction and personal motivation. Thesurvey includes a rotating set of themed questions. It isconducted via an online questionnaire among a populationaged 18−65, working a minimum of 24 hours a week in a paidjob (not self-employed). The minimum sample size is 400respondents per country.
First introduced in the Netherlands in 2003, the survey nowcovers 33 countries around the world, encompassing Europe,Asia Pacific, and the Americas. The Randstad Workmonitor is
published four times a year, making both local and globaltrends in mobility regularly visible over time. The results arepublished on our corporate website. Topics surveyed by theRandstad Workmonitor in 2014 include the impact of ahealthy lifestyle on performance at work, teamwork andcollaboration, drivers for switching jobs, and the rise oftechnology.
Number of candidates workingIn order to determine our success across the various markets inwhich we operate, we also regularly monitor the number of
Randstad's reputation within the global services industry
80
70
60
50
40
30
20
68.565.0
2014 2013
63.861.4
2014 2013
56.556.7
2014 2013
55.455.4
2014 2013
53.854.7
2014 2013
Randstad (NL) Mitie (UK) Ladbrokes (UK)
Capita(USA)
Adecco(Switzerland)
Source: Reputation Institute’s Global Pulse study 2014
Average number of candidates working per geography
as % of total number of candidates working per day
North America Germany Iberia
France Belgium & Luxembourg Other European countries
Netherlands United Kingdom Rest of the world
total
20
11
19%
10%
10%
3%
7%
8%
13%
12%
18%
580,300
20
12
20
13
20
14
19%
6%
9%
4%9%
4%8%
8% 10%
15%
16%
13%
576,800
19%19%
6%8%
8%
4%
7%7%
9%
15%
14%13%
14%
18%
581,700
18%
567,700

40
annual report 2014 − Randstad Holding nv
candidates we place with our clients, as well as our marketshare across countries. See the graph 'Average number ofcandidates working per geography' for more details on thedevelopment per region. Performance relating to marketshare can be found in the section 'Country performance'.
Number of permanent placementsMatching candidates with clients for temporary assignmentshas always been the biggest part of our business. However,over the past few years, permanent placements have becomea growing proportion of our daily work. The table 'Number ofpermanent placements' reflects the 2014 numbers comparedto 2013, broken down by geography.
Number of permanent placements
2014 2013
North America 19,900 18,400
France 21,000 15,300
Netherlands 6,800 4,000
Germany 3,100 2,400
Belgium & Luxembourg 2,700 2,900
United Kingdom 9,100 8,200
Iberia 9,100 6,800
Other European countries 9,800 6,700
Rest of the world 23,900 21,000
Group 105,400 85,700
Diversified workforcesWe value diversity. We do not discriminate on the grounds ofage, skin color, disability, gender, marital status, nationality,race, religion, or sexual orientation, and we have a non-discrimination policy to underline this. Many of our operatingcompanies have long-standing diversity and reintegrationprograms, and some provide consultancy services to clients onequal opportunity and competency management. By forginglinks with local community stakeholders, including public,private, NGO and institutional partnerships, we stimulatediversity in the workplace. Our Randstad Institute in Franceand our foundations in Germany and Spain provide access toemployment for disadvantaged groups, such as immigrantworkers, women at risk, victims of domestic violence, singleparents, older workers, and the long-term unemployed.Addressing the challenges that the growing number of olderworkers face in entering, re-entering or staying active in theworkforce is also a part of our approach for furtheringemployment market sustainability.
In line with our aim to promote diversity in our workforce, wealso welcome candidates with a disability. We have found thatregistration of disabled candidates varies in the differentcountries in which we operate. This may be related to locallegislation, but also to the personal wishes of the peopleconcerned. We are looking for ways to get a better overviewof the exact numbers of disabled candidates we are
employing. In several countries, registration of minorities isnot allowed, which means we have no validated data atGroup level. We are running a variety of local programs toadvance employment participation of minority groups.
Dialogue with clientsOur consultants receive training and support to enable themto promote diversity in their clients' workforces. We condemnagencies that cooperate with clients to exclude candidateswith specific ethnic backgrounds. We organize seminars androundtables with clients to raise their awareness aboutselecting personnel based on actual skills and personal merit.
Employment-market expertise: Randstad AwardFinding and retaining the right talent is an ongoing challengefor many companies, including our clients. It is thereforecrucial to know how a company is perceived by potentialemployees: What attracts them to a specific company orsector? And what drives their choice for one employer overanother? The Randstad Award survey, first launched inBelgium in 1999, is the largest independent employerbranding study in the world, including over 200,000respondents across 23 countries (expanded from 18 in 2013).
Respondents are asked which aspects they value in companieswhen choosing a new employer. They are then asked whetherthey know the 150 companies selected in that specificgeography and whether they would like to work for thosecompanies. Ranking the most attractive industry sectors andranking the means candidates use to look for a new job arealso part of the survey. Our research provides vital insights intohow one can best build a company's talent attraction andengagement strategy, and drive future business success. TheRandstad Award is an excellent benchmarking tool forensuring companies' continued success in increasinglycompetitive talent markets. Randstad Award events are heldin the participating countries, attracting all key players in thelocal HR industry.
In addition to the local Randstad Awards, 2014 saw the launchof the Global Randstad Award for the most attractiveemployer worldwide. This company was elected from a list ofthe 50 largest companies worldwide, based on a set ofobjective criteria: the largest number of employees incorporate/profit organizations (governmental organizationsare excluded), operating in at least 25 countries, under thesame company name in all countries, with a minimum of 30%of its employees outside the home country. The winner of thefirst Global Randstad Award was BMW, the first runner-upwas Sony, and the second runner-up was Samsung.
In 2014, the Randstad Award measurement methodology wascross-linked to our Great People Survey, giving us one of themost sophisticated databases of this kind in the world.
Employability advancementOngoing skills development is essential for employability andsustainability in any workforce. Our training programs are
value for our clients and candidates

41
annual report 2014 − Randstad Holding nv
tailored to meet the needs of clients and candidates inindividual employment markets. Such programs includecourses specific to IT, sales, call centers, hospitality, andtechnical skills. Specialized programs leading to additionalprofessional qualifications are also part of training anddevelopment. The development of funds invested in trainingand development of candidates in recent years is shown in thegraph 'Candidate training costs'.
Candidate training costs
in millions of €
80
70
60
50
40
30
20
10
0
2012 2013 20142011
72.3
67.671.8
75.5
From unemployment to employment: YouthunemploymentOur operating companies offer an array of initiatives to assistpeople in getting the right job. In 2013 and 2014, RandstadNetherlands launched ‘Jeugd op zoek’ (‘Youth on the move'program). The program was very successful, withapproximately 10,000 young people assisted in finding a job injust five weeks, with the participation of the government.40% more young people found work than would have beenthe case without assistance. Of the young people who foundjobs through the 2013 program, 75% are still in employment,clearly reflecting the longer term benefits of the program.
Youth unemployment at large is projected to rise to 12.8%globally by 2018. But unemployment does not paint the totalpicture, as many who have left education do not even appearin labor market statistics. The risks posed by having an entiregeneration ‘scarred’ by negative long-term effects haveprompted many governments to take firm action. However,government programs cannot solve the entire issue alone, andwell-coordinated efforts must come from all key stakeholders,including employers, trade unions, NGOs, and young peoplethemselves.
Recognizing skills and striving for an inclusive labor marketare key to helping youth navigate their way to sustainedemployment. Improving youth labor numbers requires an in-depth understanding of employment and labor market issuesat local country level. Effective cooperation between theprivate employment industry and various public partners willbe the recipe for success in combatting youth unemployment.
A healthy and safe work environmentCaring for people is embedded in our core values, which forma mandatory part of our induction programs. It is in thiscontext that our consultants work with clients and candidatesto support workplace safety. Several of our operatingcompanies have specialized health and safety managers toprovide guidance. We take a stance in advising our clients onmatters of occupational health and safety; for example, bypointing out how to prevent workplace risks and by providing'security at work' training. Formal audits at client locations areconducted in some business areas, such as construction, wheretaking extra health and safety precautions is best practice.
An example is Randstad Argentina. They run a dedicatedprogram to reduce the number of occupational accidents anddiseases among candidates, and they do so through a multi-stakeholder approach: all relevant parties (Randstad, clientcompanies and their (staffing) employees, health and safetyprofessionals, and insurance companies) are involved, andcontribute to a proactive process of accident prevention. Theirprevention plan builds on an analysis that they made ofworkplace accidents with clients, resulting in 'diagnoses' withrecommendations, notably a culture change in the care forpeople and secure working conditions, improving safetyprocedures and compliance with existing legislation, andtraining.
Health and safety is also an ongoing topic at the EuropeanPlatform meetings, a Randstad network of national workscouncil representatives, in which candidates are alsorepresented.
All employees across the labor market have a right to ahealthy and safe work environment. Our health and safetymanagement is organized locally at operating company level,designed to safeguard business continuity and deal with risks.Our operating companies adhere to all applicable localstandards and regulations, and many of them have asophisticated health and safety structure in place. We tracksickness rates, work-related accidents or incidents resulting inlost-time injury, and work-related fatalities, both foremployees and candidates. Fatal incidents are immediatelyreported to the Executive Board.
In the past year, we provided work to over two millionpeople. Our first duty as a company is to make sure we do notsend anyone into a work environment that may be harmful tothem. Despite our best efforts, we still have to report anumber of accidents in the workplace. Accidents may causeinjuries. The aggregated number of work-related injuriesamong our candidates globally amounted to 23,134 (2013:20,380), while the number of working days lost due to theseinjuries added up to 308,831 (2013: 298,776). Based on thesedata, our 'injury rate' is 0.2%.

42
annual report 2014 − Randstad Holding nv
Much to our regret, we were also confronted with fatalincidents among candidates:
Number of fatal incidents among candidates, 2014
2014 2013
At work
Germany 1 2
Belgium & Luxembourg 1 1
France - 3
USA - 1
India 1 1
In traffic (while working)
Turkey - 1
India 1 3
4 12
When, in spite of our efforts to ensure safety, accidentshappen, we always undertake an investigation to establishthe reason. Not all accidents are avoidable by betterprocedures. For instance, in one case in India, the cause was aheart attack. In two other cases, we worked closely with ourclients to further improve safety conditions and instructions.
We treat prevention, training and safety awareness in generalas very important subjects. We realize that while a zero scoremay prove impossible to achieve at the scale we operate, thisis nevertheless the only acceptable target to strive for.
value for our clients and candidates

43
'Candidates knowwe will always doour best to makesure they canbecome what theywant to be.'
Almost everyone alive hasbeen a candidate for a job atsome stage of their life, andmost of us multiple times. So,we are all familiar with thequestions that arise inpeople’s minds at suchmoments. Will I have goodcareer opportunities? Whatwould be a good job for meanyway? Will I find fulfillmentin my current job – or in thenext one? The world of workis changing rapidly, careers forlife are becoming lesscommon, and many peoplefind flexible employmentoptions increasingly attractive.
Our role is to give as manypeople as possible access tojobs, providing them withoptions for personal growthand development. We do sowith respect for health andsafety, and we do notcompromise on integrity. Inseveral countries we are verywell-known for our offers oftemporary jobs, butincreasingly, we are alsorecruiting for permanent jobs,project assignments andsecondments. We want to beas inclusive as possible, andwe pay special attention tolifting people out of
unemployment, and tofinding opportunities forpeople who are at adisadvantage in some way –through a disability, forinstance. We span thespectrum from the factoryfloor all the way toprofessional specialists andmiddle management – andsometimes beyond. Our aim isto be the preferredintermediary – preferredbecause our candidates knowwe will always do our best tomake sure they can becomewhat they want to be.
how I becamecandidates

44
annual report 2014 − Randstad Holding nv
Our strategy: best people
strong concepts
we create and
manage a balanced
workforce by
connecting
candidates with
suitable employment
opportunities
we attract bright,
agile and adaptable
employees and
challenge them
to outperform
towards clients
and candidates
simultaneous promotion of all interests: we help to maximize future employment and economic growth
and we create shareholder value
best people excellent execution
we aim to be the
most attractive
employer for
our employees
our strong concepts
drive excellent
development
opportunities for
our employees
from strategy to value creation
clients
employees
candidates
we use best practices
and proven procedures
to ensure candidate
engagement and first-
class service delivery
superior brands
we guarantee to our clients
that they will receive the
highest quality service and get
access to the best candidates
we are well-known for making
the best jobs available and
giving people the opportunity
to develop their talents
superior brands help us to
recruit and retain the best
people
strategic building blocks
stakeh
old
ers
our high-performance
culture helps us to
recruit, retain and
develop the best people
simultaneous promotion of all interests: we help to maximize future employment and economic growth
and we create shareholder value
we create and
manage a balanced
workforce by
connecting
candidates with
suitable employment
opportunities
we use best practices
and proven procedures
to ensure candidate
engagement and first-
class service delivery
we guarantee to our clients
that they will receive the
highest quality service and get
access to the best candidates
we are well-known for making
the best jobs available and
giving people the opportunity
to develop their talents
society
including
investors
The true value of our business lies in our people. We need toattract the best people, and invest in their development. Wewant to challenge them to perform to the best of their abilityand seize the opportunities a multinational company has tooffer. We aim to be the most attractive employer for ourcorporate employees, with equal opportunities for all. That iswhy 'best people' is one of our strategic building blocks.
Making strong concepts work
The ‘best people’ building block acknowledges theimportance of our corporate staff in maintaining and buildingon our success and position in the market.
Attracting, recruiting, developing and retaining the bestpeople is key to making our strong concepts work in practice.Randstad attracts agile and adaptable people, capable ofeffectively dealing with and responding to rapidly changingcircumstances. Having the best people enables us to deliverthe best and most innovative services to our clients.
A strong and state-of-the-art human resources function is keyto this ambition, and drives quality and discipline with regardto processes such as performance management, talent andleadership development, organization design anddevelopment, employer and employee branding, andemployee engagement.
In order to integrate 'best people' into our globalenvironment, we developed clear and simple HR Standards.These standards are designed to guide our HR professionals incontinuously supporting and improving our people and theirperformance. This will enable us to take our HR community tothe next level and become the employer of choice. Our HRStandards form a common language and structure that helpsus pursue our shared goals. They describe our core processesand procedures, explain how we can excel in our execution,and provide guidelines for achieving continuousimprovement. In 2014, the HR Standards were refreshed andrevised, and key HR metrics were added. All operatingcompanies have conducted self-assessments with regard to
the HR Standards and have written an action plan based onthe outcome.
Recruiting the best people
Who we look forSuccessful recruitment means hiring people with the rightskills and competencies, who also fit within our culture andvalues. We hire people for a career, not just for a job. Toattract the best and the brightest in all our markets, wecontinuously work on and invest in our employer brand.
Great People, Great OpportunitiesOur Employee Value Proposition 'Great People, GreatOpportunities' expresses the commitment that Randstad andits employees have made to each other. It specifies whatRandstad offers in return for its employees' contribution andperformance. This is what makes us unique and differentiatesus from the competition, answering the question: Why shouldsomeone join and/or stay at Randstad?
Our employees played a key role in developing our EmployeeValue Proposition. In this creative process, we involved around800 of them from different levels, concepts and geographies.The result was 'Great People, Great Opportunities'. Thisexpresses the idea that the most valuable brand in theindustry attracts the best people. Anyone who works with usis assured of working with the industry’s best talent. Ouremployees consistently tell us that career developmentopportunities, the professionalism of co-workers, and ourvision and values are unique in the world of recruitment.
These are the characteristics that make Randstad unique:
Great people, great opportunities
gre
at
peo
ple
, b
eca
use
we:
work together
are customer-focused
can be trusted
are proactive
are driven and motivated
are high achievers
care about details
are industry experts
gre
at
op
po
rtu
nit
ies,
beca
use
we o
ffer:
diverse career paths
global mobility
international trainee programs
world league programs
a valuable brand
a highly dynamic environment
80% internal promotions
VSO volunteering assignments
value for our employees

45
annual report 2014 − Randstad Holding nv
Developing the best people
Induction program, individual development plan andmiddle-management trainingEmployees who are trained, engaged and skilled performsignificantly better and are more likely to stay than those whoare not. Helping both new and existing employees tounderstand the strategy and culture of the organization aswell as their individual job requirements is crucial in drivingtheir individual effectiveness and satisfaction level. This is whyall new employees, as well as employees starting in a newrole, follow a formal induction program within the first fewmonths of starting in their new position. The program coversour ambitions, strategy, values, culture, history, and corporatepolicies, as well as targeted and relevant job-relatedinformation designed to help employees become effective intheir new role as quickly as possible.
For newly hired senior leaders we conduct a selectionassessment center, to make sure we get the best talent in themarket and we draw up a relevant and accurate individualdevelopment plan (IDP) to get them up to speed as soon aspossible.
Immediately after the induction program, the IDP starts, withthe aim of getting the employee fully operational within sixmonths. IDPs will continue to play a key role during everyemployee's career within Randstad. They are not only basedon formal training programs (10%), but more importantly,they focus on 'on-the-job learning' (70%) and coaching (20%).For field positions, we have dedicated training programs thatbuild on operational skills and knowledge, such as getting toknow the market, clients, candidates, and our concepts.
Although local operations are provided with a blueprint oftopics and content that should be covered in the trainingprograms, local HR collaborates with field and localmanagement to develop and deliver relevant learningprograms.
Learning is one of our HR Standards. Annually, we assess ifand how local companies improve on their trainingrequirements, and we check the efficient implementation ofour concept structures. In 2014, we focused on training anddeveloping our higher and middle management on coachingtheir teams in the efficient and effective implementation ofactivity-based field steering (ABFS). Paying special attention toABFS, we aim to accelerate productivity improvements.
Learning and developmentOur founder, Frits Goldschmeding, was a pioneer in the labormarket in the 1960s. The entrepreneurial spirit he instilled isstill alive in the Randstad culture today. Our culture is andalways has been open, friendly, professional and driven. Infact, the diversity of the company and our market is sodynamic that many people stay with us for a long time.
We invest in our people and create opportunities for them toachieve their potential. As we hire for careers, not just forjobs, learning and development is crucial; it is a key driver inestablishing a high-performance culture, and thus in growingthe business.
Learning and development at Randstad comprises thefollowing:- A formal induction for all new employees and for those
changing roles;- On-the-job learning to develop employees within their
roles;- Coaching to support employees in achieving specific
personal or professional goals;- Formal training programs that develop the knowledge,
skills and competencies required for continued careerdevelopment within Randstad.
Information about training costs and hours for corporateemployees can be found in the graphs 'Employee trainingcosts' and 'Employee training hours'.
Employee training costs
in millions of €
25
20
15
10
5
0
2012 2013 20142011
17.615.7 16.2
20.5
Induction Management & leadership programs Other training
Total training hours 2014: 606,906
47%
15%
38%
29%
Employee training hours 2014
Total training hours 2013: 544,921
51%
20%
Frits Goldschmeding AcademyAs part of the formal training programs, the FritsGoldschmeding Academy offers state-of-the-art leadershipprograms, designed to support our future leaders indeveloping the skills and strategic management capabilities toensure their success within the global business world. Theseleadership programs offer a unique forum that enablesRandstad's senior managers to exchange know-how and
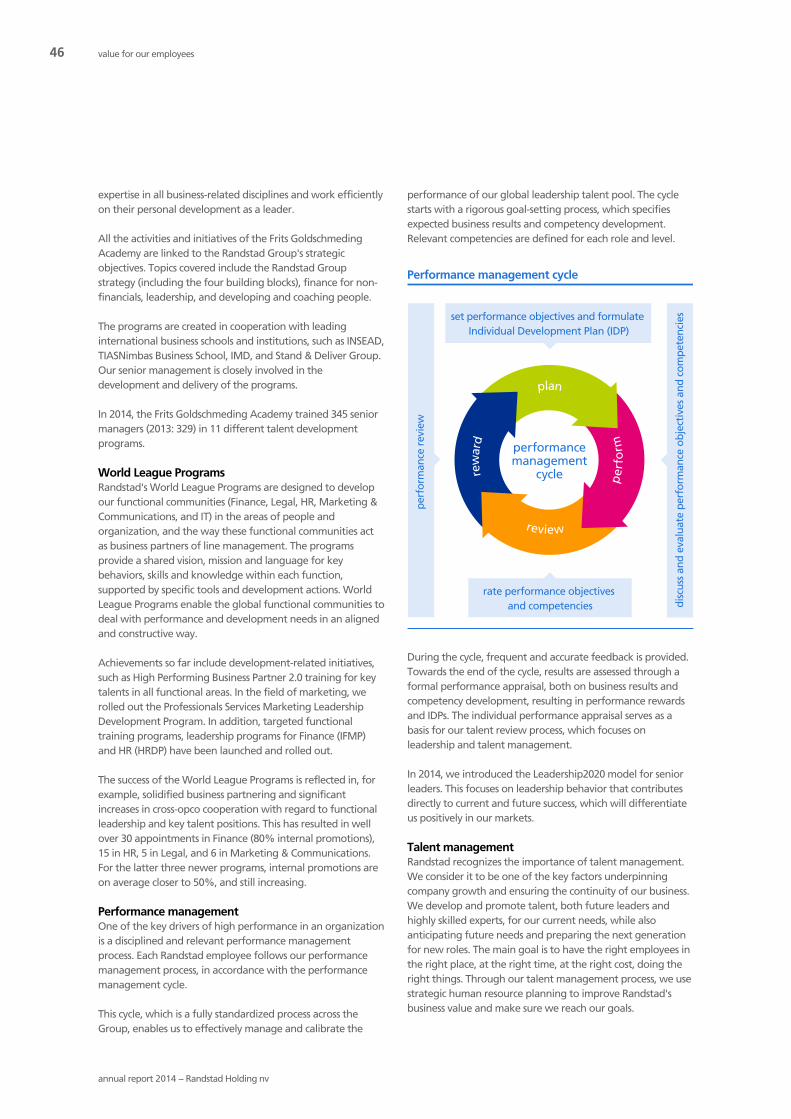
46
annual report 2014 − Randstad Holding nv
expertise in all business-related disciplines and work efficientlyon their personal development as a leader.
All the activities and initiatives of the Frits GoldschmedingAcademy are linked to the Randstad Group's strategicobjectives. Topics covered include the Randstad Groupstrategy (including the four building blocks), finance for non-financials, leadership, and developing and coaching people.
The programs are created in cooperation with leadinginternational business schools and institutions, such as INSEAD,TIASNimbas Business School, IMD, and Stand & Deliver Group.Our senior management is closely involved in thedevelopment and delivery of the programs.
In 2014, the Frits Goldschmeding Academy trained 345 seniormanagers (2013: 329) in 11 different talent developmentprograms.
World League ProgramsRandstad's World League Programs are designed to developour functional communities (Finance, Legal, HR, Marketing &Communications, and IT) in the areas of people andorganization, and the way these functional communities actas business partners of line management. The programsprovide a shared vision, mission and language for keybehaviors, skills and knowledge within each function,supported by specific tools and development actions. WorldLeague Programs enable the global functional communities todeal with performance and development needs in an alignedand constructive way.
Achievements so far include development-related initiatives,such as High Performing Business Partner 2.0 training for keytalents in all functional areas. In the field of marketing, werolled out the Professionals Services Marketing LeadershipDevelopment Program. In addition, targeted functionaltraining programs, leadership programs for Finance (IFMP)and HR (HRDP) have been launched and rolled out.
The success of the World League Programs is reflected in, forexample, solidified business partnering and significantincreases in cross-opco cooperation with regard to functionalleadership and key talent positions. This has resulted in wellover 30 appointments in Finance (80% internal promotions),15 in HR, 5 in Legal, and 6 in Marketing & Communications.For the latter three newer programs, internal promotions areon average closer to 50%, and still increasing.
Performance managementOne of the key drivers of high performance in an organizationis a disciplined and relevant performance managementprocess. Each Randstad employee follows our performancemanagement process, in accordance with the performancemanagement cycle.
This cycle, which is a fully standardized process across theGroup, enables us to effectively manage and calibrate the
performance of our global leadership talent pool. The cyclestarts with a rigorous goal-setting process, which specifiesexpected business results and competency development.Relevant competencies are defined for each role and level.
Performance management cycle
performancemanagement
cycle
plan
rew
ard
review
pe
rfo
rm
perf
orm
an
ce r
evi
ew
set performance objectives and formulate
Individual Development Plan (IDP)
rate performance objectives
and competencies dis
cuss
an
d e
valu
ate
perf
orm
an
ce o
bje
ctiv
es
an
d c
om
pete
nci
es
During the cycle, frequent and accurate feedback is provided.Towards the end of the cycle, results are assessed through aformal performance appraisal, both on business results andcompetency development, resulting in performance rewardsand IDPs. The individual performance appraisal serves as abasis for our talent review process, which focuses onleadership and talent management.
In 2014, we introduced the Leadership2020 model for seniorleaders. This focuses on leadership behavior that contributesdirectly to current and future success, which will differentiateus positively in our markets.
Talent managementRandstad recognizes the importance of talent management.We consider it to be one of the key factors underpinningcompany growth and ensuring the continuity of our business.We develop and promote talent, both future leaders andhighly skilled experts, for our current needs, while alsoanticipating future needs and preparing the next generationfor new roles. The main goal is to have the right employees inthe right place, at the right time, at the right cost, doing theright things. Through our talent management process, we usestrategic human resource planning to improve Randstad'sbusiness value and make sure we reach our goals.
value for our employees

47
annual report 2014 − Randstad Holding nv
Talent management enables us to:- Attract high-caliber people;- Identify and develop our talents;- Continuously anticipate needs for future positions on local
and global level.
Talent management at Randstad is a continuous processapplicable to all employees, aimed at driving highperformance. Our integrated talent management approachconsiders the entire employee life-cycle, from start to finish,and covers all activities that are aimed at making ouremployees as successful as possible. Talent management istherefore the responsibility of everyone within HR, inpartnership with management.
Our talent management efforts always begin at an individuallevel, with the employee and the manager setting targetstogether and jointly shaping the employee's IndividualDevelopment Plan (IDP). The employee's performance onbusiness targets and competency development is subsequentlymeasured, and the outcome serves as input for the reshapingof the IDP and the Talent Review. The annual Talent Reviewprocess is the foundation of Randstad's leadership and talentmanagement throughout the company, from the lowestorganizational level up to senior management. This processaddresses performance and potential of all employees on anindividual level. The Talent Review concludes with an in-depthreview by the Executive Board and Group HR, focusing on ourstrategic human resource planning and subsequently on thestrengths and development needs of our senior leadership,succession plans, pipeline development, and future leadershiptalents.
Global mobilityRandstad has a global footprint. This requires our local leadersto be able to operate effectively and comfortably in aninternational environment. The nature of our company provides ample opportunity foremployees to further develop leadership skills, acquire andbuild a global mindset and awareness, and effectively manageand leverage cultural differences. Relevant internationalassignments have proven to be an effective way to furtherdevelop such skills. In addition, we are convinced that no one understands ourbusiness and concepts better than our own employees, andwe are always looking for ways to leverage knowledge andexpertise from our own staff, both locally and on a globalscale.
Currently, Randstad has 35 international assignees in 14countries.
Retaining the best people
80% of our leadership roles filled internallyWe believe strongly in developing talent within the company,and we therefore aim to fill 80% of our leadership rolesinternally. This 80% ambition applies in our mature Staffingand Professionals markets. Compared to 2013, we saw anupward move towards the 80% mark in 2014. The actualscore in 2014 was 74.6% (2013: 73.9). The number of internalmanagement appointments (366) increased compared to 2013(354).
Internal management appointments by geography1
total number of
appointments
% internal
appointments
2014 2013 2014 2013
North America 127 197 89.0% 65.8%
France 35 45 71.4% 91.1%
Netherlands 2 42 35 92.9% 82.8%
Germany 11 8 54.5% 100.0%
Belgium & Luxembourg - 4 0.0% 100.0%
United Kingdom 3 27 9 59.3% 44.4%
Iberia (Spain) 4 13 75.0% 84.6%
Other European countries (Italy) 7 5 85.7% 80.0%
Rest of the world 74 19 55.4% 84.2%
Corporate 39 19 61.5% 78.9%
366 354 74.6% 73.9%1 Mature operating companies only (> 500 FTEs).2 Tempo-Team and Randstad Netherlands only.3 In 2013, the number refers to Staffing only.
We achieved a substantial improvement in North America, theNetherlands and the UK. We needed to recruit specializedknowledge in Germany and for our corporate head office, so
Number of international assignees, 2014
8
7
6
5
4
3
2
1
0
Aust
ralia
Bel
giu
m
Bra
zil
Can
ada
Chin
a
India
Japan
Mex
ico
Net
her
lands
Port
ugal
Singap
ore
Swed
enSw
itze
rlan
d
United
Kin
gdom

48
annual report 2014 − Randstad Holding nv
there's a decrease in internal management appointments. InFrance, Germany and Iberia there were less vacancies, so it wasmore difficult to reach the target. The other regions areperforming in line with expectations in terms of people andleadership development. The 80% ambition applies in ourmature Staffing and Professionals markets.
Historically, we have seen a rather high staff turnover raterelative to our total number of employees. This is common inour industry. The vast majority of our staff work as consultantsat our branches. They are relatively young, well-educated andambitious employees, who tend to move on in their careerafter working as a consultant. They are either promotedwithin the Group or they decide to leave the Group to workfor one of our clients or pursue other opportunities. Moreinformation on our staff turnover is shown in the table'Employee turnover rate'.
Employee turnover ratein % of total number of employees
2014 2013
Employees leaving the Group 23.4 23.6
Employees transferred within the Group 0.5 0.3
Total employees leaving their operating company 23.9 23.9
From employee engagement to Great PeopleOutperformanceLooking at our Great People Survey results last year, ourengagement score increased from 7.3 in 2013 to 7.6 in 2014.This is great news, as it is the first time that Randstad Grouphas reached such a score. We can proudly say that in 2014 wemet our company target of having an engagement score of7.5 or higher, and also our participation rate of 82% was the
highest yet (2013: 76%, target 70% or above). Locally, actionplans are created to further improve engagement.
Great People OutperformanceAs we are striving for continuous improvement, we want oursurvey approach to go beyond measuring engagement. Wewant to find out whether our employees see us as a companyoutperforming the market. Our business is built on ourpeople, so if we can empower and engage them through agood leadership style and organizational capabilities thatencourage innovation and accountability, we will makeRandstad an 'outperformance organization'. We startedmeasuring outperformance in 2014 and look forward toprogressing in this area.
our people empowerment and engagement
our leadership our organizational capabilities
Randstad outperformance
1 2 3
Randstad outperformance
A healthy and safe environment
Our operating companies use and report on a variety ofmeasures designed to advance employee well-being. Theseinclude procedures to promote safety at work and trainingprograms. In several countries, we have formal agreementswith trade unions on health and safety topics. For example, inthe Netherlands, our companies have agreed protocols withthe trade unions regarding absence due to sickness anddisability, all employees are covered by collective insurance,and reintegration partners need to be certified.
Our companies offer employees an array of programs, servicesand products to stimulate their well-being. These includediscounts on sports and wellness centers and sports clothing, arange of comprehensive health-care services (e.g., physicalcheck-ups, addiction prevention) and child care services (e.g.,help for sick children). As an example, in the Netherlands, wehave sports teams for rowing, field hockey, soccer, cycling andrunning, and there are on-site fitness facilities at the head-office.
Randstad has local crisis and continuity plans in line with aGroup template. The plans must contain at least thefollowing: key contacts during an emergency; a hazardanalysis with quick response reference; a business impactanalysis with possible responses to an emergency; a critical
Employee engagement by geographyon a 10-point scale, weighted
engagement score participation rate
2014 2013 2014 2013
North America 8.0 7.9 90.1% 74.3%
France 6.6 6.1 86.9% 84.5%
Netherlands 7.8 7.5 72.6% 73.1%
Germany 7.3 7.0 77.1% 73.3%
Belgium & Luxembourg 1 7.2 n.a. 69.2% n.a.
United Kingdom 7.6 7.5 75.3% 61.9%
Iberia 7.6 7.9 88.4% 83.6%
Other European
countries 7.5 7.2 86.2% 81.8%
Rest of the world 7.8 7.0 83.0% 78.2%
Corporate 8.1 8.2 89.9% 91.1%
7.6 7.3 81.6% 76.3%1 Belgium & Luxembourg did not participate in 2013.
Source: Great People Survey
value for our employees

49
annual report 2014 − Randstad Holding nv
functions priority list; and an action log. Serious securityincidents are reported − and in some cases dealt with − atcentral level.
We aim to achieve a sickness absenteeism rate that is lowerthan the national average. Group companies whose rate isabove their national average are required to implement aspecial program to improve their performance. In 2014, theoverall sickness absenteeism rate was 2.2% (2013: 2.1%). Thetotal number of working days that were lost due to sicknessabsence, amounted to 166,766 (2013: 154,329). In thosecountries where authorities publish sickness rates (mostlyEurope), our own sickness absenteeism rates were in virtuallyall cases lower than the national averages; only Germany andSpain were slightly higher.
Despite our high safety standards and prevention measures,we have not been able to prevent all accidents. In 2014, wewere faced with incidents in the workplace, causing 244 (2013:394) injuries among our corporate employees. The number ofworking days lost due to these injuries amounted to 1,564(2013: 2,881). This results in an overall injury rate of 0.04%.Much to our regret, one employee (in Germany) died duringwork, caused by a heart attack.
Diversity and inclusion
Workforce equalityAt Randstad, we have a policy of hiring and promoting thebest person for the job, based on proven performance andpotential assessment. While doing this, we do not discriminateon the basis of age, skin color, disability, gender, maritalstatus, nationality, race, religion or sexual orientation. This isconfirmed in our business principles and in the Randstadpolicy regarding discrimination, intimidation, and harassment.We stimulate equality in the workplace by taking affirmativeaction to support the advancement of minority groups.
Value in diversityRandstad does not look at diversity from a complianceperspective, but from a value-add perspective. Having a strongfocus on diversity will help us solve the emerging talentshortage, contribute to creativity and innovation, employeeengagement, and brand reputation, and realize our strategictargets. We link diversity with inclusion, thereby building astrong organizational culture that fosters diversity andinclusion, so that all employees can contribute to their fullpotential and are provided with equal opportunity ofadvancement in their careers at Randstad.
Gender diversityRandstad has been dedicated to furthering the role of womenin business since the company was founded in the 1960s. Werecognize the need to have women in leadership roles andthe positive business impact of having gender diversity at thehighest levels. Our flexible work environment, as well asRandstad’s training and career advancement programs, makeus an attractive employer for both men and women. Theoverall percentage of women in senior management atRandstad has been relatively stable over the past few years(see the table 'Proportion of women in senior management'),but we are committed to encouraging women to climb the'corporate ladder', and we continue to offer them the righttools and processes to support them in moving up.
Composition of our workforce by gender
2014 2013
Male full-time 30.6% 30.2%
Male part-time 1.5% 1.5%
Female full-time 52.7% 52.4%
Female part-time 15.2% 15.9%
Total 100.0% 100.0%
Composition of our workforce by type of contract
2014 2013
Permanent/open-term contract 90.2% 91.0%
Fixed-term contract 9.8% 9.0%
Total 100.0% 100.0%
Composition of our workforce by age group1
Age group 2014 2013
18 - 24 5.4% 4.9%
25 - 29 20.9% 19.7%
30 - 34 22.5% 22.8%
35 - 39 17.9% 18.9%
40 - 49 24.3% 24.6%
50+ 9.0% 9.1%
Total 100.0% 100.0%1 Belgium & Luxembourg did not participate in 2013.
Source: Great People Survey

50
annual report 2014 − Randstad Holding nv
Proportion of women in senior management1
% women in organization % women in senior management positions
2014 2013 2014 2013
North America 60.5 62.4 49.1 48.1
France 76.9 77.0 47.9 45.7
Netherlands 70.9 71.4 36.7 33.8
Germany 59.5 63.7 40.5 44.0
Belgium & Luxembourg 2 85.0 n.a. 58.8 n.a.
United Kingdom 59.5 59.1 45.9 38.8
Iberia 77.9 77.9 52.8 54.1
Other European countries 78.1 75.3 53.4 48.4
Rest of the world 56.5 56.9 39.9 37.6
Total 67.5 66.8 45.2 43.21 Senior management refers to all levels equal to or above district/regional management, including account management or commercial management reporting to a regional
director or higher.2 Belgium and Luxembourg did not participate in 2013.
Source: Great People Survey
value for our employees

51
'Careers atRandstad rangefrom uniquecommercial careersto rewardingfunctional careersin, for instance,finance, marketingand, of course,HR.'
Our corporate story starts withhow our founder began ourcompany in his student dorm,and went on to become oneof the most fabled Dutchbusinessmen. He once jokedin an interview: 'But that alsomeant I never got apromotion – I started as theboss and retired in the samejob'! For people joiningRandstad today, the situationis rather different. We taketalent development veryseriously. We have to, as it isour policy to fill 80% of ourvacancies with internalcandidates.
Careers at Randstad rangefrom unique commercialcareers (several of ourExecutive Board memberstoday started as consultants inour branches) to rewardingfunctional careers in, forinstance, finance, marketingand, of course, HR. We payattention to what it is that wecan offer our employees, our'employee value proposition'.We stimulate growth throughspecific training and develop-ment programs. And thanksto our Randstad Awardsurveys we know what thekey factors are that help us
to be an attractive employer.Randstad itself went from atwo-man-band in a smallcountry to a global leader bybeing serious about workingwith the best people. Butarguably the most importantelement in how we becamewhat we are today, is that wehave always preserved ourcore values. To promote theinterests of all stakeholderssimultaneously, to alwaysstrive for perfection, and towork according to ourmantra: 'to know, serve, andtrust'.
how I becameemployees

52
annual report 2014 − Randstad Holding nv
Randstad takes the lead in shaping the world of work bymatching people with companies that will help them developtheir potential, and matching companies with people who willwork to develop their business. On average, we employedalmost 600,000 candidates per day in temporary jobs, whilewe placed over 100,000 candidates in permanent positions.This means that we find jobs for about 2 million peopleannually. We seek to shape a more balanced society byactivating our employment knowledge and expertise throughsocial dialogue, social and economic growth, and byadvocating developments that benefit both individuals andsociety at large. We emphasize the role of the HR servicesindustry in creating jobs for young people and helping themfind their way in the world of work.
Our role in society
Our core values inspire us to conduct our activities, both insideand outside the corporate environment, in a sustainablemanner, and to use our knowledge and experience to make apositive contribution to the world around us.
For example, we can make a meaningful difference by usingour knowledge and services to influence diversity, socialcohesion and inclusion in the world’s employment markets.Research shows that countries with more developed HRservices markets typically have lower overall unemploymentand fewer people in long-term unemployment. These marketsare more inclusive and suffer less from unfair workingconditions, exploitation, and irregular work.
We are well-positioned to help address the growingchallenges the employment markets are facing around theworld. These challenges include structural shortages of skillsand talent, declining population growth, cultural changes inthe way new generations view work, as well as thedemographic challenges posed by aging populations in manyWestern economies.
Of course, we also need to address the sustainability issuescommon to all businesses, such as our environmental impactand how we affect the world around us. Our sustainabilityframework addresses those issues, and we measure our
progress in this area. This is an integral part of how wesafeguard our business and its long-term viability, whiletaking into account the interests of all our stakeholders. Atthe same time, we believe our industry has a uniqueopportunity to help create a truly sustainable future, bothsocially and economically, by literally shaping the world ofwork.
Stakeholder dialogue
One of our key surveys is the Randstad Workmonitor.Published four times a year, the Randstad Workmonitorreports make both local and global trends in mobility visibleover time. The results are published on our corporate website.
At the same time, we have developed leading programs toenhance employment market knowledge. Together withpartners such as SEO Economic Research (affiliated with theUniversity of Amsterdam), we have carried out studies into theimplications of future demographic shifts for the employmentmarkets in Europe, among which the 'Gap' series. Since 2013,Randstad has published flexibility@work, an annual report onflexible labor and employment. These and more examples ofour research can be found on our corporate website. In 2015,together with IZA (Institute for the Study of Labor) in Bonn(Germany), Randstad will carry out a study of theconsequences for the labor market of global (labor) migrationand mobility.
Besides Randstad's global research and publications, thecompany also collects industry insights and conducts researchthrough its operating companies around the world. This workyields a valuable source of information for local stakeholders.Relevant publications issued include the World of Workresearch (Asia Pacific), the Workpocket (Netherlands, Belgiumand others), various salary surveys tailored to specific targetgroups (e.g., the Professionals segment), white papers, andonline polls. More information is available on the websites ofthe respective operating companies.
HR Transformation ForumFollowing the creation of the Randstad HR Executive networkin the USA, which now counts more than 100 activeparticipants at the Chief HR Officer level, a similar initiativehas been set up in Europe. In 2014, Randstad hosted the first-ever HR Transformation Forum in Europe, bringing together17 HR directors from global companies based in Europe. Themanaging director of Group HR was the host and circulated arange of key HR points and dilemmas for this group to discussat length during the two-day meeting. The purpose of thesenetworks is to provide a ‘safe haven’ for C-level HR directors tocandidly discuss the issues they face in their companies’transformations, spur cross-industry fertilization of ideas, andlook at the global themes of the future.
The new HR Transformation Forum received much praise fromthe participants and will continue to evolve and encompass
strong concepts
we create and
manage a balanced
workforce by
connecting
candidates with
suitable employment
opportunities
we attract bright,
agile and adaptable
employees and
challenge them
to outperform
towards clients
and candidates
simultaneous promotion of all interests: we help to maximize future employment and economic growth
and we create shareholder value
best people excellent execution
we aim to be the
most attractive
employer for
our employees
our strong concepts
drive excellent
development
opportunities for
our employees
Creating value through our strategy
clients
employees
society
candidates
we use best practices
and proven procedures
to ensure candidate
engagement and first-
class service delivery
superior brands
we guarantee to our clients
that they will receive the
highest quality service and get
access to the best candidates
we are well-known for making
the best jobs available and
giving people the opportunity
to develop their talents
superior brands help us to
attract, recruit and retain
the best people
strategic building blocks
stakeh
old
ers
our high-performance
culture helps us to
recruit, retain and
develop the best people
we create and
manage a balanced
workforce by
connecting
candidates with
suitable employment
opportunities
we attract bright,
agile and adaptable
employees and
challenge them
to outperform
towards clients
and candidates
we aim to be the
most attractive
employer for
our employees
our strong concepts
drive excellent
development
opportunities for
our employees
we use best practices
and proven procedures
to ensure candidate
engagement and first-
class service delivery
we guarantee to our clients
that they will receive the
highest quality service and get
access to the best candidates
we are well-known for making
the best jobs available and
giving people the opportunity
to develop their talents
superior brands help us to
attract, recruit and retain
the best people
our high-performance
culture helps us to
recruit, retain and
develop the best people
society
including
shareholders
value for societyvalue for society

53
annual report 2014 − Randstad Holding nv
more topics going forward. Following the success of theexploratory meeting, the goal to hold two to three meetingsper year is expected to be met with enthusiasm by thoseinvited to take part.
Workforce360In 2012 and 2013, a digital thought leadership platform, calledWorkforce360, was initiated in the US and in Asia Pacific. Thisplatform was developed for the global audience on ourcorporate website (randstad.com) and unveiled in May 2014,coinciding with the re-launch of randstad.com. This platformoffers our stakeholders (clients, candidates, HR industryexperts, HR leaders, and others intersted in Randstad) thelatest industry insights, reports, research, and articlesportraying in-depth knowledge of key areas of expertise inwhich Randstad takes a leading stance. The platform isconnected from our website to a variety of social media andtargeted at our stakeholders to initiate dialogue, allowinganyone to offer input, ask questions, or give their opinion onthe topics we present.
Employment market KPIsIn accordance with our sustainability framework, we alsoreport on our contribution to employment markets. In thisrespect, two relevant KPIs are staffing penetration rates andour contribution to the regulation and deregulation of labormarkets. The former shows the development of the numberof temporary workers as a percentage of the total labormarket, while the latter provides the status of regulation inthe main countries in which Randstad operates, as well as theexpected trend.
A third relevant KPI is our involvement in national andinternational employment institutions. The overview 'HighestRandstad positions in industry associations' shows Randstad'sparticipation in staffing industry institutions in countrieswhere we are active and where such associations exist.
Apart from our involvement within these institutions, we arealso heavily engaged in key forums and other initiativesthrough which we focus on social dialogue. How we do this isdescribed under 'Industry involvement'. A list of all thememberships and partnerships we are engaged in can befound under 'Supplementary information'.
Our performance with respect to social involvement and ourpartnership with VSO can be found under 'Partnerships andsocial involvement'.
Shareholder returnWe maintain an active dialogue with existing and potentialshareholders, witnessed by the more than 500 contactmoments we had last year across the globe. By executing ourstrategy and achieving our mid-term targets (see 'Strategicpriorities and targets'), we believe shareholders will beawarded with improved dividends. Please refer to the investorrelations section for more information on this topic.
Industry involvement
We strongly believe that social dialogue and activeparticipation in industry bodies will help produce clear, fair,and workable regulations in the markets in which we operate.By investing in strong industry federations – on a national,regional, and global level – we believe we can contribute tothe future development of the HR services industry.
The objectives and action plans of Ciett (InternationalConfederation of Private Employment Agencies) and Eurociett(European Confederation of Private Employment Agencies)are well aligned with Randstad's agenda. In May 2014, ourGroup Public Affairs director was elected President of Ciett.She has already chaired Eurociett since 2005.
Labor market relationshipsRandstad's core value 'Simultaneous promotion of allinterests' lies at the heart of our labor market relationshipsand stakeholder dialogue.
Employee participation in social dialogueEmployee participation in social dialogue is promotedthrough a network of national works councils, in whichmanagers and employees across the Randstad Group regularlyaddress work- and HR-related issues. The results of thesedialogues are fed into the Randstad European Platform forSocial Dialogue, which meets twice a year to discuss policyissues and information relevant to Randstad Groupcompanies. UNI-Europa, the representative trade unionfederation for services in Europe, is invited to attend theinternational platform meetings as an observer.
Active dialogue with labor unionsRandstad also actively engages in national and internationaldialogue with labor unions. At EU level, UNI-Europa andEurociett meet regularly in the sectoral social dialoguecommittee on temporary agency work to discuss issues ofmutual importance, and to further professionalize and gainmore societal acceptance for the industry. As a Eurociettmember, Randstad is represented in the Eurociett delegation.Moderated by the European Commission's Directorate-General for Employment, Social Affairs and EqualOpportunities, the committee met three times in 2014. The2013/2014 work program included issues such as promotingsocial dialogue by giving presentations on national collectivelabor agreements (CLAs). For instance, we took part in a jointpresentation by the Italian sectoral partners on the newcollective labor agreement, and we closely followed theimplementation of the Agency Work Directive (AWD).Furthermore, a social roundtable meeting was held in Serbia,in order to gather sectoral social partners in the temporaryagency work sector. Within the framework of the sectoralsocial dialogue, a study is being conducted on comparingtemporary agency work with other forms of work. The resultswill be presented at a joint stakeholders event in February2015.
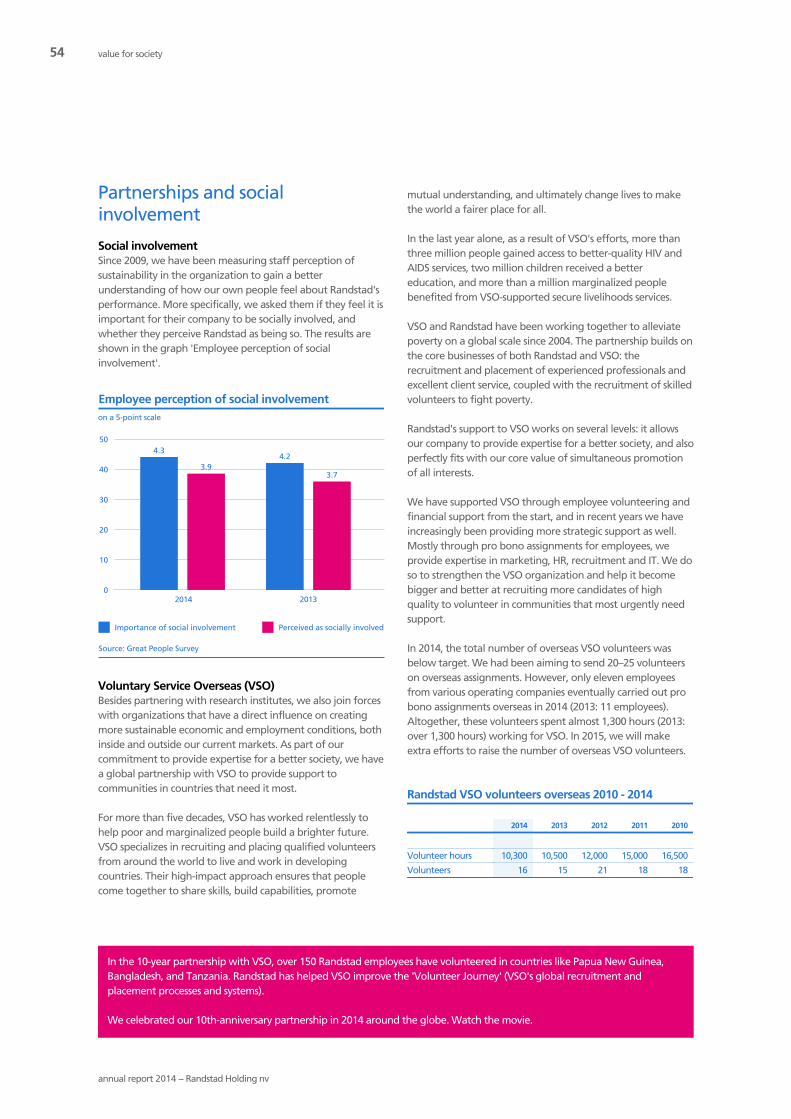
54
annual report 2014 − Randstad Holding nv
Partnerships and socialinvolvement
Social involvementSince 2009, we have been measuring staff perception ofsustainability in the organization to gain a betterunderstanding of how our own people feel about Randstad'sperformance. More specifically, we asked them if they feel it isimportant for their company to be socially involved, andwhether they perceive Randstad as being so. The results areshown in the graph 'Employee perception of socialinvolvement'.
Employee perception of social involvement
Perceived as socially involvedImportance of social involvement
on a 5-point scale
Source: Great People Survey
50
40
30
20
10
02014 2013
4.3
3.9
4.2
3.7
Voluntary Service Overseas (VSO)Besides partnering with research institutes, we also join forceswith organizations that have a direct influence on creatingmore sustainable economic and employment conditions, bothinside and outside our current markets. As part of ourcommitment to provide expertise for a better society, we havea global partnership with VSO to provide support tocommunities in countries that need it most.
For more than five decades, VSO has worked relentlessly tohelp poor and marginalized people build a brighter future.VSO specializes in recruiting and placing qualified volunteersfrom around the world to live and work in developingcountries. Their high-impact approach ensures that peoplecome together to share skills, build capabilities, promote
mutual understanding, and ultimately change lives to makethe world a fairer place for all.
In the last year alone, as a result of VSO's efforts, more thanthree million people gained access to better-quality HIV andAIDS services, two million children received a bettereducation, and more than a million marginalized peoplebenefited from VSO-supported secure livelihoods services.
VSO and Randstad have been working together to alleviatepoverty on a global scale since 2004. The partnership builds onthe core businesses of both Randstad and VSO: therecruitment and placement of experienced professionals andexcellent client service, coupled with the recruitment of skilledvolunteers to fight poverty.
Randstad's support to VSO works on several levels: it allowsour company to provide expertise for a better society, and alsoperfectly fits with our core value of simultaneous promotionof all interests.
We have supported VSO through employee volunteering andfinancial support from the start, and in recent years we haveincreasingly been providing more strategic support as well.Mostly through pro bono assignments for employees, weprovide expertise in marketing, HR, recruitment and IT. We doso to strengthen the VSO organization and help it becomebigger and better at recruiting more candidates of highquality to volunteer in communities that most urgently needsupport.
In 2014, the total number of overseas VSO volunteers wasbelow target. We had been aiming to send 20–25 volunteerson overseas assignments. However, only eleven employeesfrom various operating companies eventually carried out probono assignments overseas in 2014 (2013: 11 employees).Altogether, these volunteers spent almost 1,300 hours (2013:over 1,300 hours) working for VSO. In 2015, we will makeextra efforts to raise the number of overseas VSO volunteers.
Randstad VSO volunteers overseas 2010 - 2014
2014 2013 2012 2011 2010
Volunteer hours 10,300 10,500 12,000 15,000 16,500
Volunteers 16 15 21 18 18
In the 10-year partnership with VSO, over 150 Randstad employees have volunteered in countries like Papua New Guinea,Bangladesh, and Tanzania. Randstad has helped VSO improve the 'Volunteer Journey' (VSO's global recruitment andplacement processes and systems).
We celebrated our 10th-anniversary partnership in 2014 around the globe. Watch the movie.
value for society

55
annual report 2014 − Randstad Holding nv
In addition to these primary projects, Randstad participated inmany other volunteer projects in 2014, including sociallyinvolved and philanthropic initiatives. Examples of theseinitiatives can be found on our corporate website.
Attitude employees towards vso
Willingness to contributeAwareness of partnership
on a 5-point scale
Source: Great People Survey
50
40
30
20
10
02014 2013
4.0
3.0
3.5
2.8
10th anniversary of the VSO partnershipThe year 2014 was a very special one, as it marked the 10thanniversary of the Randstad–VSO partnership. Randstad hasproudly been one of VSO's key business partners, and,working side by side, we have achieved a lot together. As acompany, we are proud of and grateful to everyone inside
and outside our organization who has helped make thispartnership a success. In 10 years, more than 150 employeeshave volunteered in 30 different countries. The majority ofthese volunteers went to Namibia, Tanzania, Zambia,Bangladesh, and Indonesia.
We have celebrated this anniversary in various ways throughthe year. Highlights included the VSO logo featuring on theWilliams Martini Racing car instead of the Randstad logo atthe Silverstone British Grand Prix in July, to help boost VSOawareness across the globe. Randstad UK arranged a sought-after Formula One internship for a VSO ICS youth volunteer,and careers advice and support to another nine youthvolunteers.
In November, five lucky Randstad employees were flown tobeautiful Nepal for a five-day field visit. Hailing fromAustralia, France, India, Italy, and the US, they got toexperience first-hand what VSO does, meet with volunteers(including Randstad colleagues) and see the impact VSOmakes on the ground. Among other activities, the groupvisited the VSO program office and local partners CSRC(fighting for land rights and agrarian reform) and GlobalAction Nepal.
Click here for an overview of our 10-year partnership withVSO.
VSO's impactEducationOver 2 million children have benefited from the quality education services VSO supports, including more than 20,000 disabledchildren. Over 200,000 children have been helped to complete primary education, and 148,000 education practitioners havebeen trained.
HealthOver 2 million men and women in 21 countries have benefited from improved quality health services, and 21,800 healthpractitioners have received high-quality training.
HIV & AIDSOver 3 million people have benefited from quality HIV and AIDS services. Over 12,000 HIV and AIDS practitioners have beentrained.
Secure livelihoodsOver 1 million men and women have benefited from quality secure livelihoods services, and 28,000 partner practitioners havebeen trained in secure livelihoods services.
Disability66,000 men and women have benefited from VSO interventions on disability in 11 countries. Over 12,600 partnerpractitioners have been trained in national volunteering. Over 2.6 million days of national volunteering have been achievedacross 25 countries.

56
annual report 2014 − Randstad Holding nv
‘Shaping the world of work’ can only be achieved if attentionis also paid to sustainability ‘basics’. These range fromsafeguarding ethical behavior, applying decent environmentalcare, and taking supply chain responsibility to being a goodcorporate citizen and ensuring our organization istransparent. Our goal is to have a set of management tools,business principles, policies, and a governance structure inplace that are in line with, or exceed, the standard set for ourindustry, and that enable accountability for all elements ofour sustainability framework.
Business principles
Randstad's business principles are based on – and support –our core values. They project a positive message, help us liveup to our values, and ensure that the needs of the world inwhich we work and our business and personal behavior arealigned and reinforce one another. Our business principles canbe found in the 'corporate governance' section on ourcorporate website.
In 2010, all corporate employees followed a program thatcovered the company’s history, core values and businessprinciples. Since then, the business principles − coupled withour main policies − have been an integral and mandatory partof our global induction programs. Local induction trainingprograms include explanation of the business principles, somepolicies, and the misconduct reporting procedure. Businessprinciples training is now also included in our HR Standards,and in 2014 it became part of our key control framework toensure global execution.
In 2014, well over 8,500 people received business principlestraining. To set a minimum standard, a new complianceinduction training program, including even more extensivereference to the business principles and the corporate policies,has been communicated to all heads of legal and the HRcommunity. We are considering making this programcompulsory in 2015.
Understanding of the business principles is measured throughour annual Great People Survey, based on a 5-point scale. Ascore of 5.0 is achieved when all employees understand thebusiness principles. The results of this survey relating to theunderstanding of business principles can be found in the table'Understanding of business principles'.
To further enhance awareness of the business principles, theyare included in our HR Standards and communicated throughvarious internal communication channels across the Group.
Understanding of business principleson a 5-point scale
2014 2013
North America 4.3 4.3
France 4.1 4.0
Netherlands 4.3 4.2
Germany 4.6 4.5
Belgium & Luxembourg 1 4.4 n.a.
United Kingdom 4.1 4.1
Iberia 4.3 4.4
Other European countries 4.3 4.2
Rest of the world 4.5 4.0
Corporate 4.6 4.4
Group 4.3 4.21 Belgium & Luxembourg did not participate in 2013.
Source: Great People Survey
Corporate policies
Our corporate policies are directly linked to our businessprinciples. They provide our people all around the world withspecific guidance and instructions on their businessbehavior. We have developed corporate HR Standards basedon our values and principles, and our sustainability ambitions.They are designed to guide our HR community and tosafeguard the recruitment, development, and retention of ouremployees − our most important asset − and are essential forrealizing our strategic goals.
Over the years, we have developed policies related tocompetition law compliance; insider dealing; bribery, gifts andhospitality; discrimination, intimidation and harassment; anddata protection. These corporate policies are a mandatorypart of our induction training while they are highlightedduring refresher training, tailored to the position. Promotingbest practices and raising awareness of relevant laws andpolicies is an ongoing process worldwide. The policies arepublished on our intranet sites, and summaries of the policiesare published on our corporate website. Through our in-control framework (which includes the key controlframework), our operating companies certify, semi-annually,their compliance with these policies or explain any deviations.
In 2014, we made our existing tax policy more explicit. Asummary of this policy is now published on our corporatewebsite.
The policies and the sustainability framework are alsoincluded in our HR Standards, and form a mandatory part ofour induction training.
sustainability basics
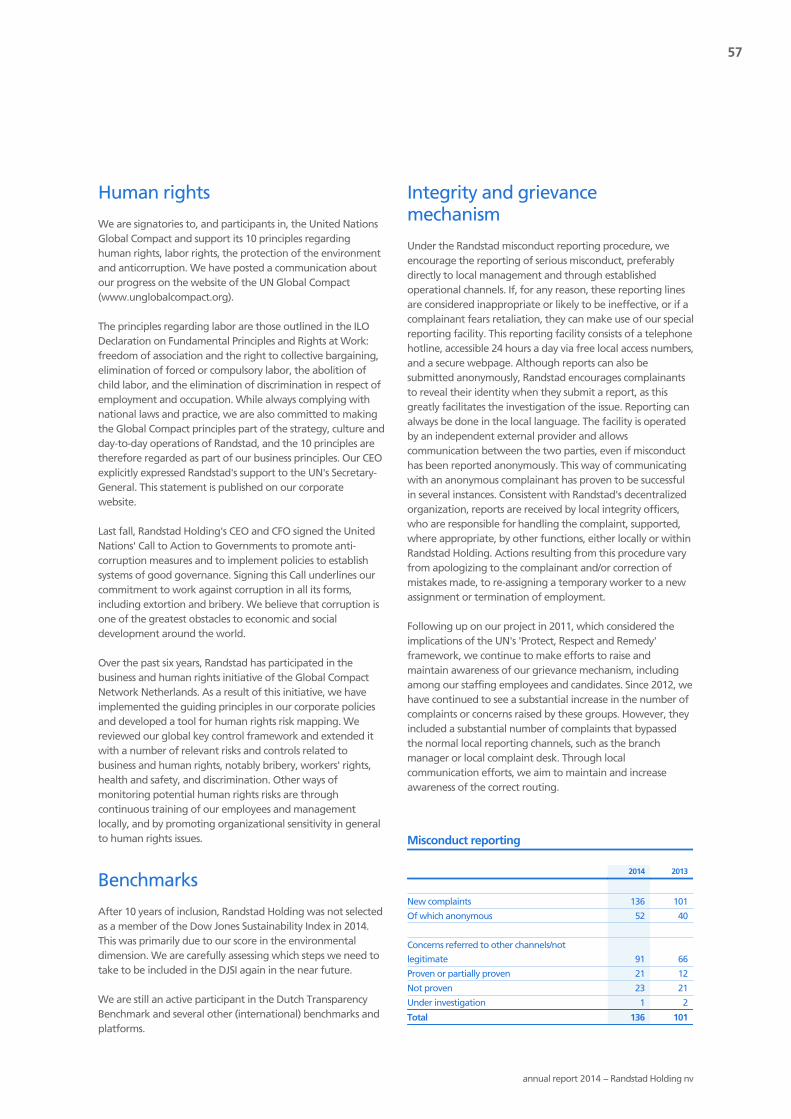
57
annual report 2014 − Randstad Holding nv
Human rights
We are signatories to, and participants in, the United NationsGlobal Compact and support its 10 principles regardinghuman rights, labor rights, the protection of the environmentand anticorruption. We have posted a communication aboutour progress on the website of the UN Global Compact(www.unglobalcompact.org).
The principles regarding labor are those outlined in the ILODeclaration on Fundamental Principles and Rights at Work:freedom of association and the right to collective bargaining,elimination of forced or compulsory labor, the abolition ofchild labor, and the elimination of discrimination in respect ofemployment and occupation. While always complying withnational laws and practice, we are also committed to makingthe Global Compact principles part of the strategy, culture andday-to-day operations of Randstad, and the 10 principles aretherefore regarded as part of our business principles. Our CEOexplicitly expressed Randstad's support to the UN's Secretary-General. This statement is published on our corporatewebsite.
Last fall, Randstad Holding's CEO and CFO signed the UnitedNations' Call to Action to Governments to promote anti-corruption measures and to implement policies to establishsystems of good governance. Signing this Call underlines ourcommitment to work against corruption in all its forms,including extortion and bribery. We believe that corruption isone of the greatest obstacles to economic and socialdevelopment around the world.
Over the past six years, Randstad has participated in thebusiness and human rights initiative of the Global CompactNetwork Netherlands. As a result of this initiative, we haveimplemented the guiding principles in our corporate policiesand developed a tool for human rights risk mapping. Wereviewed our global key control framework and extended itwith a number of relevant risks and controls related tobusiness and human rights, notably bribery, workers' rights,health and safety, and discrimination. Other ways ofmonitoring potential human rights risks are throughcontinuous training of our employees and managementlocally, and by promoting organizational sensitivity in generalto human rights issues.
Benchmarks
After 10 years of inclusion, Randstad Holding was not selectedas a member of the Dow Jones Sustainability Index in 2014.This was primarily due to our score in the environmentaldimension. We are carefully assessing which steps we need totake to be included in the DJSI again in the near future.
We are still an active participant in the Dutch TransparencyBenchmark and several other (international) benchmarks andplatforms.
Integrity and grievancemechanism
Under the Randstad misconduct reporting procedure, weencourage the reporting of serious misconduct, preferablydirectly to local management and through establishedoperational channels. If, for any reason, these reporting linesare considered inappropriate or likely to be ineffective, or if acomplainant fears retaliation, they can make use of our specialreporting facility. This reporting facility consists of a telephonehotline, accessible 24 hours a day via free local access numbers,and a secure webpage. Although reports can also besubmitted anonymously, Randstad encourages complainantsto reveal their identity when they submit a report, as thisgreatly facilitates the investigation of the issue. Reporting canalways be done in the local language. The facility is operatedby an independent external provider and allowscommunication between the two parties, even if misconducthas been reported anonymously. This way of communicatingwith an anonymous complainant has proven to be successfulin several instances. Consistent with Randstad's decentralizedorganization, reports are received by local integrity officers,who are responsible for handling the complaint, supported,where appropriate, by other functions, either locally or withinRandstad Holding. Actions resulting from this procedure varyfrom apologizing to the complainant and/or correction ofmistakes made, to re-assigning a temporary worker to a newassignment or termination of employment.
Following up on our project in 2011, which considered theimplications of the UN's 'Protect, Respect and Remedy'framework, we continue to make efforts to raise andmaintain awareness of our grievance mechanism, includingamong our staffing employees and candidates. Since 2012, wehave continued to see a substantial increase in the number ofcomplaints or concerns raised by these groups. However, theyincluded a substantial number of complaints that bypassedthe normal local reporting channels, such as the branchmanager or local complaint desk. Through localcommunication efforts, we aim to maintain and increaseawareness of the correct routing.
Misconduct reporting
2014 2013
New complaints 136 101
Of which anonymous 52 40
Concerns referred to other channels/not
legitimate 91 66
Proven or partially proven 21 12
Not proven 23 21
Under investigation 1 2
Total 136 101

58
annual report 2014 − Randstad Holding nv
Of a total of 136 complaints made in 2014, 45 were acceptedas admissible. After thorough investigation of these 45complaints, 23 were found to be not proven, and onecomplaint was still under investigation at the end of theyear.The proven complaints (21) related to fraud (1), breach oflaws and regulations (1), discrimination (1), non-compliancewith internal policies and procedures (2), privacy (3),intimidation and/or harassment (4), and impropermanagement practices or consultant behavior (9).
Awareness of misconduct reporting procedureon a 5-point scale
2014 2013
North America 4.0 3.9
France 4.4 3.5
Netherlands 3.5 3.4
Germany 4.3 4.0
Belgium & Luxembourg 1 3.8 n.a.
United Kingdom 3.8 3.7
Iberia 3.8 4.0
Other European countries 4.0 3.7
Rest of the world 4.3 3.6
Corporate 4.4 4.4
Group 4.0 3.71 Belgium & Luxembourg did not participate in 2013.
Source: Great People Survey
In 2014, we had our grievance mechanism assessed by meansof the Management of Complaints Assessment tool developedby CSR Europe. Performance is reviewed against eight criteriaas indicated by the UN Guiding Principles on Business andHuman Rights: legitimate, accessible, predictable, equitable,transparent, right-compatible, a source of continuouslearning, and based on engagement and dialogue. Ouroverall score compared to our peers was well above averageon most criteria.
Supply chain responsibility
Our suppliers make an important contribution to the qualityof our services. We therefore ask them to embrace ourstandards and to comply with our supplier code. This code isan integral part of our international terms and conditions. Itaims to ensure that the procurement of goods, works andservices takes place in a socially responsible manner and inconformity with our business principles. With this code, weexplicitly request our suppliers to respect our regulatory, socialand ecological principles, and to adopt practices consistentwith those principles. Suppliers must ensure that its suppliersand subcontractors for their part also respect the principles setout in the code. We consult with suppliers periodically in orderto verify compliance with the code. If there should be reasonto do so, Randstad may have an audit conducted at the
supplier's premises. The supplier code is published on ourcorporate website.
The related purchasing blueprint was rolled out in 2014.During the second half of the year, we audited usage of theblueprint and the supplier code, and found thatimplementation of the blueprint can be further enhanced inour operating companies. At the end of 2014, around 60% ofour expenditure in the Netherlands with suppliers is coveredby the supplier code.
On a global scale, around 7.5% of our cost base consists ofsupplier spending. The graph 'Composition of the supplychain' shows the proportions of the different suppliercategories across the globe.
With over 3,000 branch offices, we also deal with a largenumber of lessors and real estate agents.
Our impact on the environment
The fact that we are a people business is also reflected in ourcost base. The vast majority of our costs are the salaries we payto our own corporate staff and our candidates working forour clients. Because of the nature of our business, our impacton the environment is far less than that of some other sectors,such as manufacturing. Almost all of our business is conductedin local markets, and we have many locations close to bothclients and candidates, greatly reducing travel and theresulting CO2 emissions. Despite this inherently minimalimpact, we do what we can to limit our ecological footprint,by conserving energy, using sustainable energy sources, andreducing water and paper usage, while re-using or recyclingwherever possible.
Other costs
Supplier costs
Cost of services Advertising and marketing
Accommodation
Personnel expenses
IT costs General costs
x € 1,000
1 Actual reported operating expenses and cost of services excluding
amortization, impairment and acquisition-related intangible assets.
Composition of the supply chain
8.7%
91.3%
10.1%
9.2%
12.6%
48.4%
7.1%
Total costs: € 16,5891 Supplier costs: € 1,448
12.6%
sustainability basics

59
annual report 2014 − Randstad Holding nv
As a part of our framework, we continue to improve thecompleteness and accuracy of our Group environmental data,using a step-by-step approach. In 2012, we focused onmeasuring our impact as a result of traveling, in particularjourneys made by company cars. In 2013, we added thedistances traveled by airplane. Since then, we have worked onfurther fine-tuning the metrics regarding energy and waste.
Company cars
Average number of cars
Kilometers driven (x
1,000)
2014 2013 2014 2013
North America - - - -
France 1,637 1,610 33,764 36,827
Netherlands 1 3,265 3,204 98,683 107,278
Germany 1,636 1,583 48,122 44,841
Belgium & Luxembourg 1,467 1,487 35,664 41,574
United Kingdom 249 227 3,673 2,816
Iberia 638 695 20,196 17,391
Other European
countries 508 487 12,111 9,567
Rest of the world 554 507 10,324 10,470
Corporate 118 113 3,495 3,426
Group 10,072 9,913 266,032 274,1901 Excluding some small operating companies and additional fuel cards.
We are limiting our business travel impact on theenvironment by increasing the use of video and phoneconferencing and VoIP. Increasingly, we are digitizing timesheets and staffing contracts including signatures, whichreduces paper use and traveling by both flexworkers and ourconsultants. If traveling cannot be avoided, we prefer traintravel over plane or car travel, which in several countries issupported by strict policies. In the Netherlands, we participatein a CO2 compensation program for business flight emissionswith our national airline. Based on their report, the CO2
emissions of business flights in the Netherlands in the pastyear (December 2013−November 2014) amounted to 493,207kg (414,654 kg in the comparable period 2012-2013).
Business flightsTotal distance traveled (x 1,000 kms)
2014 2013
North America 30,682 27,003
France 3,412 3,664
Netherlands 286 220
Germany 2,514 2,110
Belgium & Luxembourg 40 39
United Kingdom 916 498
Iberia 3,454 4,598
Other European countries 1,863 1,291
Rest of the world 11,618 19,970
Corporate 8,787 6,684
Group 63,572 66,077
We are constantly taking measures to reduce our CO2
emissions from car travel. In 2010, we made a policy change inthe Netherlands with the aim of ensuring that the Dutch fleetwould consist solely of company cars with A, B, or C efficiencylabels by the end of 2013. We did indeed achieve this goal,with the exception of two cars at year-end 2013: one C-labelcar was relabeled to D due to a change in governmentdefinitions, and the other car's contract ended in May 2014. Atthe end of 2014, the fleet consisted of only A-, B- or C-labeledcars. As a result, average CO2 emissions per distance haveclearly decreased over the past few years. Compared to 2013,there was hardly any decrease in 2014, so at this point wehave reached our bottom. More detailed information isprovided in the table 'CO2 emissions of the Dutch fleet'.
CO2 emissions of the Dutch fleet1
2014 2013
Average number of cars 3,522 3,678
Distance traveled in km 111,453,234 116,552,032
Fuel use in liters 6,487,982 6,831,265
CO2 in kg 16,107,054 17,015,7951 Including corporate, some small operating companies, and additional fuel cards.

60
annual report 2014 − Randstad Holding nv
Average CO2 emissions per kilometer, Dutch fleet
in kgs
0.175
0.165
0.155
0.145
0.135
0.125
0.163
2011
0.151
2012
0.146
2013
0.145
2014
Several operating companies in other countries have switchedtheir cars to hybrid or fuel-efficient cars or have capped CO2
emissions. Besides that, various operating companies run bikeschemes, commuting projects, gas-saving contests, and otherinitiatives to reduce conventional energy usage. For example,the corporate head office in the Netherlands offers electrictaxi services.
RecyclingMost of our operating companies have waste managementprograms in place. Examples include waste-recycling bins, andthe recycling of toner cartridges, computers, printers, and lightbulbs.
Energy resourcesWe constantly aim to increase the use of alternative, efficientor natural energy resources, thus limiting the use of fossil fuels(e.g., by replacing traditional lighting by LED lighting in ourbuildings). We are in the process of migrating our computingcapacity to the cloud on a global basis. As we are sharingcapacity and optimizing our usage of servers by only makingthem available when we need them, we expect our energyconsumption to decrease. The overview below outlines theresource usage and waste management at the Randstadcorporate head office, which includes the head offices of theholding company and the Dutch operating companies. This isthe only major building we actually own, as almost all ourbuildings worldwide are being rented. Our head office uses100% certified green electricity, while its environmentalmanagement system is ISO 150001 certified. The increase inpaper and cardboard recycling compared to 2013 relates tothe restructuring of the head offices of our Dutch operatingcompanies. For the same reason, fewer events wereorganized, so the amount of recycled glass decreased. Thereduction of our recycled chemicals is due to the fact thatfewer computers were disposed of.
Resource usage and waste management (Randstadhead office, the Netherlands)
2014 2013
Water (m3) 19,900 20,900
District heating (gJ) 6,600 8,750
CO2 from district heating (kg) 200,050 262,300
Natural gas (m3) 30,850 26,300
CO2 from natural gas (kg) 56,600 n.a.
Electricity (million kWh) 3.7 3.9
CO2 from electricity (kg) - -
Recycled paper (kg) 66,080 44,200
Recycled cardboard (kg) 16,350 14,300
Recycled glass (kg) 860 1,680
Recycled chemicals (kg) 65 452
Increasing our people's awareness of simple ways to reducethe use of energy in our offices is the least we can do. At thesame time, its impact is difficult to measure, given the factthat our offices are often leased all-in, and we share buildingswith other tenants. In the Netherlands, however, we havemade some progress: we now have insight into the CO2
emissions of our three main Dutch operating companies asfrom the year 2012. (N.B. The table 'Carbon footprint of Dutchoperating companies' includes some overlap with the aboveoverviews.) We continue to try and convince our landlords toprovide us with specifications of energy use, separate fromlease costs, or to install smart meters.
The increase of our waste CO2 emissions is due to the fact thatin 2013 Tempo-Team Netherlands included chemical and non-recycable waste for the first time. Our CO2 emissions by scopeare higher compared to 2012, because Yacht was not includedin that year.
Carbon footprint of Dutch operating companies1
in tonnes of CO2 emissions
2013 2012
CO2 emissions
Buildings (energy and water) 5,826 6,368
Transportation (public, cars, flights) 19,354 21,822
Waste (paper, chemicals, glass) 510 376
25,690 28,566
CO2 emissions by scope
Direct emissions (scope 1) 20,102 15,348
Indirect emissions (scope 2) 4,807 4,359
Other emissions (scope 3) 781 6471 This table contains the most recent data available (2013). The CO2 footprint data
for 2014 will become available only after publication of this annual report.
sustainability basics

61
'We believe ourspecific role is toapply our HR andlabor marketknowledge andexpertise also forthe benefit ofsociety as whole.'
The development of society isinextricably linked with thedevelopment of the world ofwork. We firmly believe thatour company, and indeed anycompany, should work in sucha way that it benefits societyas a whole. As a leader in theHR services industry, we havea role to play here, and we seea number of opportunitiesthat will enable us to do so.One aspect is that we strive tocover all sustainability basics;for example, regardingenvironmental management,governance and transparency.Beyond that, we believe ourspecific role is to apply our HRand labor market knowledge
and expertise not only for thebenefit of our company, butalso for the benefit of societyas a whole. We do this inseveral ways. One is by takingpart in public debates and bypublishing the results of ourresearch activities and surveys.We strive to improve inemployment on a global level,and to remove barriers toglobal mobility. In addition,we advocate optimalregulation and have ourspecialists and executivesparticipate in key forums andstakeholder dialogues. Wealso seek to be a worthwhileinvestment option for ourshareholders.
For more than ten years now,we have placed employees, asvolunteers, with VoluntaryService Overseas (VSO), aleading charity that seeks tobring expertise to areas wherepeople are facing poverty anddisadvantage. In the longterm, we can only returnvalue to employees andinvestors if we add more valueto society in the first place. Inthis way, we seek to promotethe interests of all ourstakeholders simultaneously.The end goal is that the worldof work will become a littlebit better every day.
how I becamesociety

62
63 Introduction
66 Financial performance
73 Country performance
81 Performance by revenue category
83 Investor relations & share performance
87 Risk & opportunity management
performance

63
annual report 2014 − Randstad Holding nv
How we measure performance
Randstad has an extensive performance management systemin place. Performance management at Randstad starts byusing specific performance measurement tools at the lowestlevel in our organization in the context of what we call'activity-based field steering' (ABFS). Our ABFS model requiresour units and teams to translate information on activity (i.e.,calls and visits) into actual performance on a daily basis. As ourplanning and control cycle is operationally driven, the dataacquired through ABFS drive action right up to the ExecutiveBoard level. Direct reporting lines exist between the ExecutiveBoard and the management teams of the operatingcompanies. As a result, Executive Board members are closelyinvolved with the operating companies under theirresponsibility.
Our day-to-day performance overview includes keyperformance indicators (KPIs) showing our growth,productivity, profitability, working capital, and cash flow. Weuse a variety of tools within our planning and control cycle toassess our performance and align future strategic andinvestment decisions to best utilize commercial andorganizational opportunities. The planning and control cycle isembedded in our Risk & Control framework.
Performance managementThe performance of each operating company is measured atvarious stages during the year:- Weekly overview of activities (ABFS tracker), temporary
employees working (volumes), and permanentplacements;
- Monthly income statement, including selectednon-financial data, and a forecast;
- Quarterly income statement, balance sheet, cash flow,non-financial data, and a forecast.
Each month, the Executive Board discusses performance withthe management team of each operating company. The
agenda includes financial and operational performance,forecasts, risk management, and the progress made inachieving strategic goals. Internal and external benchmarksare used to challenge performance and to identify points forimprovement. In addition to the monthly control cycle, ayearly strategic planning cycle takes place in the spring, andan operational planning cycle takes place in the fall.
Key performance indicatorsBesides our activity-based field steering model, we also use'simple' metrics to manage our profitability, such as theincremental conversion ratio (the percentage of incrementalgross profit that is converted into EBITA) in times of growth,and the recovery ratio (the percentage of lost gross profit thatis recovered through reduced operating expenses) in a periodof contraction. Successful cost control involves reacting in atimely way, based on transparent reporting and reviewprocedures. KPIs are used to measure and monitorperformance against budgets, forecasts, the previous year,and our strategic targets. These indicators are describedbelow.
Weekly volumesWeekly volumes of employees working are an importantindicator within our field steering model and measure thesuccess of the units and teams. We have added weeklyinformation on permanent placements to our dashboard.
Market shareGaining profitable market share is an important strategictarget. We aim to measure market shares at the lowestpossible level (units and teams), where possible.
ProfitabilityProfitability indicates the quality of our top line andoperational efficiency. Our overall financial goal is to achievean EBITA margin of 5% to 6% over time. During the 2014Capital Markets Day, we reported that this target could bewithin reach by 2016. This would, of course, depend on anumber of variables, including the requirement for the salesCAGR over the next two years to be at least mid-single digit.More information on our performance in 2014 can be foundin the 'Financial performance' section and about our targets inthe 'Strategic priorities and targets' section.
Gross marginWe focus on temp margin (gross profit generated throughtemporary staffing) and the contribution of permanentplacements and other fee-based business. Gross margin is,however, not a strategic target as such. In order to realize ourEBITA-margin target, we focus on the extent to which grossprofit is converted into EBITA.
Cost controlPersonnel costs are the largest contributor to operatingexpenses. By using our ABFS model, we know when andwhere we have to add or reduce staff. Other costs are highlyflexible and tightly controlled.
Weekly volumes
Market share
Profitability
Gross margin
Cost control
ConversionProductivity
Cash flow generation
Working capital
Financial position
key p
erf
orm
an
ce in
dic
ato
rs
Key performance indicators
introductionintroduction

64
annual report 2014 − Randstad Holding nv
ConversionWe measure the percentage of gross profit converted intoEBITA. At an early stage of recovery, we require theincremental conversion ratio of a company to be over 70%.Once recovery is more developed, an incremental conversionratio of 50% is required. In a period of contraction, we aim fora recovery ratio of 50%. This means that 50% of lost grossprofit is recovered through reduced operating expenses. Inthe 'Financial performance' section, we have included anoverview of conversion ratios in recent years.
ProductivityProductivity improvements (see 'Financial performance' formore details) are important in helping us to achieve ourprofitability targets. We measure productivity in three ways:- Gross profit per staff member;- Gross profit in relation to personnel expenses;- The number of temporary workers per staff member.
Working capitalThere is a strong focus within Randstad on Days SalesOutstanding (DSO), the amount of overdues, and workingcapital. This focus is also reflected in the bonus targets set forour senior management. As a further incentive, through asimplified EVA method, operating companies are charged fortheir use of operating working capital. Within workingcapital, the 'trade receivables' component is the mostimportant for us to influence. Our liabilities comprise mainlywage tax and social security payments to tax authorities.Clearly, those payment terms are more difficult to influence.Over the years, we have shown substantial progress inimproving our working capital management. In the 'Financialperformance' section, we have included a more detailedanalysis of our historical performance.
Financial positionTo maintain a solid financial position, we monitor ourleverage ratio (net debt divided by 12-month EBITDA). This isused as guidance for dividend payment on ordinary sharesand as a basis for our acquisition policy. Strategically, ourtarget range is between 0 and 2, while our bank covenantsallow for 3.5. In certain cases, we are now allowed to report toa maximum leverage ratio of 4.25X EBITDA for a limitedamount of time. This provides us with a cushion in managingthrough the cycle. More information on our financial positionand capital structure can be found in the section 'Investorrelations & share performance'.
Cash flow generationBetter profitability and more efficient use of working capitalresult in sound cash generation, which we measure on thebasis of the amount of free cash flow generated. Free cashflow includes operating profit and movements in workingcapital plus capital expenditure. In a normal year, our freecash flow moves in line with the seasonal pattern in ourbusiness. While the free cash flow in the first quarter isnormally low, it is negative in the second quarter, as workingcapital requirements increase in line with higher revenue andthe payment of holiday allowances in Belgium and theNetherlands. Free cash flow in the second half of the year isnormally higher, based on higher revenue and profit.Traditionally, we experience unwinding of working capital inDecember, impacted by the holidays. The development in freecash flow per quarter is shown in the graph 'free cash flowdevelopment'. In a downturn, we typically see significantunwinding of working capital. More information on cash flowanalysis can be found in our quarterly press releases, and inthe section 'Performance'.
Net debt (€ million) Leverage ratio (r.h.a.)
Net debt & leverage ratio development
2.5
2
1.5
1
0.5
0
Q4 2
014
Q3 2
014
Q2 2
014
Q1 2
014
Q4 2
013
Q3 2
013
Q2 2
013
Q1 2
013
Q4 2
012
1,500
1,300
1,100
900
700
500
300
Strate
gic ta
rget
Free cash flow development 1
400
300
200
100
0
-100
-200 Q1 Q2 Q3 Q4
20
14
20
13
20
12
20
14
20
13
20
12
20
14
20
13
20
12
20
14
20
13
20
12
1. Q4 2013 is adjusted for a payment of € 131 million to the Dutch tax authority.
introduction

65
annual report 2014 − Randstad Holding nv
Our strategy through the cycle
In defining our EBITA-margin targets, we have been fullyaware of the challenges and opportunities presented byeconomic cycles. During the downturn in 2009, we achievedsignificantly better financial results than we did during theprevious, much milder, downturn in 2001. In 2012 and 2013,we also showed that we can react quickly in adjusting theorganization. This was in part due to our field steering model,which enables operational managers to monitor and manageour performance on a regular basis.
At its lowest point, our underlying EBITA margin was 2.5%,compared to 1.8% in the previous downturn (2001 and 2002).Despite a much more severe revenue decline, profitability wasmaintained in almost all countries, while during the previousdownturn, profitability was dependent on the Netherlandsonly. We continue to apply lessons learned in the past.
How we manage through thecycle
In managing through the cycle, three factors are important:revenue, costs of services, and operating expenses.
RevenueBoth our wide geographic spread and our diversified businessmix help us to manage the risk of revenue volatility in adownturn. We continue to experience diverging trends fordifferent countries and segments. These considerationsconfirm our belief that our strategy of diversification iseffective.
Cost of servicesCost of services are mostly flexible, consisting largely of salarieswe pay to our candidates, wage taxes and social securitypremiums. In Germany and the Netherlands, the HR servicessector has its own collective labor agreements withcompetitive labor costs. In return, the number ofcommitments we make to our candidates is limited.
Operating expensesIn general, the more flexible the operating costs, the lowerthe risk. Personnel costs are the largest component in our costbase. Using our ABFS model, we know when and where wehave to increase or reduce staff. In a downturn, savings areachieved through natural attrition (i.e., by not replacingconsultants who leave the organization). In 2009, wemanaged to decrease our annualized cost base by € 800million (i.e., 28%), 75% of which was mainly achieved throughnatural attrition in personnel. Bonus and commission schemesare equally flexible. Particularly in our Professionals businessesin the US and the UK, bonus and commission schemes form afar larger proportion of total compensation than in ourtraditional Staffing business, and associated costs move with
the change in volumes. Another substantial cost item isaccommodation costs. These are kept flexible by limiting leaseterms to a maximum of five years. The average term istherefore only three years. The main way in whichaccommodation costs have been driven down has been tocombine smaller branches into larger ones. Over the past fewyears, we have made IT costs flexible by outsourcing severalfunctions. Where possible, a single national IT platform is usedto lower fixed costs. We have also standardized our marketingtools by using a central photo database for all concepts, andwe develop marketing campaigns and materials that are usedinternationally. Marketing investments are strategicallyimportant to maintain our brand awareness and to gainmarket share.

66
annual report 2014 − Randstad Holding nv
Income statement
For a meaningful analysis of our results, we need to look atthe underlying results, which exclude one-off items, such asrestructuring costs, integration costs, and certain incidentalbenefits or charges.
Income statement, underlyingin millions of €, unless otherwise indicated
note 1 2014 2013 organic ∆%
Revenue 5.1 17,249.8 16,568.3 4
Cost of services 8.1 14,069.8 13,556.7
Gross profit 5.1 3,180.0 3,011.6 6
Personnel expenses 1,854.7 1,797.2
Other expenses 619.3 635.6
Operating expenses 8.2 2,474.0 2,432.8 2
EBITA 706.0 578.8 23
Gross margin 18.4% 18.2%
Operating expenses
margin 14.3% 14.7%
EBITA margin 4.1% 3.5%1 Note refers to the notes to the consolidated financial statements.
RevenueAt Group level, organic revenue increased 3.9% in 2014(2013: -1.5%). The growth rate remained within the 3−5%bandwidth throughout the year, even though comparablesstarted to become more challenging as from Q2 onwards.Currency effects had a negative impact of 0.8%, with a smallnegative impact from acquisitions/disposals and working days.
Overall reported revenue for the year increased 2.8% to€ 17,249.8 million. Our European operations grew 3% in 2014(2013: -2%), North America +3% (2013: -3%), Asia +10%(2013: +5%) and Latin America +14% (2013: +21%). Moredetailed information is included in the 'Country performance'section. More information about the three main business lines(Staffing, Inhouse and Professionals) can be found in the'Performance by revenue category' section.
Permanent placements were up 14% (2013: 0%). We bookedgrowth above Group average in Asia (+46%), the Netherlands(+29%), Germany (+21%), Other European countries (+27%),and Rest of the world (+23%). Permanent placements madeup 1.8% of revenue (2013: 1.7%). Revenue from temporaryStaffing increased by 4% organically (2013: -2%)
On average, we employed 580,300 candidates per day, andwe made around 105,400 permanent placements in 2014.Annually, we employ around 2 million people.
Organic growth per working dayin %
Q1 Q2 Q3 Q4 full year
Geographic areas
North America (1) 2 5 6 3
France (2) (1) (4) (8) (4)
Netherlands (1) - 4 5 2
Germany 11 5 2 (1) 4
Belgium & Luxembourg 4 5 6 (1) 3
United Kingdom 5 3 (3) 2 2
Iberia 5 12 9 9 9
Other European countries 19 20 16 11 16
Rest of the world 13 13 11 15 13
Revenue categories
Staffing - 1 2 2 1
Inhouse 17 16 10 8 12
Professionals 3 4 4 5 4
Group 4 5 4 3 4
Gross profitGross profit reflects our effectiveness in pricing, cost ofemployee benefits, and idle-time management. In 2014, itamounted to € 3,180.0 million, up 6% vs. last year (2013:down 1%). The gross margin increased 20bp to 18.4%. Thegraph 'Change in gross margin' shows the change in grossmargin in 2014. Note 5 to the financial statements includes anoverview of the actual reported gross profits per geography.
Year-on-year growth
Temp Perm Other revenue
Q4
Q3
Q2
Q1
Q4
Q3
Q2
Q1
Q4
Q3
Q2
Q1
25%
20%
15%
10%
5%
0%
-5%
-10%
-15%
-20%
20
14
org
an
ic
20
12
org
an
ic
20
13
org
an
ic
financial performancefinancial performance

67
annual report 2014 − Randstad Holding nv
Change in gross margin
18.5%
18.0%
17.5%
18.2%
18.4%
0.1%
2013
2014
perm
fees
HR
S/oth
er
tem
p
0.1% 0.0%
Our temp margin had a 10bp positive impact on the Groupgross margin, as did permanent placement fees. In NorthAmerica, the gross margin improved for the fourth year in arow. After six years of decline, the Dutch gross marginincreased. In addition, France, Belgium, and the UK alsoimproved. Germany was affected by a negative impact fromlegislative changes.
At Group level, the contribution from permanent placements('perm fees') made up 9.8% (2013: 9.1%) of gross profit.
HRS/other relates to other services we provide to our clients,such as payroll services and other fee-based businesses (e.g.,MSP and RPO), and had no significant effect on the grossmargin. Currency mix effects also played a role here.
Gross profit was adjusted for restructuring costs of € 2.4million in the Netherlands and Germany. In 2013, gross profitwas adjusted for restructuring costs of € 1.6 million in theNetherlands and Germany.
The trend in gross margin is monitored closely. The pattern weobserve is rather usual in this economic cycle. Gross margin initself is not one of Randstad's strategic targets. In order torealize our EBITA-margin targets, we aim to maximizeconversion of gross profit into EBITA.
ProductivityAs explained in the sections 'Value proposition & strategy' and'How we measure performance', productivity improvementsare key to achieving our profitability targets. We measureproductivity in three ways:- Gross profit per staff member (GP/FTE) ;- Gross profit in relation to personnel expenses (GP/PE) ;- Number of candidates per staff member (temps/FTE).
Productivity, indexed
Q1
Q2
Q3
Q4
Q1
Q2
Q3
Q4
Q1
Q2
Q3
Q4
Q1
Q2
Q3
Q4
2011
2012
2013
2014
GP/FTE Temps/FTEGP/PE
120
110
100
90
80
100 = 2007
Productivity (GP/FTE) increased by 3% in 2014 (2013: stable).We focused on achieving greater efficiencies across theorganization, mainly through better execution based on fieldsteering and the implementation of the right delivery modelsfor our clients. The lack of material growth over the past yearsmade it difficult to significantly improve our productivity.
Gross margin EBITA margin2Conversion ratio1
Gross margin, conversion ratio and EBITA margin
1 EBITA as percentage of gross profit.
2 EBITA margin is shown on the right hand axis.
25%
20%
15%
10%
6%
5%
4%
3%
2%
2014
2013
2012
2011
2010

68
annual report 2014 − Randstad Holding nv
Operating expensesA breakdown of operating expenses is shown in the table'Operating expenses'. These reflect the costs related to oursales and delivery organization, as well as our head offices.
In 2014, underlying operating expenses amounted to € 2,474.0million, up 1.6% organically (€ 38.6 million). Foreign exchangeeffects lowered our cost base by € 19.3 million. Across variousoperations, we are implementing a restructuring aimed atreducing overhead by reorganizing management, head-officeand back-office functions. Actual operating expenses in 2014included € 37.1 million restructuring charges (2013: € 30.2million), for which we aim to achieve a payback period oftwelve months. In 2014, operating expenses were adjusted for€ 5.8 million integration costs (2013: € 17.3 million).
The graph 'Change in operating expenses' shows the mostimportant changes in our underlying cost base in 2014.
Personnel expenses increased by 3% organically, as did thetotal number of FTEs. We invested in areas where growthcontinued, such as Iberia, Poland, and in emerging markets.Personnel expenses per FTE remained stable compared to2013. An overview of corporate staff by region is given in thesection 'Country performance'. Further details on actualpersonnel expenses can be found in note 9 to the financialstatements.
Marketing costs were 0.6% of revenue (in line with 2013).Further information about our marketing strategy is includedin the section 'Value for our clients and candidates'.
Accommodation costs fell by 3% organically. We continued toconsolidate branches, without leaving markets. This happenedmainly in North America, France, and Iberia, and we see this asan ongoing process. As we continued to see strong demandfor Inhouse Services, we opened 169 Inhouse locations in 2014(2013: 71), most notably in North America, the Netherlands,and France. At the end of 2014, we were operating a networkof 2,816 branches (-11%) and 1,595 Inhouse locations (+12%).
Operating expensesin millions of €, unless otherwise indicated
2014 2013
Personnel expenses 1,854.7 1,797.2
Advertising and marketing 102.2 105.4
Accommodation costs 184.7 185.8
Other operating expenses 268.2 276.9
Depreciation, amortization and
impairment of PPE and software 64.2 67.5
Operating expenses, underlying 2,474.0 2,432.8
Average number of corporate staff 28,720 28,030
Number of branches, year-end 2,816 3,161
Number of Inhouse locations, year-end 1,595 1,426
Operating expenses
4%
3%11%
7%
75%
Personnel
DepreciationOther (IT, 3rd party, etc)
AccommodationMarketing
Change in operating expenses
2,700
2,600
2,500
2,400
2,300
2,200
2,474.0
2013
1
2014
Co
rpo
rate
Rest o
f the w
orld
Eu
rop
e
23.610.7
in millions of €
1. The amount of operating expenses in 2013 is pro forma
2,460.8
No
rth A
merica
(6.1) (19.3)
Disp
osa
ls
Fx
15.3 (11.0)
financial performance
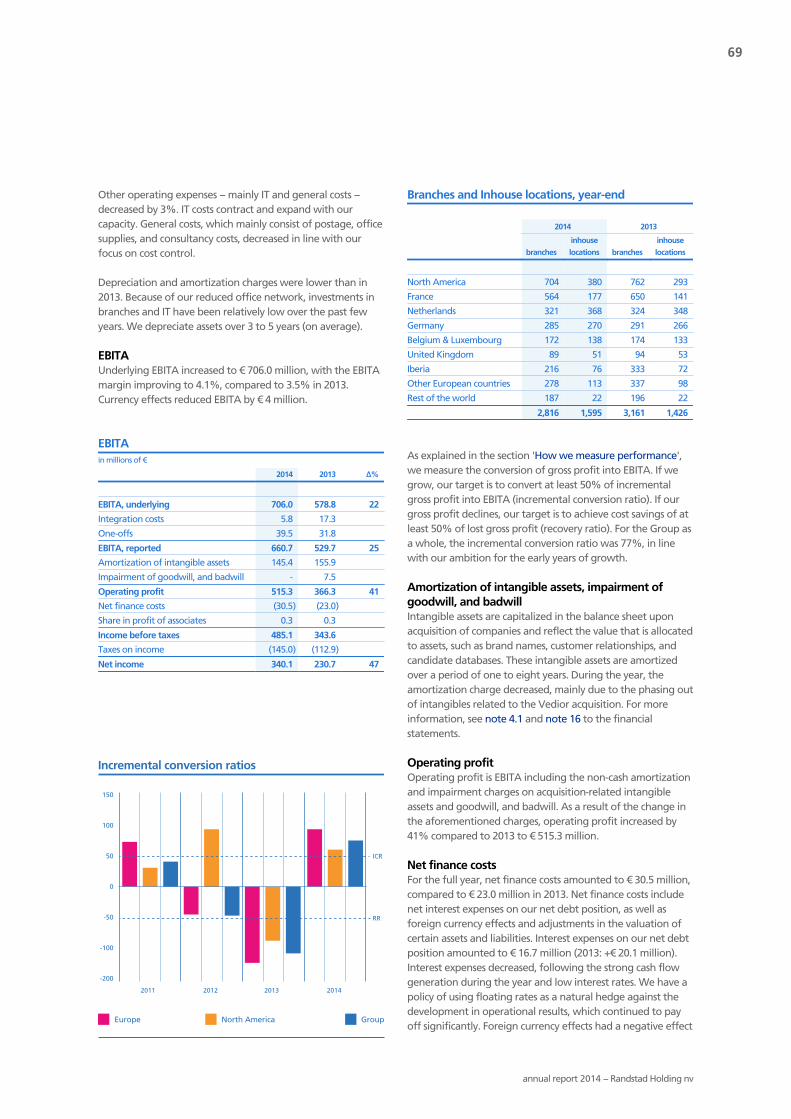
69
annual report 2014 − Randstad Holding nv
Other operating expenses − mainly IT and general costs −decreased by 3%. IT costs contract and expand with ourcapacity. General costs, which mainly consist of postage, officesupplies, and consultancy costs, decreased in line with ourfocus on cost control.
Depreciation and amortization charges were lower than in2013. Because of our reduced office network, investments inbranches and IT have been relatively low over the past fewyears. We depreciate assets over 3 to 5 years (on average).
EBITAUnderlying EBITA increased to € 706.0 million, with the EBITAmargin improving to 4.1%, compared to 3.5% in 2013.Currency effects reduced EBITA by € 4 million.
EBITAin millions of €
2014 2013 ∆%
EBITA, underlying 706.0 578.8 22
Integration costs 5.8 17.3
One-offs 39.5 31.8
EBITA, reported 660.7 529.7 25
Amortization of intangible assets 145.4 155.9
Impairment of goodwill, and badwill - 7.5
Operating profit 515.3 366.3 41
Net finance costs (30.5) (23.0)
Share in profit of associates 0.3 0.3
Income before taxes 485.1 343.6
Taxes on income (145.0) (112.9)
Net income 340.1 230.7 47
As explained in the section 'How we measure performance',we measure the conversion of gross profit into EBITA. If wegrow, our target is to convert at least 50% of incrementalgross profit into EBITA (incremental conversion ratio). If ourgross profit declines, our target is to achieve cost savings of atleast 50% of lost gross profit (recovery ratio). For the Group asa whole, the incremental conversion ratio was 77%, in linewith our ambition for the early years of growth.
Amortization of intangible assets, impairment ofgoodwill, and badwillIntangible assets are capitalized in the balance sheet uponacquisition of companies and reflect the value that is allocatedto assets, such as brand names, customer relationships, andcandidate databases. These intangible assets are amortizedover a period of one to eight years. During the year, theamortization charge decreased, mainly due to the phasing outof intangibles related to the Vedior acquisition. For moreinformation, see note 4.1 and note 16 to the financialstatements.
Operating profitOperating profit is EBITA including the non-cash amortizationand impairment charges on acquisition-related intangibleassets and goodwill, and badwill. As a result of the change inthe aforementioned charges, operating profit increased by41% compared to 2013 to € 515.3 million.
Net finance costsFor the full year, net finance costs amounted to € 30.5 million,compared to € 23.0 million in 2013. Net finance costs includenet interest expenses on our net debt position, as well asforeign currency effects and adjustments in the valuation ofcertain assets and liabilities. Interest expenses on our net debtposition amounted to € 16.7 million (2013: +€ 20.1 million).Interest expenses decreased, following the strong cash flowgeneration during the year and low interest rates. We have apolicy of using floating rates as a natural hedge against thedevelopment in operational results, which continued to payoff significantly. Foreign currency effects had a negative effect
Branches and Inhouse locations, year-end
2014 2013
branches
inhouse
locations branches
inhouse
locations
North America 704 380 762 293
France 564 177 650 141
Netherlands 321 368 324 348
Germany 285 270 291 266
Belgium & Luxembourg 172 138 174 133
United Kingdom 89 51 94 53
Iberia 216 76 333 72
Other European countries 278 113 337 98
Rest of the world 187 22 196 22
2,816 1,595 3,161 1,426
Incremental conversion ratios
Europe North America Group
150
100
50
0
-50
-100
-200
2011 2012 2013 2014
ICR
RR

70
annual report 2014 − Randstad Holding nv
of € 13.8 million (2013: € 2.1 million positive). Further detailson net finance costs are included in note 10 to the financialstatements.
Taxes on incomeThe effective tax rate before amortization and impairment ofacquisition-related intangible assets and goodwill, badwill,integration costs, and one-offs amounted to 30.1% in 2014(2013: 31.7%). More information on the actual effective taxrate is given in note 4.3 to the financial statements.
Net income, earnings per share and dividendAdjusted net income for holders of ordinary shares amountedto € 459.9 million (2013: € 367.6 million).
Diluted EPS increased by 23% to € 2.54 (2013: € 2.07). Thenumber of outstanding ordinary shares increased by around2%, due to stock dividend and the exercise of stock options.
In line with our dividend policy, we will propose the paymentof a dividend of € 1.29 per ordinary share (2013: € 0.95). Thismeans a payout ratio of 50% (2013: 45%). Holders of ordinaryshares will be able to choose between cash or shares. Ourdividend proposal is further elaborated on in the 'Investorrelations' section.
Net income, earnings per share and dividendin millions of €, unless otherwise indicated
2014 2013
Net income 340.1 230.7
Net income for non-controlling interests 0.0 0.0
Net income for holders of preference
shares 12.6 12.1
Net income for holders of ordinary shares 327.5 218.6
Amortization of intangible assets 1 145.4 163.4
Integration costs 5.8 17.3
One-offs 39.5 31.8
Tax effect on amortization, integration
costs, and one-offs (58.3) (63.5)
Net income for holders of ordinary shares,adjusted 459.9 367.6
Basic EPS (€) 1.83 1.25
Underlying basic EPS (€) 2.57 2.09
Underlying diluted EPS (€) 2.54 2.07
Proposed dividend (€) 1.29 0.95
Payout ratio (% of underlying basic EPS) 50 451 Amortization of acquisition-related intangible assets, impairment of goodwill, and
badwill.
Invested capital
Our invested capital amounted to € 3.7 billion (2013:€ 3.7 billion). The primary components of our invested capital,as shown in the overview below, are goodwill and acquisition-related intangible assets, working capital, and net tax assets.Return on invested capital further improved to 15.8% (2013:12.6%) as our focus on profitability paid off.
Invested capitalin millions of €, unless otherwise indicated
note 1 2014 2013
Goodwill and intangible assets 4.1,14,15 2,597.5 2,664.6
Trade and other receivables 2 21.2 3,073.9 2,930.1
Trade and other payables 3 21.3 2,586.2 2,470.6
Operating working capital 487.7 459.5
Net tax assets 4 4.3 527.1 497.1
Other assets/(liabilities) 5 13,16,21 122.8 47.6
Invested capital 3,735.1 3,668.8
Financed by
Equity 19 3,313.1 2,907.8
Net debt 3.2 422.0 761.0
Invested capital 3,735.1 3,668.8
Ratios
DSO (Days Sales Outstanding,
moving average) 51.7 51.8
Working capital as % of revenue 2.8% 2.8%
Leverage ratio (net debt/EBITDA) 0.5 1.2
Return on invested capital 6 15.8% 12.6%1 Note refers to the notes to the consolidated financial statements.2 Trade and other receivables minus the current part of financial fixed assets,
deferred receipts from disposed Group companies and interest receivable.3 Trade and other payables minus interest payable.4 Net tax assets: deferred income tax assets and income tax receivables less deferred
income tax liabilities and income tax liabilities.5 Other assets/liabilities: property, plant and equipment plus financial assets and
associates, less provisions and employee benefit obligations and other liabilities.6 Return on invested capital: underlying EBITA less income tax paid as a percentage
of invested capital. Income taxes paid in 2013 are adjusted for a payment of € 131million to the Dutch tax authority.
Operating working capitalDuring the year, we continued our focus on working capitalmanagement, paying special attention to the collection oftrade receivables and the reduction of overdues. Operatingworking capital increased by 6% to € 487.7 million. As growthreturned towards the end of the year, trade receivables grewaccordingly. As a percentage of revenue, working capital was2.8%, in line with last year. Within working capital, thecomponent we most need to be able to influence is tradereceivables. Our DSO was 51.7 days (2013: 51.8). We aim torealize further improvements by focusing on the aging oftrade receivables, including payment terms and overdues. Thegraph 'Working capital management' shows the development
financial performance

71
annual report 2014 − Randstad Holding nv
of working capital and DSO over the past few years. In 2010and 2011, working capital as % of revenue was impacted bythe timing of the acquisition of FujiStaff (2010) and SFN Group(2011).
Our exposure to bad debt remained limited, and only 0.2% ofrevenue (2013: 0.2%) was written off, as these receivableswere considered to be uncollectible. Our trade receivablesportfolio is very diversified geographically, in terms of bothsegmentation and client base, which mitigates credit risk.Current liabilities mainly comprise liabilities such as wage tax,social security charges, and pensions, for which payment termsare determined by law and therefore difficult to change.
We experience that clients are challenging the EU directive onpayment terms. Randstad has no flexibility in terms of its ownpayments (as these are to flex workers, tax and social securityauthorities). That is why we continue to make an appeal toour clients for payment terms that are in line with EUguidelines.
Other assets and liabilitiesFor the purpose of analyzing our invested capital, we havegrouped various other assets and liabilities. Please refer tofootnote 4 of the invested capital table for a description ofthe constituents. The largest part of the year-on-year changein this section was caused by a € 97.6 million increase of theCICE receivable (arising from tax credits under the FrenchCompetitive Employment Act). These tax credits can be offsetagainst the income tax liability with respect to the calendaryear to which the wages, based on which the tax credit iscalculated, relate. Any excess credit can be carried forwardand offset against the tax liability during the next three years.Any excess after three years will be refunded.
Net debtOur net debt position decreased to € 422.0 million, mainly as aresult of a solid free cash flow of € 487.7 million. As a result,the leverage ratio (net debt divided by 12-month EBITDA) was0.5 at year-end, well within our targeted range of between 0and 2. The section 'How we measure performance' containsan overview of the development of net debt and the leverageratio.
Net debtin millions of €, unless otherwise indicated
2014 2013
Cash and cash equivalents 117.1 136.1
Less: Non-current borrowings 315.0 743.4
Less: Current borrowings 224.1 153.7
Net debt 422.0 761.0
Leverage ratio 0.5 1.2
As of December 31, 2014, Randstad has a revolvingmulticurrency credit facility of € 1,800 million, which willmature mid-2019. There is the potential to extend thematurity to a maximum of 7 years (e.g., to mid-2021) throughthe exercise of two extension options, which are at the banks'discretion. In addition to this credit facility, Randstad hasuncommitted credit and guaranteed lines of roughly € 1.1billion available. Randstad has agreed on financial covenants,which requires us to have a maximum leverage ratio of 3.5xEBITDA. In some specific scenarios, Randstad is permitted toreport a maximum leverage ratio of 4.25x EBITDA for alimited amount of time.
In February 2013, Randstad launched standby facilities with asmall group of banks, which ran up to 24 months from thestart. These facilities offer Randstad the opportunity to selltrade receivables of selected European activities up to amaximum of € 275 million. On December 31, 2014, theremaining facilities, with a maximum of € 150 million, werenot activated or extended. These facilities lapsed on February13, 2015.
Working capital management
62
60
58
56
54
52
50
3.2% 3.1%
3.7%3.9%
2009 2010 2011 2012 2013
2.8% 2.8%
2014
DSO (moving average)Working capital as % of revenue
7%
6%
5%
4%
3%
2%
1%
0%

72
annual report 2014 − Randstad Holding nv
Cash flow analysis
Free cash flowFree cash flow amounted to € 487.7 million (2013: € 292.9million, impacted by the payment of an income tax liability of€ 131 million to the Dutch tax authority). The increasedamount booked in 2014 is attributable to the 21% EBITDAincrease. Working capital inflow was € 8.9 million in 2014(2013: € 77.6 million) as the company resumed topline growth.Please refer to the Consolidated statement of cash flows onpage 121 for more details on this topic.
Consolidated cash flow statementin millions of €
2014 2013
EBITA, reported 660.7 529.7
Depreciation, amortization and
impairment of property, plant and
equipment, and software 65.2 68.2
EBITDA 725.9 597.9
Working capital 8.9 77.6
Provisions and other items (60.6) (88.8)
Income taxes paid (116.7) (246.0)
Net cash flow from operating activities 557.5 340.7
Net capital expenditures 1 (63.3) (44.5)
Financial receivables (6.5) (3.3)
Free cash flow 487.7 292.9
Net acquisitions and disposals 2 (5.7) (10.8)
Issue of ordinary shares 1.5 7.1
Issue of preference shares C - 137.9
Purchase of own shares (25.7) (9.4)
Dividend paid on ordinary shares (56.0) (83.8)
Dividend paid on preference shares (12.1) (6.8)
Dividend paid to non-controlling interests - (0.1)
Net finance costs paid (30.4) (19.0)
Translation and other effects (20.3) 26.7
Net decrease of net debt 339.0 334.71 Net additions in property, plant and equipment, and software.2 Net aquisitions and disposals of subsidiaries/activities and associates.
financial performance

73
annual report 2014 − Randstad Holding nv
Introduction
Randstad operates in 39 countries, representing around 90%of the global HR services market. This is not likely to change,as we believe our current network covers the most attractivegeographies. In this section, we provide an overview of ourunderlying performance in these countries in 2014.
North America
in millions of € 2014 2013 organic ∆%
Revenue 3,765.9 3,686.9 3
EBITA 180.0 166.9 9
EBITA margin 4.8% 4.5%
Randstad is the third-largest HR services provider in NorthAmerica. We hold market-leading positions in IT, accountingand finance, office/clerical, RPO, MSP, and permanentplacements. Across the region, we provide a full range ofservices. In 2014, US revenue grew by 4% on a same-day,constant-currency basis, while gross profit per day grew by4.5%. Revenue and gross profit growth in the second half ofthe year outpaced that of the first half due to the combinedimpact of management changes in our Professionals businessand improved focus on field steering. The EBITA margin forour combined US business reached a full-year level of 4.9%, vs.4.6% in 2013.
The US Staffing and Inhouse businesses benefited from thecombined impact of rigorous field steering, investment in fieldstaff, and positive market developments in blue-collar staffingand permanent placements. With a full-year growth of 7.1%in revenue and 8.1% in gross profit, we outperformed themarket. The continued focus on perm yielded another year ofstrong market outperformance, due to both our continuedprogress in the SME white-collar segment and our success inadding perm to both our mass-customized and Inhouse blue-
collar offerings. Overall perm grew 25% vs. prior year andaccounted for 7.2% of gross profit, vs. 6.3% in 2014. Despiteour strong growth in perm, our market share in this segmentremains below 3%, so it continues to be an area ofconsiderable operational focus and incrementalinvestment. Inhouse services experienced solid growth in 2014,but the strongest growth was seen in the local, branch-basedstaffing business, particularly in the SME segment, where bothblue-collar and white-collar businesses performed well aheadof the market. EBITA margin reached a new record level in2014 thanks to the combined effect of field productivity andgreat back-office efficiency.
Revenue in Professionals improved consistently through theyear, but contracted on a full-year basis by 1%. Full-year grossprofit growth outpaced revenue due to stronger permgrowth, particularly in Randstad Technologies. Finance &Accounting experienced a marked improvement inperformance throughout the course of the year, due toleadership changes, headcount investments, and a substantialupgrade in the field steering approach. Negative growth inthe first half of the year was offset by solid performance in thethird and fourth quarters, with gross profit growing by 8%and 9% respectively. Randstad Engineering had an excellentyear, with full-year gross profit growth of 10%. IT experiencedstrong demand for our solutions offering, which grew by 8%,and for perm, which grew by 7%. Weaker growth in retailtemporary staffing resulted in full-year gross profit being justahead of last year. The EBITA margin in our combinedProfessionals business also improved, benefiting fromproductivity gains and a reduced cost base.
The North American Randstad Sourceright MSP business increased spend under management by 44%, more than two times market growth. This results from the combination of new client wins and expansion of existing programs. Global expansion and the statement of work (SOW) continue to be top of mind for clients, while the dominant trend is demand for a Total Talent Architecture approach. We are well-
Development in the main geographic marketsin millions of €, unless otherwise indicated
revenue organicgrowth %
marketgrowth % ∆%
average candidates average corporate staff2014 2013 2014 2013 2014 2013
North America 3,765.9 3,686.9 3 3 - 106,400 101,800 6,220 6,240
France 2,726.2 2,835.7 (4) - (4) 70,400 75,100 3,390 3,590
Netherlands 2,794.7 2,739.4 2 7 (5) 75,600 80,800 4,350 4,310
Germany 1,949.3 1,875.5 4 4 - 46,600 47,900 2,610 2,530
Belgium & Luxembourg 1,283.3 1,238.7 3 4 (1) 40,000 39,700 1,750 1,820
United Kingdom 821.7 769.6 2 9 (7) 17,200 18,700 1,530 1,520
Iberia 1,086.1 896.9 9 15 (6) 58,100 48,800 1,560 1,390
Other European countries 1,371.3 1,090.7 16 n.a. n.a. 55,800 43,800 2,450 2,000
Rest of the world 1,451.3 1,434.9 13 n.a. n.a. 110,200 111,100 4,660 4,450
Corporate n.a. n.a. n.a. n.a. n.a. n.a. n.a. 200 180
17,249.8 16,568.3 4 580,300 567,700 28,720 28,030
country performancecountry performance
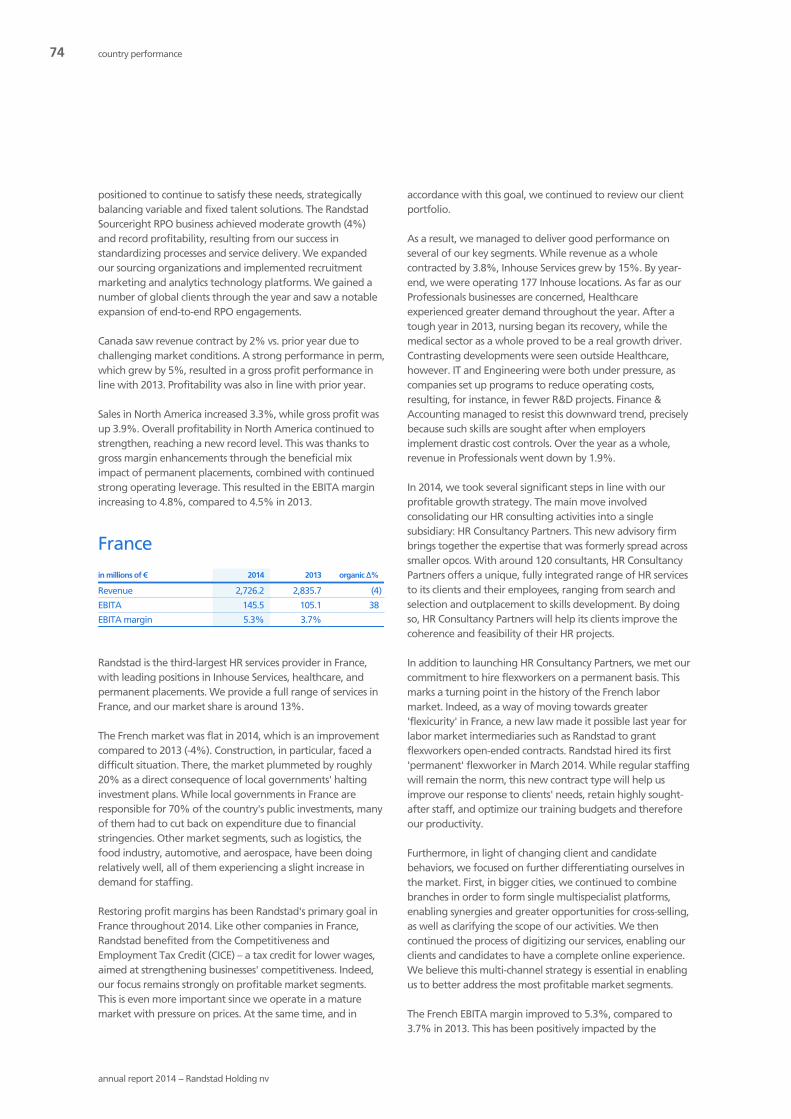
74
annual report 2014 − Randstad Holding nv
positioned to continue to satisfy these needs, strategicallybalancing variable and fixed talent solutions. The RandstadSourceright RPO business achieved moderate growth (4%)and record profitability, resulting from our success instandardizing processes and service delivery. We expandedour sourcing organizations and implemented recruitmentmarketing and analytics technology platforms. We gained anumber of global clients through the year and saw a notableexpansion of end-to-end RPO engagements.
Canada saw revenue contract by 2% vs. prior year due tochallenging market conditions. A strong performance in perm,which grew by 5%, resulted in a gross profit performance inline with 2013. Profitability was also in line with prior year.
Sales in North America increased 3.3%, while gross profit wasup 3.9%. Overall profitability in North America continued tostrengthen, reaching a new record level. This was thanks togross margin enhancements through the beneficial miximpact of permanent placements, combined with continuedstrong operating leverage. This resulted in the EBITA marginincreasing to 4.8%, compared to 4.5% in 2013.
France
in millions of € 2014 2013 organic ∆%
Revenue 2,726.2 2,835.7 (4)
EBITA 145.5 105.1 38
EBITA margin 5.3% 3.7%
Randstad is the third-largest HR services provider in France,with leading positions in Inhouse Services, healthcare, andpermanent placements. We provide a full range of services inFrance, and our market share is around 13%.
The French market was flat in 2014, which is an improvementcompared to 2013 (-4%). Construction, in particular, faced adifficult situation. There, the market plummeted by roughly20% as a direct consequence of local governments' haltinginvestment plans. While local governments in France areresponsible for 70% of the country's public investments, manyof them had to cut back on expenditure due to financialstringencies. Other market segments, such as logistics, thefood industry, automotive, and aerospace, have been doingrelatively well, all of them experiencing a slight increase indemand for staffing.
Restoring profit margins has been Randstad's primary goal inFrance throughout 2014. Like other companies in France,Randstad benefited from the Competitiveness andEmployment Tax Credit (CICE) – a tax credit for lower wages,aimed at strengthening businesses' competitiveness. Indeed,our focus remains strongly on profitable market segments.This is even more important since we operate in a maturemarket with pressure on prices. At the same time, and in
accordance with this goal, we continued to review our clientportfolio.
As a result, we managed to deliver good performance onseveral of our key segments. While revenue as a wholecontracted by 3.8%, Inhouse Services grew by 15%. By year-end, we were operating 177 Inhouse locations. As far as ourProfessionals businesses are concerned, Healthcareexperienced greater demand throughout the year. After atough year in 2013, nursing began its recovery, while themedical sector as a whole proved to be a real growth driver.Contrasting developments were seen outside Healthcare,however. IT and Engineering were both under pressure, ascompanies set up programs to reduce operating costs,resulting, for instance, in fewer R&D projects. Finance &Accounting managed to resist this downward trend, preciselybecause such skills are sought after when employersimplement drastic cost controls. Over the year as a whole,revenue in Professionals went down by 1.9%.
In 2014, we took several significant steps in line with ourprofitable growth strategy. The main move involvedconsolidating our HR consulting activities into a singlesubsidiary: HR Consultancy Partners. This new advisory firmbrings together the expertise that was formerly spread acrosssmaller opcos. With around 120 consultants, HR ConsultancyPartners offers a unique, fully integrated range of HR servicesto its clients and their employees, ranging from search andselection and outplacement to skills development. By doingso, HR Consultancy Partners will help its clients improve thecoherence and feasibility of their HR projects.
In addition to launching HR Consultancy Partners, we met ourcommitment to hire flexworkers on a permanent basis. Thismarks a turning point in the history of the French labormarket. Indeed, as a way of moving towards greater'flexicurity' in France, a new law made it possible last year forlabor market intermediaries such as Randstad to grantflexworkers open-ended contracts. Randstad hired its first'permanent' flexworker in March 2014. While regular staffingwill remain the norm, this new contract type will help usimprove our response to clients' needs, retain highly sought-after staff, and optimize our training budgets and thereforeour productivity.
Furthermore, in light of changing client and candidatebehaviors, we focused on further differentiating ourselves inthe market. First, in bigger cities, we continued to combinebranches in order to form single multispecialist platforms,enabling synergies and greater opportunities for cross-selling,as well as clarifying the scope of our activities. We thencontinued the process of digitizing our services, enabling ourclients and candidates to have a complete online experience.We believe this multi-channel strategy is essential in enablingus to better address the most profitable market segments.
The French EBITA margin improved to 5.3%, compared to3.7% in 2013. This has been positively impacted by the
country performance

75
annual report 2014 − Randstad Holding nv
increase in the CICE, which increased from 4% to 6% ofsalaries below 2.5 times minimum wage. In 2014, the CICEreceivable increased by € 97.6 million to € 170.2 million, andwill be collectable as from 2017.
Additionally, we see the benefit of the restructuring thatoccured in 2013. Operating expenses were adjusted for € 1.9million in 2014, compared to a restructuring provision releaseof € 7.7 miilion in operating expenses in 2013.
The Netherlands
in millions of € 2014 2013 organic ∆%
Revenue 2,794.7 2,739.4 2
EBITA 170.6 159.2 7
EBITA margin 6.1% 5.8%
At the end of August 2014, Randstad announced plans for anew organizational structure in the Netherlands. The aim is tocreate a more efficient and leaner organization to better serveclients, while keeping the current brand propositions intact.The changes encompass:- Creating one joint management team for the new
Randstad Group Netherlands. The new team will report toExecutive Board member Chris Heutink.
- Combining all Professionals businesses, based on verticals,in order to strengthen our leading position in theProfessionals segment in the Netherlands. This process isdue to be finalized at the end of Q1 2015.
- Streamlining back-office processes and support centers.
As a result of the new organizational structure, staff andsupport functions have been integrated and the back-officestreamlined. The implementation of this process wascompleted by the end of 2014. The changes significantlysimplify the organizational structure in the Netherlands.Growth in Professionals is one of our strategic goals in theNetherlands. By building a single Professionals business under
the Yacht umbrella in the coming year, we will create astronger position in this market. In addition, the integratedhead office will optimize service levels, while lowering costs.All head office employees started working in their new rolesas from January 2015. And although people and processes willneed to settle in, the first benefits of joining forces are alreadyclearly visible. Meanwhile, we have made strong progress inthe organizational design of our Professionals business. Ourplans have been presented to the Works Council, and weexpect to have established our new organization by the endof Q1 2015.
Randstad the NetherlandsRevenue of Randstad the Netherlands grew 1% over 2014.During the year, growth rates gradually improved, from asmall decrease in Q1 to +4% in Q4. In the SME markets inparticular, our growth rates increased significantly. This stronggrowth was the result of further improved activity-based fieldsteering (ABFS), which supported client focus and increasedcommercial activity.
With regard to our corporate clients, we see a more mixedpicture. We had to discontinue some unattractive contracts,which led to some pressure on our market share. In thesecond half of the year, we started closing the gap with themarket, and we expect to get back to market-growth levelsshortly.
Our focus on permanent placements paid off in 2014. Permfees increased by more than 40% compared to last year, andcontributed well to our gross margin. This growth was broad-based, with strong perm performances by our Staffing units,as well as our Professionals businesses and SourcerightNetherlands (large-volume recruitment).
In the Professionals segment, Randstad Netherlands redefinedthe current business model for the IT segment into a verticalbusiness model. Initial results are promising and augur well forour planned integration of all Professionals activities into thenew Yacht organization. The overall performance of Randstad
North America Germany Iberia
France Belgium & Luxembourg Other European countries
Netherlands United Kingdom Rest of the world
Revenue split by geography
2014: revenue €17,249.8 million
8%
6%
5%
8%
11%16%
16%
22%
8%
2013: revenue € 16,568.3 million
7%
5%
5%
8%
11%
17%
17%
22%9%
North America Germany Iberia
France Belgium & Luxembourg Other European countries
Netherlands United Kingdom Rest of the world
2013: EBITA € 578.8 million
5%4%
1%
7%
13%
25%
17%
26%
EBITA split by geography
2014: EBITA € 706.0 million
7%
6%2%
9%
11%
22%
19%
23%
1% 2%

76
annual report 2014 − Randstad Holding nv
Professionals was good, showing strong growth rates duringthe year.
Our Inhouse concept continued to be successful in 2014. Pricepressure was offset by continuous productivity improvementfacilitated by increased levels of digitization.
During the third quarter, Randstad again partnered with theDutch government to reduce youth employment. Thecontinuation of this initiative led once more to Randstadcommitting itself to find a solution for at least 10,000 youngjob seekers over a five-week period. The initiative reinforcedour position as opinion leader.
Tempo-TeamTempo-Team performed well and maintained its second-largest position in the Dutch market. In the first half of theyear, revenue continued to decline, but growth returned inMay, resulting in 3% growth over the full year. In the summer,growth was at least in line with the market, evidencingstrengthened focus on execution at all levels. Emphasis wasput on ABFS, with considerable time invested in the trainingof managers and consultants. These investments paid off,being visible in the return to growth in the Staffing segment.Growth in Staffing was driven by the market units, especiallyin the SME segment, with a swing from minus 16% at thestart of the year to plus 25% in December. In the industrialand logistics segments (mostly Inhouse), Tempo-Team wasslightly behind market, primarily due to selectiveness inpricing in tenders. Profitability in Inhouse was strong.Professionals and Payroll Services both performed very well,with double-digit growth figures across the year andimproving profitability. Thanks to mix improvements, growthin permanent placements, and selectiveness in Inhouse, grossmargin pressure was offset. In advertising, Tempo-Teamfocused on the SME segment, in order to back up theincreased activity in that field.
YachtYacht showed strong improvement in profitability in 2014.Overall revenue declined by 1%, slightly below the market,which showed low-single-digit growth. While the IT segmentreturned to solid growth, demand in the Engineeringsegment was clearly under pressure. Growth in the publicsegment, as well as in HR, Legal, and Marketing &Communications, was particularly strong, outperforming themarket. Yacht 'Externen Management', which was launchedin 2012 to address the growing supply of and demand forfreelancers, again showed strong growth of approximately30%, becoming a leading player in the Dutch market for thebrokering of freelancers. Despite continued pressure on prices,gross margin improved significantly following furtherreduction of idle time and further flexibilization of directcosts. This was also supported by increasing commercialactivity through ABFS, especially in the SME segment.Furthermore, we invested in a central delivery center,improving delivery to our large clients, particularly in thefinancial services segment. Productivity improvement and solid
cost control both contributed to further improvement ofprofitability.
Overall revenue in the Netherlands increased 2.1%, whilegross profit grew 3.4%. The overall Dutch EBITA marginreached 6.1%, compared to 5.8% in 2013. Underlying EBITAwas adjusted for € 28.2 million restructing costs. Last year,underlying EBITA was adjusted by € 6.5 million forrestructuring-related costs.
Germany
in millions of € 2014 2013 organic ∆%
Revenue 1,949.3 1,875.5 4
EBITA 85.6 81.1 6
EBITA margin 4.4% 4.3%
In general, with around 7,000 temporary employmentagencies, the German market is still very fragmented. In 2014,there was no further development in the field ofconsolidation. In addition, the staffing market has been inconstant decline since 2013. Looking at 2015, we expectfurther regulations, given the coalition contract of theGerman government. The Professionals market continued togrow, partly fueled by some scarcity in more highly educatedprofiles.
Despite the big changes in 2012 that affected the wholestaffing industry (industry surcharges), we were able tostabilize our market share and strengthen our position asmarket leader in Germany in 2013 and 2014. In Staffing andInhouse Services, we operate as Randstad and Tempo-Team.Randstad Professionals and GULP are active in theProfessionals segment.
Two years ago, the German staffing industry saw theimplementation of equal pay in several sectors of the market,including the metal and chemical sectors. This agreementcame on top of the existing collective labor agreement (CLA),which continued to have a significant negative impact on thegross margin of our Staffing and Inhouse businesses.
Our revenue grew by 4% in 2014, in line with the market. Ourcombined Staffing and Inhouse businesses grew by 3%.Randstad Inhouse Services, for its part, had another good year.This was partly due to the transfer of business from Staffing,but also because we were able to welcome several newclients. Inhouse revenue grew by 15%, and we operated from270 locations across Germany. Tempo-Team grew solidly andstrengthened its market position. Our Sourceright businessgrew in 2014, and we convinced Thyssen Krupp, one of theworld's largest technology and service companies, to enterinto a Managed Services Program (MSP) partnership for thecoming years.
country performance

77
annual report 2014 − Randstad Holding nv
As a result of the regulatory changes, the combined Staffingand Inhouse business is still facing pressure on gross margin.We therefore put more focus on client profitability anddelivery models, while also continuing our Blue Customizedinitiative, aimed at expanding our service offering to our top100 clients. Thanks to our focus on ABFS, we were able toimprove not only our sales pace, but also our confidence tomake the right decisions locally. We also further enhanced ourvalue proposition in 2014, which was visualized in ourongoing marketing campaign 'Randstad wirkt' ('Randstadworks'). We aim to improve our brand in the German market,while at the same time driving growth and improving ourbusiness mix.
Special attention was given to growth in permanentplacements, and we set up a special website to attract newcandidates. To motivate our internal field colleagues evenmore, an incentive program for permanent placements wasimplemented in 2013, which continued successfully in 2014.
Revenue in Professionals grew by 7%. In 2014, our ITfreelancer business (GULP) grew by 13%, remaining the mostimportant source of IT project candidates among externalspecialists in Germany. GULP is also the leading internet-basedproject intermediary, offering clients a comprehensive onlineportal providing information and services for IT-relatedproject business. It contains profiles of 90% of all German ITfreelancers. Randstad Professionals provides high-end HRsolutions in the engineering and IT services segments. Itsrevenue and profitability remained under pressure.
The underlying EBITA margin reached 4.4%, compared to4.3% in 2013. EBITA was adjusted for restructuring costs of€ 8.4 million, of which € 0.5 million was in gross profit. In thefourth quarter, we executed a restructuring program tominimize overhead costs, mainly by reducing staff at ourGerman head office. Last year, restructuring costs were € 2.8million, of which € 0.4 million was related to gross profit.
Belgium & Luxembourg
in millions of € 2014 2013 organic ∆%
Revenue 1,283.3 1,238.7 3
EBITA 66.5 44.5 50
EBITA margin 5.2% 3.6%
Randstad is the market leader in Belgium and Luxembourg.While 2013 was the year of the restructuring process, in 2014the benefits of a more efficient and more client-orientedorganization began to become apparent. ABFS wasimplemented throughout the business in both Belgium andLuxembourg, leading to strong productivity gains. Overall,revenue grew by 3% in 2014, with growth in both Randstadand Tempo-Team, while gross profit increased by 7%.Operating expenses declined by 3%, while EBITA increased by50% versus the prior year.
Randstad Belgium's revenue grew 2% in 2014, especiallyboosted by the Inhouse business, which realized 9% growth.Our Professionals business grew by 5% in 2014, while ourOutplacement and Household businesses were negativelyimpacted by market conditions, with revenue growthessentially flat and declining by 4% respectively.
Tempo-Team had a strong year, outperforming the marketfrom June onwards. Tempo-Team's revenue grew by 8% in2014, with strong performances in Staffing and Inhouse (7%)and Professionals (66%). Despite the market conditions,Household realized growth of 1%.
Randstad Luxembourg reported a 6% revenue drop in 2014. Astrong focus on cost control led to a decline of 23% inoperating expenses, while EBITA increased by 44%. Theintroduction of activity-based field steering (ABFS) led to anincrease in the number of new clients, resulting in a positiveperformance versus the market in the second half of the year.
Underlying EBITA margin reached 5.2% (2013: 3.6%). In 2013,EBITA was adjusted for restructuring costs of € 24 million.
United Kingdom
in millions of € 2014 2013 organic ∆%
Revenue 821.7 769.6 2
EBITA 14.2 6.5 119
EBITA margin 1.7% 0.8%
Market conditions in 2014 continued to improve as theeconomic recovery gathered pace. While the macroeconomicenvironment helped cement growth, ABFS was a key profitdriver across Randstad UK. As a result, the permanentplacements business increased 12% in 2014. EBITA more thandoubled year on year, and the EBITA margin increased by90bp compared to 2013.
Gross profit per head increased 6% year on year, following animproved recruitment and induction program. Over thecourse of 2014, Randstad UK has enhanced its profile andmade a significant number of new hires to capitalize onmarket opportunities. The on-boarding process has also beensuccessfully overhauled: gross profit per delegate attendingJuly, August and September induction sessions rose 17% yearon year in Q3 2014. With a focus on digital, traffic to therandstad.co.uk website rose by 52% compared to the previousyear, while the number of online applications made to thewebsite rose by 85%.
Organic growth was led by three business units: StudentWorker Support (SWS), Randstad Sourceright UK, andRandstad CPE. Gross profit rose 21% in Construction, Propertyand Engineering due to a stronger focus on client profitability,improving market conditions, and increased demand drivenby a large rail infrastructure project (Crossrail) and accelerated

78
annual report 2014 − Randstad Holding nv
house building. Growth in Randstad Sourceright UK wasfueled by deepening current client relationships, a series ofnew business wins, and new services in talent market mappingand strategic advisory. Randstad SWS saw gross profit grow by30% in 2014. The business helped 25,000 students andunemployed people with disabilities and health conditions toachieve their academic potential or gain employment in 2014.A testament to the quality of its service, Randstad SWSretained 100% of tendered business over the course of theyear.
Our EBITA margin in the UK has continued its upwardtrajectory, rising from 0.8% in 2013 to 1.7% in 2014.Underlying operating expenses were adjusted for € 1.3 millionof restructuring costs compared to € 0.2 million of book profitfrom the divestment of businesses in 2013.
Iberia
in millions of € 2014 2013 organic ∆%
Revenue 1,086.1 896.9 9
EBITA 42.9 25.7 58
EBITA margin 3.9% 2.9%
SpainGiven the improvement in the economy and labor market, weaccelerated the process of integrating the acquired activitiesof USG in Spain, which was completed successfully in Q1,thanks to our constant focus on client profitability and riskcontrol. Synergies were realized in line with the plans. OurStaffing business reached double-digit growth, with a clearpositive trend throughout the year, while our decision toinvest in permanent placements, Professionals, and other HRSolutions businesses paid off. Our focus in 2014 continued tobe on client profitability. We developed products that givehigher client satisfaction and also implemented more efficientservice delivery models. Innovation and Technology alsoplayed an important role. We developed a range of new toolsfor clients and candidates. In particular, we introduced ournew Digital Contracting System, which is unique in the
Spanish market and will generate important gains inefficiency and control, leading to greater satisfaction for ourcandidates and employees.
PortugalIn Portugal, we retained our clear market-leader position.Strong growth was achieved in the Staffing business, and weopened our first Inhouse locations. Our call center businesscontinued to grow solidly. It was granted several industryawards, reflecting its high-quality services. Our Professionalsbusiness had a good year, and growth in permanentplacements was strong. The implementation of field steeringcombined with further optimizations in the administrativeprocesses were important achievements in 2014. As we willcontinue to benefit from these initiatives, our strategic focusremains on enriching our business mix, better delivery modelsfor our clients and candidates, and risk management. As such,we are well set for another great year.
The Iberian EBITA margin reached 3.9%, compared to 2.9% in2013. Operating expenses were adjusted for € 2.4 million ofintegration costs compared to € 3.8 million of integrationcosts in 2013.
Other European countries
in millions of € 2014 2013 organic ∆%
Revenue 1,371.3 1,090.7 16
EBITA 54.0 30.1 83
EBITA margin 3.9% 2.8%
PolandOur position in Poland strengthened further, with revenuegrowth of 21%. We are one of the two leading Staffingcompanies in Poland. Our Inhouse business had a great year,with the number of locations increasing by over 50%, partly asa result of transferring business from Staffing. Our Staffingbusiness performed well. Our focus on permanent placementsand Professionals continued to pay off, resulting in 116%growth. Client profitability was further embedded as a themeacross the organization and good cost control wasmaintained.
ItalyIn Italy, where we are the fourth-largest in the market,revenue grew by 12%. Our market position was strengthenedby the acquisition of the activities of Start People (USG).Growth returned in the second half of the year. This wasmainly led by good demand in the industrial segment, and itresulted in good performance of our Inhouse business. Thiswas supported by further investments in headcount. Wecontinued to transfer business from Staffing to Inhouse, whichenabled our Staffing business to put more focus on specialties.This clearly paid off. In addition, we made a good start withProfessionals and permanent placements in 2014.
Main market positions, 2014in billions of local currency
Regions
market
size 1
market
growth %
market
share in %
market
position
United States 136.8 5 3 2
France 21.1 - 13 3
Netherlands 15.3 7 19 1
Germany 23.2 4 9 1
Belgium & Luxembourg 8.5 4 15 1
United Kingdom 28.4 9 2 4
Spain 2.6 15 21 11 Based on country data, 2013 figures, and estimated growth rates.
country performance

79
annual report 2014 − Randstad Holding nv
NordicsIn Sweden, Randstad outperformed the market. BothProfessionals and Inhouse Services showed strong growth,while further investments were made in market units focusingon SME clients. In Denmark, Recruitment grew very fast, andthe organization has recently been aligned to further developand focus on higher-margin segments. The focus in Norwayremains on Professionals, where Engineering showed goodgrowth. Overall growth in gross profit in Nordics was close to15%.
SwitzerlandWe continued to outperform the Swiss market in 2014, andrevenue grew by 10%. The strong momentum of 2013 wascontinued in 2014, which resulted in double-digit growth andstrong gains in market share. Inhouse Services maintainedsolid growth. Our Professionals business accelerated, driving55% growth in permanent placements.
AustriaDuring 2014, further integration into the Randstad way ofworking took place, which resulted in a firm platform forfurther growth in defined segments and geographies inAustria. Despite the integration project, Austria showedexcellent growth of 35% and solid results.
HungaryRandstad is the market leader in the recruitment market inHungary. In 2014, our focus was on profitability (up >20%),while also improving and innovating our concepts. Good costcontrol was maintained, and we achieved sound profitability.
Turkey, Czech Republic and GreeceIn Turkey, where we are mainly active in permanentplacements and HR Solutions, we concentrated on improvingour business mix and profitability. As a result, our HR Solutionsbusiness line grew by 9.6%. We had a successful year in theCzech Republic, with revenue growing by 49%. In Greece, wealso had a good year, with 34.7% growth.
Overall profitability continued to improve across most of theother European countries. EBITA margin improved from 2.8%last year to 3.9% in 2014. Operating expenses were adjustedfor integration costs of € 3.4 million, compared to € 4.9 millionlast year, as the USG integration in Italy was completed.
Rest of the world
in millions of € 2014 2013 organic ∆%
Revenue 1,451.3 1,434.9 13
EBITA 7.5 10.1 11
EBITA margin 0.5% 0.7%
Revenue in the 'Rest of the world' region grew by 13%organically. However, on a reported basis, revenue grew by1%, mainly due to negative currency mix effects.
JapanJapan represents 32% of the ‘Rest of the world’ region, andRandstad holds the sixth position. In 2014, we invested inexpanding our position in Professionals, permanentplacements, and outplacement and in our own IT platform.Overall, revenue grew by 7.0% year on year, with both blue-and white-collar Staffing and outsourcing showing strongperformance. Permanent placements for entry-level jobs grewby about 80%, with strong demand from clients due toshortage of talents in the market caused by the lowunemployment rate in Japan (below 4%). Inhouse successfullyexpanded the number of locations to 25. Professionals furtherexpanded its business under the new leadership. Havingintroduced new business concepts, Professionals showedstrong performance, creating high expectations for 2015.Operational improvements were achieved through theimplementation of activity-based field steering (ABFS).
We hosted the Randstad Award event, which was attended byabout 800 participants. This was the largest employerbranding and HR professionals networking event ever held inJapan. Furthermore, we set up a monthly roundtablediscussion for HR executives and professionals, providing thelatest insights into the world of work. One of the discussionswas co-hosted by the Dutch Embassy in Tokyo. Finally, westarted our partnership with VSO Nepal, and sent twovolunteers on a placement in a tourism promotion project.
Australia and New ZealandOur operations in Australia and New Zealand returned togrowth (FY 2014 +17%) across both temporary andpermanent recruitment. Overall, the blue-collar industrialbusiness achieved strong results in revenue and gross profit,with positive developments in the transport and logisticssegments. Our early childhood and specialist educationbusiness also achieved solid results throughout the year, witha promising start in the specialized schools segment. WithinProfessionals, construction, property and engineering showedstrong performance. Randstad Technologies achieved 20%growth year on year, as our reputation for providing expert ITrecruitment and technologies solutions grew. We saw goodgrowth in the public sector, with both state and federalgovernment departments growing. The improving consumer,business and hiring confidence led to good results across ourBusiness Support, Assessment Center, Call Center, and Banking& Finance divisions.
IndiaIn 2014, the Indian economy continued to be volatile and,compared to 2013, witnessed increased optimism towards thelatter part of the year. Our business in India continued tofocus on profitability, emphasizing client quality, resulting inclear signs of returning growth in the second half of the year.In particular, there was above-market growth in thepermanent placements business, on the back of investmentsmade in streamlining and integrating the permanentplacements business across the branches to build clientintimacy and serve clients better.
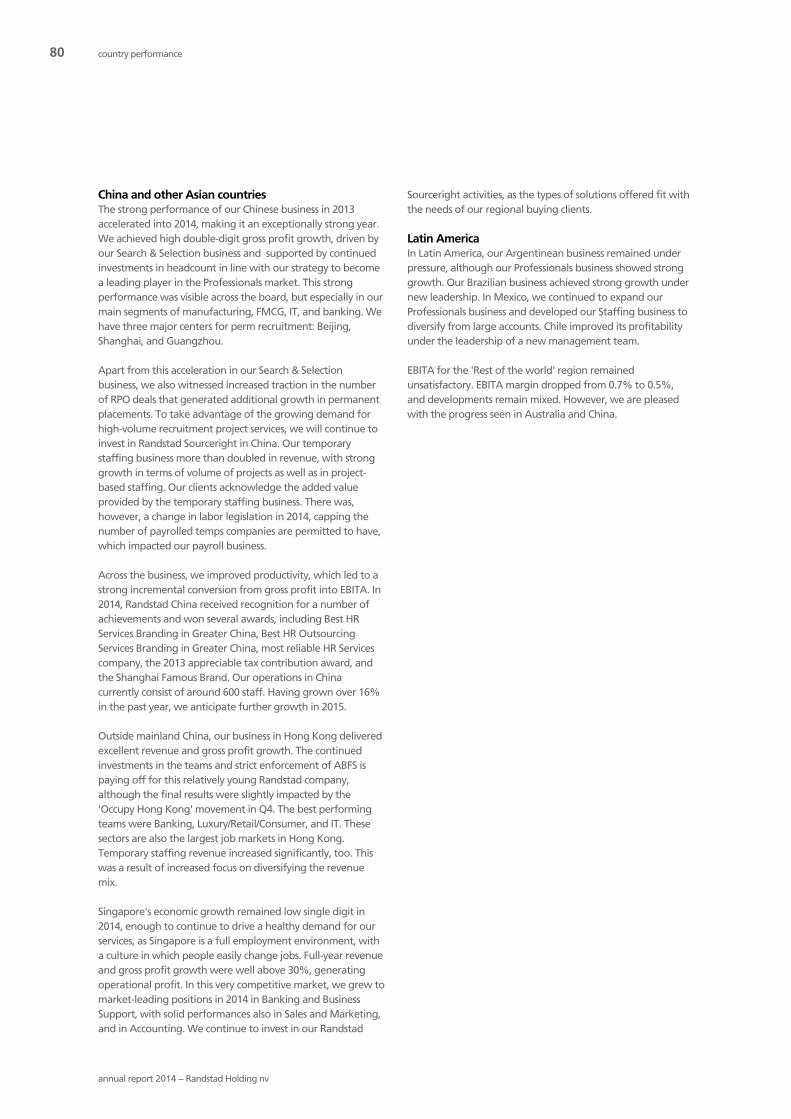
80
annual report 2014 − Randstad Holding nv
China and other Asian countriesThe strong performance of our Chinese business in 2013accelerated into 2014, making it an exceptionally strong year.We achieved high double-digit gross profit growth, driven byour Search & Selection business and supported by continuedinvestments in headcount in line with our strategy to becomea leading player in the Professionals market. This strongperformance was visible across the board, but especially in ourmain segments of manufacturing, FMCG, IT, and banking. Wehave three major centers for perm recruitment: Beijing,Shanghai, and Guangzhou.
Apart from this acceleration in our Search & Selectionbusiness, we also witnessed increased traction in the numberof RPO deals that generated additional growth in permanentplacements. To take advantage of the growing demand forhigh-volume recruitment project services, we will continue toinvest in Randstad Sourceright in China. Our temporarystaffing business more than doubled in revenue, with stronggrowth in terms of volume of projects as well as in project-based staffing. Our clients acknowledge the added valueprovided by the temporary staffing business. There was,however, a change in labor legislation in 2014, capping thenumber of payrolled temps companies are permitted to have,which impacted our payroll business.
Across the business, we improved productivity, which led to astrong incremental conversion from gross profit into EBITA. In2014, Randstad China received recognition for a number ofachievements and won several awards, including Best HRServices Branding in Greater China, Best HR OutsourcingServices Branding in Greater China, most reliable HR Servicescompany, the 2013 appreciable tax contribution award, andthe Shanghai Famous Brand. Our operations in Chinacurrently consist of around 600 staff. Having grown over 16%in the past year, we anticipate further growth in 2015.
Outside mainland China, our business in Hong Kong deliveredexcellent revenue and gross profit growth. The continuedinvestments in the teams and strict enforcement of ABFS ispaying off for this relatively young Randstad company,although the final results were slightly impacted by the'Occupy Hong Kong' movement in Q4. The best performingteams were Banking, Luxury/Retail/Consumer, and IT. Thesesectors are also the largest job markets in Hong Kong.Temporary staffing revenue increased significantly, too. Thiswas a result of increased focus on diversifying the revenuemix.
Singapore's economic growth remained low single digit in2014, enough to continue to drive a healthy demand for ourservices, as Singapore is a full employment environment, witha culture in which people easily change jobs. Full-year revenueand gross profit growth were well above 30%, generatingoperational profit. In this very competitive market, we grew tomarket-leading positions in 2014 in Banking and BusinessSupport, with solid performances also in Sales and Marketing,and in Accounting. We continue to invest in our Randstad
Sourceright activities, as the types of solutions offered fit withthe needs of our regional buying clients.
Latin AmericaIn Latin America, our Argentinean business remained underpressure, although our Professionals business showed stronggrowth. Our Brazilian business achieved strong growth undernew leadership. In Mexico, we continued to expand ourProfessionals business and developed our Staffing business todiversify from large accounts. Chile improved its profitabilityunder the leadership of a new management team.
EBITA for the 'Rest of the world' region remainedunsatisfactory. EBITA margin dropped from 0.7% to 0.5%,and developments remain mixed. However, we are pleasedwith the progress seen in Australia and China.
country performance

81
annual report 2014 − Randstad Holding nv
Introduction
In this section, we provide an overview of the underlyingperformance per revenue category in 2014. More detailedinformation on these service concepts can be found in thesection 'Value for our clients and candidates'. In our financialreporting, we have merged these service concepts into threerevenue categories: Staffing (including HR Solutions), InhouseServices, and Professionals (including Search & Selection).
Staffing (including HR Solutions)
in millions of € 2014 2013 organic ∆%
Revenue 10,202.8 10,037.9 1
EBITA 421.1 343.1 23
EBITA margin 4.1% 3.4%
In the revenue category Staffing we include the serviceconcepts of Staffing and HR Solutions. Within Staffing, weserve clients in the industrial segment (blue-collar) andadministrative segment (white-collar). In our revenue mix, thisis about 50:50. HR Solutions includes a wide range of services,of which Payroll Services, RPO, MSP, and Outsourcing are thelargest services. HR Solutions is well-established in theNetherlands and North America, while we have implementeda number of initiatives to further diversify our service portfolioin Europe and Asia. One of our priorities has been to achieve agreater share of permanent placements in our Staffingbusinesses. In 2014, we continued our progress in this regard,with permanent placements increasing proportionately.
Staffing revenue was € 10.2 billion. On an organic basis, thiswas an increase of 1%. We saw good revenue growth in Asiaand Latin America, and solid growth of 5% in North America.There was a decline in Europe of 3%, which continues to beimpacted by the transfer of business from Staffing to Inhouse.Overall Staffing revenue showed a steady improvement inmany businesses, with the continued focus on revenue qualityhaving a clear benefit on the bottom line. Our focus ongrowing permanent placements in our Staffing business isstarting to pay off, with growth of 16% in the year.
In North America, our continued focus on revenue quality andprofitability is paying off. Revenue was up 5% organically, or3% on a reported basis as a result of currency mix effects.Staffing revenue was up 5% organically, based on a relativelystable pattern evident throughout the year. On top of this, wewere able to improve our profitability. In HR Solutions,revenue also improved by 5%. RPO had a solid performance,while revenue in MSP saw strong growth throughout theyear. Payroll Services also improved following new client wins.
In Germany, Staffing revenue was 3% below the level of 2013.Revenue gradually softened throughout the year, as theimpact of the price effect from equal pay and wage increasesreduced through the quarters. We continued to optimize our
service delivery to our clients, by transferring business toInhouse. In France, Staffing revenue was 7% lower than in2013; however, profitability continued to improve largely dueto the increased 'CICE' subsidies. In the Netherlands, revenuewas 1% lower than in 2013, although the trend improvedthroughout the year. In Belgium, revenue was 1% above2013. In the UK, revenue fell by 3%; here, we retain a strongfocus on client profitability, and revenue has come underpressure as a result. In Iberia, revenue increased 6%, with asolid performance in Staffing.
In the 'Rest of the world' region, our Japanese Staffingbusiness saw solid growth of 8% in 2014. We achieved goodgrowth in the blue-collar segment, especially in the logisticsand retail segments. In other Asian countries and LatinAmerica, revenue grew by 8% and 17% respectively.
Underlying EBITA margin improved from 3.4% to 4.1%.Operating leverage improved thoughout the year.
Professionals
in millions of € 2014 2013 organic ∆%
Revenue 3,424.5 3,306.9 4
EBITA 156.1 135.4 16
EBITA margin 4.6% 4.1%
Revenue in Professionals was 4% higher year on year.Reported revenue was also 4%, with a small negative currencyeffect. Perm fees were 13% ahead of last year.
Our North American business contracted by 1%, mainly as aresult of a decline in our IT business. However, we saw furthersigns of operational improvements in our IT business,offsetting the decline in demand from the banking andfinance sectors.
In Europe, revenue from Professionals increased by 5%. OurProfessionals business in the UK had a good year, and revenuegrew by 3%. Growth was led by Construction/Engineering
Staffing Professionals Inhouse Services
2014: revenue €17,249.8 million
Split by revenue category
21%
20% 59%
25%
20%
55%
2014: EBITA € 706.0 million
performance by revenue categoryperformance by revenue category

82
annual report 2014 − Randstad Holding nv
and Education, whilst our Healthcare business returned togrowth. Our German Professionals business grew by 6%,driven by good performance in IT and Engineering. In France,revenue contracted by 2%, but despite this, our Healthcarebusiness performed well. In the Netherlands, revenue in theProfessionals business was 11% higher overall, with the trendimproving during the year. Our Dutch Professionals business iswell placed, with the business being aligned under the Yachtbrand in 2015. In Australia, revenue grew by 19%, mainlydriven by increased temp demand. Perm fees in Australia were4% higher. Our Chinese operations grew 77%.
Profitabililty continued to improve, with the EBITA marginreaching 4.6%, compared to 4.1% in 2013. Profitabilityimprovements were seen in many geographies, includingNorth America, the Netherlands, France, Iberia, and the UK.We will continue to focus on capturing profitable growth inthese regions, while further improving our profitability inAustralia.
Inhouse Services
in millions of € 2014 2013 organic ∆%
Revenue 3,622.5 3,223.5 12
EBITA 189.6 150.7 27
EBITA margin 5.2% 4.7%
Inhouse Services continued to see good growth in 2014.Revenue grew by 12% to € 3.6 billion as we continue to alignclients to the most appropriate delivery model.
In North America, Inhouse Services' revenue grew by 8%, andwe operate 380 Inhouse locations. Our French, Belgium andDutch Inhouse businesses grew by 15%, 8% and 5%respectively, with good growth at existing clients. In Germany,
our Inhouse business grew by 15%, which was in part due tothe transfer of clients from Staffing, although we also sawsolid growth at existing clients. Revenue in the UK contractedby 1%, were we retain a clear focus on client profitability. InIberia and other European countries, revenue grew by 26%and 42% respectively. Inhouse Services' revenue in the 'Rest ofthe world' region grew 12% organically. Reported revenueincreased by 12%, with only a small negative currency effect.Our Japanese business performed well, with logistics and retailsegments continuing to lead the way. Here, revenue grew by10%, organically.
The EBITA margin improved further to 5.2% (from 4.7%),now ahead of our targeted range of between 4% and 5% forthis revenue category.
Geographic revenue spread
North America
France
Netherlands
Germany
Belgium & Luxembourg
United Kingdom
Iberia
Other European countries
Rest of the world
Staffing revenue (including HRS): € 10,202.8 million
1%
9%
9%
9%
17%
19%
17%10%
9%
Professionals revenue: € 3,424.5 million Inhouse Services revenue: € 3,622.5 million
16%
8%2%
1%
40%
10%9%
11%
3%
4%
7%
9%
5%
19%
12%
20%16%
8%
performance by revenue category

83
annual report 2014 − Randstad Holding nv
Investor relations
The main goal of Randstad's investor relations activities is tobuild our 'financial brand'. Whereas we seek to have clientsand candidates recognize the Randstad brand for itsreliability, service quality, and the fact that we are aworldwide labor market authority, we seek to have investorsand analysts value our company for our open and transparentcommunication style and our aim to be best in class, both indisclosure and in providing insight into the business. In thisway, we seek to ensure that Randstad achieves its appropriatevaluation over time.
Investor relations policyWe maintain an active, open and transparent dialogue withexisting and potential shareholders, as well as with analystsand banks. We organize road shows and accommodatemeeting requests wherever feasible, and we adhere to alllegal obligations relating to confidentiality.
We are committed to providing high-quality and timelyinformation to all stakeholders, and ensuring that the entiremarket has access to such information (including price-sensitive data) at the same time. Our policy is that, wheneverpossible, we make a member of the Executive Board and/or arepresentative of the Investor Relations department available.From time to time, we also involve country management andfacilitate field trips.
Bilateral meetings and conference calls with analysts andactual or potential shareholders will not be held during'closed periods', which normally run from the end of a quarteruntil publication date. Our policy of holding bilateralmeetings with shareholders is set out in the corporategovernance section on our corporate website.
Dialogue with investors, analysts, and otherstakeholdersEach quarter, Randstad organizes analyst meetings orconference calls to discuss the latest results. These events arealso broadcast on the web. In November 2014, we hosted aCapital Markets Day for analysts and investors in London. Themain focus of the day was to provide an update on ourstrategy and targets, and to provide an overview of ourchange programs. We also reported on the experiences of ourDutch and US Staffing organizations, and provided an updateon the impact of technology on Randstad, including thedevelopment of our Randstad Innovation Fund.
In 2014, we maintained the geographic coverage of our roadshows and investor conferences. We participated inconferences in the Netherlands, Belgium, the UK, and the US.Road shows for institutional investors were organized inBelgium, Canada, France, Germany, Italy, Japan, the Nordics,Singapore, Spain, Switzerland, the Netherlands, the UK, andthe US. In addition, a large number of investor meetings wereheld at our head office in the Netherlands. Over the year, wemet more than 500 investors.
On April 3, 2014, we held our Annual General Meeting (AGM)of Shareholders. More information on the AGM, including keydecisions and attendance, can be found in the section 'Reportof the Supervisory Board'.
Financial strategyIn 2014, we continued to focus on strong cash flowgeneration. As a result, the free cash flow rose 15% to € 487.7million. We used our free cash flow to reduce our debt and topay a dividend. Our net debt position decreased from € 761.0million to € 422.0 million, and our leverage ratio was 0.5, wellwithin our targeted range of between 0 and 2.
More information on our debt can be found in the 'Capitalstructure' section.
Capital structure
Invested capital amounted to € 3.7 billion, and we achievedreturn on invested capital of 15.8%. More information on andan analysis of invested capital can be found in the section'Financial performance'.
Invested capitalin millions of €
2014 2013
Net debt 422.0 761.0
Equity 3,313.1 2,907.8
3,735.1 3,668.8
Return on invested capital 15.8% 12.6%
DebtOur financing policy aims to secure financing that matches themid- to long-term financing requirements of the Group.During the year, we took the opportunity to extend our debtfacility on favorable terms. This provides us with bothincreased security and flexibility in our business. In addition,our balance sheet continues to strengthen, with our debtcoming down by € 339 million over the year, which in turnhelped bring our leverage ratio (net debt/12-month EBITDA)down toward the lower end of our targeted range ofbetween 0 and 2. We consider being within this rangeimportant for continuity. We have maintained our policy of
- Dividend of € 1.29 per share, 50%payout ratio
- Dividend yield of 3.2%- Diluted earnings per share: € 2.54- Market capitalization: € 7.2 billion
investor relations & share performanceinvestor relations & share performance

84
annual report 2014 − Randstad Holding nv
using floating interest rates as a natural hedge against thedevelopment of operational results, which continued to payoff significantly in 2014.
Debtin millions of €
2014 2013
Total debt facility 1,950.0 1 1,925.0
Net debt 422.0 761.0
Leverage ratio 0.5 1.21 Amount includes a € 150 million facility that lapsed on February 13, 2015.
EquityDuring 2014, the number of issued and outstanding ordinaryshares increased by 2.7 million, of which the majority wasissued for stock dividend, and the remainder for stock optionplans and performance share plans for Executive Boardmembers and senior management.
We aim to offset the dilutive effect of the performance shareplans through share repurchase programs. This policy will bepursued as long as the value of shares to be issued is below€ 25 million, and if higher, when our financial position allowsfor it. In January and February 2014, we repurchased around540,000 shares. In January 2015, we started a share repurchaseprogram to buy back around 525,000 shares. These will beused for the allocation of shares under the performance shareplans on February 19, 2015.
Equity
numbers year-end
(in millions)
nominal value
per share
2014 2013
Ordinary shares 180.1 177.4 € 0.10
Preference shares B 25.2 25.2 € 0.10
Preference shares C 50.1 50.1 € 0.10
Total number of shares 255.4 252.7
On April 3, 2014, the Annual General Meeting of Shareholdersapproved a proposal to pay a dividend of € 0.95 per ordinaryshare. Shareholders had a choice between cash and shares. Asa result, we issued 2.62 million ordinary shares in April 2014.
On December 31, 2014, there were 50.1 million preferenceshares C in issue. The dividend yield on these shares is 5.8%.For preference shares B, there were 25.2 million shares inissue, with a dividend yield of 2.7%. We consider preferenceshares to be an attractive part of equity. It provides fullycommitted long-term capital at relatively low cost.
Voting rights on sharesThe ordinary shares have equal voting rights (one share, onevote). The voting rights on the preference shares B and C arealigned with the historical capital contribution. This meansthat there are 3.6 million voting rights on preference shares Band 5.6 million voting rights on preference shares C.
Listing and indicesRandstad Holding is publicly listed on the EuronextAmsterdam (ticker symbol RAND), where Randstad shares andoptions can be traded. Randstad shares are also included in anumber of other indices, such as Euronext 100, Dow JonesStoxx TMI, Dow Jones Stoxx Europe Sustainability, EuronextVigeo Benelux 20, Euronext Vigeo Eurozone 120, and theMSCI Europe Index. Inclusion in major indices is important,because it improves visibility and liquidity.
Indicative free floatRandstad's free float amounts to approximately 60%. Themajority of the free float of ordinary shares is held outside theNetherlands. We actively pursue an international spread. Weestimate that approximately 5% of our ordinary shares areheld by private investors.
22%
12%2%
Indicative geographical spread of ordinary shares (free float)
North America United Kingdom Other European countries
Netherlands France Rest of the world
15%
40%
9%
Major shareholdersA list of our major shareholders can be found in the report ofthe Supervisory Board under 'Legal transparency obligations'.
LiquidityThe number of shares traded has risen substantially, from 86million in 2005 (mainly on Euronext) to about 268 million in2014 on various trading platforms, but mainly Euronext. Themixed offer for Vedior in 2008 helped to improve liquidity, asthe number of shares increased by 45%. Velocity (measured asthe total number of shares traded divided by the averagenumber of shares outstanding) also played a role. Velocityincreased significantly following the acquisition of Vedior,
investor relations & share performance

85
annual report 2014 − Randstad Holding nv
while it decreased in recent years in line with overall lowervolumes on stock markets. Our velocity level implies that theaverage holding period is around six to nine months for thetotal number of outstanding shares, or approximately three tosix months for the free float.
Share volume traded and velocity
Volume traded (in millions) Velocity (%)
400
350
300
250
200
150
100
50
250%
200%
150%
100%
50%
2014
2013
2012
2011
2010
2009
Dividend policy on ordinary sharesWe continue to aim at a flexible payout ratio of 40% to 50%of net profit adjusted for amortization and impairment ofacquisition-related intangible assets and goodwill/badwill,integration costs, and one-offs, provided that our financialposition allows for it. Shareholders have a choice betweencash and shares.
In 2014, we further enhanced our financial position. Inaddition, our business sustained growth throughout the year,and we improved profitability. As a result, and in line with ourdividend policy, we will propose to our shareholders adividend payment of € 1.29 per ordinary share, based on apayout of 50% (2014: 45%). We will again offer shareholdersa choice between cash and shares. The value of the stockdividend, which will be charged to the tax-exemptdistributable share premium reserve, will be around the sameas the value of the cash dividend, and will not be subject toDutch dividend withholding tax. The ex-dividend date will beApril 8, 2015. The number of shares entitled to dividend willbe determined on April 9, 2015 (record date). The electionperiod for shareholders will run from April 10 up to andincluding April 24, 2015 (3 p.m. CET). On April 27, 2015, thestock dividend conversion rate will be set on the basis of thevolume-weighted average share price of Randstad during theperiod from April 20 up to and including April 24, 2015. Thepayment of cash dividend and the delivery of shares will takeplace on April 30, 2015. Shareholders will receive a cash
dividend, unless they opt for a stock dividend (Last year,66.6% of shareholders opted for the stock dividend).
We will also propose a dividend payment on preferenceshares B and C of € 12.6 million.
Per share data
2014 2013 2012 2011 2010
Dividend (€) 1.29 0.95 1.25 1.25 1.18
Dividend yield (%) 3.2 2.0 4.5 5.5 3.0
Payout (%) 50 45 59 53 60
Diluted EPS (€) 1 2.54 2.07 2.11 2.32 1.96
EBITA (€) 2 3.92 3.26 3.25 3.49 2.97
Free cash flow (€) 2.66 1.65 2.69 2.53 1.80
Equity (€) 18.28 16.40 15.74 16.83 16.591 Before amortization and impairment of acquisition-related intangible assets and
goodwill, badwill, integration costs, and one-offs.2 Underlying.
Share performance
Share price developmentThe share price ended the year 2014 at € 40.06, which was15% below the 2013 closing price of € 47.15. In April, adividend of € 0.95 per ordinary share was paid out. As a result,the total shareholder return (TSR) for 2014 was -12%.
In the first half of the year, the share price dropped from€ 47.15 to € 39.59, as macroeconomic expectations werelowered. The second half of the year saw the share pricefluctuate across a wide range, but it ultimately ended the yearat € 40.06, being 1% above the half-year price, despite themacroeconomic expectations being lowered even further.
Share price developmentin millions of €, unless otherwise indicated
2014 2013 2012 2011 2010
Closing price (€) 40.06 47.15 27.81 22.86 39.50
TSR (%) (12) 74 27 (39) 140
High (€) 49.54 47.15 30.09 43.10 42.00
Low (€) 31.40 27.81 20.52 19.59 27.50
P/E ratio 15.8 22.8 13.2 9.9 20.2
EV/Sales 0.44 0.55 0.34 0.32 0.54
Market capitalization 7,215.2 8,366.0 4,785.3 3,907.9 6,716.9
Enterprise value 7,637.2 9,127.0 5,881.0 5,210.5 7,616.2

86
annual report 2014 − Randstad Holding nv
Market capitalization of ordinary Randstad shares amountedto € 7,215.2 million on December 31, 2014, compared to€ 8,366.0 million on December 31, 2013.
Share price development Randstad ordinary shares
compared to Euronext AEX Index and peers
AEX Adecco Randstad Manpower
120
110
100
90
80
70
60
Dec
No
v
Oct
Sep
Au
g
Jul
Jun
May
Ap
r
Mar
Feb
Jan
Analyst recommendationsSome 23 financial analysts regularly publish reports onRandstad. At the end of 2014, around 57% had a 'buy' rating,while 30% of analysts recommended holding on to ourshares, and 13% (three analysts) had a 'sell' rating. OnDecember 31, 2014, the average target share price – accordingto analyst consensus – was around € 43. The highest targetprice was € 54, and the lowest was € 27.
Earnings per share reportingRandstad reports earnings per share on a fully diluted basis.We focus on earnings per share before amortization andimpairment of acquisition-related intangible assets andgoodwill, badwill, integration costs, and one-offs. In our view,this gives the best reflection of underlying businessperformance.
Diluted earnings per sharebefore amortization, impairment, badwill, integration costs, and one-offs
2014 2013 2012 2011 2010
Q1 € 0.45 € 0.33 € 0.39 € 0.38 € 0.28
Q2 € 0.64 € 0.51 € 0.51 € 0.59 € 0.45
Q3 € 0.77 € 0.65 € 0.62 € 0.66 € 0.59
Q4 € 0.68 € 0.58 € 0.60 € 0.69 € 0.64
Full year € 2.54 € 2.07 € 2.11 € 2.32 € 1.96
Share price development of Randstad ordinary shares
7,000
6,000
5,000
4,000
3,000
2,000
1,000
50
45
40
35
30
25
1 February 20, 2014 - Q4 and full year 2013
2 April 7, 2014 - Ex-dividend
3 April 30, 2014 - Q1 results
4 July 31, 2014 - Q2 results
5 October 30, 2014 - Q3 results
6 November 20, 2014 - Capital Markets Day
Volume
(x 1,000)
Share price
movements (€)
1 2
3
4
5
6
investor relations & share performance

87
annual report 2014 − Randstad Holding nv
Introduction
Risk and opportunity management is embedded in ourstrategy and is essential for achieving our targets.Entrepreneurship is actively stimulated throughout theorganization, and we encourage people to identify and seizeopportunities. At the same time, we counterbalance this withclear risk boundaries, which are set for the operatingcompanies in the various policies and agreed in the budgets.
This section provides a high-level description of our Risk &Control framework and its effectiveness, substantiating ourRisk & Control statement. We discuss in turn the variouselements that together make up our Risk & Controlframework, and describe how we manage our company inthis regard.
Risk profile
Our risk profile is closely determined by our geographiccoverage. We have wide geographic coverage, which meansour exposure is spread across both mature and emergingmarkets, which are experiencing a variety of economicconditions. These conditions are very relevant to developmentin our markets. Since it remains extremely difficult to predictfuture economic developments successfully, we focus onresponding to actual performance in all of our local markets.Our business model, our processes and our weekly indicatorshelp to ensure that we are flexible enough to quickly respondto growth or decline in our markets. To protect our workingcapital positions, we keep cash levels in our countries to aminimum. We continuously and closely monitor key risks andopportunities, both locally and centrally, and respondappropriately to any emerging risks.
Missing out on opportunities can also result in a loss. Wetherefore focus on 'copying and pasting' successful conceptsand best practices across the Group. We concentrateinnovation in those parts of our organization where success ismost likely. In addition, we have a dedicated entity, theRandstad Innovation Fund, to secure access to outsideinnovation.
Risk & Control managementapproach
global risk &
control framework
risk appetite
locally tailored
approach
Risk & Control management approach
We manage our risks and opportunities following localcircumstances. We operate in many markets around the
Sensitivity analysis
change impact on assumption FY 2014
Revenue +/-1% +/- € 32 million EBITA Flat gross margin and no change to cost base
Revenue +1% + € 16 million EBITA Flat gross margin and target 50% conversion (ICR)
Revenue (1%) - € 16 million EBITA Flat gross margin and target 50% recovery (RR)
Gross margin +/-0,1% +/- € 17 million EBITA Flat revenue and no change to cost base
Gross margin +0.1% + € 9 million EBITA Flat revenue and target 50% conversion (ICR)
Gross margin -0.1% - € 9 million EBITA Flat revenue and target 50% recovery (RR)
Operating expenses +/-1% +/- € 25 million EBITA
USD +/-10% +/- € 16 million EBITA Stable revenue and margin in US
GBP +/-10% +/- € 1 million EBITA Stable revenue and margin in UK
JPY +/-10% +/- € 2 million EBITA Stable revenue and margin in Japan
Interest rate +100 bp +/- € 7 million Financial charges Average net debt 2014
Net debt +/- € 200 million +/- € 1 million Financial charges Stable interest rates
risk & opportunity managementrisk & opportunity management

88
annual report 2014 − Randstad Holding nv
globe. This requires a flexible approach to opportunity andrisk management. Our global Risk & Control structure isflexible and customized to local circumstances. Factors that weconsider in our Risk & Control framework include the size, theservice offering, and the local regulatory and marketenvironment of the individual operating company.
Risk appetite
Our risk appetite is aligned with our strategy and priorities and is broken down into four risk areas:- Strategic: We allow strategic risks in the pursuit of
profitable growth and changes in our business mix in bothmature and emerging markets. Given the volatility of themarkets and economic climates in which we operate, theadaptability of our people, our service offering, and ourinfrastructure plays a key part in enabling us to identifyand seize opportunities.
- Operational: We take a balanced approach to operationalrisk, mainly related to increased productivity in the field,meaning that we consider both the risk and the reward ofkey business decisions.
- Financing & Reporting: We maintain a prudent financingstrategy, even when undertaking major acquisitions, andtherefore take controlled risks in this area. Only minimalrisk is accepted in relation to errors in our reporting.
- Compliance: We consider adherence to laws, regulations,and agreements to be fundamental in enabling us toprovide our candidates, our clients, and our people withquality services. Compliance is strongly embedded in the
culture of our company. We therefore take a strictapproach to breaches of our core values and businessprinciples.
The table titled 'Sensitivity analysis' illustrates the impact ofthe various changes and trends on our revenue, gross margin,operating expenses, and currency and interest rates on ourEBITA. Typically, a trend will include a number of theseelements. Overall, we aim to achieve an incrementalconversion ratio of 50% (see 'Activity-based field steering' formore details).
Risk & Control framework
Our global Opportunity, Risk & Control framework is designedto secure the Group's in-control position. The componentsprovide Group-wide comfort in terms of control, while givingthe flexibility to adapt to the local business environment andenabling entrepreneurship. The components of theframework are shown in the Risk & Control frameworkdiagram. Our Risk & Control framework is based on the COSOinternal control framework, complemented with elementsfrom various management and control models.
Tone at the topThe tone at the top is derived from our core values, which areembedded in our leadership style. Randstad benefits fromstrong leadership, built during 54 years of experience. Wehave been able to extensively develop management byexample, based on our core values and business principles.
the tone at the top is derived from our core values ,which are embedded in our leadership style
review and audit give us comfort that our risk & control objectives are realized
Risk & Control framework
performance management
steers our organization
risk & control activities
secure our in-control position
matchcandidate service concepts and
best practices determine our
way of working
client service concepts and
best practices determine our
way of working
risk & opportunity management

89
annual report 2014 − Randstad Holding nv
Our core values are embodied in 16 business principles, whichform the basis for the behavior we expect from all ouremployees. The Executive Board secures alignment of the toneat the top among senior management, while seniormanagement ensures alignment among staff in our operatingcompanies. This alignment exercise is a continous effort.
Upon joining our company, our employees receive a copy ofand training in the business principles and acknowledge thatthey will comply with them. Periodic refresher courses are alsobeing implemented. These courses also form a crucial part ofour strategy for integrating acquired companies.
A misconduct reporting procedure is in place, which enablespeople to report any suspicion they have of wrongdoing via asecure phone line or website. In 2014, we received 136complaints, 52 of which were anonymous. These complaintswere assessed and investigated where necessary by the localintegrity officers and/or the central Integrity Officer, togetherwith the Group Business Risk & Audit department. Whendeemed necessary, to prevent re-occurrence, disciplinaryactions and mitigating controls were put in place.
Each year, our Great People Survey is carried out by anexternal provider. This allows us to monitor the engagementof our employees, and provides indicators of the tone at thetop in each of the operating companies and at the headoffice. Based on the results, action plans are initiated. TheGreat People Survey is reviewed by Group HR and theExecutive Board. The results are taken into account inappraisal discussions as well as in setting our managers' bonustargets.
Performance managementPerformance management steers our organization.
The two-year plans and rolling forecasts of our operatingcompanies are set in accordance with strategic priorities andmarket trends. While setting their budgets for the year aheadin relation to their plan, the operating companies alsodescribe their main risks and opportunities. By constructingvarious scenarios, we are able to prepare for and react tomarket volatility. Monthly rolling forecasts and conversion-ratio monitoring are used to enable us to make rapidadjustments to our cost base.
Our operating companies report various performanceindicators on financial results, underlying process activities,and people. By setting reporting dates, performanceindicators, and formats, we provide clarity that enables us toplan ahead, without disrupting our focus on day-to-dayactivities. By further combining this planning and control cyclewith our focus on activity-based field steering in 2014, ourmonitoring systems have improved, giving more depth in thebusiness review meetings. See the section 'How we measureperformance' in for more details.
Concepts and best practicesOur client and candidate services concepts and best practicesdetermine our way of working. Our strong concepts, asdescribed in the section 'Value for our clients and candidates',provide best practices for our core commercial operations. Ourconcepts are tailored to local practices and market conditions.Concept audits are carried out to identify, understand, andremediate deviations to ensure our objectives are realized.
Blueprints describe our operational best practices. They areused to govern our key processes and to enable our localoperations to adapt and tailor best practices to their needs.The updated contract-to-cash blueprint was fullyimplemented in 2012. In 2014, the updated procurement-to-pay blueprint was implemented. It includes an authorizationprocedure for purchases and the expected tender procedure.In addition, a new financial close process blueprint wasdeveloped and rolled out to all operating companies. Thisblueprint is relevant for all historical financial and non-financial information, including the income statement,balance sheet, cash flow statement, and disclosures.
Our policies are derived from best practices identified.Examples of these policies are our Finance Manual, the DataProtection Policy, and the Bribery, Gifts and Hospitality Policy.Group policies are assessed and updated annually as required,and are then communicated throughout the company invarious ways. The authority levels within the Group arespecified in Randstad's Approval and InformationRequirements (AIR) policy. This policy, updated in 2014, hasbeen adopted by the managing directors and CFOs of theGroup's operating companies. The requirements specifyevents that either need to be approved by or reported to theExecutive Board.
Risk & Control activitiesRisk & Control activities secure our in-control position.
Our operating companies draw up risk registers semi-annually.These show the local business risks they may be exposed to,together with action plans and deadlines to address them.The risk registers are drawn up using input from Risk &Control meetings that are held at least twice a year in mostoperating companies. The aggregated data enables us to getinsight into the most important risks impacting the Group.These are discussed twice a year by the Executive Board andby the Audit Committee.
To avoid surprises, operating companies and Holdingdepartments assess, on at least a semi-annual basis, thecomponents of the Risk & Control framework. The results ofthis assessment are reported to the Group's Business Risk &Audit department, and possible improvements are discussedwith local management and the responsible Executive Boardmember. Every six months, the department reports to theExecutive Board and the Audit Committee on the state of thein-control situation in the Group. The Executive Board and

90
annual report 2014 − Randstad Holding nv
Audit Committee set priorities and provide guidance tofurther enhance control throughout the Group.
Our key control framework contains a concise list of key risksand practical control activities to guide all operatingcompanies. The structure of the key control framework isorganized around the core process within Randstad, the‘funnel’. Every six months, operating companies assess theircontrols in relation to the risks established during theaforementioned Risk & Control meetings. The results of thesecontrol self-assessments are challenged by the Group'sBusiness Risk & Audit department and tested on a risk base.Where necessary, Risk & Audit staff help local operatingcompanies to improve their processes and controls.
In 2014, the key control framework was updated, usingcontrol experiences and best practices from 10 differentoperating companies. This has led to a renewed managementfocus on internal control and an improved control situationthroughout the Group. By implementing web-based toolingfor opportunities, risk, control, and audit, we are able tosystematically and closely monitor the adequacy of our Risk &Control framework. In 2014, the tool was used in our 10largest operating companies. In 2015, the tool will be rolledout to the rest of our operating companies.
Our insurance risk program follows the same principles as ourglobal Risk & Control framework. Insurable risks areperiodically assessed, and Group-wide risks are transferred tothe insurance market under our global insurance program.We regularly review our insurance policy coverage and thecredit ratings of our insurers.
Reviews and auditsReviews and audits reassure us that our risk and controlobjectives are being realized.
The semi-annual Risk & Control framework assessments onoperating company level lead to a Group-wide in-controlbenchmark discussion in meetings of both the Executive Boardand the Audit Committee. In these discussions, Risk & Control
priorities are set, and the Group Business Risk & Audit plan isupdated and agreed. The annual Group Business Risk & Auditplan is risk-based. The Executive Board identified four focusareas for 2014: candidate screening, client contractmanagement, client contract liabilities, and the update of thekey control framework.
The Group Business Risk & Audit department leads theinternal audits and collaborates closely with other corporatedepartments (most commonly IT, Legal, and Tax) and the localRisk & Audit managers to cover the key risks. Findings andrecommendations from the audits are discussed with theoperating companies. Local management is responsible forsetting action plans and deadlines. The progress of the actionplans is monitored by management and through the BusinessRisk & Audit network. The internal audit reports aresubmitted to the Group CFO and the responsible ExecutiveBoard member.
The Business Risk & Audit staff network provides a platformfor sharing best practices, and is a sounding board foremerging opportunities, risks, and possible internal controlgaps. The network consists of a cross-disciplinary team withRisk & Audit staff from the operating companies, and theGroup's Business Risk & Audit department.
In 2014, we detected a few cases of fraud, involving, forexample, the recording of non-existent permanentplacements, and the payment of fictitious flex-workers. Thesefraud cases were investigated, and in cooperation with localmanagement, corrective action was taken. These casesinvolved small amounts of money, and as such had nomaterial impact on the results of the Group.
Operating companies submit their in-control statement semi-annually. This statement certifies that the corporate policieshave been complied with, and explains any exceptions ordeviations that have occurred. The statement therefore formsa cascaded certification, which assists the Executive Board inmaking the conclusions required by the Dutch FinancialSupervision Act.
Putting the framework into practice
Framework component Practical applications to our business
Tone at the top Core values and business
principles
Onboarding training Great People Survey Misconduct reporting
procedure
Performance management Strategic plan and rolling
forecast
Scenarios and conversion-
ratio monitoring
Planning, reporting and
review cycles and activity-
based field steering
Business review meetings
Concepts and best practices Strong concepts
(commercial best practices)
Corporate policies and
procedures
Blueprints (operational
best practices)
Authority levels
Risk & Control activities Risk register Key control framework Risk & Control round tables Global insurance program
Reviews and audits Semi-annual Risk & Control
framework self-assessments
In-control benchmarks Internal audits In-control statement for
each operating company
risk & opportunity management

91
annual report 2014 − Randstad Holding nv
Deloitte has been appointed to act as our external auditorfrom 2015 onwards. In their audit plan, Deloitte will cover allfinancially significant operations. As such, these audits are animportant supplement to our own review and audit activities.
The Audit Committee is informed about the results of bothexternal and internal audits. In 2014, the committee met fivetimes. The role of the Audit Committee includes monitoringthe risk management and control systems, the quality of thefinancial information, and the follow-up of recommendationsmade as a result of the audits. More information can be foundin the Report of the Supervisory Board and in the 'Corporategovernance' section.
Our main risks
Our main risks are those that threaten the in-control positionof the Group over the next three years. An overview of theserisks is provided below, including the actions taken to mitigatethese risks and any related opportunities.
The risks have been categorized into four areas: Strategic,Operational, Financial & Reporting, and Compliance. The risksshown in bold are currently considered to represent our sixmain risks. This list should not be considered exhaustive.
Strategic 2014 Operational 2014 Financial & Reporting 2014 Compliance 2014- Adapting to economic
conditions 1
- Protecting our reputation
- Contractual liability- System security and data protection- Business continuity and data recovery- Retention of talent
- Credit risk- Other financial reporting
risks
- Increased complexity of lawsand regulations
- Competition law compliance- Tax and labor law compliance- Candidate screening
1 The risks shown in bold are considered to represent our main risks in 2014 and 2013 respectively. This list should not be considered exhaustive.
Strategic 2013 Operational 2013 Financial & Reporting 2013 Compliance 2013- Adapting to economic
conditions- Stability of the eurozone- Protecting our reputation
- Contractual liability- Business continuity- Retention of talent
- Credit risk- Other financial reporting
risks
- Increased complexity of lawsand regulations
- Tax compliance- Competition law compliance- Candidate screening- Client claims on French subsidies
Strategic risks Risk-mitigating actions Related opportunities
Adapting to economic conditionsOur operations are highly susceptible tomacroeconomic volatility. Although we seeeconomic improvement in some of theterritories, we continue to focus on the flexibilityof our cost base. Not being flexible enough torespond in a timely way to economic conditionscould have a negative impact on the profitabilityof the Group. Conversely, cutting costs toomuch could limit our ability to take advantage ofa market upturn.
In addition, the business landscape is changing,with new technologies being developed thatover time may displace traditional businessservices.
The geographical diversity and the spread of theGroup's revenues across mature and emergingmarkets has helped us to mitigate the impact ofvolatile economic conditions worldwide.
By 'managing through the cycle', we provideoperating companies with guidelines on how to reactto changes in economic conditions. These guidelinesare described in the section 'Performance'.
The Randstad Innovation Fund was launched inMarch 2014. It is a strategic corporate venture fundfor investing in HR technology companies.
With our strong concepts and varied service offering, wecan respond appropriately to different market conditions,and thus address changing macroeconomic conditions.
Our operations respond differently to economicuncertainty in the market. For example, in an uncertainmarket, our clients tend to use more temporary workersrather than hire permanent staff. Staffing and HRSolutions tend to be more resilient to a weaker market,with Professionals tending to perform better in a strongermarket.
With the timely investment in HR technologies, there willbe opportunities for innovative solutions to make HRservices more efficient and bring fresh answers to futureHR challenges.
Protecting our reputationRandstad and Tempo-Team are valuableinternational brands, and the Randstad brand isused in all countries in which we operate.Damage to the Randstad or Tempo-Team brandin one country could have a serious impact onour global reputation.
We protect the strong reputation of our brands byensuring that all our people adhere to our core valuesand business principles, and comply with our policiesand guidelines. This ensures that, when necessary, wereact competently, using internal and externalcommunications to mitigate potential damage. Weuse our Net Promoter Score as a metric to measureour image. We also have a misconduct reportingprocedure, so that our people and stakeholders canreport any complaints or breaches of compliance.
Our brands are managed centrally, which ensuresconsistency across the world, and increases costefficiency. Locally targeted marketing is applied by theoperating companies. This will continue to strengthen theglobal recognition of our brands in a cost-effectivemanner.

92
annual report 2014 − Randstad Holding nv
Operational risks Risk-mitigating actions Related opportunities
Contractual liabilityFor contract liability, especially in Anglo- Saxoncountries, clients ask us to take a greater shareof the liability for our flexworkers while on theirpremises and under their supervision. Acceptinginappropriately high contractual liability couldresult in a client making a claim that wouldmaterially affect the Group’s results.
Requirements from client may vary resulting inunique contract clauses. Deviation fromstandard contract clauses increase the likelihoodof contract liability.
Whenever possible, we work with standard contracts. In the case of non-standard terms, a cost-benefit analysis is carried out to determine whetherprojected profit levels are high enough to absorb the costs associated withthe additional risks. The local legal department reviews the contract and therisk and reward assessment, after which operating-company managementdecides whether to accept the contract. In certain cases, additional approvalsfrom the Executive Board are required, as set out in the contract liabilitypolicy. This risk mitigation is coupled with a Group liability insurance, whichprovides us with cost-effective coverage of many potential risks.
In 2014, a project team was engaged to further mitigate contractual liabilityrisks. Currently, the project team is focusing on further improvement of ourcontract delivery models and contract management. In addition, periodiccompliance reviews are being conducted by GBRA and Group Legal.
Improvement in contractmanagement will add value toour clients by improving ourservice delivery models andpractices.
System security and data protectionIncreased integration of business withtechnology in both front office and back officehas increased our exposure to security, data andsystem availability risks. Leakages of candidate oremployee personal data and company-sensitiveinformation pose significant financial andreputational risks. In addition, with the recentand upcoming legislative focus on personal dataprotection, the risk exposure deriving from datasecurity and availability has escalated, along withgreater integration of our business withtechnology.
Our Group data protection policy is localized for all operating companies. Weperform continuous rotating IT audits to ensure our IT controls are up to dateand effective in all our countries. For example, we perform periodical securitypenetration tests, implement two-step verification for e-mail accounts, andreview the data recovery programs for all operating companies. In addition,awareness activities are rolled out to increase employees' awareness of ITsecurity risks. Furthermore, periodic compliance audits are conducted.
Improvement in system securitygives us the opportunity to ensuredata protection for all ourcandidates and clients and soincrease the value of our servicesoffering to them.
Business continuity and data recoverySerious long-term business disruption of ITsystems could result in financial losses, fines, anddamage to our reputation. For example, ourbusiness entails paying flexworkers on a weeklyor monthly basis, and then billing these amountsto our clients. A problem with one of our ITsystems for payrolling and billing could cause amajor business disruption in a country.
We have local IT systems in each country for payrolling and billing. Thisspreads our risks of an IT failure, which would be limited to one country oroperating company.
On a country level, disaster recovery plans are in place or are being developedto address possible IT failures and are tested at least once a year. Group ITperforms regular audits on the disaster recovery plans. These audits result inbest-practice sharing and continuous improvement.
In several countries, we now havea shared service center, and weare initiating cloud infrastructureusage. This has increasedefficiency and further improvedthe quality of business continuityplanning by concentratingexpertise.
Retention of talentPeople are our most important asset, and it ischallenging to retain them in a competitivemarket. If we cannot attract and retain the rightpeople, we could fail to achieve our objectives.
Retention rates are analyzed and reported by every operating company on amonthly basis. Our global People Survey is carried out annually to monitorengagement levels at each operating company and each department. Swiftaction is taken by local and Group HR departments to investigate and reverseany negative trends.
We provide training for the purposes of coaching and developing our people.In addition, we identify our future leaders and provide managementdevelopment programs for those with high potential.
Our reward systems, which are tailored to local market conditions, includebonuses and employee share purchase plans among other things.
It is our rule to fill 80% ofmanagement positions throughinternal promotions. This increasesthe loyalty of our people. As aresult, we will continue to have apipeline of talent who understandour people, our clients, and ouroperations.
risk & opportunity management

93
annual report 2014 − Randstad Holding nv
Financial & Reporting risks Risk-mitigating activities Related opportunities
Credit riskIn the current economic climate, someclients try to delay payment of invoices.An increase of just one day in the timetaken to collect the receivable (days salesoutstanding or DSO) leads to greaterusage of operating working capital andincreased interest costs.
Invoicing and credit control policies and best practices are included in ourblueprints. Operating companies have an operating working capital chargeincluded in their results, which highlights awareness throughout the Group ofthe cost of capital. DSO is a component of the budgets and performancetargets of operating company management. In addition, a provision is madefor all receivables older than 182 days.
Compliance with the contract-to-cash blueprint is monitored by the GroupBusiness Risk & Audit department. Further details on credit risk are providedin note 3 to the financial statements: 'Capital and financial risk management'.
As more best practices are implementedacross our operating companies in thecontract-to-cash cycle, our approach tocredit risk becomes more rigorous acrossthe Group, resulting in a decrease ofDSO and correspondingly loweroperating working capital.
Other financial reporting risksOther financial reporting risks mainlyrelate to the valuation of deferred taxassets and goodwill, to the provisions forclaims of third parties, and to revenuerecognition.
Further details on these risks and risk-mitigation actions are included in note 3to the financial statements: 'Capital and financial risk management'.
Compliance risks Risk-mitigating actions Related opportunities
Increased complexity of laws andregulationsThe complexity and quantity of laws andregulations have increased over the years,especially with respect to data protection,competition, staffing, contract work andpayrolling services. Consequently, we areexposed to greater risk of non-compliance, which could result in classactions, claims, and fines or reputationaldamage.
In all our major operations worldwide, we have in-house legal teams whohelp management comply with local laws and legislation. Every quarter, thein-house legal counsels of the largest operating companies get together, andonce a year a legal conference is organized for all in-house legal counsels,with the aim of sharing knowledge. Topics discussed at these conferencesinclude updates on new laws and regulations, and legal risk management.
If we are affected by new laws and regulations (e.g., EU data protectionregulation), project teams with Legal, Risk & Audit, and IT staff, and otherexperts are formed to anticipate the effects, provide training, and ensure thatproper processes and controls are embedded in our local organizations.
New laws and regulations require acritical review of existing training,systems, policies, and procedures. Thiskeeps these processes and documentsup to date and topical.Our knowledge regarding newlegislation (e.g., EU data protectionregulation) can be shared with ourclients, strengthening our relationshipwith our clients.
Competition law complianceOur staff may breach competition law byintentionally or accidentally sharinginformation. This could result in materialfines or penalties and could harm ourbrand.
On July 10, 2013, the FrenchCompetition Law Authorities started aninvestigation into Randstad France and anumber of competitors. The investigationrelated to certain French operations and,in particular, activities concerning vendor-neutral platforms relating to HRoutsourcing management.
Training with regard to competition law compliance, our core values and ourbusiness principles forms an integral part of our onboarding program, andmanagement has to ensure that written acknowledgement is obtained thatsuch training has been understood and compliance is observed. Weencourage our employees to report any breaches they find through themisconduct reporting procedure. When developing new business models orconcepts, our Legal department (and if necessary competition law experts) isconsulted to ensure legal compliance.
Randstad France is cooperating closely with the French Competition LawAuthorities in relation to their investigation. Consistent with Randstad's corevalues and business principles, we seek to conduct our business inaccordance with all applicable laws, and have invested considerable time andresources in improving competition controls and awareness in our Frenchoperation and in abiding by the commitments given to the authorities,following a previous investigation in France (which concluded in 2009). Weare confident that the outcome of the present investigation will be positive.

94
annual report 2014 − Randstad Holding nv
Compliance risks Risk-mitigating actions Related opportunities
Tax and labor law compliance
Complex and changing labor, tax andsocial security regulations could lead to alack of clarity and errors in wage, socialsecurity and payroll tax compliance,leading to possible disputes, claims andfines.
The payroll calculation process and actual calculation is subject to anindependent periodic review. Where labor legislation is unclear, we monitormarket developments regarding similar cases, as well as reviewing ourexisting policies and procedures. Group Tax together with GBR&A performregular payroll and payroll system audits in selected countries in order toreview compliance with local laws and regulations.
In our payroll compliance audits, we alsofocus on identifying best practices toincrease efficiencies in administeringpayroll taxes and social securities.
Candidate screeningOur candidates may be working withpatients, children or the elderly, or in thefinance services industry, for example. Insuch cases, criminal record checks arerequired. Failure to carry out this type ofscreening could lead to, for example,patients receiving the wrong medicaltreatment or fraud being committed.
Deficiencies in the screening of candidates were identified in varioussituations. In response, we tightened control in this area, and the ExecutiveBoard added the screening of candidates to the 2014 and 2015 focus areasof Group Business Risk & Audit. In cooperation with local Risk & Audit staff,current compliance has been tested. Candidate screening has become apermanent priority on the agenda of our operating companies. Progressreviews are carried out through the Risk & Audit networks and via internalaudits. Best practices are identified and shared.
We are continuously developing andsharing our best practices for candidatescreening across the Group. Throughour increasingly rigorous approach tosuch matters, we will be able todemonstrate to clients the consistentlyhigh quality of our candidates across theglobe.
Conclusions
The Executive Board is responsible for Randstad’s Risk &Control framework and for reviewing its effectiveness. Theframework, as described earlier, is designed to manage therisks that may prevent us from achieving our businessobjectives. However, the framework cannot provide fullassurance that all material misstatements, cases of fraud, orviolations of laws and regulations will be prevented. Futureeffectiveness of the framework is subject to the risk that thecontrols in place or the degree of compliance with the Group'spolicies and procedures may deteriorate.
In 2014, the Executive Board reviewed and analyzed theStrategic, Operational, Financial & Reporting, and Compliancerisks to which the Group is exposed, and it regularly reviewedthe design and operational effectiveness of the Randstad Risk& Control framework. The outcome of these reviews wasshared with the Audit Committee and the Supervisory Board,and was discussed with our external auditor.
The Risk & Control framework should ensure consistent andreliable financial reporting, both internally and externally. Theoperating companies develop annual business plans andbudgets, which are subject to amendment and approval bythe Executive Board. Subsequently, the actual performance ofthe operating companies is measured against these businessplans and budgets, and the results are discussed in regularreview meetings between the operating companymanagement and the responsible Executive Board member.
In accordance with best-practice provision II.1.4 of the DutchCorporate Governance Code, we have assessed the design andoperational effectiveness of our Risk & Control framework.Based on the activities performed during 2014, and inaccordance with best-practice provision II.1.5, the Executive
Board considers that, during 2014, the Risk & Controlframework regarding the Financial & Reporting risks workedeffectively, and that this provides reasonable assurance thatthe financial statements 2014 do not contain any materialmisstatements.
In accordance with the Dutch Financial Supervision Act,section 5.25c, the Executive Board declares that, to the best ofits knowledge:- The financial statements for 2014 provide, in accordance
with IFRS as endorsed by the EU, a true and fair view of theconsolidated assets, liabilities and financial position as atDecember 31, 2014, and of the 2014 consolidated incomestatement of Randstad Holding n.v.;
- The annual report provides a true and fair view of thesituation as at December 31, 2014, and the state of affairsduring the financial year 2014, together with a descriptionof the principal risks faced by the Group.
Diemen, the Netherlands, February 17, 2015
The Executive Board,
Jacques van den Broek Linda GalipeauRobert Jan van de Kraats Chris HeutinkFrançois Béharel Leo Lindelauf
risk & opportunity management

95
96 Executive Board
98 Supervisory Board
100 Report of the Supervisory Board
107 Remuneration report
111 Corporate governance
governance

96
Executive Board

97
annual report 2014 − Randstad Holding nv
Board members from left to right:
Chris Heutink(1962, Dutch)
Robert Jan van de Kraats(1960, Dutch)CFO and Vice-Chairman of theExecutive Board
Jacques van den Broek(1960, Dutch)CEO and Chairman of theExecutive Board
- Joined Randstad in 1991- Appointed to the Executive Board in
2014
BackgroundChris Heutink obtained a master'sdegree in history. He started his careerat Randstad as a consultant in theNetherlands. Various managementpositions followed until 2004 when hewas promoted to become managingdirector of Randstad Poland. Aftermoving back to the Netherlands in2007, he became director ofoperations. In 2009, he was appointedmanaging director of RandstadNetherlands.
ResponsibilitiesChris Heutink is responsible for alloperations in the Netherlands(Randstad, Tempo-Team and Yacht).
- Joined Randstad in 2001- Appointed to the Executive Board in
2001- Appointed as Vice-Chairman of the
Executive Board in 2006
BackgroundA certified auditor, Robert Jan van deKraats began his career with one ofthe big four accountancy firms. In1989, he joined an internationaltechnology group as finance and ITdirector for the Netherlands. He heldvarious senior positions with aninternational credit insurance groupfrom 1994, and in 1999 he wasappointed CFO and member of itsmanaging board. He joined Randstadin 2001 as CFO. He is also a member ofthe Board of Directors of OCI NV and amember of the monitoring committeeDutch corporate governance code.
ResponsibilitiesRobert Jan van de Kraats is responsiblefor Group finance & accounting, tax,treasury, business risk & audit, legal, IT,and investor relations. In addition he isresponsible for Japan and India.
- Joined Randstad in 1988- Appointed to the Executive Board in
2004- Appointed as CEO and Chairman of
the Executive Board in 2014
BackgroundAfter graduating in law, Jacques vanden Broek held a managementposition with an international tradingcompany until he joined Randstad as abranch manager. Appointmentsfollowed as regional director in theNetherlands and, subsequently,marketing director Randstad Europe.In 2002, he moved to Capac InhouseServices as managing director, alsotaking on responsibility for Randstad inDenmark and Switzerland.
ResponsibilitiesIn addition to his chairmanship of theExecutive Board, Jacques van denBroek is responsible for Germany, UK,Australia, New Zealand, China, HongKong, Singapore & Malaysia, businessconcept development, Global ClientSolutions, HR, marketing &communications, and public affairs.
-
François Béharel(1970, French)
Linda Galipeau(1963, Canadian)
Leo Lindelauf(1951, Dutch)
- Joined Randstad in 2008- Appointed to the Executive Board in
2013
BackgroundWith a Bachelor's degree indistribution management andcommercialization techniques, FrançoisBéharel joined Vedior in 1999 as aregional manager and, followingvarious promotions, became CEO ofVedior France in May 2007. Followingthe acquisition by Randstad, he wasappointed President and CEO of thenew combined Randstad GroupeFrance and played a key role in theintegration of its businesses.
ResponsibilitiesFrançois Béharel is responsible forFrance, Spain, Belgium & Luxembourg,Portugal, Brazil, Argentina, Chile, andUruguay.
- Joined Randstad in 1995- Appointed to the Executive Board in
2012
BackgroundAfter receiving an MBA degree inmarketing and managerial economicsand several years in the staffingindustry, Linda Galipeau joinedRandstad in 1995 as district manager inthe US. In 1997, she started theCanadian operations and in 2008 shewas appointed President of RandstadStaffing in the US.
ResponsibilitiesLinda Galipeau is responsible for NorthAmerica, Mexico, Professionalscoordination, and innovation.
- Joined Randstad in 1979- Appointed to the Executive Board in
2001
BackgroundFollowing his education at an academyfor social studies, Leo Lindelaufgraduated in industrial engineeringand management science. He beganhis career as a community worker.After joining Randstad, he worked asdistrict manager and regional managerbefore being appointed regionaldirector in the Netherlands. He becamemanaging director of Tempo-Team in1994 and managing director forRandstad Europe, including theposition of managing directorRandstad Netherlands in 1999. He isalso a member of the SupervisoryBoard of Macintosh Retail Group NV.
ResponsibilitiesLeo Lindelauf is responsible for Italy,Poland, Austria, Switzerland, Denmark,Sweden, Norway, Czech Republic,Hungary, Slovakia, Greece, and Turkey.

98
annual report 2014 − Randstad Holding nv
Jaap Winter(1963, Dutch)
- Member of the Supervisory Boardsince 2011
- Current term of office 2011-2015
BackgroundJaap Winter is President of theExecutive Board of VU UniversityAmsterdam. Until December 2012, hewas a partner at law firm De BrauwBlackstone Westbroek. He is aprofessor of corporate governance atthe Duisenburg School of Finance anda professor of international companylaw at the University of Amsterdam.He was a member of the Dutchcorporate governance committee andthe European Corporate GovernanceForum. He is a member of theSupervisory Boards of Royal PictureGallery Mauritshuis andHet Concertgebouw NV.
ResponsibilitiesJaap Winter is a member of theRemuneration and NominationCommittee and a member of the AuditCommittee.
Henri M.E.V. Giscardd’Estaing(1956, French)
- Member of the Supervisory Boardsince 2008
- Current term of office 2012-2016
BackgroundHenri Giscard d’Estaing has beenChairman of the Board and CEO ofClub Méditerranée SA since December2002. Before joining ClubMéditerranée in 1997, he held variousmanagement positions at GroupeDanone and Cofremca. He wasformerly a member of the SupervisoryBoard of Vedior NV. He is currentlyalso a member of the Board ofDirectors of Groupe Casino Guichard-Perrachon SA. He privately holds 450ordinary shares in Randstad Holdingn.v.
ResponsibilitiesHenri Giscard d’Estaing is a member ofthe Strategy Committee.
Giovanna KampouriMonnas(1955, Greek)
- Member of the Supervisory Boardsince 2006
- Current and final term of office2014-2018
BackgroundGiovanna Kampouri Monnas is anindependent consultant and formerPresident of the international divisionand member of the ExecutiveCommittee of Joh. Benckiser GmbH.She is a Non-Executive Director of PuigS.L. and Aptar Group Inc. She is also amember of the International Academyof Management.
ResponsibilitiesGiovanna Kampouri Monnas is amember of the Remuneration andNomination Committee and a memberof the Strategy Committee.
Fritz W. Fröhlich(1942, German)Chairman of the Supervisory Board
- Member of the Supervisory Boardsince 2003
- Current and final term of office2011-2015
BackgroundFritz Fröhlich is the former CFO andVice-Chairman of the Executive Boardof AkzoNobel NV, and is a member ofthe Supervisory Boards of ASMLHolding NV, Rexel SA and PrysmianS.p.A.
ResponsibilitiesFritz Fröhlich is Chairman of theRemuneration and NominationCommittee and a member of the AuditCommittee.
Supervisory Board

99
annual report 2014 − Randstad Holding nv
Frank Dorjee(1960, Dutch)
- Member of the Supervisory Boardsince 2014
- Current term of office 2014-2018
BackgroundFrank Dorjee was Chief StrategicOfficer and member of the Board ofDirectors of Prysmian Spa from March2011 until January 2014. Until itstakeover by Prysmian Spa, he was CEOand Chairman of the Executive Boardof Draka Holding NV from 2010 to2011 and its CFO from 2004 until 2009.
ResponsibilitiesFrank Dorjee is Chairman of the AuditCommittee.
Wout Dekker(1956, Dutch)Vice-Chairman of the Supervisory Board
- Member of the Supervisory Boardsince 2012
- Current term of office 2012-2016
BackgroundWout Dekker is the former Chairman ofthe Executive Board and CEO ofNutreco NV. He is Chairman of theSupervisory Boards of RabobankNederland and the Princess MaximaCentre for Child Oncology and amember of the Supervisory Board ofMacintosh Retail Group NV.
ResponsibilitiesWout Dekker is Chairman of theStrategy Committee and a member ofthe Audit Committee.
Beverley C. Hodson(1951, British)
- Member of the Supervisory Boardsince 2008
- Current term of office 2012-2016
BackgroundBeverley Hodson is a formerManaging Director of WH Smith plc,Sears plc and Boots PLC. She wasformerly a member of the SupervisoryBoard of Vedior NV. She is currently aNon-Executive Director of NFU MutualInsurance and an honorary associateof Newnham College, Cambridge, acouncil member of GloucestershireUniversity and Cheltenham College, aFellow of the Royal Society of Arts anda Director of PutsboroughManagement Ltd.
ResponsibilitiesBeverley Hodson is a member of theRemuneration and NominationCommittee.
-
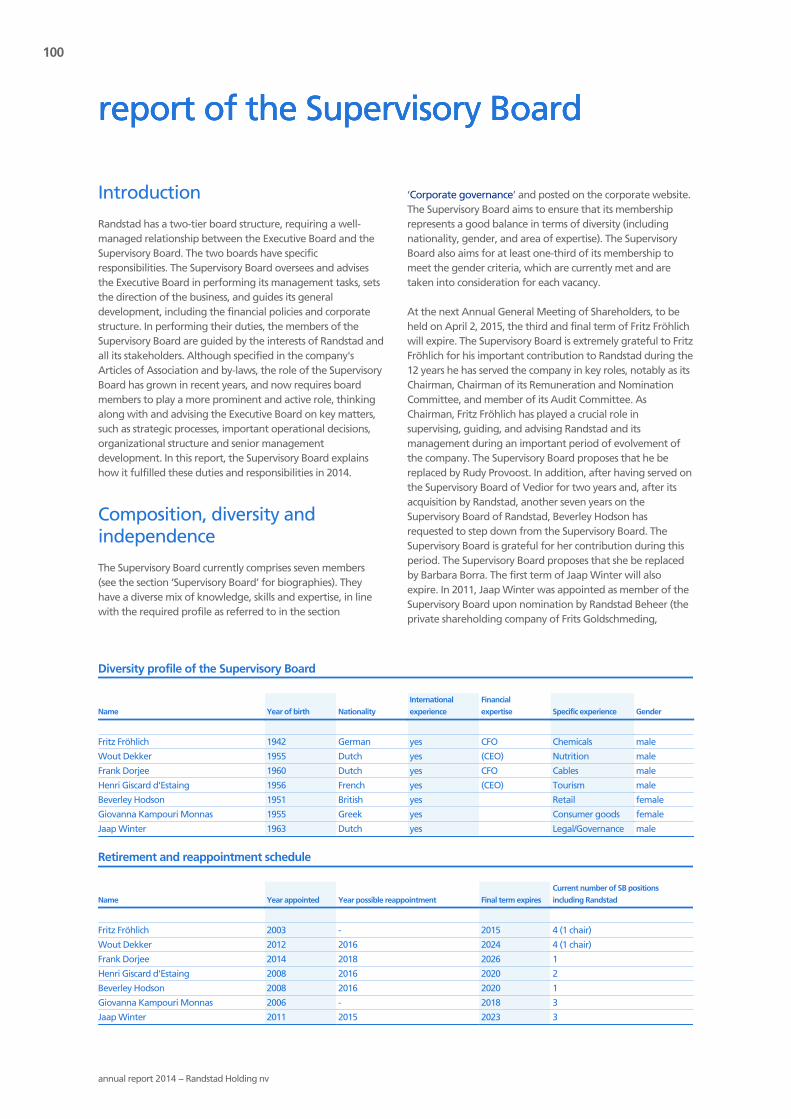
100
annual report 2014 − Randstad Holding nv
Introduction
Randstad has a two-tier board structure, requiring a well-managed relationship between the Executive Board and theSupervisory Board. The two boards have specificresponsibilities. The Supervisory Board oversees and advisesthe Executive Board in performing its management tasks, setsthe direction of the business, and guides its generaldevelopment, including the financial policies and corporatestructure. In performing their duties, the members of theSupervisory Board are guided by the interests of Randstad andall its stakeholders. Although specified in the company'sArticles of Association and by-laws, the role of the SupervisoryBoard has grown in recent years, and now requires boardmembers to play a more prominent and active role, thinkingalong with and advising the Executive Board on key matters,such as strategic processes, important operational decisions,organizational structure and senior managementdevelopment. In this report, the Supervisory Board explainshow it fulfilled these duties and responsibilities in 2014.
Composition, diversity andindependence
The Supervisory Board currently comprises seven members(see the section ‘Supervisory Board’ for biographies). Theyhave a diverse mix of knowledge, skills and expertise, in linewith the required profile as referred to in the section
‘Corporate governance’ and posted on the corporate website.The Supervisory Board aims to ensure that its membershiprepresents a good balance in terms of diversity (includingnationality, gender, and area of expertise). The SupervisoryBoard also aims for at least one-third of its membership tomeet the gender criteria, which are currently met and aretaken into consideration for each vacancy.
At the next Annual General Meeting of Shareholders, to beheld on April 2, 2015, the third and final term of Fritz Fröhlichwill expire. The Supervisory Board is extremely grateful to FritzFröhlich for his important contribution to Randstad during the12 years he has served the company in key roles, notably as itsChairman, Chairman of its Remuneration and NominationCommittee, and member of its Audit Committee. AsChairman, Fritz Fröhlich has played a crucial role insupervising, guiding, and advising Randstad and itsmanagement during an important period of evolvement ofthe company. The Supervisory Board proposes that he bereplaced by Rudy Provoost. In addition, after having served onthe Supervisory Board of Vedior for two years and, after itsacquisition by Randstad, another seven years on theSupervisory Board of Randstad, Beverley Hodson hasrequested to step down from the Supervisory Board. TheSupervisory Board is grateful for her contribution during thisperiod. The Supervisory Board proposes that she be replacedby Barbara Borra. The first term of Jaap Winter will alsoexpire. In 2011, Jaap Winter was appointed as member of theSupervisory Board upon nomination by Randstad Beheer (theprivate shareholding company of Frits Goldschmeding,
Diversity profile of the Supervisory Board
Name Year of birth Nationality
International
experience
Financial
expertise Specific experience Gender
Fritz Fröhlich 1942 German yes CFO Chemicals male
Wout Dekker 1955 Dutch yes (CEO) Nutrition male
Frank Dorjee 1960 Dutch yes CFO Cables male
Henri Giscard d'Estaing 1956 French yes (CEO) Tourism male
Beverley Hodson 1951 British yes Retail female
Giovanna Kampouri Monnas 1955 Greek yes Consumer goods female
Jaap Winter 1963 Dutch yes Legal/Governance male
Retirement and reappointment schedule
Name Year appointed Year possible reappointment Final term expires
Current number of SB positions
including Randstad
Fritz Fröhlich 2003 - 2015 4 (1 chair)
Wout Dekker 2012 2016 2024 4 (1 chair)
Frank Dorjee 2014 2018 2026 1
Henri Giscard d'Estaing 2008 2016 2020 2
Beverley Hodson 2008 2016 2020 1
Giovanna Kampouri Monnas 2006 - 2018 3
Jaap Winter 2011 2015 2023 3
report of the Supervisory Boardreport of the Supervisory Boardreport of the Supervisory Board

101
annual report 2014 − Randstad Holding nv
Randstad's founder and leading shareholder). The SupervisoryBoard proposes that Jaap Winter be reappointed for a secondterm of four years, taking into account his valuablecontribution to the Supervisory Board during his first term.The Supervisory Board has appointed Wout Dekker to takeover Fritz Fröhlich's role as Chairman of the Supervisory Boardeffective April 2, 2015.
The Supervisory Board attaches great importance to theindependence of its members. As a rule, all members, with theexception of no more than one, should be independent in thesense of Article 1 of the Supervisory Board's by-laws. With theexception of Jaap Winter, as explained above, all members areindependent. They were not granted, nor do they possess, anyRandstad options or shares, with the exception of HenriGiscard d'Estaing, who personally holds some shares in thecompany. In 2014, there was no actual or potential conflict ofinterest between Randstad and any Board member.
Induction, training andperformance assessment
Ongoing education is an important part of good governance.New members of the Supervisory Board attend variousinduction sessions at which they are informed by seniormanagement on the financial, reporting, HR, marketing, legaland governance affairs of the Company. Throughout the year,all members of the Supervisory Board visit several ofRandstad's businesses and operations to gain familiarity withsenior management and to develop deeper knowledge oflocal operations, opportunities, and challenges.
At a separate annual meeting held in October 2014, theSupervisory Board discussed at length its composition, its ownperformance and that of its three committees. In preparationfor this annual self-assessment, each member completed anopen-answer questionnaire. The Chairman also conductedone-on-one meetings with each member to discuss theirpersonal performance. Items assessed and subsequentlydiscussed included:- The Board's composition, size, profile, mix of skills and
experience;- The meeting cycle, decision-making, follow-up and
discussion;- Induction, training and performance;- The performance of and reporting to the full Supervisory
Board by the three committees;- The relationship with the Executive Board; and- The performance of the Supervisory Board Chairman and
the company secretary.
An anonymized summary of the main findings, prepared bythe company secretary, was used as the basis for the self-assessment discussion. The Supervisory Board concluded thatall of the items were assessed positively. Team spirit isconsidered strong, encouraging open discussion and clear
understanding of each board member's role. The CEOtransition at the start of 2014 was reviewed, and it wasconcluded that it had gone well. Good progress has also beenmade regarding the points for improvement identified lastyear, which were:- Taking more time for in-depth discussion, jointly with the
Executive Board, and for reflection on topics such asstrategy, innovation, sustainability, competition,geographic mix, the impact of new business ideas, theinternet, and social media. These were some of the keyfocus areas of the strategic retreat held at the end ofSeptember 2014;
- Planning the succession of the Supervisory Board'sChairman and Vice-chairman; and
- Further optimizing the role of the Strategy Committee toincrease the understanding and contribution of the fullSupervisory Board in setting the strategic direction.
Several suggestions for further improving the functioning ofthe Supervisory Board were raised and will be followed up in2015. These suggestions relate, among other things, to:- Taking even more time to focus on longer-term changes in
business mix, competition, and reasons forunderperformance in markets;
- Optimizing the annual assessment of the members of theExecutive Board;
- Presetting an annual agenda of topics to be discussed bythe Remuneration and Nomination Committee during theyear; and
- Taking an even closer look during regular Board meetingsat each operating country, particularly underperformingcountries or operating companies.
Supervisory and advisory activitiesin 2014
The Supervisory Board met nine times face-to-face during2014. Six of these meetings were held jointly with the fullExecutive Board. The other three meetings were held withoutthe Executive Board, but in part attended by the CEO. Thelatter three meetings were held to discuss Executive Boardremuneration, the composition and assessment of theExecutive Board, including the changes to the ExecutiveBoard, senior talent review and succession planning, as well asthe composition and assessment of the Supervisory Board,including the changes to the Supervisory Board. One of thenine meetings was attended by the lead partners of theexternal auditor to discuss the 2013 annual report andaccounts. There was also much informal contact betweenindividual Supervisory Board members outside meetings.
Between meetings, the Chairman of the Supervisory Boardmaintained informal contact with the CEO and CFO. TheChairman of the Audit Committee had regular contact withthe CFO and some of his senior staff, particularly in preparingthe Audit Committee meetings, while the Chairman of the

102
annual report 2014 − Randstad Holding nv
Strategy Committee prepared the strategic retreat togetherwith the CEO.
The Supervisory Board does not disclose rates of attendance atmeetings in abstract numbers, because this is perceived as abox-ticking exercise. In 2014, none of the members of theSupervisory Board were absent during any of the meetings,except Beverley Hodson, who was unable to join the meetingsin the last quarter of 2014 due to personal circumstances. Allmembers have sufficient time, including between meetings, todevote to the affairs of Randstad.
One of the Supervisory Board's main priorities is strategy.Accordingly, and following up on last year's self-assessment,even more time was spent on in-depth discussions with theExecutive Board about the overall strategy and the realizationof the strategic targets. The Strategy Committee prepared andset the framework for these discussions. A two-day strategicretreat was organized in September 2014, during which theSupervisory Board and Executive Board discussed a significantnumber of relevant strategic topics, in most cases preparedand presented by the responsible functional or operationalleader. These topics of discussion included:- Medium-term market developments and the changing
environment of the staffing industry, which creates a needfor more segment-specific delivery models;
- Progress made on strategic initiatives for improving thebusiness mix, including activity-based field steering,permanent placements and SME targeting;
- The evolvement of Randstad Sourceright, which targetsthe markets for Managed Services Programs andRecruitment Process Outsourcing, as well as Randstad’sTotal Talent Architecture strategic initiative for largeaccounts;
- Randstad's people strategy, including the competenciesrequired for current and future leaders within thecompany, an assessment of the current senior leaders, anddiversity;
- HR technology developments that impact the corebusiness, based on experiences of Randstad theNetherlands and Randstad's EMEA sourcing center inBudapest;
- The strategy for the Professionals segment, which requiresmore global alignment and acceleration in order forRandstad to become a truly global player in this field;
- The changing dynamics of talent acquisition services aspresented by an analyst from an external consulting andresearch company;
- Innovation initiatives mostly in relation to the RandstadInnovation Fund, which aims to drive external innovationwithin Randstad by investing in small HR technologycompanies;
- The framework and strategic objectives for makingacquisitions, including an assessment of possible targets;
- The outcome of the two-year growth plan, which is basedon the input from the operating companies; and
- The way the Supervisory Board and Executive Board worktogether and each Board member's expectations in thisrespect.
The Supervisory Board in any case meets each quarter shortlybefore the publication of the quarterly results, when itdiscusses with the Executive Board these results as well asrelated documents, such as the auditor's quarterly report onprocedures performed and the draft press release. Prior to theSupervisory Board meeting, these results and relateddocuments are first discussed by the Audit Committee. In2014, the Supervisory Board noted that economic trendsvaried considerably from region to region during the year.When discussing the company's quarterly performance, theSupervisory Board paid much attention to revenue and resultsperformance, the adaptation of costs, adjustingorganizational structures, and maximizing efficiency in each ofthe countries, while not losing sight of opportunitiesidentified by the Executive Board for capturing profitablegrowth where possible.
The following list provides an overview of other items thatare discussed regularly throughout the year:- Compliance with relevant rules and legislation, as well as
developments in corporate governance;- The assessment of strategic, operational, financial, and
compliance risks, including Randstad's approach to riskmanagement;
- (Potential) acquisitions and divestments;- Changes to the Executive Board, including amendments to
portfolio responsibilities;- Organizational changes and senior management
appointments;- The performance of all major countries and functions;- The preparation, evaluation and follow-up of the Annual
General Meeting of Shareholders;- Topics related to sustainability relevant to Randstad,
including the corporate sustainability framework andrelated key drivers and key performance indicators;
- The views of analysts and investors, as well as changes inthe shareholder structure and base;
- Marketing and branding;- Randstad's financial performance, its financing, the
allocation of goodwill and related impairment analyses;- The external auditor's management letter.
The Supervisory Board is regularly updated on developmentsin operating companies and markets. These updates also coverlabor market relations, demographics and politics. Seniormanagement of our operations in Belgium, Spain, and Francejoined meetings in 2014 to give such updates on theirmarkets. Each year, the Supervisory Board, jointly with theExecutive Board, pays a two-day visit to the operations in adifferent country. This joint visit to Randstad in Tokyo (Japan)in October 2014 provided additional insight into the quality oflocal operations and management, as well as the furtherpotential of this second-largest staffing market worldwide.Immediately afterwards, the Supervisory Board also joined the
report of the Supervisory Board
103
annual report 2014 − Randstad Holding nv
Executive Board for their three-day bi-annual GroupManagement Meeting with around seventy generalmanagers from the major operating companies and corporatefunctions. This meeting was held in Shanghai (China) to allowattendees to personally witness the explosive growth of thisarea, which is illustrative for the very strong growth ofRandstad's own Chinese business. It allowed the members ofthe Supervisory Board to get to know a large group of seniorleaders within the Group even better. Members of theSupervisory Board also paid individual visits to variousbusinesses within Randstad on an ad-hoc basis.
To underline the importance of Randstad's business principlesand the procedure for reporting misconduct, the SupervisoryBoard shares responsibility for these matters with theExecutive Board. An assessment of the complaints reportedunder the misconduct reporting procedure is shared with theAudit Committee annually. Further information can be foundon our corporate website.
Supervisory Board Committeeactivities in 2014
The Supervisory Board has three Committees: the AuditCommittee, the Remuneration and Nomination Committee,and the Strategy Committee. Their roles are described in moredetail in the section 'Corporate governance'. The committeesgenerate detailed information and prepare recommendationsrelating to their specific areas, while the full Supervisory Boardretains overall responsibility. The Committee Chairman in eachcase reports the Committee's main considerations andfindings to the full Supervisory Board, usually immediatelyafter the relevant Committee meeting.
In 2014, the composition of these Committees was as follows:
Audit CommitteeFrank Dorjee (Chairman), who succeeded Leo van Wijk asfrom April 2014, Fritz Fröhlich, Wout Dekker, and Jaap Winter.The first three members in particular have relevant expertisein the field of financial management.
Remuneration and Nomination CommitteeFritz Fröhlich (Chairman), Beverley Hodson, GiovannaKampouri Monnas, and Jaap Winter, who took over from Leovan Wijk as from April 2014.
Strategy CommitteeWout Dekker (Chairman), Henri Giscard d'Estaing, andGiovanna Kampouri Monnas, who took over from JaapWinter as from October 2014.
Report of the Audit CommitteeThe Audit Committee assists the Supervisory Board in itsresponsibility to oversee Randstad's financing, financial
statements, financial reporting process, and system of internalbusiness controls, risk management, and audit.
Five meetings were held in 2014. All meetings were attendedby the CEO, the CFO and the corporate managing directors forControl, Accounting and Business Risk & Audit. The externalauditor's lead partners were also present. The AuditCommittee held one meeting with the external auditorwithout management being present to discuss theirassessment of Randstad's performance, the committee'scollaboration with the Executive Board and the financedepartments, as well as their functioning.
The following list provides an overview of the items discussedin the course of the year, most of which are discussed eachquarter:- The financial performance of the company and its major
operating companies, with special focus on the quality ofearnings, the balance sheet, financing, provisions andtaxes, impairments, and the outlook for each subsequentquarter;
- Randstad's financing strategy, notably the extension of thesyndicated revolving credit facility, possible alternativelong-term funding sources, and the floating interest policy;
- The external auditor's reports for each quarter and theirannual management letter;
- The impact of possible changes to legislation, such aslegislation affecting the role and position of the externalauditor;
- The procedure for reporting misconduct, including thereport of the central integrity officer;
- A review of fiscal, treasury, legal and pension-relateddevelopments, mostly provided by the responsiblecorporate managing director;
- A report from the managing director Group Legal onoperating companies' compliance with key policies,including the business principles, competition lawcompliance, antibribery and corruption, data protection,non-discrimination and harassment, and contract liability;
- The annual legal letter, listing material litigation (wherepotential liability exceeds € 1 million). Any cases with apotential liability exceeding € 2.5 million are promptlyreported to the Audit Committee; and
- The annual talent and performance review of the financefunction and its key people, including the World LeagueFinance program, whose aim is to develop the financefunction, all finance staff and the finance organizationthroughout Randstad. In the course of each year, the CFOsof some of the larger operating companies are invited toreport on their approach to this program in theirrespective country. In 2014, the CFOs of Randstad Spainand Randstad North America were invited for this purpose.
The Audit Committee discussed at length various itemsrelating to the risk profile and in-control situation, such as therisk profile of the Group, the annual internal audit plan andpriorities for 2014, and the quarterly reports prepared byGroup Business Risk & Audit. These reports contain audit

104
annual report 2014 − Randstad Holding nv
results, fraud investigations, and reviews of control situationsin particular countries and processes.
At year end, the Audit Committee discusses the company'soverall in-control situation, using the control assessment ofmanagement and Group Business Risk & Audit, as well as theexternal auditor’s reflections on the in-control situation. Thisquarterly discussion on the various risk and control topicsallows management and Group Business Risk & Audit to focuson the right priorities throughout the year. Based on thesediscussions, control themes are defined. These themes receiveadditional attention to ensure that control efficiency andeffectiveness is enhanced in those specific areas.
In the second and fourth quarters, the Group's in-controlsituation was discussed in detail, using the results of therenewed key control framework. This framework addresseskey risks, looks at the controls to mitigate these risks, andrequires an assessment of these controls. Priorities for internalaudits of local audit teams are set by the managing directorGroup Business Risk & Audit. The framework allows all Groupcompanies to further develop their controls using a maturitymodel. Due to its nature, culture and business philosophy,Randstad takes a pragmatic approach to risk and opportunitymanagement. The Business Rsk & Audit department isadequately embedded within the organization by way of theglobal Risk & Audit network, consisting of local internalauditors at operating company level. This year, the AuditCommittee approved the Business Risk & Audit charter, whichconfirms the direct line between the managing director of thedepartment and the chairman of the Audit Committee, and assuch ensures independence, authority, and responsibilitysetting.
With regard to the external audit, the Audit Committeereviewed the proposed audit strategy plan relating to theaudit scope, approach, and fees (see note 28 to the financialstatements). It also assured itself of the independence of theexternal auditor and the non-audit services provided by theexternal auditor, in line with the relevant policy. Given thechange of auditor as from 2015, the Audit Committeeassessed the performance of the external auditor to a limitedextent only. This is normally a more extensive annual process,based on a satisfaction survey conducted among all CFOs ofthe operating companies and key corporate finance people.As part of this annual evaluation process, the following itemsare taken into consideration: (1) the quality of the audit work,(2) the sufficiency and fulfillment of the audit engagement,(3) the quality of the auditor's reports, (4) the independenceof the auditors, (5) the expertise and composition of the auditteam, (6) the audit fee, and (7) quality control within the auditfirm.
The Annual General Meeting of Shareholders held on April 3,2014 approved the Executive Board's proposal, supported bythe Supervisory Board and its Audit Committee, to changeaudit firm as from the financial year 2015, and appointedDeloitte Accountants as the new audit firm. Historically,
Randstad's policy has been to engage the external auditor forboth the Group audit and all of the local statutory audits. Inthe context of this legislative change, however, Randstad hasassessed how it can increase the efficiency of the externalaudit and the added value of audits. As explained in the 2013annual report, Randstad has decided to change its approachwith the change of auditor. Deloitte has been appointed asexternal auditor for the Company effective 2015. Following anextensive tender process in 2014, the Executive Board,supported by the Audit Committee, decided to appoint BDOAccountants as external auditor for statutory audits ofoperating companies not within the scope of the Group audit.
Report of the Strategy CommitteeThe Strategy Committee acts as a sparring partner for theExecutive Board and contributes in-depth to the preparationof the semi-annual discussion of Randstad's strategy with thefull Supervisory Board. Each member has his or her ownspecific and extensive experience in strategy development andrelated processes. All meetings were attended by the fullExecutive Board.
In 2014, the Committee fully focused on the preparation ofthe two-day strategic retreat in September as elaborated on inmore detail above. This retreat was chaired by the Chairmanof the Strategy Committee. During the retreat, theSupervisory Board and Executive Board discussed a significantnumber of relevant strategic topics including:- Medium-term market developments and the changing and
challenging environment of the staffing industry;- Progress made on strategic initiatives for improving the
business mix;- The evolvement of Randstad Sourceright and Total Talent
Architecture;- Randstad's people strategy;- The strategy for the Professionals segment;- The Randstad Innovation Fund;- The framework and strategic objectives for making
acquisitions;- The outcome of the two-year growth plan;- The way the Supervisory Board and the Executive Board
work together.
Report of the Remuneration and NominationCommitteeThe Remuneration and Nomination Committee primarilymakes recommendations regarding the remuneration(including the policy) of the Executive Board and SupervisoryBoard. It is also tasked with advising on candidates to fillvacancies in both Boards. Each Committee member hasspecific expertise in the area of remuneration and HR-relatedissues.
The Committee met four times in the course of 2014. The CEOand the managing director HR participated in part of themeetings. The Committee regularly makes use of externaladvice, notably from Focus Orange and Towers Watson.
report of the Supervisory Board

105
annual report 2014 − Randstad Holding nv
The following list provides a solid overview of the itemsdiscussed in the course of the year, most of which arediscussed a number of times during the year:- Proposals regarding the base salary of the Executive Board
members, based on a benchmark against the internationallabor market peer group and against a peer group ofcompanies listed on the AEX index;
- Proposals regarding the variable pay of the ExecutiveBoard members: the realization of the annual bonustargets, the targets for next year's annual bonus, therealization of the targets of the long-term incentive plan,and the annual allocation of shares and options;
- The annual assessment of the Executive Board and itsindividual members;
- The self-assessment of the Supervisory Board; and- The annual remuneration report, including an overview of
the manner in which the remuneration policy wasimplemented and an overview of the (updated)remuneration policy for the Executive Board members insubsequent years. This detailed remuneration report ispublished each year and is available on our corporatewebsite. It is also summarized in this annual report in theremuneration section.
In 2014, much time was spent on the selection of candidatesto fill the vacancies in the Supervisory Board arising at theupcoming Annual General Meeting of Shareholders. Theirnomination was thoroughly prepared, based on anassessment of the profiles of the vacancies and an extensiveselection process identifying various candidates who fit therequired profiles. Russell Reynolds was engaged to assist inthis process.
The Committee also extensively discussed diversity-relatedtopics. The Supervisory Board aims to ensure that both its owncomposition, as well as the composition of the ExecutiveBoard, represents a good balance in terms of diversity(including gender, nationality, and experience). The aim isthat at least one-third of the membership meet the criteriaregarding gender. These gender criteria are currently beingmet for the Supervisory Board, but not yet for the ExecutiveBoard. Randstad's policy regarding diversity is extensivelydescribed in the diversity section of this annual report. A keyfactor in diversity is providing equal opportunities for women.The percentage of women in senior management positionsamounted to 41% in 2014. The Executive Board welcomed itsfirst female member in 2012. Diversity will continue to be animportant consideration for all future nominations to theBoards.
To enable the full Supervisory Board to get a betterunderstanding of these topics, the following topics werediscussed during the two-day strategic retreat with theExecutive Board, as mentioned above:- Randstad's HR strategy and focus for the coming years, key
actions, its function and organization, with specificattention given to the required profile of Randstad seniormanagement members, key elements of a structured
people agenda, such as the annual people review andglobal development programs, the role of HR in the rolloutof the Professionals strategy, and diversity;
- The outcomes and conclusions of the annual talent reviewand succession planning for the Group; and
- The annual assessment of the senior country andfunctional managing directors (all of whom are scheduledto meet and present to the Supervisory Board, if feasible),as well as high potentials and possible successors to theExecutive Board.
Supervisory Board remuneration
The Annual General Meeting of Shareholders determines theremuneration of the members of the Supervisory Board. Theirremuneration is a fixed annual allowance paid in monthlyinstallments. It is not linked to the financial results of thecompany. Members of the Supervisory Board do not receiveany performance-related compensation or shares, and do notaccrue any pension rights with the company.
Members of the Supervisory Board who hold shares in thecompany are only allowed to do so as long-term investments.They adhere to the company's insider-dealing rules. Randstaddoes not grant loans or guarantees to Supervisory Boardmembers.
The annual allowances were last determined by the AnnualGeneral Meeting of Shareholders held in 2012, while theannual Committee fees were last determined by the AnnualGeneral Meeting of Shareholders held in 2011. The annualallowances and Committee fees for the Chairman andmembers of the Supervisory Board are shown in the tablebelow.
Allowances of Supervisory Board membersin €
2014 2013
Supervisory Board
Chairman 110,000 110,000
Vice-Chairman 90,000 90,000
Members 75,000 75,000
Audit Committee
Chairman 12,000 12,000
Members 8,000 8,000
Remuneration & Nomination Committee
Chairman 9,000 9,000
Members 7,000 7,000
Strategy Committee
Chairman 8,000 8,000
Members 6,000 6,000
106
annual report 2014 − Randstad Holding nv
In addition, they receive a fixed annual expense allowance of€ 2,000 net for members and € 3,000 net for the Chairman.Taking into consideration the significant effort and traveltime, Supervisory Board members receive an attendance feeof € 1,500 per meeting, when cross-border travel is required inorder to attend a Supervisory Board meeting.
Report of the Annual GeneralMeeting of Shareholders
At the Annual General Meeting of Shareholders, held on April3, 2014, the CEO and the CFO gave an account of the generalstate of affairs at Randstad and its financial performance in2013. The meeting adopted the 2013 financial statements andthe dividend proposal. The members of the Executive Boardwere granted discharge of liability for their management, andthe members of the Supervisory Board for their supervisionthereof. Chris Heutink was appointed member of theExecutive Board. Giovanna Kampouri Monnas and FrankDorjee were (re)appointed members of the Supervisory Board.The meeting authorized the Executive Board to issue ordinaryshares, limited to a maximum of 3% of the ordinary issuedshare capital for a period of 18 months, as well as torepurchase ordinary shares, limited to a maximum of 10% ofthe ordinary issued share capital for a period of 18 months.Deloitte Accountants in the Netherlands was appointed asexternal auditor for the financial year 2015.
Similar to prior year, the Chairman of the Audit Committeeproactively elaborated on the work of the Audit Committee in2013, the company's collaboration with the external auditor,and three specific items that were relevant in the past year:- Transitioning to a new financial consolidation system,
which was seamless;- Strengthening the Business Risk & Audit department to
better support the organization and local management incontinuing to improve the in-control position; and
- Selecting a new auditor as of 2015.
The lead partner of the external auditor was given the floor toelaborate on the auditor's opinion, which had changedconsiderably in content and design and had become morecompany-specific, describing the responsibilities of theExecutive Board and the external auditor. The most importantmatters mentioned concerned the valuation of goodwill, thedeferred tax position, claims, and 'hours paid/hours billed',which were explained in the auditor's report. In addition, asection had been included on materiality and the scope of theaudit review. The lead partner also stated that the descriptionof the risk management and audit system included in the 2013annual report did not conflict with the findings arising fromthe audit of the financial statements.
Financial statements for 2014
The financial statements for 2014 have been audited andprovided with an unqualified opinion byPricewaterhouseCoopers Accountants N.V. (see theindependent auditor's report), and were extensively discussedwith the auditors by the Audit Committee in the presence ofthe CEO and the CFO in February 2015. The full SupervisoryBoard then discussed them with the full Executive Board inthe presence of the auditors. The Supervisory Board is of theopinion that the financial statements 2014 meet allrequirements for correctness and transparency. During theyear, the Audit Committee extensively discussed the riskmanagement framework that supports this. As such, theSupervisory Board recommends that the Annual GeneralMeeting of Shareholders to be held on April 2, 2015, adoptthe financial statements and the appropriation of net incomeproposed by the Executive Board.
The Supervisory Board endorses the Executive Board'sproposal to the Annual General Meeting of Shareholders topay an optional cash or stock dividend per ordinary share of €1.29 for 2014 (€ 0.95 for 2013) and a cash dividend onpreference shares B and C of € 12.6 million (€ 12.1 million for2013).
The Supervisory Board requests that the Annual GeneralMeeting of Shareholders grant discharge to the members ofthe Executive Board for their management and to themembers of the Supervisory Board for their supervision in2014.
The Supervisory Board would like to thank all Randstademployees, under the strong leadership of the ExecutiveBoard, for their contribution and continuing dedication in2014.
Diemen, the Netherlands, February 17, 2015
The Supervisory Board,
Fritz Fröhlich, ChairmanWout Dekker, Vice-ChairmanFrank DorjeeHenri Giscard d’EstaingBeverley HodsonGiovanna Kampouri MonnasJaap Winter
report of the Supervisory Board
107
annual report 2014 − Randstad Holding nv
Remuneration policy
The main objective of the remuneration policy is to attract,motivate, and retain qualified senior executives of the highestcaliber, who have an international mindset and thebackground required for the successful leadership andeffective management of a large global company. Themembers of the Executive Board are rewarded accordingly,and most of their remuneration is based on Randstad'sperformance. The remuneration structure for the ExecutiveBoard is therefore designed to balance short-term operationalperformance with the long-term objectives of the companyand value creation for its shareholders.
Remuneration levels are determined on the basis of a numberof clear, transparent criteria, and reflect general as well asspecific individual responsibilities in an international context.They are benchmarked against an international labor marketpeer group regarding fixed salary levels, and against aninternational performance peer group to establish relativeperformance:- The international labor market peer group represents the
market in which Randstad competes for seniormanagement talent, and is used to benchmark fixed salarylevels. It is composed of international staffing and businessservices companies, reflecting Randstad's internationalscope. They are Adecco SA, Rentokil Initial Plc, Cap GeminiSA, Atos Origin SA, Robert Half International Inc,LogicaCMG Plc, Manpower Inc, Kelly Services Inc, MichaelPage International Plc, Hays Plc, TUI AG, G4S Plc, andSodexo Group SA;
- The international performance peer group is used as abenchmark to establish relative performance in terms ofTotal Shareholder Return (TSR) for the payout of the long-term incentive plan. It reflects the market in which thecompany competes for shareholder preference. This groupis composed solely of staffing companies, and cantherefore be characterized as 'sector-specific'. It consists ofAdecco SA, Kelly Services Inc, Trueblue Inc, Manpower Inc,Robert Half International Inc, USG People NV, MichaelPage International Plc, Hays Plc, and Groupe Synergie SA.
- In addition, as an extra check, total compensation levelsare benchmarked annually against a peer group ofcompanies listed on the AEX index (consisting of largecompanies listed on Euronext Amsterdam).
The last update of the remuneration policy was approved bythe Annual General Meeting of Shareholders held on March28, 2013.
Executive Board remuneration2014
The remuneration of the Executive Board consists of threecomponents:1. Short-term compensation, consisting of base salary and
annual cash bonus opportunity;2. Long-term compensation, consisting of performance
shares;3. Pension and other benefits.
The variable portion of the total remuneration package isperformance-related. It consists of short- and long-termcomponents. For on-target performance, approximately halfof the total compensation of a member of the ExecutiveBoard is performance-related. The Supervisory Board, on therecommendation of its Remuneration and NominationCommittee, sets the targets prior to each performance period.Performance targets and conditions are derived fromRandstad's strategy, annual budget plan, and market analysis.An overview of the 2014 and comparable 2013 remunerationamounts is included in note 24 to the financial statements.
Short-term compensation
Base salaryIn line with the relevant size and profile of Randstadcompared to the other companies included in theinternational labor market peer group, base salaries of theExecutive Board members are set at between the median and75% percentile level.
In line with the company's remuneration policy and confirmedby benchmarking carried out by Focus Orange, it was decidedto increase the base salaries of the Executive Board membersby 3% as from January 1, 2014. The general pay differentialswithin the company, and specifically within seniormanagement, were taken into account when taking thisdecision.
Jacques van den Broek was appointed Chairman of theExecutive Board and CEO with effect from March 1, 2014. Hisexecutive service agreement is in line with the remunerationpolicy of the company. His base salary as from that dateamounted to € 800,000.
Chris Heutink was appointed to the Executive Board by theAnnual General Meeting of Shareholders on April 3, 2014. Hisexecutive service agreement is in line with the remunerationpolicy of the company. His base salary as from January 1, 2014amounted to € 590,965.
remuneration report

108
annual report 2014 − Randstad Holding nv
Annual cash bonus opportunityThe total annual cash bonus opportunity amounts to 70% ofbase salary for on-target performance, and the maximumbonus level is 100% of base salary. If performance is below apre-defined minimum level, no bonus will be paid out. Incalculating the pro-rata bonus, a sliding scale between theminimum level and the maximum level is used. TheSupervisory Board sets the targets at the beginning of eachfinancial year.
The framework for the annual cash bonus relates to:- Gross profit, revenue or market share, with the bonus
opportunity ranging from 10% for minimum performance,15% for on-target performance, and 25% for maximumperformance;
- EBITA or EPS realization, with the bonus opportunityranging from 10% for minimum performance, 15% for on-target performance, and 25% for maximum performance;
- Leverage ratio, or efficiency of working capital (e.g., DSOor net debt), with the bonus opportunity ranging from10% for minimum performance, 15% for on-targetperformance, and 25% for maximum performance;
- Individual targets; with a maximum of 15%;- Additional bonus at the discretion of the Supervisory
Board; with a maximum of 10%.
The actual targets for these and the individual targets are notdisclosed, as they qualify as information that is confidentialand/or commercially and potentially share-price sensitive.
If a variable remuneration component conditionally awardedin a previous year would, in the opinion of the SupervisoryBoard, produce an unfair result due to extraordinarycircumstances during the performance period, the SupervisoryBoard has the power to adjust the value upwards ordownwards. The Supervisory Board may also recover from theExecutive Board any variable remuneration awarded on thebasis of incorrect financial or other data. These provisions areincluded in the annual bonus and grant letter. This power wasnot used in 2014, nor was any remuneration recovered frompresent or former Executive Board members.
Based on the achievement of the shared and individualtargets for 2014, and using the discretionary space available tothe Supervisory Board, the bonus entitlement with regard tothe performance in 2014 as percentage of annual base salaryis specified as follows:
Annual bonus payout, 2014
2014 performance target
possible
maximum
payout as % of annual base
salary
Group revenue performance 25% 12.3%
Group EBITA margin 25% 15%
Net debt at year-end 25% 25%
Individual targets 15% Varies from 7% - 14.5%
Discretionary 10% 7%
100% Varies from 66.3% - 73.8%
Long-term compensationIn order to align their own objectives with the value creationobjectives of shareholders, performance shares are granted tothe members of the Executive Board on an annual basis. Until2013, a combination of performance shares and performanceoptions were granted.
Due to their long-term nature, performance shares areinherently and significantly more open to marketuncertainties than short-term compensation elements. Sharesand options (granted before 2013) can become unconditional(i.e., may vest) depending solely on Randstad's TSRperformance compared to the performance peer group,measured over a three-year period starting from January 1 ofthe year in which they are granted. As from 2013, the relatedpayout range was amended as follows:
TSR payout range
until 2013 as from 2013
Position 1 250% 250%
Position 2 200% 200%
Position 3 150% 150%
Position 4 125% 100%
Position 5 100% 50%
Position 6 75% 0%
Position 7 50% 0%
Position 8 25% 0%
Position 9 0% 0%
Position 10 0% 0%
TSR reflects the return received by a shareholder and capturesboth the change in the company's share price and the value ofdividend income, assuming dividends are reinvested in thecompany. The Supervisory Board considers TSR to be anappropriate measure, as it objectively measures the company'sfinancial performance and assesses its long-term valuecreation as compared to other companies in the sector. TSRperformance for the companies of the internationalperformance peer group is calculated based on their 'home/primary listing'. During the three-year vesting period, the TSRdata are compiled and reported by external data providerTowers Watson. The Remuneration and Nomination
remuneration report

109
annual report 2014 − Randstad Holding nv
Committee advises the Supervisory Board on the percentageof performance shares that vest and performance options thatcan be exercised. Given the relevance of sustainability forRandstad's business, ambition and long-term viability,performance targets within Randstad's sustainability KPIframework have been added as from 2013, at the discretionof the Supervisory Board. These targets are also set at the startof the three-year vesting period. As from 2013, the grant istherefore divided into TSR-dependent (80%) andsustainability-related (20%).
Performance shares are granted in the open period followingthe publication of the Group's fourth-quarter financial resultsin February. The number of shares will be calculated based onthe fair value of the Randstad share as at January 1. If amember of the Executive Board resigns before the vestingdate, conditional grants of performance shares will lapse. Thecompany offers no financing arrangements at grant orexercise of the options. Performance shares need to beretained for at least two years after vesting, except to theextent necessary to settle any related tax liabilities.
At the moment the performance shares are granted, their fairvalue assuming on-target performance is equal to an amountof 100% of the base salary for all Executive Board membersalike.
Prior to the grant, and on the advice of the Remuneration andNomination Committee, the Supervisory Board analyzes thepossible outcomes of the allocation.
On February 20, 2014 (the grant date under the relevantplan), a conditional grant of performance shares for on-targetperformance was made, based on 100% of the annual basesalary per Executive Board member as at January 1, 2014, andon the fair value of the performance shares as at the samedate of € 29.44 per share (TSR-dependent grant) and € 42.13per share (sustainability-related grant).
The conditional on-target 2014 awards are as follows:
Conditional on-target awards, 2014
number of
shares
Jacques van den Broek 25,537
Robert Jan van de Kraats 21,475
François Béharel 18,864
Linda Galipeau 18,864
Chris Heutink 18,864
Leo Lindelauf 18,864
122,468
The sustainability-related performance targets for this grantare the following five targets from Randstad's sustainabilityKPI framework:- Net Promoter Score (NPS): a Top 3 position or at least
position improvement in the Top 12 countries over theperformance period;
- Candidate engagement;- Internal management appointments as % of total
appointments: at least 80%;- Number of employees involved in Voluntary Service
Overseas: at least 20 on an annual basis;- Environment: the sustainable supplier code should be fully
rolled out throughout the Company worldwide.
At the end of the performance period 2014−2016, theSupervisory Board will have the discretion to determine theactual vesting based on progress made over the performanceperiod as reported by the Executive Board in relation to eachof these targets. Each target accounts for 50% vesting, theminimum vesting equals 0%, and the maximum vestingequals 250%, in line with the minimum and maximumopportunity for the TSR-dependent grant.
Early 2014, the performance shares and performance optionsthat had been conditionally granted in February 2011 vestedbased on the relative TSR performance over the periodJanuary 1, 2011, to December 31, 2013. The performanceresulted in 125% vesting.
Pension and other benefits
Pension contributionThe pension arrangements for members of the ExecutiveBoard are based on defined contribution and are placed withan insurance company. Randstad provides an annualcontribution of 27% of base salary to the schemes ofExecutive Board members. The company has no specific earlyretirement arrangements in place for Board members.
Other benefitsAdditional arrangements include expense and relocationallowances, a company car or car allowance, and health andaccident insurance.
LoansThe company has issued no loans or guarantees to ExecutiveBoard members.
SeveranceIn the event of severance, a maximum of one year's annualbase salary, in addition to the 12-month notice period, appliesto all Executive Board members.
Executive service agreementsIn line with the relevant regulation, Executive Board membersappointed or reappointed as from 2013, including the CEO,have an executive service agreement with the company,which supersedes any previous employment agreements.

110
annual report 2014 − Randstad Holding nv
Appointment termsThe members of the Executive Board appointed before 2005were appointed for an indefinite period. The members of theExecutive Board, including the CEO, appointed since 2005have been appointed for a period of four years.
Executive Board remuneration2015
In line with the company's remuneration policy and confirmedby benchmarking carried out by Focus Orange, it was decidedto increase the base salaries of the Executive Board membersby 2.5% as of January 1, 2015. The general pay differentialswithin the company, and specifically within seniormanagement, were taken into account when taking thisdecision.
Effective January 1, 2015, the base salary of Jacques van denBroek, CEO and Chairman of the Executive Board, wasincreased to € 900,000, which is still below the relevantmedian to 75% percentile level of the international labormarket peer group and group of companies listed on the AEXindex.
Supervisory Board remuneration2014 and 2015
Information with regard to the remuneration of theSupervisory Board in 2014 is included in the section Report ofthe Supervisory Board. An overview of the 2014 andcomparable 2013 remuneration amounts is included in note24 to the financial statements.
The remuneration of the Supervisory Board, including itsCommittees, will remain unchanged in 2015.
remuneration report

111
annual report 2014 − Randstad Holding nv
Principles
Sound corporate governance is a key component ofRandstad's culture, behavior, and management, and isconsistent with its core values. Randstad's corporategovernance is supported by a strong focus on integrity,transparency, and clear and timely communication. Thebusiness processes throughout the organization incorporatetransparency for both external reporting and themanagement of activities around the world. Goodgovernance and proper supervision are importantprerequisites for generating and maintaining trust inRandstad and its management.
Randstad is incorporated and based in the Netherlands. As aresult, Randstad's governance structure is based on therequirements of Dutch legislation, the company's articles ofassociation, and the rules and regulations of Euronext,complemented by internal policies and procedures. Given theworldwide exposure of Randstad and its businesses, theinternational context is of vital importance, and both nationaland international developments are closely monitored.
Randstad has always sought to enhance and improve itsgovernance in line with the Dutch corporate governance code('the code', which can be found atwww.commissiecorporategovernance.nl) and internationalbest practices. Any substantial changes in Randstad'scorporate governance structure and its compliance with thecode will be submitted to the Annual General Meeting ofShareholders.
Corporate governance declarationThe Executive Board and the Supervisory Board, which arejointly responsible for the corporate governance structure ofRandstad, are of the opinion that the vast majority of theprinciples and best-practice provisions of the code are beingapplied. We strongly believe that these principles andprovisions are consistent with our core values. This means thatwe do not merely take a 'box ticking' approach to compliance.As the code is based on the 'apply or explain' principle, a verylimited number of exceptions to the code, which are deemednecessary in the interests of Randstad, have been explained toshareholders and are described in this report. This report alsoincludes the information that needs to be disclosed inaccordance with the corporate governance declaration asreferred to in the relevant Dutch governmental decree.
Executive Board
Tasked with the overall management of Randstad, theExecutive Board is accountable for developing, driving,executing, and achieving the approved strategy and strategictargets. The Executive Board is also responsible for theassociated risk profile, sound business and financial controls,the development of results, and the resolution of corporateresponsibility issues, while simultaneously respecting policies
that have been set. The responsibility for the management ofRandstad is vested collectively in the Executive Board. Eachmember has duties related to his or her specific area ofresponsibilities and expertise.
The Supervisory Board is empowered to recommend to theAnnual General Meeting of Shareholders persons to beappointed as members of the Executive Board. TheSupervisory Board also determines the remuneration of theindividual members of the Executive Board, in accordancewith the remuneration policy adopted by the Annual GeneralMeeting of Shareholders.
Since 2005, new board members have been appointed for amaximum term of four years. The division of tasks betweenthe members of the Executive Board requires the approval ofthe Supervisory Board. Members need the prior approval ofthe Supervisory Board before they can take up a boardposition at another company. A member of the ExecutiveBoard may not be a member of the Supervisory Board ofmore than two listed companies or serve as Chairman of theSupervisory Board of another listed company.
Supervisory Board
The Supervisory Board, acting in the interests of the company,supervises and advises the Executive Board in performing itsmanagement tasks, sets the direction of the Randstad businessand guides its general development, including the financialpolicies and corporate structure. It evaluates the strategy,development of results, operating model, internal controlmechanisms and sustainability framework established underthe Executive Board’s management. Major managementdecisions, including those involving strategy, require theapproval of the Supervisory Board. The Supervisory Boardfurther supervises the structure and management of systemsof internal business controls and the financial reportingprocess.
It is empowered to recommend to the Annual GeneralMeeting of Shareholders persons to be appointed as membersof the Supervisory Board. Appointments and reappointmentsto the Supervisory Board are considered on the basis of aprofile, taking into account the nature of Randstad's businessand activities, as well as the desired background and expertiseof candidates. Diversity is an important criterion in order toestablish a balance in nationality, gender, age, experience,and background of the individual members. The SupervisoryBoard aims for at least one-third of its membership to meetthe diversity criteria. Individual members of the SupervisoryBoard should limit the number of Supervisory Boardmemberships and other positions they may hold at listed andnon-listed companies in such a way as to guarantee theproper performance of his or her duties, and may not holdmore than five Supervisory Board memberships in Dutchcompanies or other large organizations, whereby aChairmanship counts as two memberships. Supervisory Board
corporate governance

112
annual report 2014 − Randstad Holding nv
remuneration is determined by the Annual General Meetingof Shareholders and does not depend on the company'sresults.
Randstad ensures that there are structured reporting lines tothe Supervisory Board. Key departments and operatingcompanies work according to reporting frameworks thatfacilitate monitoring by both the Executive Board and theSupervisory Board. The Supervisory Board meets regularlythroughout the year, according to a pre-arranged schedule,both with and without the Executive Board and seniormanagement. Outside this schedule, its members are availableto the Executive Board at all times. Through frequent informalconsultation with and updates from the members of theExecutive Board in between the meetings, the SupervisoryBoard remains well informed about the general state ofaffairs within Randstad and offers advice on various matters.At the end of each year, the Supervisory Board extensivelyassesses the composition, performance, and functioning of theExecutive Board and the Supervisory Board, as well as theirindividual members.
The Chairman of the Supervisory Board ensures the properfunctioning of the Board and its Committees, and acts onbehalf of the Supervisory Board as the main contact for theExecutive Board. The Vice-Chairman replaces the Chairmanwhen required, and acts as the contact for the other Boardmembers on matters relating to the functioning of theChairman. The Company Secretary acts as secretary to theSupervisory Board.
Supervisory Board CommitteesWhile the Supervisory Board as a whole retains overallresponsibility for its functions, it assigns some of its tasks tothree permanent Committees: the Audit Committee, theStrategy Committee, and the Remuneration and NominationCommittee. Their advice and recommendations assist the fullSupervisory Board in its decision-making. The SupervisoryBoard appoints Committee members from among its ownmembers, based on the relevance of their expertise andexperience. All Supervisory Board members are, in principle,also members of at least one but mostly two Committees. TheCommittees come together at fixed times during the year,according to a pre-determined schedule and when required.They report directly to the full Supervisory Board on a regularbasis, usually directly following a Committee meeting.
The Audit Committee assists the Supervisory Board in fulfillingits supervisory responsibilities for the integrity of the financialreporting process, the system of internal business controls andrisk management, the external audit process, the externalauditors' qualifications, independence, and performance, aswell as Randstad's process for monitoring compliance withlaws and regulations. Throughout the year, the AuditCommittee is tasked with the direct supervision of all mattersrelating to financial strategy and performance, includingreporting, auditing, and budgeting. The Committee assessesthe audit strategy and the scope and approach of the external
auditor, and monitors progress. The relationship with theexternal auditors is evaluated annually. Together with theExecutive Board, the Audit Committee reviews quarterly andfull-year financial statements, auditors' reports and themanagement letter. The internal risk and control frameworkand tax- and treasury-related activities are recurring topics.The Audit Committee may opt to meet separately with theexternal auditors to discuss the quality of financial reportingand cooperation with the financial departments.
The Strategy Committee acts as a sparring partner for theExecutive Board and contributes in depth to the preparationof the semi-annual discussion of Randstad's strategy with thefull Supervisory Board.
The Remuneration and Nomination Committee is tasked withmaking recommendations regarding the Randstadremuneration policy for the Executive Board and theSupervisory Board, for adoption by the Annual GeneralMeeting of Shareholders. The approved policy then forms thebasis for the fixed and variable remuneration of the ExecutiveBoard members. The Committee is also tasked with advisingon candidates to fill vacancies in the Executive Board andSupervisory Board, evaluating the performance of bothboards and their members, reviewing the company's HRstrategy and development of senior management, ensuringlong-term succession planning (including assessment of seniormanagement), and making recommendations on thecomposition of the Supervisory Board Committees.
Board complianceBoth Boards, including the Committees of the SupervisoryBoard, have their own by-laws, which set rules with regard toobjectives, composition, duties, responsibilities, and workingmethods. These by-laws are available on our corporatewebsite.
Any conflict of interest between Randstad and a Boardmember should be avoided. Any actual or potential conflict ofinterest must be reported immediately to the other Boardmembers and/or the Chairman of the Supervisory Board. Anyshareholding in the company must be for the purpose oflong-term investment. Board members must at all timescomply with the provisions contained in the Randstad insiderdealing rules. These rules include, among other items, a policythat stipulates that dealings in Randstad shares and options byBoard members should normally be restricted to the fourweeks following the publication of quarterly financial results,provided that the person involved is not in possession of anyinside information at that time.
corporate governance

113
annual report 2014 − Randstad Holding nv
Annual General Meeting ofShareholders
Important matters that require the approval of the (Annual)General Meeting of Shareholders are:- Adoption of the annual accounts;- Adoption of profit appropriation and additions to reserves;- Dividends;- Significant changes to the company's corporate
governance;- Remuneration policy;- Discharge from liability of the Executive Board for its
management of Randstad;- Discharge from liability of the Supervisory Board for its
supervision of the management of Randstad;- Appointment of the external auditor;- Appointment, suspension or dismissal of the members of
the Executive Board and the Supervisory Board, based onnon-binding recommendations from the SupervisoryBoard;
- Remuneration of the Supervisory Board;- Authorization to purchase, issue or sell shares in the
Group's capital;- Adoption of amendments to the Articles of Association.
Further details about the proposals that the Executive Boardor the Supervisory Board can submit to the meeting, and theprocedure according to which shareholders themselves cansubmit matters for consideration by the meeting, are specifiedin the company’s Articles of Association.
The Annual General Meeting of Shareholders, which isnormally held at the end of March or in early April, isbroadcast live by audio webcast via our corporate website. Asspecified in the notice for the meeting, voting instructions(anonymous if desired) can be given to an independent thirdparty in advance of the meeting. Within three months of themeeting, the draft minutes of the meeting are made availablefor three months for comments. The definitive minutes arepublished on our corporate website.
Voting rightsThe issued share capital of Randstad Holding nv currentlyconsists of approximately 180.1 million ordinary shares, 25.2million preference shares B, 14.6 million preference shares C1,and 35.6 million preference shares C2. The ordinary shareshave equal voting rights ('1 share, 1 vote'). The voting rightson the preference shares are aligned with the historical capitalcontribution upon issuance. Effective at a Shareholders'meeting, the voting rights on the preference shares B are 3.6million, and the voting rights on the preference shares C are5.6 million.
The foundation Stichting Administratiekantoor PreferenteAandelen Randstad Holding holds the preference shares Band C. In 2014, the foundation's Board consists of BasKortmann (Chairman), Ton Risseeuw (who passed away on
February 6, 2015), and Sjoerd van Keulen. The Board membersare fully independent of both the company's managementand other shareholders. The foundation’s Articles ofAssociation were compiled in accordance with Annex X,Euronext Amsterdam Rule Book, Book II. Depository receiptsissued by the foundation are held by, among others, INGGroep NV, ASR NV, and Randstad Beheer BV. Although thevoting rights attached to the preference shares are vested inthe foundation, each depositary receipt holder can ask thefoundation for a proxy to exercise the voting rights underlyinghis or her depositary receipts during a Shareholders' Meeting.
Randstad Holding nv may issue preference shares A to a legalentity charged with safeguarding the company's interests andpreventing influences that may threaten its continuity,independence or identity. Holders of such shares have no pre-emptive rights, but are entitled to a cumulative annualdividend calculated on the basis of the average statutoryinterest rate (plus surcharge) up to a maximum of 3%. In theevent of the dissolution of the company, the holders ofpreference shares A will be repaid first from the balance ofthe amount paid on their shares, less the dividend paid in theyear in question. To date, no such shares have been issued.Resolutions for such an issue would require the cooperation ofthe Annual General Meeting of Shareholders.
As at December 31, 2014, the holders of approximately 95.7%of ordinary shares have been able to make unrestricted use oftheir voting rights at the Annual General Meeting ofShareholders. The other 4.3% of ordinary shares have beenconverted into depository receipts. A foundation, StichtingAdministratiekantoor Randstad Optiefonds, holds thoseshares in which the attached voting rights are vested. Thedepository receipts issued by Stichting AdministratiekantoorRandstad Optiefonds are fully exchangeable into ordinaryshares, and are held by Stichting Randstad Optiefonds. FritsGoldschmeding, the company's founder, is the sole Boardmember of Stichting Administratiekantoor RandstadOptiefonds.
AuditorThe Executive Board ensures that the external auditor canproperly perform its audit work and encourages both theexternal auditor and the company to properly pursue andperform the role and the policy of the company regarding theexternal auditor. The Annual General Meeting ofShareholders charges the external auditor with the task ofauditing Randstad's annual accounts.
Internal risk management and control systemsA detailed description of Randstad's Risk & Controlframework, including a description of the most important riskmanagement and control systems, is given in the section 'Risk& opportunity management'.

114
annual report 2014 − Randstad Holding nv
Exceptions to the code
Randstad applies all relevant provisions of the (updated)Dutch Corporate Governance Code, with the followingexceptions.
II.1.1 A Management Board member is appointed for amaximum period of four years.The members of the Executive Board appointed before 2005were appointed for an indefinite period. The members of theExecutive Board appointed since 2005, including the CEO,have been appointed for a period of four years.
II.2.5 Shares granted to Management Board members withoutfinancial consideration shall be retained for a period of atleast five years [...].The long-term incentive for the Executive Board is paid inperformance shares and (until 2013) performance options.These vest after three years. Performance shares need to beretained for at least two more years. We believe this five-yearterm sufficiently enhances shareholder alignment and is in linewith the long-term nature of the incentive. However,Randstad also believes that share sales should be allowedearlier to the extent necessary to settle any related taxliabilities.
III.5 If the Supervisory Board comprises more than fourmembers, it should designate […], a RemunerationCommittee and a Selection and Appointment Committee.As it felt that issues related to selection, appointment andremuneration are interlinked, the Supervisory Board decidedthat all these activities should be dealt with by oneCommittee: the Remuneration and Nomination Committee.
III.5.11 The Remuneration Committee shall not be chaired bythe chairman of the Supervisory Board [...].Given the strategic importance of the selection and retentionof senior management for the long-term success of thecompany, Randstad has opted for a combined Remunerationand Nomination Committee. Randstad considers it vital thatthe Chairman of the Supervisory Board is also closely involvedin the recruitment and retention of current and future seniormanagement, as well as the longer-term succession planningfor the Executive Board. This is reflected in the appointmentof the Chairman of the Supervisory Board as Chairman of theRemuneration and Nomination Committee.
Legal transparency obligations
The information that needs to be disclosed under Article 10,Takeover Directive Decree, and section 391, sub-section 5,book 2 of the Dutch Civil Code is available in various sectionsof this annual report. In this section, we provide additionalinformation or indicate where the information can be found.
a. Capital structure and attached rights and dutiesAn overview of the company's capital structure, voting rightsand dividend policy is provided in the section 'Investorrelations & share performance' of this annual report.
b. Statutory or contractual restrictions on sharetransfersAbout 32.5% of the total share capital (3.0% ordinary shares,9.9% preference shares B, and 19.6% of preference shares C)has been converted into depository receipts (see sectionVoting rights). The transfer of depositary receipts ofpreference shares requires the approval of the ExecutiveBoard and the Supervisory Board.
c. Major shareholdersShareholders are obliged to give notice of interests exceedingcertain thresholds to the Netherlands Authority for theFinancial Markets (AFM). Almost all the holdings listed beloware a combination of (depositary receipts of) ordinary sharesand (depositary receipts of) preference shares. All transactionsbetween Randstad and holders of at least 10% of the totalnumber of shares are agreed on terms that are customary inthe sector concerned. (See the section on Related-partytransactions in the financial statements). This means that best-practice provision III.6.4 of the Dutch Corporate GovernanceCode has been observed.
Major shareholders
2014 2013
F.J.D. Goldschmeding 30%-40% 30%-40%
ING 1 10%-15% 10%-15%
ASR1 5%-10% 5%-10%
Richmond1 5%-10% 5%-10%
Stichting Randstad Optiefonds 3%-5% 3%-5%
Stichting Administratiekantoor Randstad
Optiefonds 3%-5% 3%-5%
MFS Investments 3%-5% 3%-5%1 Mainly are based on preference shares.
d. Special rights of controlThe company has not issued special rights of control to specificshares or shareholders. Preference shares A can be issued, butonly with the approval of the Annual General Meeting ofShareholders.
corporate governance

115
annual report 2014 − Randstad Holding nv
e. Control mechanisms relating to option plans andshare (purchase) plansThe following share-based payment arrangements are ineffect: a performance stock option plan for the ExecutiveBoard, two performance share plans (one for the ExecutiveBoard members and one for senior management) and a sharepurchase plan for all corporate employees. The relevantcharacteristics of these plans can be found in the notes toshare-based payments. The maximum number of options andshares to be granted is fixed; the actual number granted islinked to predetermined performance targets. The number ofperformance shares and options actually granted may not, inprinciple, exceed 1% of the ordinary issued share capital.Depending on the attainment of the related performancetargets and the company’s actual share price, however, thenumber of shares to be issued in relation to vesting of theperformance shares and options may in a given year exceedthe 1% limit. For this reason, the annual maximumauthorization is 3% of the issued ordinary share capital of thecompany. The share purchase plan for corporate employeesdoes not affect the share capital of the company. In January2013, the Executive Board was also granted the authority torepurchase shares in order to avoid dilution.
f. Voting limitationsHolders of depository receipts of ordinary shares have novoting rights.
g. Agreements with shareholders that can limit thetransfer of shares or voting rightsIn 2007, the company finalized an agreement with FritsGoldschmeding, Randstad's founder and leading shareholder,and his inheritors, on their shareholding. FritsGoldschmeding's objective remains explicitly to continue hisposition as a long-term shareholder through direct ownershipor eventually through his inheritors.
The principal aim of all parties involved is to secure thecompany's continuity, strategic position, and development,now and in the future. Such a commitment justifies assigningone seat as member of the Supervisory Board. The main pointsof the agreement are as follows:
Lock-up: In the event of Frits Goldschmeding's passing, hisinheritors will be bound to a lock-up of at least 12 months,meaning that during that year they will carry out no actionsconcerning their direct or indirect interests in RandstadHolding nv, nor will any changes take place in the strategy aspursued by Randstad Holding nv.
Grace period: If the inheritors intend to divest all or part ofthe shares after the lock-up period, they shall give six months'written notice of this intended divestment to the ExecutiveBoard and Supervisory Board.
Consultations: After receiving such notice, the Boards willenter into consultation with the inheritors, and they canpropose candidates or alternative candidates while taking
account of the interests of the inheritors and the continuity ofRandstad Holding nv. Such a proposal should be made withinfour months of receipt of the notification from the inheritors.This ruling only applies as long as the total interests of theinheritors amounts to more than one-third of all issued andoutstanding ordinary shares in Randstad Holding nv.
Supervisory Board seat: Randstad Beheer (the investmentvehicle through which the majority of family shares are held)has the right to nominate one member of the SupervisoryBoard. The person to be nominated should possess thequalities required of a supervisory executive of aninternational company, and the nomination shall besubmitted to the Annual General Meeting of Shareholders.
These rights and obligations will cease to be applicable assoon as the interests of the inheritors fall below 25% of allissued and outstanding ordinary shares in Randstad Holdingnv. As far as the company is aware, this is the solearrangement with a shareholder that can limit the transfer ofshares, depository receipts of shares or voting rights.
h. Regulations concerning the appointment anddismissal of Board members and changes to theArticles of AssociationMembers of the Executive Board and Supervisory Board areappointed by, and may at any time be suspended or dismissedby, the Annual General Meeting of Shareholders. ASupervisory Board member is eligible for reappointmenttwice. Resolutions with respect to appointment and dismissalare passed by an absolute majority of the votes cast. When aproposal for the amendment of the Articles of Association ismade to the Annual General Meeting of Shareholders, this isalways stated in the convening notice for that meeting. Acopy of the proposal, containing the verbatim text of theproposed amendment, is simultaneously deposited at thecompany's head office, for perusal by every shareholder, aswell as by every holder of depository receipts, until the end ofthe meeting. Copies are made available free of charge.Amendments to the Articles of Association involving changesto the special rights accruing to the holders of preferenceshares require the approval of the holders of preferenceshares concerned at the meeting.
i. Authority of the Executive Board, especially to issueand repurchase shares in the companySubject to the approval of the Supervisory Board, theExecutive Board is authorized to issue shares, grantsubscription rights, and restrict or exclude pre-emptive rightsfor holders of ordinary shares until October 3, 2015, for anannual maximum of 3% of the issued share capital of thecompany. This issuance will mainly be for the purposes of theperformance stock option and share plans for the ExecutiveBoard and senior management. The Executive Board is alsoauthorized, subject to the approval of the Supervisory Board,to repurchase shares until October 3, 2015, for an annualmaximum of 10% of the issued share capital of the company.The repurchase will mainly be for the purposes of the

116
annual report 2014 − Randstad Holding nv
performance share plans for the Executive Board and seniormanagement and the stock dividend.
j. Change of control arrangementsChange of control provisions have been included in thecompany's revolving syndicated credit facility, as well as thecompany’s performance share and option plans for theExecutive Board and senior management and the sharepurchase plan for corporate employees.
k. Agreements with Board members or employeesThe severance payment for all members of the ExecutiveBoard has been set at one annual base salary in addition tothe notice period of twelve months.
corporate governance

117
financialstatements
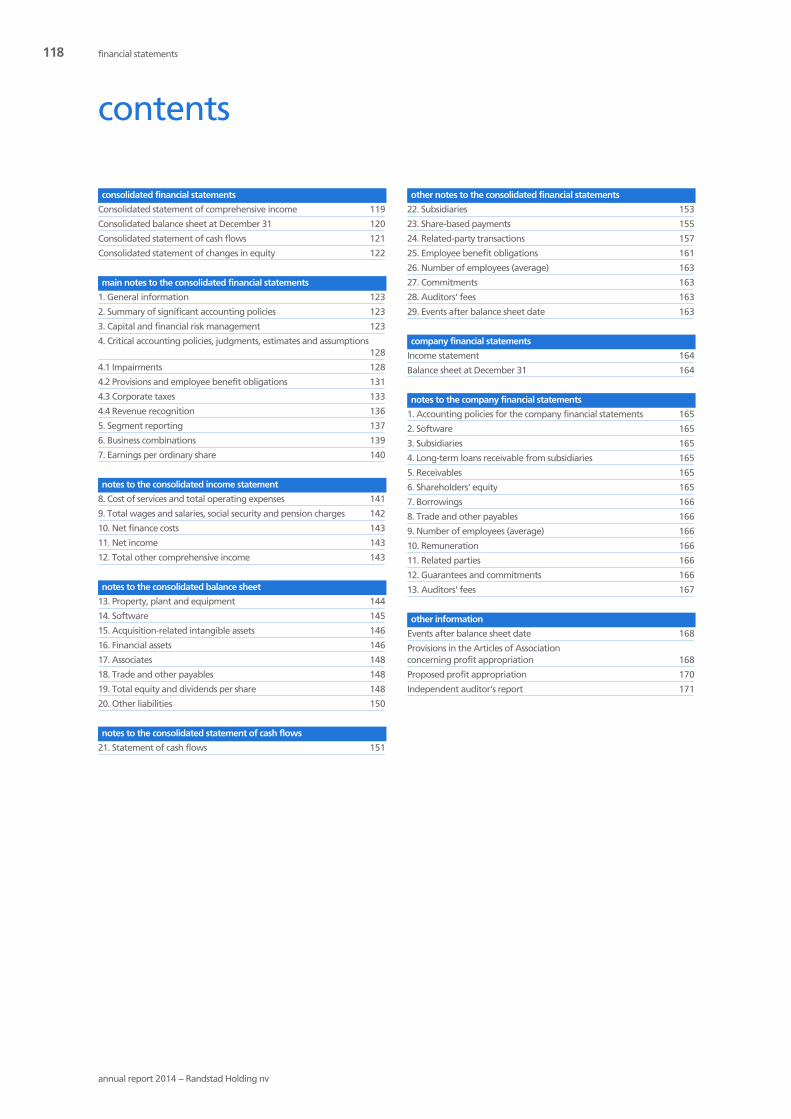
118
annual report 2014 − Randstad Holding nv
consolidated financial statements
Consolidated statement of comprehensive income 119
Consolidated balance sheet at December 31 120
Consolidated statement of cash flows 121
Consolidated statement of changes in equity 122
main notes to the consolidated financial statements
1. General information 123
2. Summary of significant accounting policies 123
3. Capital and financial risk management 123
4. Critical accounting policies, judgments, estimates and assumptions128
4.1 Impairments 128
4.2 Provisions and employee benefit obligations 131
4.3 Corporate taxes 133
4.4 Revenue recognition 136
5. Segment reporting 137
6. Business combinations 139
7. Earnings per ordinary share 140
notes to the consolidated income statement
8. Cost of services and total operating expenses 141
9. Total wages and salaries, social security and pension charges 142
10. Net finance costs 143
11. Net income 143
12. Total other comprehensive income 143
notes to the consolidated balance sheet
13. Property, plant and equipment 144
14. Software 145
15. Acquisition-related intangible assets 146
16. Financial assets 146
17. Associates 148
18. Trade and other payables 148
19. Total equity and dividends per share 148
20. Other liabilities 150
notes to the consolidated statement of cash flows
21. Statement of cash flows 151
other notes to the consolidated financial statements
22. Subsidiaries 153
23. Share-based payments 155
24. Related-party transactions 157
25. Employee benefit obligations 161
26. Number of employees (average) 163
27. Commitments 163
28. Auditors' fees 163
29. Events after balance sheet date 163
company financial statements
Income statement 164
Balance sheet at December 31 164
notes to the company financial statements
1. Accounting policies for the company financial statements 165
2. Software 165
3. Subsidiaries 165
4. Long-term loans receivable from subsidiaries 165
5. Receivables 165
6. Shareholders' equity 165
7. Borrowings 166
8. Trade and other payables 166
9. Number of employees (average) 166
10. Remuneration 166
11. Related parties 166
12. Guarantees and commitments 166
13. Auditors' fees 167
other information
Events after balance sheet date 168
Provisions in the Articles of Associationconcerning profit appropriation 168
Proposed profit appropriation 170
Independent auditor's report 171
financial statements
contents

119
annual report 2014 − Randstad Holding nv
in millions of € note page 2014 2013
Revenue 4.4 136 17,249.8 16,568.3
Cost of services 8.1 141 14,072.2 13,558.3
Gross profit 5.1 137 3,177.6 3,010.0
Selling expenses 8.2 141 1,715.0 1,688.0
Amortization and impairment of acquisition-related intangible assets and goodwill, and
badwill 8.4 142 145.4 163.4
Other general and administrative expenses 8.2 141 801.9 792.3
General and administrative expenses 947.3 955.7
Total operating expenses 8.2 141 2,662.3 2,643.7
Operating profit 5.1 137 515.3 366.3
Finance income 10 143 9.0 7.3
Finance expenses 10 143 (39.5) (30.3)
Net finance costs 10 143 (30.5) (23.0)
Share in profit of associates 17 148 0.3 0.3
Income before taxes 485.1 343.6
Taxes on income 4.3 133 (145.0) (112.9)
Net income 11 143 340.1 230.7
Translation differences 12 143 145.8 (94.3)
Other comprehensive income 12 143 (16.1) (10.5)
Total other comprehensive income 12 143 129.7 (104.8)
Total comprehensive income 469.8 125.9
Net income attributable to:
Holders of ordinary shares of Randstad Holding nv 327.5 218.6
Holders of preference shares of Randstad Holding nv 12.6 12.1
Equity holders 340.1 230.7
Non-controlling interests 0.0 0.0
Net income 340.1 230.7
Earnings per share attributable to the holders of ordinary shares of Randstad Holding nv
(expressed in € per ordinary share)
Basic earnings per ordinary share (€) 7 140 1.83 1.25
Diluted earnings per ordinary share (€) 7 140 1.81 1.23
Total comprehensive income attributable to:
Holders of ordinary shares of Randstad Holding nv 457.2 113.8
Holders of preference shares of Randstad Holding nv 12.6 12.1
Equity holders 469.8 125.9
Non-controlling interests 0.0 0.0
Total comprehensive income 469.8 125.9
consolidated statement of comprehensive incomeThe notes on pages 123 to 163 are an integral part of these consolidated financial statements.

120
annual report 2014 − Randstad Holding nv
in millions of € note page 2014 2013
ASSETS
Property, plant and equipment 13 144 128.8 131.4
Software 14 145 38.6 33.2
Goodwill 4.1 128 2,375.1 2,310.4
Acquisition-related intangible assets 15 146 183.8 321.0
Intangible assets 2,597.5 2,664.6
Deferred income tax assets 4.3 133 534.7 521.9
Financial assets 16 146 263.9 155.4
Associates 17 148 1.6 1.3
Non-current assets 3,526.5 3,474.6
Trade and other receivables 3.2 124 3,077.9 2,931.9
Income tax receivables 4.3 133 56.4 65.2
Cash and cash equivalents 3.2 124 117.1 136.1
Current assets 3,251.4 3,133.2
TOTAL ASSETS 5.2 138 6,777.9 6,607.8
EQUITY AND LIABILITIES
Issued capital 25.5 25.3
Share premium 2,261.1 2,258.7
Reserves 686.4 393.1
Net income for the year 340.1 230.7
Shareholders' equity 19.1 148 3,313.1 2,907.8
Non-controlling interests 19.3 150 0.0 0.0
Total equity 3,313.1 2,907.8
Borrowings 3.2 124 315.0 643.8
Deferred income tax liabilities 4.3 133 34.8 36.6
Provisions 4.2 131 73.6 76.7
Employee benefit obligations 4.2 131 91.0 62.6
Other liabilities 20 150 12.5 14.1
Non-current liabilities 526.9 833.8
Borrowings 3.2 124 224.1 153.7
Short-term part of non-current borrowings 3.2 124 - 99.6
Trade and other payables 18 148 2,589.9 2,473.9
Income tax liabilities 4.3 133 29.2 53.4
Provisions 4.2 131 69.9 59.8
Employee benefit obligations 4.2 131 17.8 18.5
Other liabilities 20 150 7.0 7.3
Current liabilities 2,937.9 2,866.2
Liabilities 3,464.8 3,700.0
TOTAL EQUITY AND LIABILITIES 6,777.9 6,607.8
consolidated balance sheet at December 31The notes on pages 123 to 163 are an integral part of these consolidated financial statements.

121
annual report 2014 − Randstad Holding nv
in millions of € note page 2014 2013
Operating profit 515.3 366.3Amortization and impairment of acquisition-related intangible assets 8.4 142 145.4 155.9
Impairment of goodwill 8.4 142 - 36.6
Badwill 8.4 142 - (29.1)
Operating profit before amortization and impairment of acquisition-related intangibleassets and goodwill, and badwill (EBITA) 5.1 137 660.7 529.7
Depreciation and impairment of property, plant and equipment 8.3 141 45.6 47.1
Amortization and impairment of software 8.3 141 19.6 21.1
Operating profit before depreciation, amortization and impairment, and badwill (EBITDA) 5.1 137 725.9 597.9
Loss on disposal of subsidiaries/activities 6.2 140 - 2.9
Share-based payments 9 142 27.4 27.1
Employee benefit obligations 25 161 3.0 22.1
Provisions 4.2 131 3.6 (72.6)
Loss on disposals of property, plant and equipment 13 144 0.4 0.2
Other non-cash items 21.4 152 (95.0) (68.5)
Cash flow from operations before operating working capital and income taxes 665.3 509.1
Trade and other receivables 21.2 151 (61.3) (64.1)
Trade and other payables 21.3 152 70.2 141.7
Operating working capital 8.9 77.6
Income taxes paid 21.5 152 (116.7) (246.0)
Net cash flow from operating activities 557.5 340.7
Additions to property, plant and equipment 13 144 (41.7) (45.9)
Additions to software 14 145 (24.0) (15.6)
Acquisition of subsidiaries/activities/buyout of non-controlling interests 6.1 139 (0.6) (19.2)
Acquisition of equity investments 16.4 147 (5.3) -
Held-to-maturity investments 16.1 147 (6.5) (6.9)
Loans and receivables 16.3 147 - 3.6
Disposals of property, plant and equipment 13 144 2.4 17.0
Disposal of subsidiaries/activities 6.2 140 0.2 8.4
Net cash flow from investing activities (75.5) (58.6)
Issue of new ordinary shares 19.1 148 1.5 7.1
Issue of preference shares 19.1 148 - 137.9
Purchase of own shares 19.1 148 (25.7) (9.4)
Drawings on non-current borrowings 3.2 124 - 1,047.5
Repayments of non-current borrowings 3.2 124 (455.7) (1,474.3)
Net financing (479.9) (291.2)Finance income received 10 143 1.4 3.5
Finance expenses paid 10 143 (31.8) (22.5)
Dividend paid on ordinary shares 19.2 149 (56.0) (83.8)
Dividend paid on preference shares 19.2 149 (12.1) (6.8)
Dividend paid to non-controlling interests - (0.1)
Net reimbursement to financiers (98.5) (109.7)
Net cash flow from financing activities (578.4) (400.9)
Net decrease in cash, cash equivalents and current borrowings (96.4) (118.8)
Cash, cash equivalents and current borrowings at January 1 21.1 151 (17.6) 109.0Net decrease in cash, cash equivalents and current borrowings (96.4) (118.8)
Translation gains/(losses) 7.0 (7.8)
Cash, cash equivalents and current borrowings at December 31 21.1 151 (107.0) (17.6)
Free cash flow 21.6 152 487.7 292.9
consolidated statement of cash flowsThe notes on pages 123 to 163 are an integral part of these consolidated financial statements.

122
annual report 2014 − Randstad Holding nv
in millions of €
issuedcapital
sharepremium
reserves 1 netincome
share-holders'
equity
non-controlling
interests
totalequity
treasuryshares translation
share-basedpayments
IAS 19employee
benefitsretainedearnings
Balance at January 1, 2014 25.3 2,258.7 (8.7) (90.8) 58.4 (23.9) 458.1 230.7 2,907.8 0.0 2,907.8
Net income 2014 - - - - - - - 340.1 340.1 0.0 340.1
Translation differences - - - 145.8 - - - - 145.8 0.0 145.8
Other comprehensive income - - - - - (16.1) - - (16.1) - (16.1)
Total other comprehensive income - - - 145.8 - (16.1) - - 129.7 0.0 129.7
Total comprehensive income 2014 - - - 145.8 - (16.1) - 340.1 469.8 0.0 469.8
Transactions with owners:
Dividend 2013 on ordinary shares 0.2 (0.2) - - - - 162.6 (218.6) (56.0) - (56.0)
Dividend 2013 on preference shares - - - - - - - (12.1) (12.1) - (12.1)
Purchase of own ordinary shares - - (25.7) - - - - - (25.7) - (25.7)
Share-based payments:
- fair value of vesting rights - - - - 27.4 - - - 27.4 - 27.4
- stock options exercised (on newly
issued shares) 0.0 2.6 - - (7.1) - 6.0 - 1.5 - 1.5
- performance shares issued - - 21.4 - (21.8) - 0.4 - - - -
- taxes on share-based payments - - - - - - 0.4 - 0.4 - 0.4
Total transactions with owners 0.2 2.4 (4.3) - (1.5) - 169.4 (230.7) (64.5) - (64.5)
Dividend of non-controlling interests - - - - - - - - - - -
Balance at December 31, 2014 25.5 2,261.1 (13.0) 55.0 56.9 (40.0) 627.5 340.1 3,313.1 0.0 3,313.1
Balance at January 1, 2013 19.7 2,096.4 - 3.5 57.4 - 511.2 36.7 2,724.9 0.1 2,725.0
IAS 19 amendments - - - - - (19.2) - - (19.2) - (19.2)
Tax effect IAS 19 amendments - - - - - 5.8 - - 5.8 - 5.8
Balance at January 1, 2013 19.7 2,096.4 - 3.5 57.4 (13.4) 511.2 36.7 2,711.5 0.1 2,711.6
Net income 2013 - - - - - - - 230.7 230.7 0.0 230.7
Translation differences - - - (94.3) - - - - (94.3) 0.0 (94.3)
Other comprehensive income - - - - - (10.5) - - (10.5) - (10.5)
Total other comprehensive income - - - (94.3) - (10.5) - - (104.8) 0.0 (104.8)
Total comprehensive income 2013 - - - (94.3) - (10.5) - 230.7 125.9 0.0 125.9
Transactions with owners:
Issue of preference shares 5.0 135.0 - - - - (2.1) - 137.9 - 137.9
Dividend 2012 on ordinary shares 0.5 (0.5) - - - - (53.9) (29.9) (83.8) - (83.8)
Dividend 2012 on preference shares - - - - - - - (6.8) (6.8) - (6.8)
Purchase of own ordinary shares - - (9.4) - - - - - (9.4) - (9.4)
Share-based payments:
- fair value of vesting rights - - - - 27.1 - - - 27.1 - 27.1
- stock options exercised (on newly
issued shares) 0.1 18.9 - - (7.5) - (4.4) - 7.1 - 7.1
- performance shares issued 0.0 8.9 0.7 - (18.6) - 9.0 - - - -
- taxes on share-based payments - - - - - - (1.7) - (1.7) - (1.7)
Total transactions with owners 5.6 162.3 (8.7) - 1.0 - (53.1) (36.7) 70.4 - 70.4
Dividend of non-controlling interests - - - - - - - - - (0.1) (0.1)
Balance at December 31, 2013 25.3 2,258.7 (8.7) (90.8) 58.4 (23.9) 458.1 230.7 2,907.8 0.0 2,907.81 The total of the various items included under ’reserves’ within shareholders’ equity as at December 31, 2014 is € 686.4 million (December 31, 2013: € 393.1 million).
Additional information with respect to equity is given in note 19.
consolidated statement of changes in equityThe notes on pages 123 to 163 are an integral part of these consolidated financial statements.

123
annual report 2014 − Randstad Holding nv
1. General information
Randstad Holding nv is a public limited liability companyincorporated and domiciled in the Netherlands and listed onEuronext Amsterdam. The registered office of the company isin Amsterdam. The address of the company is Diemermere25, 1112 TC Diemen, The Netherlands.
The consolidated financial statements of Randstad Holdingnv include the company and its subsidiaries (together calledthe ‘Group’).
See note 22 for an overview of the major subsidiaries andconsolidation policies.
1.1 ActivitiesRandstad specializes in solutions in the field of flexible workand human resources services. Our services comprisetemporary staffing and permanent placements. We also offeron-site workforce management, as well as other HR services,such as payroll services and outplacement.
1.2 Date of authorization of issueThe financial statements were signed and authorized forissue by the Executive Board and Supervisory Board onFebruary 17, 2015. The adoption of the financial statementsand the adoption of the dividend are reserved for theshareholders in the Annual General Meeting of Shareholders(AGM) on April 2, 2015.
2. Summary of significantaccounting policies
The significant accounting policies applied in the preparationof these consolidated financial statements are set outseparately below or explained in the respective notes to thesefinancial statements. These policies have been consistentlyapplied to the periods presented.
2.1 Basis of preparationThe consolidated financial statements have been prepared inaccordance with International Financial Reporting Standardsand IFRS IC interpretations (IFRIC), as adopted by theEuropean Union (hereinafter IFRS).
In 2014, a number of new standards as well as amendmentsto and interpretations of existing IFRS standards becameeffective. These new standards, amendments andinterpretations, as far as they are relevant to the Group, haveno impact on the valuation and classification of assets andliabilities of the Group, nor on its income statement or cashflows.
In 2014, various other new standards, as well as amendmentsto and interpretations of existing IFRS standards werepublished for application in accounting periods beginning on
or after January 1, 2015. As far as these standards,amendments and interpretations are applicable to theGroup, the Group has decided not to opt for early adoption.These new standards, amendments and interpretations,including IFRS15 'Revenue from contracts with customers' −on which we performed an initial preliminary analysis todetermine potential consequences − are expected to have nomaterial impact on the valuation and classification of theassets and liabilities of the Group, nor on its incomestatement or cash flows.
Unless otherwise stated, the financial statements areprepared under the historical cost convention and on a goingconcern basis.
For both current assets and liablities (expected to berecovered or settled within 1 year) and non-current assetsand liabilities (expected to be recovered or settled after 1year), the corresponding presentation is used on the face ofthe balance sheet.
The Group operates in countries with different currencies. Allsubsidiaries have as their functional currency the localcurrency of the country in which they operate. The Groupand its parent company use the euro as their functional andpresentation currency.
All amounts are presented in millions of euros.
2.2 Fair value estimationFair value estimations are mainly used with respect tofinancial assets and financial liabilities.
As no financial assets and liabilities of the Group are traded inactive markets, the fair value of financial assets and liabilitiesis estimated by discounting the future contractual cash flowsat current market interest rates that are available to theGroup for similar financial assets and liabilities. The fair valueis only calculated for disclosure purposes.
Because of this valuation method that uses observablemarket data for the interest rates, the resulting fair valueestimates reflect 'Level 2 Financial Instruments' for 2014 and2013.
3. Capital and financial riskmanagement
3.1 Capital managementRandstad Holding’s policy is to maintain a sound financialposition through a leverage ratio (net debt/EBITDA) ofbetween 0 and 2. We believe this is important in order tomaintain candidate, client, creditor and investor confidenceand to sustain the future development of our business.
main notes to the consolidated financial statements(in millions of €, unless otherwise indicated)

124
annual report 2014 − Randstad Holding nv
Our financing policy aims to secure financing which matchesthe Group's mid- to long-term financing requirements.
3.1.1 Dividend policyOur target is to achieve a flexible payout ratio of 40% to 50%of net profit adjusted for amortization and impairment ofacquisition-related intangible assets and goodwill, badwill,integration costs and one-offs, provided that the financialposition allows for it.
Dividend is paid in cash, unless shareholders opt for a stockdividend.
3.2 Financial risk managementThe Group is exposed to a variety of financial risks, includingcredit risk, liquidity risk, foreign currency exchange risk andinterest rate risk. One of the objectives of the Group’s riskand control framework is to minimize potential adverseeffects on the financial performance of the Group.
Our risk and control framework is in place to ensure that risksare detected, measured and reported properly. Riskmanagement procedures are carried out under policies thathave been approved by the Executive Board.
3.2.1 Credit riskCredit risk within the Group arises from the possibility thatclients and other counterparties may not be able to settletheir obligations towards the Group as agreed.
Credit control policies are included in a blueprint. To managecredit risk, credit checks are performed up front for newcustomers. For high-risk clients, credit limits are put in placebased on internal and/or external ratings. Credit risk ismonitored by the credit control departments of ouroperating companies on a daily basis.
The Group has no significant concentrations of credit risk, asthe Group has very many clients in a large number ofindustries and countries.
Trade and other receivables
2014 2013
Trade receivables 2,642.7 2,596.9
Less: provision for impairment 36.5 41.8
Trade receivables, net of provision for
impairment 2,606.2 2,555.1
Other receivables 394.1 309.7
Prepayments 73.9 65.7
Held-to-maturity investments 3.7 1.4
3,077.9 2,931.9
The book value of these receivables equals the fair value.
The Group does not hold any collateral as security.
Accounting policyTrade and other receivables are initially stated at fair value.Subsequent measurement is at amortized cost using theeffective interest method less provision for impairment.
A provision for impairment of trade and other receivables isestablished when it is more likely than not that the Groupwill not be able to collect the amounts receivable. Theprovision for impairment of trade receivables is based on thetrade receivable portfolio experience of subsidiaries, as wellas on individual assessments of expected non-recoverablereceivables. Significant financial difficulties of the debtor, theprobability that the debtor will enter into bankruptcy orfinancial reorganization, and serious default or delinquencyin payments, are considered indicators that the tradereceivable is impaired. The amount of the provision is equalto the difference between the carrying amount of the assetand the present value of estimated future cash flows.
Movements in the provision for impairment of tradereceivables
2014 2013
Balance at January 1 41.8 50.1
Acquisition of subsidiaries - 2.8
Disposal of subsidiaries - (0.2)
Charged to selling expenses 9.1 8.8
Receivables written off as uncollectable (15.1) (18.7)
Translation differences 0.7 (1.0)
Balance at December 31 36.5 41.8
In the provision for impairment of trade receivables, anamount of € 24.1 million (2013: € 29.9 million) is included forindividually impaired receivables.
The provision for impaired trade receivables is excludingrecoverable value-added taxes.
Amounts charged to the provision for impairment of tradereceivables are generally written off when there is noexpectation of recovering additional cash.
main notes to the consolidated financial statements
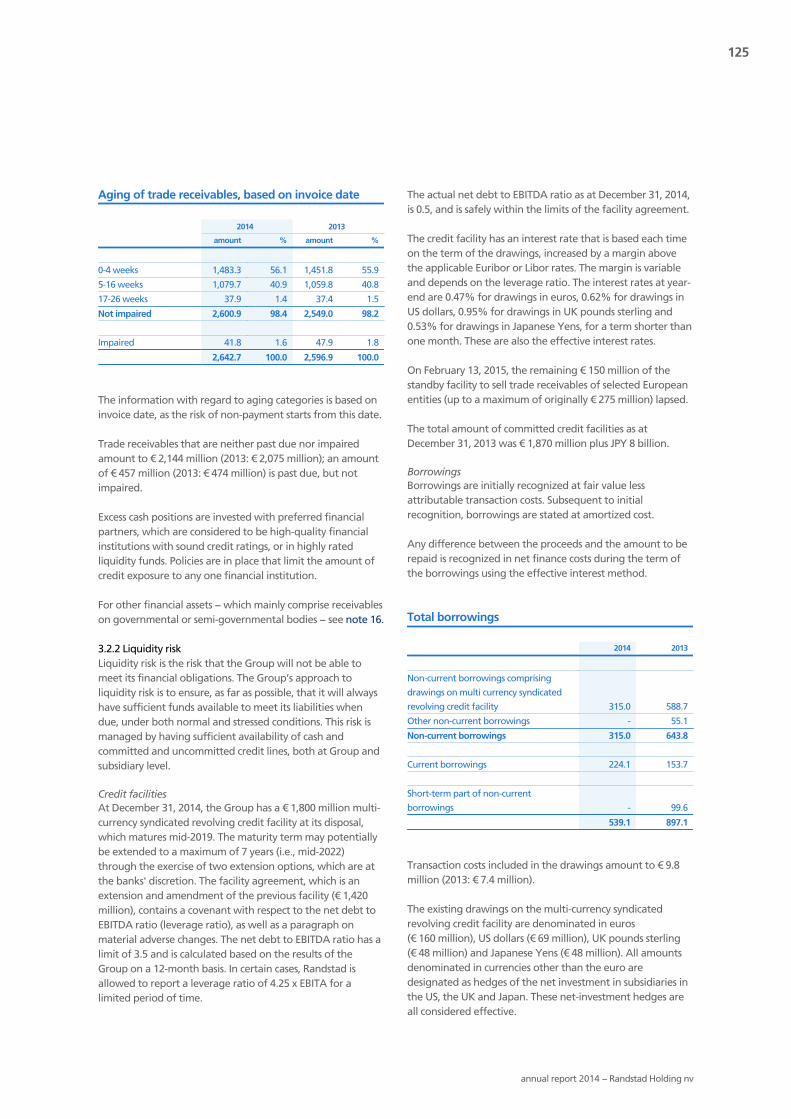
125
annual report 2014 − Randstad Holding nv
Aging of trade receivables, based on invoice date
2014 2013
amount % amount %
0-4 weeks 1,483.3 56.1 1,451.8 55.9
5-16 weeks 1,079.7 40.9 1,059.8 40.8
17-26 weeks 37.9 1.4 37.4 1.5
Not impaired 2,600.9 98.4 2,549.0 98.2
Impaired 41.8 1.6 47.9 1.8
2,642.7 100.0 2,596.9 100.0
The information with regard to aging categories is based oninvoice date, as the risk of non-payment starts from this date.
Trade receivables that are neither past due nor impairedamount to € 2,144 million (2013: € 2,075 million); an amountof € 457 million (2013: € 474 million) is past due, but notimpaired.
Excess cash positions are invested with preferred financialpartners, which are considered to be high-quality financialinstitutions with sound credit ratings, or in highly ratedliquidity funds. Policies are in place that limit the amount ofcredit exposure to any one financial institution.
For other financial assets − which mainly comprise receivableson governmental or semi-governmental bodies − see note 16.
3.2.2 Liquidity riskLiquidity risk is the risk that the Group will not be able tomeet its financial obligations. The Group’s approach toliquidity risk is to ensure, as far as possible, that it will alwayshave sufficient funds available to meet its liabilities whendue, under both normal and stressed conditions. This risk ismanaged by having sufficient availability of cash andcommitted and uncommitted credit lines, both at Group andsubsidiary level.
Credit facilitiesAt December 31, 2014, the Group has a € 1,800 million multi-currency syndicated revolving credit facility at its disposal,which matures mid-2019. The maturity term may potentiallybe extended to a maximum of 7 years (i.e., mid-2022)through the exercise of two extension options, which are atthe banks' discretion. The facility agreement, which is anextension and amendment of the previous facility (€ 1,420million), contains a covenant with respect to the net debt toEBITDA ratio (leverage ratio), as well as a paragraph onmaterial adverse changes. The net debt to EBITDA ratio has alimit of 3.5 and is calculated based on the results of theGroup on a 12-month basis. In certain cases, Randstad isallowed to report a leverage ratio of 4.25 x EBITA for alimited period of time.
The actual net debt to EBITDA ratio as at December 31, 2014,is 0.5, and is safely within the limits of the facility agreement.
The credit facility has an interest rate that is based each timeon the term of the drawings, increased by a margin abovethe applicable Euribor or Libor rates. The margin is variableand depends on the leverage ratio. The interest rates at year-end are 0.47% for drawings in euros, 0.62% for drawings inUS dollars, 0.95% for drawings in UK pounds sterling and0.53% for drawings in Japanese Yens, for a term shorter thanone month. These are also the effective interest rates.
On February 13, 2015, the remaining € 150 million of thestandby facility to sell trade receivables of selected Europeanentities (up to a maximum of originally € 275 million) lapsed.
The total amount of committed credit facilities as atDecember 31, 2013 was € 1,870 million plus JPY 8 billion.
BorrowingsBorrowings are initially recognized at fair value lessattributable transaction costs. Subsequent to initialrecognition, borrowings are stated at amortized cost.
Any difference between the proceeds and the amount to berepaid is recognized in net finance costs during the term ofthe borrowings using the effective interest method.
Total borrowings
2014 2013
Non-current borrowings comprising
drawings on multi currency syndicated
revolving credit facility 315.0 588.7
Other non-current borrowings - 55.1
Non-current borrowings 315.0 643.8
Current borrowings 224.1 153.7
Short-term part of non-current
borrowings - 99.6
539.1 897.1
Transaction costs included in the drawings amount to € 9.8million (2013: € 7.4 million).
The existing drawings on the multi-currency syndicatedrevolving credit facility are denominated in euros(€ 160 million), US dollars (€ 69 million), UK pounds sterling(€ 48 million) and Japanese Yens (€ 48 million). All amountsdenominated in currencies other than the euro aredesignated as hedges of the net investment in subsidiaries inthe US, the UK and Japan. These net-investment hedges areall considered effective.
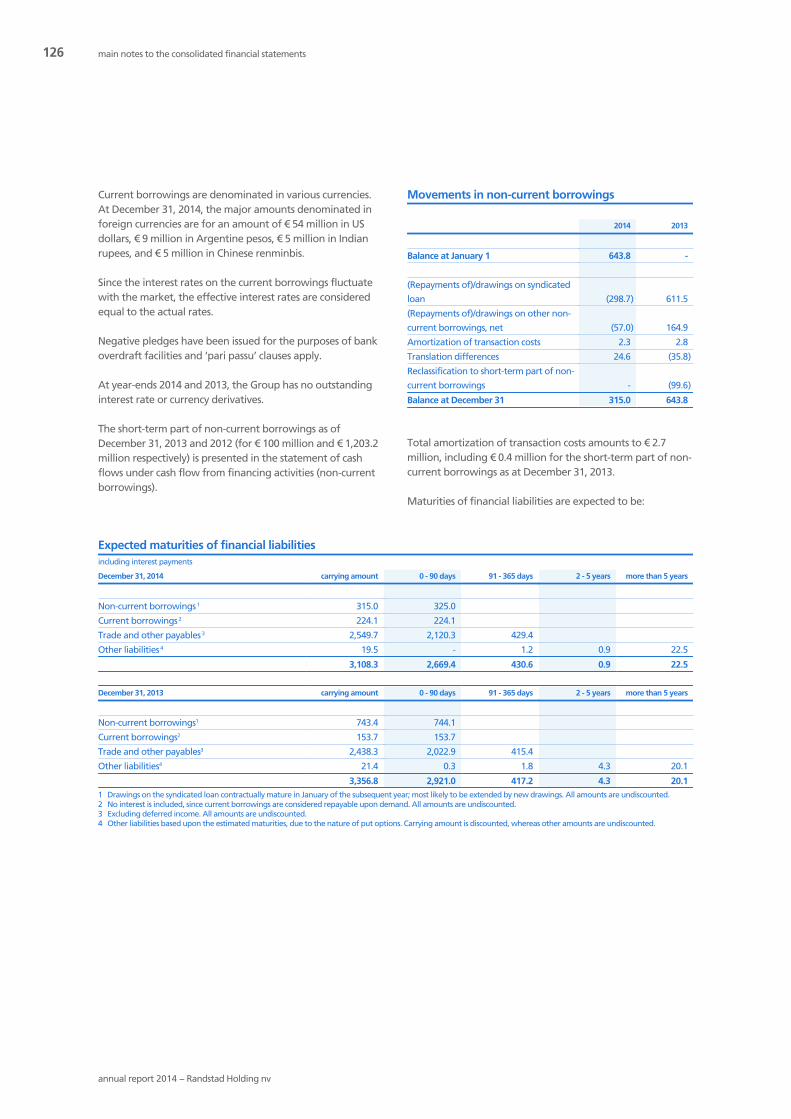
126
annual report 2014 − Randstad Holding nv
Current borrowings are denominated in various currencies.At December 31, 2014, the major amounts denominated inforeign currencies are for an amount of € 54 million in USdollars, € 9 million in Argentine pesos, € 5 million in Indianrupees, and € 5 million in Chinese renminbis.
Since the interest rates on the current borrowings fluctuatewith the market, the effective interest rates are consideredequal to the actual rates.
Negative pledges have been issued for the purposes of bankoverdraft facilities and ‘pari passu’ clauses apply.
At year-ends 2014 and 2013, the Group has no outstandinginterest rate or currency derivatives.
The short-term part of non-current borrowings as ofDecember 31, 2013 and 2012 (for € 100 million and € 1,203.2million respectively) is presented in the statement of cashflows under cash flow from financing activities (non-currentborrowings).
Total amortization of transaction costs amounts to € 2.7million, including € 0.4 million for the short-term part of non-current borrowings as at December 31, 2013.
Maturities of financial liabilities are expected to be:
Expected maturities of financial liabilitiesincluding interest payments
December 31, 2014 carrying amount 0 - 90 days 91 - 365 days 2 - 5 years more than 5 years
Non-current borrowings 1 315.0 325.0
Current borrowings 2 224.1 224.1
Trade and other payables 3 2,549.7 2,120.3 429.4
Other liabilities 4 19.5 - 1.2 0.9 22.5
3,108.3 2,669.4 430.6 0.9 22.5
December 31, 2013 carrying amount 0 - 90 days 91 - 365 days 2 - 5 years more than 5 years
Non-current borrowings1 743.4 744.1
Current borrowings2 153.7 153.7
Trade and other payables3 2,438.3 2,022.9 415.4
Other liabilities4 21.4 0.3 1.8 4.3 20.1
3,356.8 2,921.0 417.2 4.3 20.11 Drawings on the syndicated loan contractually mature in January of the subsequent year; most likely to be extended by new drawings. All amounts are undiscounted.2 No interest is included, since current borrowings are considered repayable upon demand. All amounts are undiscounted.3 Excluding deferred income. All amounts are undiscounted.4 Other liabilities based upon the estimated maturities, due to the nature of put options. Carrying amount is discounted, whereas other amounts are undiscounted.
Movements in non-current borrowings
2014 2013
Balance at January 1 643.8 -
(Repayments of)/drawings on syndicated
loan (298.7) 611.5
(Repayments of)/drawings on other non-
current borrowings, net (57.0) 164.9
Amortization of transaction costs 2.3 2.8
Translation differences 24.6 (35.8)
Reclassification to short-term part of non-
current borrowings - (99.6)
Balance at December 31 315.0 643.8
main notes to the consolidated financial statements

127
annual report 2014 − Randstad Holding nv
Cash and cash equivalentsCash and cash equivalents comprise cash on hand and atbank, as well as time deposits and other short-term highlyliquid investments with original maturities of three months orless.
cash and cash equivalents
2014 2013
Time deposits 5.8 5.2
Cash on hand and at bank 111.3 130.9
117.1 136.1
Time deposits fall due, on average, within a month. Theaverage interest rate for time deposits is 4.5% (2013: 4.5%).
An amount of € 111.1 million out of € 117.1 million (2013:€ 131.1 million out of € 136.1 million) is available upondemand.
Net cash/debtThe net cash or net debt includes the balance of cash, cashequivalents and borrowings (both current and non-current).
Net debt
2014 2013
Non-current borrowings (315.0) (643.8)
Short-term part of non-current
borrowings - (99.6)
Current borrowings (224.1) (153.7)
Total borrowings (539.1) (897.1)
Cash and cash equivalents 117.1 136.1
Net debt (422.0) (761.0)
3.2.3 Foreign currency exchange risk
Transactions and balances in currencies other than thefunctional currencyTransactions in currencies other than the functional currencyof the related company are converted at the foreignexchange rate at the date of the transaction.
Monetary balance sheet items (such as cash and borrowings)in currencies other than the functional currency of the relatedcompany are converted at year-end exchange rates.
Exchange differences resulting from the settlement oftransactions on cash, cash equivalents and borrowings, aswell as from the conversion of these monetary balance sheetitems are included in net finance costs. Exchange differencesresulting from the settlement of other transactions and
conversion of other monetary balance sheet items areincluded in operating expenses.
Non-monetary balance sheet items (such as property, plantand equipment) that are measured in terms of historical costin currencies other than the functional currency of the relatedcompany are converted at the foreign exchange rates on thedate of transaction.
Exposures to foreign currency exchange riskThe Group uses the euro as its reporting currency. Currenciesother than the euro that are of primary importance to theGroup are the Australian dollar, the Canadian dollar, theJapanese yen, the UK pound sterling and the US dollar.
Main exchange rates to the euroaverages on annual basis
2014 2013
average
at year-
end average
at year-
end
Australian dollar 0.68 0.68 0.73 0.65
Canadian dollar 0.68 0.71 0.73 0.68
Japanese yen 0.00713 0.00689 0.00772 0.00692
UK pound sterling 1.24 1.28 1.18 1.20
US dollar 0.75 0.82 0.75 0.73
The foreign currency exchange risk of the Group with respectto transactions is limited, because subsidiaries usuallygenerate both revenues and expenses in the same localcurrency.
All other foreign exchange transactions, which mostly consistof intercompany financing (equity increases, dividends,intercompany loans and interests), are executed, in principle,on a spot basis. The Group has a policy to match, withincertain preset boundaries, the currencies in the net debtpositions with the currencies in the cash flow generation. Thecurrency mix of the debt can easily be adjusted, as the € 1,800million syndicated revolving credit facility is a multi-currencyfacility. In principle, the use of derivatives is thereforeunnecessary.
Currency fluctuations can, however, affect the consolidatedresults, due to the translation of local results into the Group'sreporting currency.
Translation effects from consolidation may also impactshareholders’ equity. The Group has a number of netinvestments in foreign subsidiaries whose assets and liabilitiesare exposed to currency translation risk that is accounted for,through comprehensive income, in equity. Currencyexposures arising from the net assets of the Group’s foreignoperations are monitored and, when considered necessary,hedged against borrowings in the relevant currenciesthrough a net investment hedge; translation differences on

128
annual report 2014 − Randstad Holding nv
borrowings classified as such are included, throughcomprehensive income, in equity.
SensitivityIf the euro had weakened or strengthened 10% on averageduring 2014 against the currencies mentioned above, with allother variables held constant, EBITA for the year 2014 wouldhave been higher or lower respectively in the range of€ 1 million − € 16 million per currency. The effect onshareholders’ equity would have been the same (before taxeffects) (2013: range of € 1 million − € 15 million percurrency).
3.2.4 Interest rate riskAs we believe the staffing industry has a natural hedge tointerest rate changes (EBITDA levels usually move up anddown more or less in line with interest rate levels), and sincethe Group is cash-generating, the general policy is to keepinterest rates on net debt floating as much as possible. Wealso believe this adds value for shareholders in the long term,as over time the floating interest rates are on averagesignificantly lower than the fixed interest rates.
SensitivityIf the interest rate had been 1 percentage point higher onaverage during 2014, with all other variables held constant,net interest expenses for the year would have been € 7million higher (2013: € 10 million effect).
4. Critical accounting policies,judgments, estimatesand assumptions
In preparing the financial statements, management has tomake certain judgments, estimates and assumptions thataffect the application of accounting policies and the reportedamounts of assets, liabilities, revenue and expenses. Theactual outcome may differ from these judgments, estimatesand assumptions, and therefore could have a material effecton the carrying amount of the asset or liability involved. Thetiming of outflow of resources to settle the provisions issubject to the same uncertain factors. Judgments, estimatesand assumptions are reviewed on an ongoing basis and arebased on historical experience and various other factors,including expectations about future events, which arebelieved to be reasonable under the circumstances and forthe item involved. Revisions to accounting estimates arerecognized in the period in which the estimates are revisedand in any future periods affected.
The Group considers the following accounting policies,judgments, estimates and assumptions as critical:- impairment of non-financial assets in general and
impairment of goodwill specifically;- provisions;- corporate taxes;- revenue recognition.
4.1 Impairments
4.1.1 Impairment of non-financial assetsThe carrying amounts of the Group’s non-financial assets,with the exception of deferred tax assets and the plan assetsin relation to defined benefit pension plans, are reviewed forimpairment whenever events or changes in circumstancesindicate that the carrying amount may not be recoverable.For goodwill, testing for impairment is performed at leastannually.
If there are such indications, the recoverable amount of theasset is estimated. If this is not possible, the recoverableamount of the cash-generating unit to which the assetbelongs is estimated. For purposes of impairment testing,assets are grouped at the lowest levels for which there areseparately identifiable cash flows (cash-generating units).Goodwill is allocated to groups of cash-generating units,being operating segments, for purposes of impairmenttesting.
If the recoverable amount of an asset or a cash-generatingunit (or operating segment) is estimated to be lower than itscarrying amount, the related carrying amount is reduced toits recoverable amount.
The resulting impairment loss is immediately recognized intotal operating expenses.
The recoverable amount is the higher of an asset’s fair valueless costs to dispose and its value in use.
The value in use is determined by using the present value ofestimated cash flow projections. The discount rates are basedon interest rates that align with the terms of the projectionsand the specific risks of the asset or business respectively.
In determining the fair value less costs to dispose,information such as recent market transactions is taken intoaccount; if no such transactions (or comparable transactions)can be identified, an appropriate valuation model is used.This valuation model is supplemented by valuation multiples,quoted share prices, or other available fair-value indicators.
Impairment losses relating to a cash-generating unit (oroperating segment) are first allocated to reduce the carryingamount of the goodwill of the related cash-generating unit(or operating segment) and then to reduce the carryingamount of the other assets of that cash-generating unit (oroperating segment) on a pro rata basis.
main notes to the consolidated financial statements

129
annual report 2014 − Randstad Holding nv
An impairment loss with respect to goodwill is not reversed.
With respect to other assets, an impairment loss recognizedin a prior period is assessed at each reporting date for anyindications that the loss has decreased or no longer exists. Animpairment loss is reversed if there has been a change in theestimates used to determine the recoverable amount.
For the impairment-testing method of property, plant andequipment, software and acquisition-related intangibleassets, see notes 13, 14 and 15 respectively.
4.1.2 Goodwill and impairment of goodwill
Goodwill
2014 2013
Cost 3,096.0 3,197.3
Accumulated impairment 785.6 790.2
Balance at January 1 2,310.4 2,407.1
Disposal of subsidiaries - (1.8)
Impairment - (36.6)
Translation differences 64.7 (58.3)
Balance at December 31 2,375.1 2,310.4
Cost 3,193.7 3,096.0
Accumulated impairment 818.6 785.6
Balance at December 31 2,375.1 2,310.4
In 2014, the Group finalized the purchase price allocationrelating to the acquisition of part of the European Staffingactivities of USG People, with no effect on the badwill, whichwe reported in 2013.
In 2013, the Group sold activities in the Netherlands, the UK,Belgium and the Rest of the world. The related goodwill andaccumulated impairment amounting to € 1.8 million havebeen derecognized.
Accounting policiesGoodwill on acquisitions of subsidiaries is included inintangible assets; goodwill on acquisitions of associates isincluded in investments in associates. For the measurement ofgoodwill at initial recognition, see note 6.1.
Goodwill upon acquisitions represents payments made by theGroup in anticipation of future economic benefits from assetsthat cannot be identified individually and cannot berecognized separately. These relate, for example, to synergiesexpected from integrating the acquired companies and theworkforces of the acquired companies.
Goodwill is stated at cost less accumulated impairment losses.Gains and losses on the disposal of an entity include the
carrying amount of goodwill relating to the entity that issold; if disposal of an entity results in a loss, the goodwill partin the loss is presented in the income statement as animpairment of goodwill, up to a maximum amount of theloss on disposal.
Goodwill is allocated to groups of cash-generating units forthe purpose of impairment testing. The allocation is made tothose groups of cash-generating units that are expected tobenefit from the business combination in which the goodwillarose.
Impairment testingIn the case of triggering events and at least annually, theGroup tests whether intangible assets (being goodwill andacquisition-related intangible assets) have suffered anyimpairment. The recoverable amounts of cash-generatingunits have been determined using, among other instruments,value-in-use calculations. These calculations require the use ofestimates. Based on these impairment tests, impairmentlosses, if any, are identified.
Determination of recoverable amountThe recoverable amount for all cash-generating units(operating segments within Randstad) is based on the higherof value in use and fair value less cost to dispose. The value inuse is determined by means of cash flow projections based onthe actual operating results adjusted for non-cash items(mainly depreciation and amortization) and the expectedfuture performance, which in turn is based on historicalperformance, management’s estimates and assumptions ofrevenue growth, and of developments of operating margins,assessed using external data, covering a period of, inprinciple, nine years (2013: nine years). Cash flow projectionsafter this period are extrapolated by means of a growthpercentage of 0.5% (2013: 0.5%) throughout the Group. Thenine-year period of the projections reflects an estimated fullbusiness cycle of the industry.
Yearly impairment testKey assumptions in the cash flow projections are:- annual revenue growth of the Group: on average
between 4.1% and 8.3% for the first three years and 4.2%for the following six years (Netherlands: 4.0% to 7.0% and4.0% respectively; North America: 4.6% to 6.9% and4.6%);
- EBITA of the Group in the range of 4.6% to 4.8% ofrevenue (Netherlands: 6.0% to 6.7%; North America:5.0% to 5.2%);
- growth rate in revenue and EBITA percentages varybetween segments in relatively limited terms and aredependent on the mix in revenue.
The cash flow projections are prepared in local currencies,and discounted with pre-tax discount rates for each currencyinvolved. The pre-tax discount rates vary from 10.2% to24.0%. The weighted average is 14.4% (2013: average

130
annual report 2014 − Randstad Holding nv
13.8%). Netherlands: 12.0% (2013: 11.9%); North America:14.9% (2013: 14.0%).
Results of annual impairment testThe annual impairment tests carried out by the Group for2014 and 2013 did not indicate that any of the operatingsegments that contain goodwill may be impaired. In Q3 2013,an impairment of € 36.6 million was taken on our Australianbusiness.
Sensitivity relating to annual impairment testThe outcome of impairment testing is sensitive to variationsin estimates and assumptions. Variations in estimates andassumptions have the following effect on the recoverableamount calculations:- revenue growth: a 1 %-point lower growth rate would
not result in an impairment charge (2013: no impairmentcharge);
- EBITA: a 0.5 %-point lower EBITA in percentage ofrevenue would imply a € 9.4 million (2013: € 0.8 million)impairment charge for the operating segment Australia(1.0 %-point: € 49.8 million (2013: € 19.9 million), mainlyrelated to the operating segment Australia);
- discount rate: a 1.0 %-point higher discount rate wouldresult in a € 2.6 million impairment charge for theoperating segment Australia (2013: no impairmentcharge).
For the carrying amount of goodwill by reporting segment,see note 5.2.
In 2014, the operating segment Australia is most sensitive tovariations in assumptions (2013: Australia). The recoverableamount of € 147.2 million exceeds the carrying amount(including € 58.6 million of goodwill) by € 10.5 million.
Furthermore, the operating segments France, India and LatinAmerica are sensitive to variations in assumptions.
The operating segment the UK has sufficient headroom tocover the previously mentioned variations in assumptions.The segments the Netherlands, Belgium & Luxembourg,Germany, North America, Rest of Europe, and otheroperating segments in Rest of the world have substantialheadroom available.
main notes to the consolidated financial statements

131
annual report 2014 − Randstad Holding nv
4.2 Provisions and employee benefit obligations
4.2.1 Provisions
Movements in provisions
restructuring
workers'
compensation other total
Balance at January 1, 2014 16.7 45.6 74.2 136.5
Movements in 2014
Acquisition of subsidiaries - - (4.4) (4.4)
Charged to income statement 40.6 23.1 10.3 74.0
Released to income statement (1.8) - (8.2) (10.0)
Withdrawals (14.2) (29.3) (16.9) (60.4)
Total amount in statement of cash flows 24.6 (6.2) (14.8) 3.6
Interest due to passage of time 0.0 1.4 0.3 1.7
Translation differences 0.2 5.5 0.4 6.1
Balance at December 31, 2014 41.5 46.3 55.7 143.5
Non-current 2.5 27.9 43.2 73.6
Current 39.0 18.4 12.5 69.9
Balance at December 31, 2014 41.5 46.3 55.7 143.5
Balance at January 1, 2013
Non-current 1.5 26.2 12.8 40.5
Current 67.6 34.1 38.0 139.7
69.1 60.3 50.8 180.2
Movements in 2013
Acquisition of subsidiaries 0.9 0.0 30.0 30.9
Charged to income statement 32.9 19.3 9.0 61.2
Released to income statement (8.2) - (1.7) (9.9)
Withdrawals (77.7) (33.4) (12.8) (123.9)
Total amount in statement of cash flows (53.0) (14.1) (5.5) (72.6)
Interest due to passage of time 0.0 1.8 0.2 2.0
Translation differences (0.3) (2.4) (1.3) (4.0)
Balance at December 31, 2013 16.7 45.6 74.2 136.5
Non-current 1.0 28.3 47.4 76.7
Current 15.7 17.3 26.8 59.8
Balance at December 31, 2013 16.7 45.6 74.2 136.5
Provisions for restructuring are recognized when a detailedand formal restructuring plan is approved, and therestructuring has either commenced or has been announcedpublicly. These restructuring provisions mainly compriseseverance payments for personnel and lease terminationpenalties for branches.
Provisions for workers’ compensation are based on claims forcompensation and medical expenses (of both staffing andcorporate employees) in relation to accidents during workinghours, for which the Group is liable under applicable locallaws. These provisions relate to our activities in NorthAmerica and in part of Australia, where we are responsiblefor payment of workers’ compensation claims up to amaximum amount per claim, beyond which the costs are
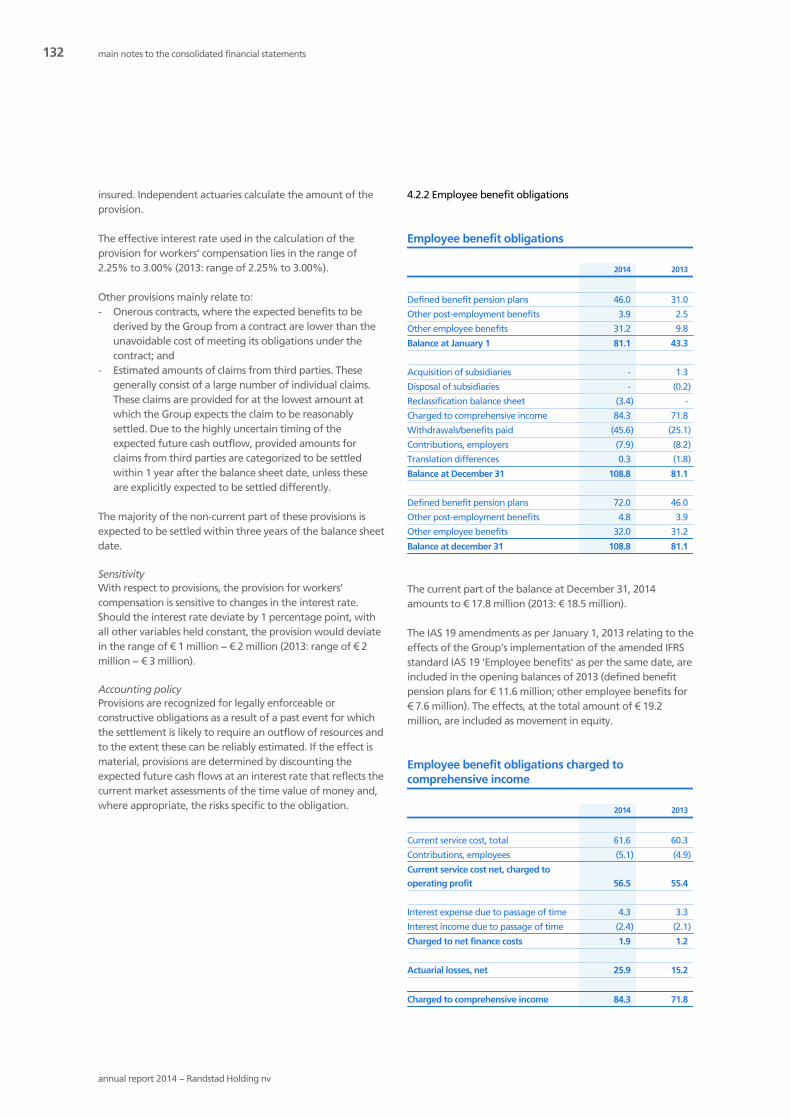
132
annual report 2014 − Randstad Holding nv
insured. Independent actuaries calculate the amount of theprovision.
The effective interest rate used in the calculation of theprovision for workers’ compensation lies in the range of2.25% to 3.00% (2013: range of 2.25% to 3.00%).
Other provisions mainly relate to:- Onerous contracts, where the expected benefits to be
derived by the Group from a contract are lower than theunavoidable cost of meeting its obligations under thecontract; and
- Estimated amounts of claims from third parties. Thesegenerally consist of a large number of individual claims.These claims are provided for at the lowest amount atwhich the Group expects the claim to be reasonablysettled. Due to the highly uncertain timing of theexpected future cash outflow, provided amounts forclaims from third parties are categorized to be settledwithin 1 year after the balance sheet date, unless theseare explicitly expected to be settled differently.
The majority of the non-current part of these provisions isexpected to be settled within three years of the balance sheetdate.
SensitivityWith respect to provisions, the provision for workers’compensation is sensitive to changes in the interest rate.Should the interest rate deviate by 1 percentage point, withall other variables held constant, the provision would deviatein the range of € 1 million − € 2 million (2013: range of € 2million − € 3 million).
Accounting policyProvisions are recognized for legally enforceable orconstructive obligations as a result of a past event for whichthe settlement is likely to require an outflow of resources andto the extent these can be reliably estimated. If the effect ismaterial, provisions are determined by discounting theexpected future cash flows at an interest rate that reflects thecurrent market assessments of the time value of money and,where appropriate, the risks specific to the obligation.
4.2.2 Employee benefit obligations
Employee benefit obligations
2014 2013
Defined benefit pension plans 46.0 31.0
Other post-employment benefits 3.9 2.5
Other employee benefits 31.2 9.8
Balance at January 1 81.1 43.3
Acquisition of subsidiaries - 1.3
Disposal of subsidiaries - (0.2)
Reclassification balance sheet (3.4) -
Charged to comprehensive income 84.3 71.8
Withdrawals/benefits paid (45.6) (25.1)
Contributions, employers (7.9) (8.2)
Translation differences 0.3 (1.8)
Balance at December 31 108.8 81.1
Defined benefit pension plans 72.0 46.0
Other post-employment benefits 4.8 3.9
Other employee benefits 32.0 31.2
Balance at december 31 108.8 81.1
The current part of the balance at December 31, 2014amounts to € 17.8 million (2013: € 18.5 million).
The IAS 19 amendments as per January 1, 2013 relating to theeffects of the Group's implementation of the amended IFRSstandard IAS 19 'Employee benefits' as per the same date, areincluded in the opening balances of 2013 (defined benefitpension plans for € 11.6 million; other employee benefits for€ 7.6 million). The effects, at the total amount of € 19.2million, are included as movement in equity.
Employee benefit obligations charged tocomprehensive income
2014 2013
Current service cost, total 61.6 60.3
Contributions, employees (5.1) (4.9)
Current service cost net, charged to
operating profit 56.5 55.4
Interest expense due to passage of time 4.3 3.3
Interest income due to passage of time (2.4) (2.1)
Charged to net finance costs 1.9 1.2
Actuarial losses, net 25.9 15.2
Charged to comprehensive income 84.3 71.8
main notes to the consolidated financial statements

133
annual report 2014 − Randstad Holding nv
The discount rates used in the calculation of the obligationsfor employee benefits are in the following ranges:
Discount rates employee benefits
2014 2013
Defined benefit pension plans 0.7% - 1.9% 0.9% - 3.5%
Other post-employment benefits 1.8% - 8.4% 3.1% - 8.8%
Other employee benefits 0.2% - 2.3% 0.4% - 3.5%
The obligations regarding other post-employment benefitsand other employee benefits are unfunded.
PensionsThe Group has various pension schemes, in accordance withlocal conditions and practices in the countries in which itoperates. Most of the pension schemes are definedcontribution plans, which are funded through payments toindependent entities. For these schemes the Group'sobligation is limited to the payment of these annualcontributions. The contributions constitute net periodic costsfor the year in which they are due and are included inpersonnel expenses and/or costs of services.
A few pension schemes are defined benefit plans. The liabilityrecognized in the balance sheet is the present value of thedefined benefit obligation of the estimated amount of futurebenefits that employees have earned in return for theirservice in the current and prior years, less the fair value ofplan assets. Independent actuaries calculate the definedbenefit obligations based on factors such as age, years ofservice and compensation (projected unit credit method).
The present value of the defined benefit obligation isdetermined by discounting the estimated future cashoutflows using interest rates of high-quality corporate bondsdenominated in the currency in which the benefits will bepaid, and with terms to maturity that approximate the termwhen the related pension liability is due.
Remeasurements of the net defined benefit liability −comprising actuarial gains and losses − are recognizedimmediately in other comprehensive income.
The net interest expense on the net defined benefit liability isdetermined by applying the discount rate used to measurethe defined benefit obligation at the beginning of the yearto the then net defined benefit liability. Net interest expenseis recognized in net finance costs.
Past service costs are recognized immediately in personnelexpenses and/or cost of services, unless changes to thepension plans are conditional on the employees remaining inservice for a specified period of time (the vesting period). In
this case, the past service costs are amortized on a straight-line basis over the vesting period.
Other post-employment benefitsOther post-employment benefit plans are defined benefitplans and follow the same accounting treatment as definedbenefit pension plans. Independent actuaries calculate thedefined benefit obligations based on factors such as age,years of service and compensation (projected unit creditmethod). These plans mainly consist of state driven plans inItaly and India.
Remeasurements of the liability − comprising actuarial gainsand losses − are recognized immediately in othercomprehensive income.
Other employee benefitsIn accordance with applicable legal requirements, the Grouprecognizes liabilities for several other employee benefit plans,such as sickness-related schemes and long-service leave plans.These liabilities are based on calculations made byindependent actuaries based on factors such as age, years ofservice, expected sickness duration, and compensation (the'projected unit credit method').
Actuarial gains and losses related to these plans arerecognized in personnel expenses and/or cost of services inthe year in which they occur.
For more information on pensions and other employeebenefit obligations, see note 25.
4.3 Corporate taxesThe Group is subject to corporate income taxes in numerousjurisdictions. Significant judgment is required in determiningthe worldwide deferred tax asset on, among other items, taxlosses carry-forward. There are many uncertain factors thatinfluence the amount of the tax losses carry-forward. TheGroup recognizes deferred tax assets on tax losses carry-forward based on its best estimates. The recoverability ofdeferred income tax assets is reviewed and assessedfrequently, using forecasts that are based on the actualoperating results and expected future performance. Externaldata are used for reference if considered necessary. When theactual results are different from the amounts that wereinitially estimated, such differences will impact the incometax in the income statement (effective tax rate) and thedeferred tax assets and/or deferred tax liabilities in the periodin which these deviations occur. The Group has also identifieda number of uncertain tax positions, which could lead topositive and/or negative differences.
4.3.1 Deferred and current income taxesUsing the balance sheet liability method, deferred tax assetsand liabilities are recognized to provide for temporarydifferences between the value of the assets and liabilities forfinancial reporting purposes and for tax purposes. Deferredtax assets and liabilities are offset when there is a legally

134
annual report 2014 − Randstad Holding nv
enforceable right to offset current tax assets against currenttax liabilities and when the deferred income taxes relate tothe same tax authority.
Deferred tax assets, including those resulting from tax lossescarry-forward, are recognized to the extent that it is probablethat future taxable profits will be available against which thetemporary differences, including tax losses carry-forward, canbe utilized.
Deferred tax assets and liabilities are valued at tax ratesenacted or substantially enacted at year-end and which areexpected to apply in the coming years when the assets andliabilities are expected to be realized or settled.
Deferred tax is provided on temporary differences arising oninvestments in subsidiaries and associates, except for deferredincome tax liabilities arising from undistributed profits frominvestments where the entity is able to control the timing ofthe reversal of the difference and it is probable that thereversal will not occur in the foreseeable future.
Deferred income tax assetsDeferred income tax assets in relation to tax losses carry-forward comprise an amount of € 110 million (2013: € 536million), originating from subsidiaries that showed tax lossesin the current or preceding year.
Certain deferred income tax assets, whose recoverability isconsidered not probable, are valued at nil. These comprisedeferred tax assets in relation to tax losses carry-forward of€ 307 million (2013: € 191 million), and deferred tax assetsrelating to other temporary differences of € 2 million (2013:€ 6 million).
The part of deferred tax assets that is expected to berecovered within one year is estimated at € 77 million (2013:€ 47 million).
Composition of deferred income tax assets
2014 2013
Tax losses carry-forward 589.3 537.9
Property, plant, equipment, and
intangible assets 71.9 79.3
Provisions 60.7 52.1
Other receivables/other payables 145.0 150.2
Temporary differences 277.6 281.6
Deferred income tax assets (before
netting) 866.9 819.5
Amount netted with deferred tax
liabilities (332.2) (297.6)
Deferred income tax assets (after netting) 534.7 521.9
SensitivityThe deferred tax assets are only recognized to the extent thatit is considered probable that future taxable profits will beavailable, against which these deferred tax assets can beutilized. The scenarios used are in agreement with theestimates and assumptions used in the goodwill impairmenttesting (see note 4.1.2). The various scenarios yield potentialoutcomes that do not materially deviate from the carryingamount.
Movements in total position of taxes on income
2014 2013
Assets/(liabilities)
Deferred income tax assets 521.9 504.7
Current income tax receivables 65.2 49.9
Deferred income tax liabilities (36.6) (44.3)
Current income tax liabilities (53.4) (170.5)
Balance at January 1 497.1 339.8
Movements during the year
Debited to income statement (145.0) (112.9)
Net payments 116.7 246.0
Acquisition of subsidiaries' deferred taxes (2.8) 32.8
Acquisition of subsidiaries' current taxes 1.8 (2.3)
Disposal of subsidiaries' deferred taxes - 0.0
Disposal of subsidiaries' current taxes - 0.2
Recognized in other comprehensive
income 13.8 12.1
Recognized in equity on share-based
payments 0.4 (1.7)
Changes in accounting policies (IAS 19) - 5.8
Translation differences 45.1 (22.7)
Total movements 30.0 157.3
Assets/(liabilities)
Deferred income tax assets 534.7 521.9
Current income tax receivables 56.4 65.2
Deferred income tax liabilities (34.8) (36.6)
Current income tax liabilities (29.2) (53.4)
Balance at December 31 527.1 497.1
main notes to the consolidated financial statements
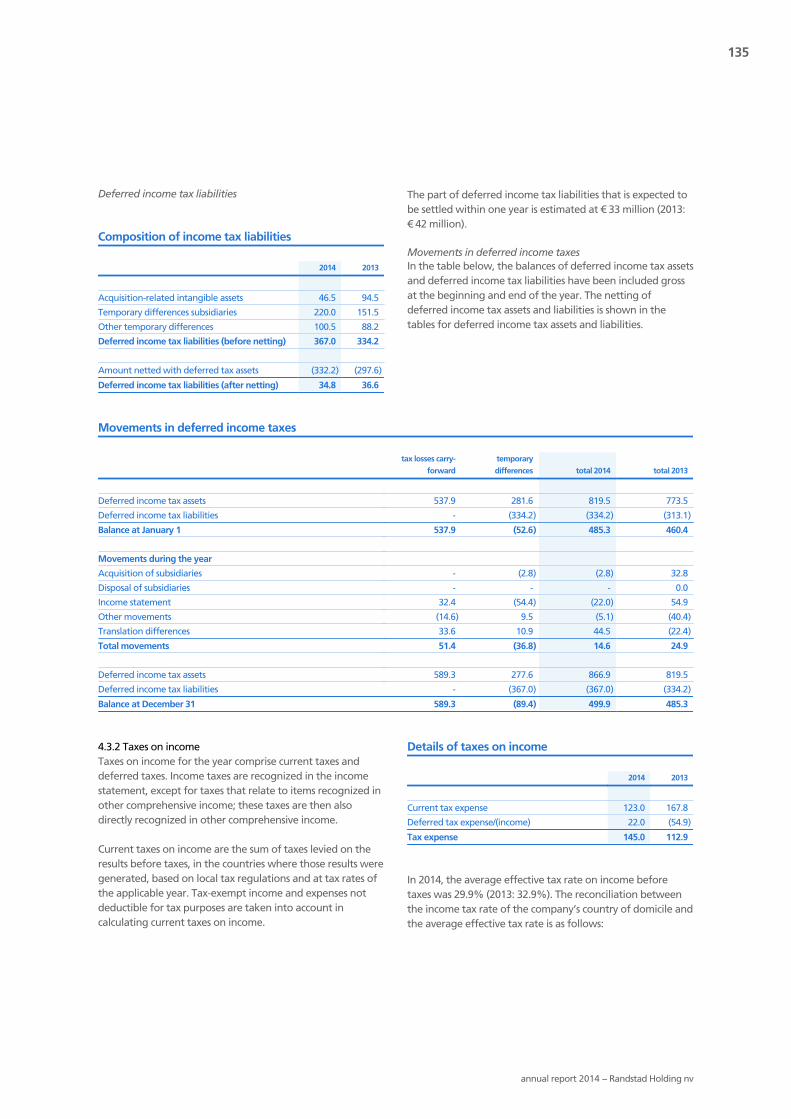
135
annual report 2014 − Randstad Holding nv
Deferred income tax liabilities
Composition of income tax liabilities
2014 2013
Acquisition-related intangible assets 46.5 94.5
Temporary differences subsidiaries 220.0 151.5
Other temporary differences 100.5 88.2
Deferred income tax liabilities (before netting) 367.0 334.2
Amount netted with deferred tax assets (332.2) (297.6)
Deferred income tax liabilities (after netting) 34.8 36.6
The part of deferred income tax liabilities that is expected tobe settled within one year is estimated at € 33 million (2013:€ 42 million).
Movements in deferred income taxesIn the table below, the balances of deferred income tax assetsand deferred income tax liabilities have been included grossat the beginning and end of the year. The netting ofdeferred income tax assets and liabilities is shown in thetables for deferred income tax assets and liabilities.
Movements in deferred income taxes
tax losses carry-
forward
temporary
differences total 2014 total 2013
Deferred income tax assets 537.9 281.6 819.5 773.5
Deferred income tax liabilities - (334.2) (334.2) (313.1)
Balance at January 1 537.9 (52.6) 485.3 460.4
Movements during the year
Acquisition of subsidiaries - (2.8) (2.8) 32.8
Disposal of subsidiaries - - - 0.0
Income statement 32.4 (54.4) (22.0) 54.9
Other movements (14.6) 9.5 (5.1) (40.4)
Translation differences 33.6 10.9 44.5 (22.4)
Total movements 51.4 (36.8) 14.6 24.9
Deferred income tax assets 589.3 277.6 866.9 819.5
Deferred income tax liabilities - (367.0) (367.0) (334.2)
Balance at December 31 589.3 (89.4) 499.9 485.3
4.3.2 Taxes on incomeTaxes on income for the year comprise current taxes anddeferred taxes. Income taxes are recognized in the incomestatement, except for taxes that relate to items recognized inother comprehensive income; these taxes are then alsodirectly recognized in other comprehensive income.
Current taxes on income are the sum of taxes levied on theresults before taxes, in the countries where those results weregenerated, based on local tax regulations and at tax rates ofthe applicable year. Tax-exempt income and expenses notdeductible for tax purposes are taken into account incalculating current taxes on income.
Details of taxes on income
2014 2013
Current tax expense 123.0 167.8
Deferred tax expense/(income) 22.0 (54.9)
Tax expense 145.0 112.9
In 2014, the average effective tax rate on income beforetaxes was 29.9% (2013: 32.9%). The reconciliation betweenthe income tax rate of the company’s country of domicile andthe average effective tax rate is as follows:

136
annual report 2014 − Randstad Holding nv
Reconciliation from applicable to effective tax rate
2014 2013
Income tax rate of the company's country of
domicile 25.0% 25.0%
Effect of income tax rates in other (non-domestic)
jurisdictions 4.2% 4.8%
Weighted average applicable tax rate 29.2% 29.8%
Tax-exempt income/non-tax-deductible items (6.7%) (2.8%)
Changes in statutory applicable tax rates and
effects of prior years 4.1% 1.6%
Change in valuation of deferred tax assets and
other 3.3% 4.3%
Average effective tax rate 29.9% 32.9%
The change in the weighted average applicable tax rate in2014 compared to 2013 is due to a changed relative mix inthe results of subsidiaries in countries with different tax rates.
The tax-exempt income related to French CICE tax credits hasan impact of 7.4%-points on the effective tax rate in bothyears, whereas the effect of the non-tax deductible Frenchbusiness tax (CVAE) was only 4.9%-points in 2014 (2013:6.7%-points), which is due to the increase in profit beforetaxes. The other tax-exempt income and non-tax deductibleexpenses had a positive impact of 4.2%-points (2013: 2.1%-points).
'Changes in statutory applicable tax rates and effects of prioryears' in 2014, is mainly influenced by negative effects of taxrate changes and tax audits in certain countries, whereas in2013 positive effects from tax rate changes were recorded.
'Change in valuation of deferred tax assets and other' isimpacted by the non-recoverability of the French deferredtax assets as a result of the negative impact of CICE ontaxable results (2014: 2.9%-points; 2013: 5.4%-points). Thelower effect is mainly due to the increase in profit beforetaxes. Other effects on this line originate from assessment ofthe deferred tax asset valuation in various countries.
4.4 Revenue recognitionRevenue comprises the fair value of the considerationreceived or receivable for services rendered during the year tothird parties. Revenue from services rendered is recognized inthe income statement in proportion to the stage ofcompletion of the contract as of the balance sheet date.Stage of completion is measured by reference to costs (mainlyhours) incurred to date as a percentage of total estimatedcosts for each contract. When the outcome of the contractcannot be measured reliably, revenue is recognized only tothe extent that expenses incurred are eligible to berecovered. No revenue is recognized if there are significantuncertainties regarding recovery of the consideration.
Revenue from temporary placements includes the amountsreceived or receivable for the services of candidates, includingthe salary and salary-related employment costs of thoseemployees ('gross basis'). These revenues are generally basedon the number of hours worked by these candidates.
Revenue from permanent placements includes the feereceived or receivable for the services provided. This fee isgenerally a percentage of the candidate’s remunerationpackage ('net basis'). The revenue of these permanentplacements is recognized on completion of the service, being,in principle, the start date of the candidate. For 'retainedassignments', revenue is recognized on the completion ofcertain pre-agreed stages of the service and for which the feeis non-refundable. Allowances are established to estimatelosses due to placed candidates not remaining employedduring the agreed guarantee period.
In situations where the Group is the principal in thetransaction and has risks and rewards of ownership, thetransactions are recorded gross in the statement ofcomprehensive income. When the Group acts as an agent,such as in cases where the Group acts as a managed servicesprovider, revenues are reported on a net basis.
4.4.1 Revenue categoriesRevenue categories are our service concepts. Three differentrevenue categories are reported: ‘Staffing’ (including HRSolutions), ‘Inhouse Services’, and ‘Professionals’ (includingSearch & Selection). All service concepts have activities in allparts of the world. For a more detailed description of theseservice concepts, see the section 'value for our clients andcandidates'.
Revenue by revenue category
2014 2013
Staffing 10,202.8 10,037.9
Professionals 3,424.5 3,306.9
Inhouse Services 3,622.5 3,223.5
17,249.8 16,568.3
main notes to the consolidated financial statements

137
annual report 2014 − Randstad Holding nv
5. Segment reporting
Segments are geographical areas and are reported in amanner consistent with internal management reportingprovided to the Executive Board. There are no material salesor other transactions between the geographical areas.‘Corporate’ is also included in the disclosures on segments,and represents the unallocated part of assets and liabilities ofholding activities, as well as the income and expenses ofholding activities; the latter net after management charges togeographical areas.
5.1 Income statement
Segmentation income statement
revenue gross profit operating profit
2014 2013 2014 2013 2014 2013
North America 3,765.9 3,686.9 813.1 790.5 150.0 121.2
France 2,726.2 2,835.7 452.9 431.5 110.6 79.8
Netherlands 2,794.7 2,739.4 577.0 557.7 124.8 134.1
Germany 1,949.3 1,875.5 336.3 330.0 73.6 71.7
Belgium & Luxembourg 1,283.3 1,238.7 245.4 231.1 58.6 8.9
United Kingdom 821.7 769.6 149.8 133.6 (5.0) (10.7)
Iberia 1,086.1 896.9 134.8 112.0 31.4 12.1
Other European countries 1,371.3 1,090.7 214.4 171.3 45.0 17.4
Rest of the world 1,451.3 1,434.9 253.9 252.3 (12.9) (44.3)
Corporate - - - - (60.8) (23.9)
Total 17,249.8 16,568.3 3,177.6 3,010.0 515.3 366.3
amortization and impairment of
acquisition-related intangibles
and goodwill, and badwill EBITA
depreciation and impairment of
property, plant and equipment,
and software EBITDA
2014 2013 2014 2013 2014 2013 2014 2013
North America 30.0 38.7 180.0 159.9 13.0 12.5 193.0 172.4
France 33.0 33.0 143.6 112.8 12.4 10.8 156.0 123.6
Netherlands 17.7 18.6 142.5 152.7 11.9 14.6 154.4 167.3
Germany 4.1 6.6 77.7 78.3 5.9 5.3 83.6 83.6
Belgium & Luxembourg 7.9 7.9 66.5 16.8 5.3 7.1 71.8 23.9
United Kingdom 17.9 17.4 12.9 6.7 3.8 4.7 16.7 11.4
Iberia 9.1 9.1 40.5 21.2 1.8 1.8 42.3 23.0
Other European countries 5.6 6.8 50.6 24.2 2.8 3.6 53.4 27.8
Rest of the world 20.1 54.4 7.2 10.1 7.9 7.8 15.1 17.9
Corporate - (29.1) (60.8) (53.0) 0.4 0.0 (60.4) (53.0)
Total 145.4 163.4 660.7 529.7 65.2 68.2 725.9 597.9

138
annual report 2014 − Randstad Holding nv
5.2 Balance sheet
Segmentation balance sheet
property, plant &equipment software goodwill
acquisition-relatedintangible assets
operating workingcapital total assets
2014 2013 2014 2013 2014 2013 2014 2013 2014 2013 2014 2013
North America 30.8 29.0 7.9 4.4 507.1 453.3 46.6 70.5 304.5 253.0 1,251.8 1,088.1
France 22.1 19.7 10.6 8.2 398.7 398.7 43.8 76.7 (52.2) (16.1) 1,251.5 1,248.0
Netherlands 36.7 41.5 2.1 2.5 795.9 795.9 23.8 41.5 (110.3) (95.9) 1,306.5 1,324.6
Germany 4.9 6.0 4.5 4.8 204.5 204.5 3.9 8.0 (20.6) (13.8) 472.8 491.7
Belgium & Luxembourg 7.4 6.7 3.6 4.3 125.9 125.9 11.0 18.9 20.4 5.1 358.5 363.4
United Kingdom 4.0 5.0 2.0 2.5 127.3 119.2 6.9 23.9 84.0 77.2 309.2 306.9
Iberia 3.3 3.6 0.4 0.7 - - 12.6 21.7 133.0 125.0 284.7 279.6
Other European countries 4.9 4.2 1.8 1.3 96.9 97.4 7.4 13.0 50.3 39.8 386.2 356.0
Rest of the world 14.7 15.7 4.2 4.5 118.8 115.5 27.8 46.8 61.8 59.2 440.7 418.5
Corporate - - 1.5 - - - - - 16.8 26.0 36.3 40.1
Eliminations - - - - - - - - - - (28.5) (32.3)
Total 128.8 131.4 38.6 33.2 2,375.1 2,310.4 183.8 321.0 487.7 459.5 6,069.7 5,884.6
5.2.1 Operating working capitalOperating working capital includes current assets, excludingcash and cash equivalents, current income tax receivables,and the current part of held-to-maturity investments, minuscurrent liabilities, excluding current borrowings, currentincome tax liabilities, and the current part of provisions andother liabilities. Deferred receipts from disposal ofsubsidiaries, as well as the net interest payable, are alsoexcluded in order to align the presentation of themovements in these latter two items, which are presentedunder net cash flow from investing activities and financingactivities respectively.
The short-term part of non-current borrowings was alsoexcluded for 2013.
5.2.2 Total assetsAssets by segment include total assets excluding deferredincome tax assets, current income tax receivables and cashand cash equivalents.
Total assets
2014 2013
Total assets 6,777.9 6,607.8
Less:
- Deferred income tax assets 534.7 521.9
- Current income tax receivables 56.4 65.2
- Cash and cash equivalents 117.1 136.1
Assets by segment 6,069.7 5,884.6
Operating working capital
2014 2013
Current assets 3,251.4 3,133.2
Current liabilities (2,937.9) (2,866.2)
Working capital 313.5 267.0
Current assets 3,251.4 3,133.2
Adjusted for:
- Cash and cash equivalents (117.1) (136.1)
- Current income tax receivables (56.4) (65.2)
- Current part of held-to-maturity investments (3.7) (1.4)
- Deferred receipts disposed Group companies (0.2) (0.4)
- Interest receivable (0.1) 0.0
Operating working capital assets 3,073.9 2,930.1
Current liabilities (2,937.9) (2,866.2)
Adjusted for:
- Current income tax liabilities 29.2 53.4
- Current borrowings 224.1 153.7
- Short-term part of non-current borrowings - 99.6
- Current provisions 69.9 59.8
- Current employee benefit obligations 17.8 18.5
- Current other liabilities 7.0 7.3
- Interest payable 3.7 3.3
Operating working capital liabilities (2,586.2) (2,470.6)
Operating working capital assets 3,073.9 2,930.1
Operating working capital liabilities (2,586.2) (2,470.6)
Operating working capital 487.7 459.5
main notes to the consolidated financial statements

139
annual report 2014 − Randstad Holding nv
6. Business combinations
6.1 Information about acquisitionsDuring 2014, the Group did not acquire any activities as aresult of business combinations.
During 2013, the Group acquired 100% of the shares ofcompanies in six European countries, which previously werepart of the USG Group. The main activity of these acquiredcompanies was temporary staffing. This acquisition resultedin an amount of badwill of € 29.1 million, as the fair value ofthe acquired net assets exceeded the acquisition price. Theamount was recognized in total operation expenses. Thebadwill was mainly caused by underperformance of theacquired activities.
In 2014 the purchase price allocation was finalized. Thecomposition of assets and liabilities acquired did not changematerially compared to prior year.
Summary of assets and liabilities arising fromacquisitions in 2013
final purchase
price
allocation
provisional
purchase price
allocation
Property, plant and equipment 1.0 1.0
Software 0.3 0.3
Deferred tax assets 30.0 32.8
Total non-current assets 31.3 34.1
Working capital 51.1 52.7
Provisions 26.5 30.9
Employee benefit obligations 1.3 1.3
Total non-current liabilities 27.8 32.2
Net assets acquired 54.6 54.6
Badwill (29.1) (29.1)
Total consideration 25.5 25.5
If the acquisition in 2013 had occured on January 1, 2013, theadditional contribution to revenue and EBITA in 2013 wouldhave been approximately € 206 million and € 1.5 millionrespectively.
Reconciliation of cash flow acquisitions
2014 2013
Total consideration - 25.5
Net cash of subsidiaries acquired - (6.7)
Consideration paid, adjusted for net cash
acquired - 18.8
Consideration paid in respect of
acquisitions in preceding years 0.6 0.4
Acquisition of subsidiaries/activities/buyout of non-controlling interests,statement of cash flows 0.6 19.2
Accounting policyThe Group uses the acquisition method to account for theacquisition of subsidiaries.
Goodwill at acquisition date is measured as:- The fair value of the consideration transferred, being the
fair value of the assets given and liabilities incurred orassumed; plus
- The recognized amount of any non-controlling interests inthe acquiree; plus
- The fair value of any previous equity interests in theacquiree (if the business combination is achieved instages); less
- The fair value of the identifiable assets acquired andliabilities assumed (including contingent liabilities).
When this difference is negative (‘negative goodwill’ orbadwill) , this amount is recognized directly in total operatingexpenses.
All considerations transferred to acquire a business arerecorded at fair value at the acquisition date; subsequentchanges to the fair value of the contingent considerationsclassified as debt are recognized as expenses or income.
The Group recognizes any non-controlling interest in theacquiree on an acquisition-by-acquisition basis, either at fairvalue or at the non-controlling interest’s proportionate shareof the recognized amounts of the acquiree’s identifiable netassets.
All acquisition-related costs are expensed and included inother general and administrative expenses.

140
annual report 2014 − Randstad Holding nv
6.2 Information about disposalsIn 2014, the Group did not dispose of any activities; anamount of € 0.2 million was received from disposals made inprevious years.
In 2013, the Group disposed of activities in the Netherlands,Belgium, the UK, and the Rest of the world, for a totalconsideration of € 5.9 million and with a total net value ofassets and liabilities of € 8.8 million. An amount of € 10.1million was received in 2013, including deferred receipts of€ 0.4 million on the disposals made in 2013 and a cash inflowof € 4.6 million from disposals made in previous years.
Reconciliation of cash flow disposals
2014 2013
Property, plant and equipment and
software - 0.1
Goodwill - 1.8
Deferred income taxes - 0.0
Working capital - 7.5
Provisions and employee benefit
obligations - (0.2)
Other liabilities - (0.4)
Net assets and liabilities - 8.8
Loss on disposal - (2.9)
Total consideration - 5.9
Deferred receipts, net 0.2 4.2
Consideration received in respect of the
disposal of subsidiaries and activities 0.2 10.1
Net cash of disposed subsidiaries and
activities - (1.7)
Disposal of subsidiaries and activities,statement of cash flows 0.2 8.4
Accounting policyUpon disposal of a subsidiary, the gain or loss upon disposal isincluded in operating profit. Where goodwill has beenallocated to an operating segment and part of the operationwithin that operating segment is disposed of, the goodwillrelated to that part is included in the carrying amount of thedisposed operation when determining the gain or loss ondisposal. Goodwill disposed is calculated based on the relativevalue of the disposed operation of the total value of theoperating segment to which the disposed operation belongs.If disposal of an operation results in a loss, this loss is firstattributed to goodwill up to the amount of allocatedgoodwill or the loss, in case the loss is lower than theallocated goodwill.
7. Earnings per ordinary share
2014 2013
Net income 340.1 230.7
Net income attributable to holders of
ordinary shares 327.5 218.6
Amortization and impairment of
acquisition-related intangible assets and
goodwill, and badwill (after taxes) 99.1 113.7
Net income attributable to holders of
ordinary shares before amortization and
impairment of acquisition-related
intangible assets and goodwill, and
badwill 426.6 332.3
Numbers of ordinary shares (in millions)
Weighted average number of ordinary
shares outstanding 178.9 175.5
Dilutive effect of share-based payment
arrangements 2.3 1.8
Weighted average number of diluted
ordinary shares outstanding 181.2 177.3
Earnings per ordinary share (in €)
Basic earnings per ordinary share 1.83 1.25
Diluted earnings per ordinary share 1.81 1.23
Diluted earnings per ordinary share
before amortization and impairment of
acquisition-related intangible assets and
goodwill, and badwill 2.35 1.87
Basic earnings per ordinary share are calculated by dividingnet income attributable to the holders of ordinary shares bythe weighted average number of ordinary sharesoutstanding during the year. The issued ordinary sharecapital is adjusted for ordinary shares purchased by RandstadHolding nv, which are held as treasury shares.
Diluted earnings per ordinary share are calculated byadjusting the weighted average number of ordinary sharesoutstanding, assuming conversion of all dilutive potentialordinary shares. The dilutive potential ordinary shares arisefrom various share-based payment arrangements.
main notes to the consolidated financial statements

141
annual report 2014 − Randstad Holding nv
8. Cost of services and totaloperating expenses
8.1 Cost of servicesCost of services comprises expenses directly attributable torevenue. These costs mainly include expenses related tocandidates, such as wages, salaries and social charges.
Cost of services
2014 2013
Wages and salaries 11,313.6 10,851.6
Social security charges 2,121.7 2,065.5
Pension charges - defined contribution
plans 87.8 87.6
Pension charges - defined benefit plans 5.3 4.2
Wages, salaries, social security and
pension charges 13,528.4 13,008.9
Depreciation of property, plant and
equipment 0.7 0.7
Other cost of services 543.1 548.7
14,072.2 13,558.3
8.2 Operating expensesOperating expenses are classified based on the functionalmodel and are recognized in the year to which they relate.
8.2.1 Selling expensesSelling expenses comprise personnel and accommodationexpenses in relation to operational activities at the outlets,advertising and marketing, and other selling expenses.
Selling expenses include an amount of € 12.2 million (2013:€ 11.2 million) related to impairment losses on tradereceivables as well as debt collection costs.
8.2.2 General and administrative expensesGeneral and administrative expenses comprise personnel andaccommodation expenses of head offices, IT expenses, othergeneral and administrative expenses, as well as theamortization and impairment of acquisition-relatedintangible assets and goodwill, and badwill.
Other general and administrative expenses include:- Foreign exchange gains of € 0.7 million (2013: foreign
exchange losses of € 1.1 million);- A loss on the sale of property, plant and equipment of
€ 0.4 million (2013: € 0.2 million);
During 2014 the Group had no business combinations (2013:disposals with a loss of € 2.9 million and acquisition-relatedexpenses of € 1.8 million).
8.2.3 Total operating expenses by nature
Total operating expenses by nature
2014 2013
Wages and salaries 1,411.5 1,343.2
Social security charges 244.0 246.6
Pension charges - defined contribution plans 32.0 32.1
Pension charges - defined benefit plans 6.1 5.3
Share-based payments 27.4 27.1
Wages, salaries, social security and pension
charges 1,721.0 1,654.3
Other personnel expenses 173.6 172.7
Personnel expenses 1,894.6 1,827.0
Depreciation and impairment of property, plant
and equipment 44.9 46.4
Amortization of software 19.6 21.1
Advertising and marketing 103.0 106.3
Accommodation 185.2 191.3
Other 269.6 288.2
Operating expenses 2,516.9 2,480.3
Amortization and impairment of acquisition-
related intangible assets and goodwill, and
badwill 145.4 163.4
Total operating expenses 2,662.3 2,643.7
8.3 Depreciation, amortization and impairment ofproperty, plant, equipment, and software
Depreciation, amortization and impairment ofproperty, plant, equipment, and software
2014 2013
Depreciation of buildings 1.1 1.2
Depreciation of computer hardware 17.6 17.5
Depreciation of leasehold improvements
and furniture and fixtures 26.9 28.4
Impairment of property, plant and
equipment - -
Depreciation and impairment of property,plant and equipment 45.6 47.1
Amortization of software 19.6 21.1
65.2 68.2
notes to the consolidated income statement

142
annual report 2014 − Randstad Holding nv
The total amount of depreciation, amortization andimpairment of property, plant, equipment, and software isincluded in the following categories:
2014 2013
Cost of services 0.7 0.7
Selling expenses 21.1 22.1
General and administrative expenses 43.4 45.4
65.2 68.2
8.4 Amortization and impairment of acquisition-related intangible assets and goodwill, and badwill
Amortization and impairment of acquisition-relatedintangible assets and goodwill, and badwill
2014 2013
Amortization of acquisition-related
intangible assets 145.4 155.9
Impairment of goodwill - 36.6
Badwill - (29.1)
145.4 163.4
For impairment of goodwill, see note 4.1.2, and for badwill,see note 6.1.
8.5 Operating leasesFor operating leases, an amount of € 229 million (2013:€ 233 million) is included in operating profit.
Lease contracts of which the majority of risks and rewardsinherent to ownership do not lie with the Group are classifiedas operating leases. Expenses related to operating leases areincluded in operating expenses and/or cost of services on astraight-line basis over the term of the lease.
8.6 GrantsGrants are recognized when there is reasonable assurancethat they will be received and that the Group will complywith the conditions attached to them.
Grants that compensate for expenses incurred are credited tooperating expenses and/or cost of services on a systematicbasis in the same period in which the expenses are incurred.
Grants included in operating profit amount to € 26.2 million(2013: € 19.4 million), of which € 25.2 million (2013: € 19.3million) is reported under cost of services. Grants mainlyrelate to the compensation (in whole or in part) of the costsof education of candidates.
9. Total wages and salaries, socialsecurity and pension charges
Wages, salaries, social security charges and pension chargesare included in cost of services for candidates and inpersonnel expenses for corporate employees.
Total amounts of wages and salaries, social securityand pension charges
2014 2013
Wages and salaries 12,725.1 12,194.8
Social security charges 2,365.7 2,312.1
Pension charges - defined contribution
plans 119.8 119.7
Pension charges - defined benefit plans 11.4 9.5
Share-based payments 27.4 27.1
15,249.4 14,663.2
notes to the consolidated income statement

143
annual report 2014 − Randstad Holding nv
10. Net finance costs
Net finance costs
2014 2013
Finance income
Interest and similar income 1.5 1.4
Foreign exchange gains, net - 2.1
Finance income - cash items 1.5 3.5
Changes in value of other liabilities 3.5 0.4
Interest income due to passage of time:
Held-to-maturity investments 3.6 3.4
CICE receivable 0.4 -
Finance income - non-cash items 7.5 3.8
9.0 7.3
Finance expenses
Interest and similar expenses 8.7 9.4
Foreign exchange losses, net 13.8 -
Interest and commitment fees on non-
current borrowings 9.2 13.3
Dividend on non-controlling interests
classified as other liabilities 0.5 0.6
Finance expenses - cash items 32.2 23.3
Amortization of transaction cost non-
current borrowings 2.7 2.8
Interest expenses due to passage of time:
- Defined benefit pension plans and other
employee benefits 1.9 1.2
- Provisions 1.7 2.0
- Other liabilities 1.0 1.0
Finance expenses - non-cash items 7.3 7.0
39.5 30.3
Net finance costs 30.5 23.0
Net finance costs comprise interest expenses and interestincome, as well as items similar to interest and exchangedifferences on cash, cash equivalents and borrowings. Interestexpenses and income are recognized in the income statementon a time-proportion basis, using the effective interestmethod. Interest due to the passage of time of held-to-maturity investments, loans and receivables, and deferredconsiderations, as well as in relation to the valuation ofcertain provisions and employee benefit obligations, are alsoincluded in net finance costs. Changes in the value ofdeferred considerations and differences upon settlement ofthese deferred considerations (see note 20), as well asdividend paid to non-controlling interests classified as otherliabilities, are also reported under net finance costs.
Finance income received and finance expenses paid
2014 2013
Statement of cash flows
Finance income - cash items 1.5 3.5
Increase in interest receivable (0.1) 0.0
Finance income received 1.4 3.5
Finance expenses - cash items 32.2 23.3
Decrease in interest payable (0.4) (0.8)
Finance expenses paid 31.8 22.5
11. Net income
Net income includes foreign exchange losses of € 13.1 million(2013: foreign exchange gains of € 1.0 million). For otheritems included in net income, see note 8.2.
12. Total other comprehensiveincome
Items that may subsequently be reclassified to the incomestatement are translation differences to the amount of€ 145.8 million positive, including a tax effect of € 4.0 millionnegative (2013: € 94.3 million negative, including a tax effectof € 7.4 million).
Items that will not be reclassified to the income statement areremeasurements of post-employment benefit obligations tothe amount of € 16.1 million negative, including a tax-effectof € 9.8 million (2013: € 10.5 million negative, including a taxeffect of € 4.7 million).

144
annual report 2014 − Randstad Holding nv
13. Property, plant and equipment
Buildings and land Computer hardware
Leasehold improvements,
furnitures and fixtures Total
Balance at January 1, 2014 27.9 34.8 68.7 131.4
Movements in 2014
Additions - 16.7 25.0 41.7
Disposals (0.7) (0.2) (1.9) (2.8)
Depreciation (1.1) (17.6) (26.9) (45.6)
Translation differences 0.9 1.4 1.8 4.1
Balance at December 31, 2014 27.0 35.1 66.7 128.8
Cost 59.6 186.4 404.9 650.9
Accumulated depreciation and impairment 32.6 151.3 338.2 522.1
Balance at December 31, 2014 27.0 35.1 66.7 128.8
Balance at January 1, 2013
Cost 75.1 192.0 432.5 699.6
Accumulated depreciation and impairment 35.4 155.1 353.8 544.3
39.7 36.9 78.7 155.3
Movements in 2013
Acquisition of subsidiaries - 0.2 0.8 1.0
Disposal of subsidiaries - 0.0 (0.1) (0.1)
Additions - 18.4 27.5 45.9
Disposals (8.3) (1.9) (7.0) (17.2)
Depreciation (1.2) (17.5) (28.4) (47.1)
Translation differences (2.3) (1.3) (2.8) (6.4)
Balance at December 31, 2013 27.9 34.8 68.7 131.4
Cost 62.3 183.6 441.4 687.3
Accumulated depreciation and impairment 34.4 148.8 372.7 555.9
Balance at December 31, 2013 27.9 34.8 68.7 131.4
Based on appraisals made by independent and expertappraisers, the estimated fair value of buildings and land is€ 10 to € 15 million higher than the carrying amount. The fairvalue represents the market value, taking into account therental of the property.
In the consolidated statement of cash flows, proceeds fromthe sale of property, plant and equipment comprise:
2014 2013
Net book value of disposals 2.8 17.2
Loss on disposals (0.4) (0.2)
Disposals of property, plant andequipment, statement of cash flows 2.4 17.0
Accounting policyProperty, plant and equipment are stated at historical costless accumulated depreciation and impairment losses.
Historical cost includes expenditures that are directlyattributable to the acquisition of the assets.
Land is not depreciated. Depreciation on other property,plant and equipment is charged to operating expensesand/or cost of services on a straight-line basis over theirestimated useful lives, from the date they are available foruse.
The residual values and useful lives are reviewed at eachbalance sheet date and adjusted, if appropriate.
Gains and losses arising on disposal are included in theincome statement under other general and administrativeexpenses.
notes to the consolidated balance sheet

145
annual report 2014 − Randstad Holding nv
Estimated useful lives of property, plant andequipmenton average
Term
Buildings 33 years
Computer hardware 4 years
Leasehold improvements 5 years
Furniture and fixtures 4-5 years
Leasehold improvements are depreciated over the term ofthe initial lease, in the event that this term is shorter than fiveyears.
Impairments − if any − are mainly caused by thediscontinuation of outlets. The net book value of leaseholdimprovements and other furniture and fixtures is impaired tothe recoverable amount, based on each individual case. Therecoverable amount tends to be zero.
14. Software
2014 2013
Cost 244.7 240.6
Accumulated amortization and
impairment 211.5 200.9
Balance at January 1 33.2 39.7
Acquisition of subsidiaries - 0.3
Disposal of subsidiaries - 0.0
Additions 24.0 15.6
Amortization (19.6) (21.1)
Translation differences 1.0 (1.3)
Balance at December 31 38.6 33.2
Cost 263.7 244.7
Accumulated amortization and
impairment 225.1 211.5
Balance at December 31 38.6 33.2
Accounting policyAcquired software (licenses) and developed software arestated at cost less accumulated amortization and impairmentlosses.
Expenditures in relation to the development of identifiableand unique software products used by the Group, and whichwill probably generate economic benefits exceeding costsbeyond one year, are recognized as intangible assets andamortized over their estimated useful lives. Capitalized costsinclude employee costs of software development and anappropriate portion of relevant overhead.
Expenditures associated with maintaining computer softwareprograms are recognized as an expense when incurred.
Amortization of software applications is charged tooperating expenses and/or cost of services on a straight-linebasis over their estimated useful lives, from the date they areavailable for use.
The residual values and useful lives are reviewed at eachbalance sheet date and adjusted, if appropriate.
The estimated useful life for software is 3 to 5 years. Acquiredcomputer software licenses are amortized on a straight-linebasis over their useful lives of 3 to 5 years or, if the licenseperiod is shorter than 3 years, over this shorter period.
Impairments − if any − are mainly caused by thediscontinuation of software applications, which in the Groupgenerally relate to front- and/or back-office applications. Thenet book value of software is impaired to its recoverableamount, which tends to be zero, based on each individualcase.

146
annual report 2014 − Randstad Holding nv
15. Acquisition-related intangibleassets
customer
relationships/
franchise
agreements
brand
names and
candidate
databases
total
Balance at January 1, 2014 321.0 - 321.0
Movements in 2014
Amortization (145.4) - (145.4)
Translation differences 8.2 - 8.2
Balance at December 31, 2014 183.8 - 183.8
Cost 1,083.5 - 1,083.5
Accumulated amortization and
impairment 899.7 - 899.7
Balance at December 31, 2014 183.8 - 183.8
Balance at January 1, 2013
Cost 1,155.9 174.6 1,330.5
Accumulated amortization and
impairment 668.7 166.1 834.8
487.2 8.5 495.7
Movements in 2013
Amortization (147.4) (8.5) (155.9)
Translation differences (18.8) 0.0 (18.8)
Balance at December 31, 2013 321.0 - 321.0
Cost 1,050.7 - 1,050.7
Accumulated amortization and
impairment 729.7 - 729.7
Balance at December 31, 2013 321.0 - 321.0
Acounting policyAcquisition-related intangible assets (customer relationships,including franchise agreements, brand names and candidatedatabases) that are acquired by the Group are stated at costless accumulated amortization and impairment losses.
When an intangible asset is acquired in a businesscombination, its cost is the fair value at the date of itsacquisition. This cost is determined on a basis that reflects anamount that the entity would have paid for the asset in anarm’s length transaction between knowledgeable and willingparties, based on the best information available. If the fairvalue cannot be measured reliably, the asset is notrecognized as a separate intangible asset, but is included ingoodwill.
Amortization of acquisition-related intangible assets ischarged to total operating expenses on a straight-line basisover their estimated useful lives, from the date they areavailable for use. If the asset is fully amortized, the at costvalue is reversed against accumulated amortization.
The residual values and useful lives are reviewed at eachbalance sheet date and adjusted, if appropriate.
The estimated useful life of customer relationships is 4 - 8years.
Impairments − if any − can be a result of either the evidencethat the assumptions for determining the estimated usefullives are incorrect or the annual impairment test of the cash-generating unit (or operating segment) to which theacquisition-related intangible assets are related.
16. Financial assets
Investments in financial assets are divided into variouscategories. Classification of these investments depends on thepurposes for which the investments have been acquired.Management determines the classification at the time of thepurchase and re-evaluates such designation at eachsubsequent balance sheet date.
Purchases and sales of all financial assets are recognized onthe settlement date, which is the date an asset is delivered toor by the Group. The cost of financial assets includestransaction costs.
Financial assets
2014 2013
Held-to-maturity investments 88.4 82.8
CICE receivables 170.2 72.6
Equity investments 5.3 -
263.9 155.4
The held-to-maturity investments and the CICE receivablesare neither past due nor impaired. These financial assets havecounterparties such as governmental or semi-governmentalbodies.
The Group does not hold any collateral as security.
notes to the consolidated balance sheet

147
annual report 2014 − Randstad Holding nv
16.1 Held-to-maturity investments
Held-to-maturity investments
2014 2013
Balance at January 1 84.2 78.0
Additions at fair value 5.8 4.8
Redemptions (1.5) (2.0)
Interest due to passage of time 3.6 3.4
Balance at December 31 92.1 84.2
Non-current portion 88.4 82.8
Current portion 3.7 1.4
92.1 84.2
Held-to-maturity investments are financial assets with fixedor determinable payments and fixed maturities for which anentity has the positive intent and ability to hold to maturity.Held-to-maturity investments are initially recognized at fairvalue and subsequently measured at amortized cost, usingthe effective interest method.
Held-to-maturity investments represent loans that aregranted interest-free by the French subsidiaries annually inrelation to legal arrangements for payment of certain socialsecurity charges. These annual loans have a repayment termof 20 years each. These investments have an averageremaining term of 12 years (2013: 12 years) and an effectiveinterest rate of 4.2% (2013: 4.3%). The nominal value ofheld-to-maturity investments amounts to € 139 million (2013:€ 133 million) and best represents the maximum exposure tocredit risk. As at December 31, 2014, the fair value wasapproximately € 31 million higher than the carrying amount(2013: € 14 million).
The difference between additions at nominal value (€ 8.0million) and at fair value is recognized in cost of services, andamounts to € 2.2 million (2013: € 8.9 million and € 4.1 millionrespectively).
16.2 CICE receivableCICE receivables are initially recognized at fair value andsubsequently measured at amortized cost, using the effectiveinterest method.
This financial asset arises from tax credits under the newFrench Competitive Employment Act (CICE). This act is aimedat improving the competitiveness of the French economy andat reducing umemployment. The tax credit is calculated as apercentage of wages and salaries paid to employees having asalary that is less than 2.5 times the French minimum wage.The tax credit can be offset against the income tax liabilitypayable with respect to the calendar year to which the wagesrelate. Any excess credit can be carried forward and offset
against the tax liability during the next three years. Anyexcess after three years will be refunded as well.
This receivable is presented under non-current assets, sincethe amount is expected to have a maturity of longer thanone year, due to the combined effect of the legal regulationsof the CICE arrangements and the income tax situation of ourFrench operations. The total receivable of € 170.2 million asat December 31, 2014, is ultimately due in 2017 (€ 73.0million) and 2018 (€ 97.2 million). In the statement of cashflows, this amount is presented in 'other non-cash items'under cash flow from operating activities, since the CICEarrangements are considered to be related to the operatingactivities. The nominal value of the receivable amounts to€ 171.0 million (2013: € 73.8 million), which best representsthe maximum exposure to credit risk. As at December 31,2014, the carrying amount approximates the fair value.
The effective interest rate is 0.3% (2013: 0.6%).
No difference in 2014 between additions at nominal valueand at fair value (2013: difference of € 1.2 million) isrecognized in cost of services.
16.3 Loans and receivablesThe loans and receivables were fully redeemed in 2013 for anamount of € 3.6 million.
Loans and receivables were financial assets with fixed ordeterminable payments that are not quoted in an activemarket. These financial assets were initially recognized at fairvalue and subsequently measured at amortized cost, usingthe effective interest method.
16.4 Equity investments
Equity investments
2014 2013
Balance at January 1 - -
Additions at fair value 5.3 -
Balance at December 31 5.3 -
CICE receivable
2014 2013
Balance at January 1 72.6 -
Additions at fair value 97.2 72.6
Interest due to passage of time 0.4 -
Balance at December 31 170.2 72.6

148
annual report 2014 − Randstad Holding nv
Equity investments are minority participations with venturecapital firms or other investors. Investments are made inearly-stage to expansion-stage companies that are consideredstrategically relevant to Randstad. The typical investmentamounts range between € 0.5 million and € 5 million. TheGroup has no significant influence over these investments.These investments are qualified as 'fair-value through othercomprehensive income'-investments, and if no reliable fair-value measurements are available, valued at cost. Allinvestments are considered non-current.
16.5 Impairment of financial assetsThe carrying amounts of all financial assets are reviewed forimpairment whenever events or changes in circumstancesindicate that the carrying amount is impaired. If objectiveevidence exists that a financial asset or group of financialassets is impaired, the amount of the impairment loss iscalculated as the difference between the carrying amount ofthe financial asset and the present value of estimated futurecash flows, discounted at the original effective interest rate(i.e., the effective interest rate computed at initial recognitionof these financial assets). The resulting impairment loss isimmediately recognized in net finance costs.
An impairment loss on financial assets is reversed if, in asubsequent period, the amount of the impairment lossdecreases and this decrease can be related objectively to anevent occurring after the impairment loss was recognized.Such reversal is immediately recognized in net finance costs.
17. Associates
2014 2013
Balance at January 1 1.3 1.0
Share in profit 0.3 0.3
Balance at December 31 1.6 1.3
At December 31, 2014, the Group has investments inassociates amounting to € 1.6 million (2013: € 1.3 million).The total assets and liabilities of these associates amount toapproximately € 18 million (2013: € 16 million) and € 9 million(2013: € 8 million) respectively. Total revenue in 2014amounted to € 17 million (2013: € 13 million). Our share innet income of all associates was € 0.3 million (2013: € 0.3million).
Accounting policyAssociates are companies over which the Group hassignificant influence, but not control, generallyaccompanying a shareholding of between 20% and 50% ofthe voting rights.
Investments in associates are accounted for using the equitymethod and are initially recognized at cost. The Group’s
investment in associates includes goodwill on acquisition, netof any accumulated impairment losses.
The Group’s share of the post-acquisition profits and losses ofthe associates is recognized as share in results of associates,and its share of post-acquisition movements in othercomprehensive income is recognized in other comprehensiveincome, with a corresponding effect to the carrying amountof the associate.
18. Trade and other payables
2014 2013
Trade payables 270.3 231.7
Other taxes and social security premiums 935.8 916.2
Pension contributions 9.0 11.7
Wages, salaries and other personnel costs 953.3 929.6
Other accruals 381.3 349.1
Deferred income 40.2 35.6
2,589.9 2,473.9
Trade and other payables are initially stated at fair value.Subsequent measurement is at amortized cost, using theeffective interest method.
19. Total equity and dividends pershare
19.1 Shareholders' equity
19.1.1 Authorized and issued capitalAuthorized capital is € 106 million (2013: € 106 million) andconsists of 350,000,000 (2013: 350,000,000) ordinary shareswith a nominal value of € 0.10, a further 106,000 (2013:106,000) type-A preference shares with a nominal value of€ 500, 30,000,000 (2013: 30,000,000) type-B preference shareswith a nominal value of € 0.10, and 150,000,000 (2013:150,000,000) type-C preference shares with a nominal valueof € 0.10.
At year-end, issued share capital consists of 180,109,671ordinary shares (2013: 177,433,667), 25,200,000 type-Bpreference shares (2013: 25,200,000), and 50,130,352 (2013:50,130,352) type-C preference shares.
For information regarding the rights, preferences andrestrictions on each type of share, see 'Voting rights', in thecorporate governance section on page 113.
The current conditions of the preference shares are such thatthe holders of these shares receive a dividend at thecompany’s discretion, that dividend is preferred andcumulative, and that the voting rights are one vote per 7
notes to the consolidated balance sheet

149
annual report 2014 − Randstad Holding nv
type-B preference shares, and one vote for each € 25 capitalpayment for type-C preference shares, resulting in 0.1171vote per share on average.
The dividend on preference shares is reviewed every sevenyears. The last review on type-B preference shares took placein November 2012, and the dividend was set at € 0.177 perpreference share. The dividend on type-C preference shareswas set at 5.8% of the capital contribution. The next reviewof the dividend will take place in November 2019. Only theExecutive Board can propose to the Annual General Meetingof Shareholders to decide that preference shares be repaid.
Number of outstanding ordinary and preferenceshares(x 1,000)
2014 2013
Ordinary
shares
Preference
shares
Ordinary
shares
Preference
shares
January 1 177,434 75,330 172,073 25,200
Issue of shares - - - 50,130
Stock dividend 2,621 - 4,572 -
From share-based
payment arrangements 55 - 789 -
December 31 180,110 75,330 177,434 75,330
At December 31, 2014, the company holds 277,489 treasuryshares (2013: 273,225).
Accounting policyOrdinary and preference shares are classified as equity. Thedistribution of the dividend on ordinary and preferenceshares is recognized as a liability in the period in which thesedividends are adopted by the company’s shareholders.
On the issue of new shares or on the extension of the term ofpreference shares outstanding, the proceeds less directlyattributable costs are recognized in shareholders’ equitywithin issued capital and, if applicable, within sharepremium.
On the purchase of ordinary shares that are included inshareholders’ equity, the consideration paid, includingdirectly attributable costs, is recorded as a change inshareholders’ equity. Purchased ordinary shares are classifiedas treasury shares and presented as a deduction fromshareholders’ equity under reserves.
On the sale (or re-issue) of treasury shares, the proceeds lessdirectly attributable costs are recognized under treasuryshares for the original consideration paid; the remainder isrecognized as a change in retained earnings.
19.1.2 Share premiumAt year-end, share premium consists of € 1,962.8 million sharepremium on ordinary shares (2013: € 1,960.4 million) and€ 298.3 million share premium on preference shares (2013:€ 298.3 million).
19.1.3 Translation reserveThe translation reserve comprises all translation differencesarising from the translation of the net investment in activitiesin currencies other than the euro, as well as translationdifferences of financial liabilities designated as hedges ofsuch investments, to the extent that the hedge is effective.Such translation differences are recognized initially in othercomprehensive income and presented in this separatecomponent of shareholders’ equity. If the net investment isdisposed, these translation differences are recognized in thestatement of comprehensive income. The translation reservealso includes the tax effect on translation differences.
19.1.4 Share-based payments reserveThe share-based payments reserve comprises the value ofvested rights in respect of share-based paymentarrangements as far as stock options have not been exercisedor performance shares have not been allocated.
The company has various share-based paymentarrangements. Additional information about thesearrangements is given in note 23. The income statementincludes an amount of € 27.4 million (2013: € 27.1 million) forshare-based payments.
At year-end 2014, 3.3 million stock options, performanceoptions and performance shares (2013: 3.4 million) areoutstanding. Upon exercise of stock options or allocation ofperformance shares, this will lead to the issuance of the samenumber of new ordinary shares or re-issue of treasury shares.
19.1.5 Other informationSee note 6 to the company financial statements for therestrictions on the distribution of dividends and therepayment of capital.
Additional information about shareholders’ equity is includedin the consolidated statement of changes in equity.
19.2 Dividends on ordinary and preference sharesAt the Annual General Meeting of Shareholders, to be heldon April 2, 2015, it will be proposed by the Executive Board,with the approval of the Supervisory Board, that a dividendof € 1.29 per ordinary share be paid for the year 2014; forpreference shares B and C it will be proposed by theExecutive Board, with the approval of the Supervisory Board,that a dividend of € 12.6 million be paid.
The 2013 dividend on ordinary shares, payable in 2014, hadbeen determined at € 0.95 per share. Shareholders weregiven a choice between cash and shares. This choice resultedin a cash dividend of € 56.0 million and a stock dividend of

150
annual report 2014 − Randstad Holding nv
€ 112.3 million, based on the volume-weighted average shareprice of approximately € 42.87.
The amount of dividend proposed for ordinary shares in 2014assumes that the dividend will be paid out 100% in cash.
Dividends on ordinary and preference shares
Dividend related to
2014 2013 2012
Ordinary shares
- Dividend paid during 2013 83.8
- Stock dividend during 2013 131.6
- Dividend paid during 2014 56.0
- Stock dividend during 2014 112.3
- Dividend 2014 proposed 232.3
Preference shares
- Dividend paid during 2013 6.8
- Dividend paid during 2014 12.1
- Dividend 2014 proposed 12.6
19.3 Non-controlling interestsIn 2014 and 2013, no transactions took place with regard tonon-controlling interests, resulting in changes of shareholderpercentages.
Accounting policyNon-controlling interests represent the net assets not held bythe Group and are presented within total equity in theconsolidated balance sheet as a separate category. Profit orloss and each component of other comprehensive income areattributed to the equity holders and to the non-controllinginterests.
The Group treats transactions with non-controlling interestsas transactions with equity owners of the Group. Foracquisitions of non-controlling interests, the differencebetween any consideration paid and the relevant shareacquired of the carrying value of the net assets is recorded inequity. Gains or losses on disposals of non-controllinginterests are also recorded in equity as long as control of thesubsidiary is maintained.
20. Other liabilities2014 2013
Balance at January 1 21.4 22.8
Acquisition of non-controlling interests (0.6) (0.4)
Disposal of majority interests - (0.4)
Changes in value (3.5) (0.4)
Interest due to passage of time 1.0 1.0
Translation differences 1.2 (1.2)
Balance at December 31 19.5 21.4
Non-current portion 12.5 14.1
Current portion 7.0 7.3
19.5 21.4
The effective interest rate amounts to 5.0% (2013: 5.0%).
Accounting policyOther liabilities mainly include liabilities arising fromarrangements with the previous owners of acquiredcompanies who still hold a non-controlling interest ('deferredconsiderations') and deferred payments from other businesscombinations.
With respect to these arrangements, the Group has enteredinto put and call options with the holders of these non-controlling interests. The put option gives the minorityshareholder the right to sell its non-controlling interest to theGroup. The call option gives the Group the right to purchasethe non-controlling interest. The option exercise price isdetermined by a contractually agreed formula that is basedmainly on the future results of the company involved.
The liability is initially stated at fair value. Subsequentmeasurement is at amortized cost, using the effective interestmethod. The value is determined by means of the presentvalue of the expected cash outflows to settle the liability,based on projected results. The discount rate used indiscounting the expected cash outflows is based on aninterest rate that reflects the current market assessment ofthe time value of money, taking into account the expectedsettlement of these liabilities.
In line with the nature of the put option, the liability isclassified as short term, except for the part that can only beexercised after one year. Changes in the value of theseliabilities (also including interest due to passage of time), aswell as differences upon settlement between the actual cashoutflow and the expected cash outflow, are accounted for innet finance costs. The companies acquired under thesearrangements are fully consolidated, with no recognition of anon-controlling interest.
notes to the consolidated balance sheet

151
annual report 2014 − Randstad Holding nv
21. Statement of cash flows
The statement of cash flows has been prepared applying theindirect method. Cash in the statement of cash flowscomprises cash and cash equivalents, as well as currentborrowings, because current borrowings form an integralpart of the Group’s cash management. The short-term part ofnon-current borrowings is not included.
Cash flows in foreign currencies have been translated − inprinciple − at average exchange rates; certain material(mainly financing) transactions are translated at the exchangerate at the day of translation. Exchange differencesconcerning cash items are shown separately in the statementof cash flows. Income taxes paid/received are included in thecash flow from operating activities. Finance income received,finance expenses paid, and dividends paid are included in thecash flow from financing activities.
The purchase price of acquisitions paid, as well as the sellingprice of disposed subsidiaries received, is included in cash flowfrom investing activities. This purchase price paid, as well asthe selling price received, is included in the statement of cashflows net of net cash acquired or disposed of respectively.Changes in assets and liabilities resulting from the acquisitionand disposal of subsidiaries are taken into account in thecalculation of the consolidated cash flows.
The majority of the items in the consolidated statement ofcash flows are individually cross-referenced to the relevantnotes to the consolidated income statement and balancesheet. For the remainder of the material items, thereconciliation between amounts as included in theconsolidated statement of cash flows and related amounts inthe statement of comprehensive income and balance sheet isshown in this note.
21.1 Cash
Cash
2014 2013
Cash and cash equivalents 117.1 136.1
Current borrowings (224.1) (153.7)
(107.0) (17.6)
21.2 Trade and other receivables
Trade and other receivables
2014 2013
Trade and other receivables as at January 1 2,931.9 2,872.5
Adjusted for:
Current part of held-to-maturity investments (1.4) (1.9)
Deferred receipts disposed Group companies (0.4) (4.6)
Interest receivable 0.0 0.0
Operating working capital assets as at
January 1 2,930.1 2,866.0
Acquisition of subsidiaries (4.7) 121.9
Disposal of subsidiaries - (14.9)
Transfer to employee benefit obligations (3.4) -
Translation gains/(losses) 90.6 (107.0)
Statement of cash flows 61.3 64.1
Operating working capital assets as at
December 31 3,073.9 2,930.1
Adjusted for:
Current part of held-to-maturity investments 3.7 1.4
Deferred receipts disposed Group companies 0.2 0.4
Interest receivable 0.1 0.0
Balance at December 31 3,077.9 2,931.9
notes to the consolidated statement of cash flows

152
annual report 2014 − Randstad Holding nv
21.3 Trade and other payables
Trade and other payables
2014 2013
Trade and other payables as at January 1 2,473.9 2,343.0
Adjusted for:
Interest payable (3.3) (2.5)
Operating working capital liabilities as at
January 1 2,470.6 2,340.5
Acquisition of subsidiaries (1.3) 73.6
Disposal of subsidiaries - (8.9)
Translation losses/(gains) 46.7 (76.3)
Statement of cash flows 70.2 141.7
Operating working capital liabilities as at
December 31 2,586.2 2,470.6
Adjusted for:
Interest payable 3.7 3.3
Trade and other payables as at December 31 2,589.9 2,473.9
21.4 Other non-cash items
Other non-cash items
2014 2013
CICE receivable (97.2) (72.6)
Held-to-maturity investments 2.2 4.1
Statement of cash flows (95.0) (68.5)
For the CICE receivable, see note 16.2.
21.5 Income taxes paid
Income taxes paid
2014 2013
North America 6.9 3.3
France 35.3 34.5
Netherlands 31.5 20.3
Germany 11.6 37.4
Belgium & Luxembourg 7.1 (1.5)
United Kingdom 0.4 0.7
Iberia 8.7 2.3
Other European countries 4.7 3.5
Rest of the world 8.3 10.5
Corporate 2.2 135.0
Total 116.7 246.0
Income tax paid in North America is low as a result ofaccummulated net operating losses that are offset againsttaxable income.
In Germany, an amount of € 11 million was received fromoverpayment of income tax, paid in 2013.
Randstad Holding nv (included in Corporate) and the Dutchoperating companies are part of a fiscal unity for corporateincome taxes. The payments included under the Netherlandsrepresent the payments to Randstad Holding nv by the Dutchoperating companies, based on the results before taxes ofthese companies. A payment of € 131 million to the Dutch taxauthorities in Q4 2013 is included under Corporate.
21.6 Free cash flowFree cash flow comprises net cash from operating andinvesting activities, excluding the acquisition and disposal ofsubsidiaries/activities, and of equity investments and buyoutof non-controlling interests:
Free cash flow
2014 2013
Net cash from operating activities 557.5 340.7
Net cash from investing activities (75.5) (58.6)
482.0 282.1
Acquisition of subsidiaries/activities/equity
investments and buyout of non-
controlling interests 5.9 19.2
Disposal of subsidiaries/activities (0.2) (8.4)
Free cash flow 487.7 292.9
notes to the consolidated statement of cash flows

153
annual report 2014 − Randstad Holding nv
22. Subsidiaries
Subsidiaries are companies controlled by Randstad Holdingnv. Control exists when Randstad is exposed to or has rightsto variable returns from its involvement with subsidiarycompanies and has the ability to influence those returnsthrough its power over the subsidiary, generallyaccompanying a shareholding of more than 50% of thevoting rights. Subsidiaries are consolidated from the datethat such control commences until the date that it ceases.
Intragroup balances and intragroup transactions areeliminated, as well as any unrealized gains from thesetransactions. Unrealized losses from intragroup transactionsare also eliminated, unless there is evidence of impairment ofthe assets transferred. Intercompany transactions take placeon an arm’s length basis.
22.1 Financial statements of Group companiesUpon translation of foreign activities, the assets and liabilitiesof operations in currencies other than the euro, includinggoodwill and fair-value adjustments arising on consolidation,are translated into euros at the foreign exchange rates at thebalance sheet date. The income statements of theseoperations in currencies other than the euro are translatedinto euros at average exchange rates.
Upon the acquisition of a subsidiary that has a currency otherthan the euro, balance sheet items are translated into eurosat the foreign exchange rates at the acquisition date.
22.2 Net investment in subsidiaries that have acurrency other than the euroThe net investment in subsidiaries that have a currency otherthan the euro includes the participation in the net assets ofthese subsidiaries, and, if applicable, loans to thesesubsidiaries, settlement of which is neither planned norexpected to occur in the foreseeable future.
Translation differences that occur upon consolidation,relating to the translation of the net investment insubsidiaries that have a currency other than the euro, arerecognized in other comprehensive income and presented inthe (foreign currency) translation reserve, a separatecomponent within equity, as are translation differences offinancial liabilities designated as hedges of such investments(net investment hedge), to the extent that the hedge iseffective. The gain or loss relating to the ineffective portion isrecognized immediately in net finance costs.
If the operation is a non-wholly-owned subsidiary, then therelevant proportionate share of the translation differences isallocated to the non-controlling interests.
Whenever a foreign operation is disposed of, thesetranslation differences are released or charged to thestatement of comprehensive income as part of the gain orloss on disposal.
other notes to the consolidated financial statements
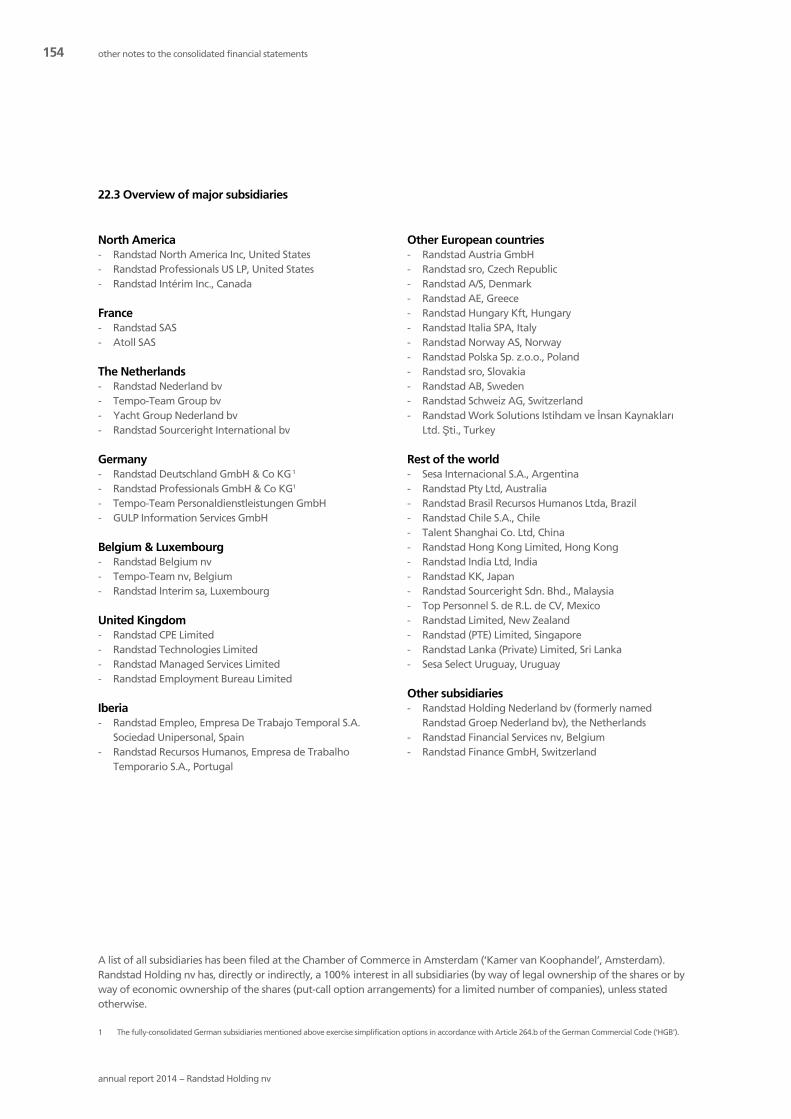
154
annual report 2014 − Randstad Holding nv
22.3 Overview of major subsidiaries
North America- Randstad North America Inc, United States- Randstad Professionals US LP, United States- Randstad Intérim Inc., Canada
France- Randstad SAS- Atoll SAS
The Netherlands- Randstad Nederland bv- Tempo-Team Group bv- Yacht Group Nederland bv- Randstad Sourceright International bv
Germany- Randstad Deutschland GmbH & Co KG1
- Randstad Professionals GmbH & Co KG1
- Tempo-Team Personaldienstleistungen GmbH- GULP Information Services GmbH
Belgium & Luxembourg- Randstad Belgium nv- Tempo-Team nv, Belgium- Randstad Interim sa, Luxembourg
United Kingdom- Randstad CPE Limited- Randstad Technologies Limited- Randstad Managed Services Limited- Randstad Employment Bureau Limited
Iberia- Randstad Empleo, Empresa De Trabajo Temporal S.A.
Sociedad Unipersonal, Spain- Randstad Recursos Humanos, Empresa de Trabalho
Temporario S.A., Portugal
Other European countries- Randstad Austria GmbH- Randstad sro, Czech Republic- Randstad A/S, Denmark- Randstad AE, Greece- Randstad Hungary Kft, Hungary- Randstad Italia SPA, Italy- Randstad Norway AS, Norway- Randstad Polska Sp. z.o.o., Poland- Randstad sro, Slovakia- Randstad AB, Sweden- Randstad Schweiz AG, Switzerland- Randstad Work Solutions Istihdam ve İnsan Kaynakları
Ltd. Şti., Turkey
Rest of the world- Sesa Internacional S.A., Argentina- Randstad Pty Ltd, Australia- Randstad Brasil Recursos Humanos Ltda, Brazil- Randstad Chile S.A., Chile- Talent Shanghai Co. Ltd, China- Randstad Hong Kong Limited, Hong Kong- Randstad India Ltd, India- Randstad KK, Japan- Randstad Sourceright Sdn. Bhd., Malaysia- Top Personnel S. de R.L. de CV, Mexico- Randstad Limited, New Zealand- Randstad (PTE) Limited, Singapore- Randstad Lanka (Private) Limited, Sri Lanka- Sesa Select Uruguay, Uruguay
Other subsidiaries- Randstad Holding Nederland bv (formerly named
Randstad Groep Nederland bv), the Netherlands- Randstad Financial Services nv, Belgium- Randstad Finance GmbH, Switzerland
1 The fully-consolidated German subsidiaries mentioned above exercise simplification options in accordance with Article 264.b of the German Commercial Code (‘HGB’).
A list of all subsidiaries has been filed at the Chamber of Commerce in Amsterdam (‘Kamer van Koophandel’, Amsterdam).Randstad Holding nv has, directly or indirectly, a 100% interest in all subsidiaries (by way of legal ownership of the shares or byway of economic ownership of the shares (put-call option arrangements) for a limited number of companies), unless statedotherwise.
other notes to the consolidated financial statements

155
annual report 2014 − Randstad Holding nv
23. Share-based payments
The company has various share-based payment arrangementsthat are settled in ordinary shares. The fair value of theseshare-based payments, calculated on grant date, is based onvaluation models, taking into account relevant marketconditions and non-vesting conditions. The fair value isincluded in personnel expenses in the vesting period duringwhich the expected employee services are received. The sameamount is credited to shareholders’ equity.
At each balance sheet date, the company re-assesses itsestimates of the non-market vesting conditions under theseshare-based payment arrangements. The impact of therevision on original estimates with respect to the past vestingperiod, if any, is recognized in personnel expensesimmediately, with a corresponding adjustment toshareholders’ equity.
Within the Group, a number of share-based paymentarrangements are in effect: stock option plans andperformance share plans for Executive Board members andsenior management, and a share purchase plan for allcorporate employees.
The actual annual grant of performance shares and optionswill, in principle, not exceed 1% of the ordinary issuedcapital. However, depending on the realization of relatedperformance targets and the company’s actual share price,the number of shares to be issued in relation to vesting of theperformance shares and options might in a certain yearexceed the 1% limit.
23.1 Stock option plans
23.1.1 Executive Board stock option planUntil 2007, the Executive Board received options under thisplan, which was implemented in 2001. The options have anexercise price that is not lower than the share price at the
date they were granted. The options have a term of sevenyears, and are only exercisable after a period of three yearsfrom the date of grant, without performance conditions orother restrictions.
23.1.2 Senior management stock option planUntil 2007, options were also granted to a limited group ofsenior management. The exercise price, term and otherconditions are identical to the Executive Board stock optionplan.
23.1.3 Executive Board performance stock option plansFrom 2007 to 2012, Executive Board members have beengranted stock options annually conditional on performance;as from 2008 up to 2012, the options had an exercise priceequal to the average trading price of the Randstad sharesduring three business days before grant date. The optionshave a term of seven years, and are only exercisable after aperiod of three years from the date of grant. The number ofoptions that will vest depends on the company’s ‘totalshareholder return’ (TSR) performance compared with a peergroup of nine companies measured over a three-year periodstarting on January 1 of the year in which the options weregranted. Options granted to a Board member who resignsfrom the Group within the three-year vesting period will, inprinciple, be forfeited.
All stock option plans are equity-settled. The fair value wasdetermined as at the date of each grant, based on acombination of a Monte Carlo simulation model and a Black& Scholes valuation model.
The fair value is charged to the income statement during thevesting period based on the on-target awards of each plan.At each balance sheet date, the assumed attrition isreassessed; any adjustment is charged to the incomestatement. On exercise of options, the company issues newshares.
Details of all stock option plans
Year ofgrant
number of options (x 1,000)
January 1,2014 granted expired
performanceadjustment at
vesting exercisedDecember
31, 2014 exercisableaverage share price
at exercise (in €)average exercise
price (in €)
average fair valueat grant date per
option (in €)
Stock option plans
2007 331 - (331) - - - - 57.40 17.63
Performance stock option plans
2007 36 - (36) - - - - 57.40 18.70
2008 48 - - - (48) - 48.60 26.39 9.50
2009 73 - - - - 73 73 - 9.88 9.00
2010 41 - - - (7) 34 34 47.02 31.39 21.04
2011 48 - - 12 - 60 60 - 39.16 21.00
2012 179 - - - - 179 - 28.11 11.31
Total 756 - (367) 12 (55) 346 167

156
annual report 2014 − Randstad Holding nv
The expenses charged to the income statement 2014 amountto € 0.6 million (2013: € 1.2 million).
In 2013, the performance stock options 2011 vested, based onrelative TSR performance over the period January 1, 2011 -December 31, 2013. The performance resulted in 125% or59,810 options being vested (share price at allocation date: €46.70), compared to an on-target award of 47,847.
23.2 Performance share plans
23.2.1 Executive Board performance share planAs from 2007, conditional performance shares have beengranted annually to the members of the Executive Board. Theplan has a term of three years. The number of shares to vestdepends on the company’s TSR performance compared to apeer group of nine companies measured over a three-yearperiod starting on January 1 of the year of grant. As of 2013,the number of shares to vest also depends on achievingcertain sustainability performance targets.
The shares yet to be vested of a Board member who resignsfrom the Group within the three-year vesting period will, inprinciple, be forfeited.
23.2.2 Senior management performance share planAs from 2007, conditional performance shares have also beengranted to a limited group of senior management on termsand conditions that are identical to those of the ExecutiveBoard, except for the fact that, for the years 2014 and 2013,the number of shares to vest solely depended on thecompany's TSR performance.
Volatility of the shares of the peer companies, as well as thepair-wise correlation between all 10 shares, is estimated on
the basis of historical daily prices over three years. Estimateddividends of the peer companies are based on historicaldividends.
The fair value is charged to the income statement during thevesting period, based on the on-target awards of each plan.
At each balance sheet date, the non-market conditions(attrition and sustainability performance) are reassessed; anyadjustment is charged to the income statement. Up to 2013,on final allocation of vested shares, the company used toissue new shares. As of 2013, the company has been usingtreasury shares for this purpose.
The expenses charged to the income statement 2014 amountto € 24.5 million (2013: € 22.5 million).
The performance shares 2011 vested in early 2014, based onrelative TSR performance of the company, resulting in535,859 shares being vested (share price at allocation date of€ 46.70), compared to an on-target award of 428,250 shares.
Details of all performance share plans
Year of grant
number of shares (x 1,000) on target
January 1, 2014 granted forfeitures vested in 2014 December 31, 2014
average fair value at grant date
per share (in €)
2011 432 - (4) (428) - 45.10
2012 1,103 - (54) - 1,049 27.00
2013 1,077 - (82) - 995 24.15
2014 - 913 (30) - 883 29.83
Total 2,612 913 (170) (428) 2,927
23.3 Share purchase plan for corporate employeesUnder the share purchase plan, participating corporateemployees may purchase shares from a separate foundation,Stichting Randstad Optiefonds, twice a year. The maximumamount to be spent within the plan is set annually at 5% ofthe participant’s fixed annual salary. Employees receive anumber of bonus shares equal to a fixed percentage of thenumber of shares purchased; these bonus shares vest over a
period of six monthes, only if employees hold on to thepurchased shares for the same period of six months (oncondition that they are still employed by the Group). Thebonus is expensed by the company over the vesting period(2014: € 2.3 million; 2013: € 3.4 million). In 2014, a total of60,076 (2013: 87,368) bonus shares were allocated toemployees.
Parameters used for fair-value determination
2014 2013 2012
Average share price at grant date € 45.05 € 30.40 € 26.63
Expected volatility, based on historical
prices over the three-year period to
the valuation date 32% 34% 37%
Expected dividends 2.2% 3.8% 4.4%
Risk-free interest rate (yield on Dutch
government bonds) 0.6% 0.6% 1.4%
other notes to the consolidated financial statements

157
annual report 2014 − Randstad Holding nv
24. Related-party transactions
24.1 Key managementThe members of the Executive Board and Supervisory Boardare considered the key management of the Group.
24.2 Remuneration of the members of theExecutive BoardThe totals of the remuneration of the members of theExecutive Board are included in the income statement.
Executive Board remunerationx € 1,000
fixed compensation variable compensationtermination and other
benefits/ expenses total
base salary pension charge short-term cash bonus share-based payments2014 2013 2014 2013 2014 2013 2014 2013 2014 2013 2014 2013
J.W. van den Broek 765 574 207 151 507 430 719 546 37 69 2,235 1,770
R.J. van de Kraats 673 653 182 173 463 490 739 622 34 26 2,091 1,964
F. Béharel 591 568 160 129 392 426 581 412 394 262 2,118 1,797
L. Galipeau 566 550 153 148 392 413 649 471 77 99 1,837 1,681
C. Heutink 439 - 118 - 324 - 307 - 21 - 1,209 -
L.J.M.V. Lindelauf 591 574 160 151 410 430 649 546 62 23 1,872 1,724
B.J. Noteboom 162 970 44 258 - 727 82 911 5 2,582 293 5,448
Total 3,787 3,889 1,024 1,010 2,488 2,916 3,726 3,508 630 3,061 11,655 14,384
Chris Heutink was appointed on April 3, 2014 for a period of4 years. François Béharel was appointed on January 16, 2013for a period of 4 years. They both received theirremuneration as a Board member as from the date ofappointment. Ben Noteboom's remuneration has beenincluded up to the end of February 2014; terminationexpenses of € 2,548,000 were recorded in 2013.
The expenses for performance shares and stock options referto the fair value of share-based payments charged to theincome statement for the years 2014 and 2013 respectively.
In the income statement 2014, expenses have been includedfor former members of the Executive Board for an amount of€ 75,000 (2013: € 599,000). These expenses relate to GregNetland (2013: Brian Wilkinson).
Included in the column 'termination and other benefits/expenses' for F. Béharel are special taxes on salary of€ 237,000 (2013: € 211,000).
In addition to the total remuneration as presented in thetable above, non-recurring Dutch crisis tax expenses forwages above € 150,000 amounted to € 2,373,000 in 2013. In2014, no such crisis tax existed.
Non-recurring crisis tax expenses per memberx € 1,000
2014 2013
J.W. van den Broek - 260
R.J. van de Kraats - 367
F. Béharel - 3
L.J.M.V. Lindelauf - 407
B.J. Noteboom - 1,080
B. Wilkinson - 256
Total - 2,373
The company has not issued any loans, commitments toprovide loans, or guarantees to Executive Board members.

158
annual report 2014 − Randstad Holding nv
Number of (performance) stock options outstanding in 2014
year of
granting
January 1,
2014
transfer in
2014
expired in
2014
performance
adjustment at
vesting 2014
exercised
in 2014
share price at
exercise
December
31, 2014
Stock option plans
J.W. van den Broek 2007 14,012 (14,012) -
R.J. van de Kraats 2007 15,950 (15,950) -
L. Galipeau 2007 3,072 (3,072) -
L.J.M.V. Lindelauf 2007 14,012 (14,012) -
C. Heutink 2007 - 2,126 (2,126) -
Performance stock option plans
J.W. van den Broek 2007 7,586 (7,586) -
2009 40,552 40,552
2010 7,083 7,083
2011 10,091 2,523 12,614
2012 30,764 30,764
R.J. van de Kraats 2007 8,635 (8,635) -
2009 32,252 32,252
2010 8,063 8,063
2011 11,487 2,872 14,359
2012 35,021 35,021
L. Galipeau 2012 30,764 30,764
L.J.M.V. Lindelauf 2007 7,586 (7,586) -
2010 7,083 7,083
2011 10,091 2,523 12,614
2012 30,764 30,764
Total 324,868 2,126 (72,979) 7,918 - - 261,933
Number of (performance) stock options of former Board members outstanding in 2014
year of
granting
January 1,
2014
transfer in
2014
expired in
2014
performance
adjustment at
vesting 2014
exercised
in 2014
share price at
exercise
December
31, 2014
Stock option plans
B.J. Noteboom 2007 23,124 (23,124) -
Performance stock option plans
G.A. Netland 2008 48,000 (48,000) 48.60 -
B.J. Noteboom 2007 12,161 (12,161) -
2010 11,356 11,356
2011 16,178 4,045 20,223
2012 52,002 52,002
B. Wilkinson 2010 7,083 (7,083) 47.02 -
Total 169,904 - (35,285) 4,045 (55,083) 83,581
other notes to the consolidated financial statements

159
annual report 2014 − Randstad Holding nv
Exercise price and expiration date per plan
year of granting exercise price end of exercise period
2008 € 26.39 February 2015
2009 € 9.88 February 2016
2010 € 31.39 February 2017
2011 € 39.16 February 2018
2012 € 28.11 February 2019
The performance stock options 2011 vested in early 2014,based on relative TSR performance of the company over theperiod January 1, 2011 – December 31, 2013. Theperformance resulted in 125% of the options being vested(share price at allocation date: € 46.70), compared to an on-target award of 47,847 options.
The numbers relating to the 2012 plan are the on-targetnumbers.
Number of performance shares outstanding in 2014
year of award
January 1,
2014
number of
shares on
target 2014
transfer in
2014
performance
adjustment at
vesting 2014
vested in
February 2014
December 31,
2014
Performance shares
J.W. van den Broek 2011 5,296 1,324 (6,620) -
2012 11,885 11,885
2013 31,234 31,234
2014 25,537 25,537
R.J. van de Kraats 2011 6,029 1,507 (7,536) -
2012 13,530 13,530
2013 35,555 35,555
2014 21,475 21,475
F. Béharel 2011 7,273 1,818 (9,091) -
2012 19,553 19,553
2013 31,234 31,234
2014 18,864 18,864
L. Galipeau 2011 3,841 960 (4,801) -
2012 11,885 11,885
2013 31,234 31,234
2014 18,864 18,864
L.J.M.V. Lindelauf 2011 5,296 1,324 (6,620) -
2012 11,885 11,885
2013 31,234 31,234
2014 18,864 18,864
C. Heutink 2012 9,700 9,700
2013 7,711 7,711
2014 18,864 18,864
Total 256,964 122,468 17,411 6.933 (34,668) 369,108
Performance shares former Board members
B.J. Noteboom 2011 8,491 2,123 (10,614) -
2012 20,090 20,090
2013 17,598 17,598
Total 46,179 - - 2,123 (10,614) 37,688
The performance shares 2011 vested in early 2014, based onrelative TSR performance of the company over the periodJanuary 1, 2011 – December 31, 2013, resulting in vesting of125% of the on-target award (share price at allocation dateof € 46.70).
Final allocation after vesting of conditional shares awarded in2012, 2013 and 2014 will take place in February 2015, 2016and 2017 respectively.
The performance shares 2011 of Linda Galipeau, theperformance shares 2011 and 2012 of François Béharel, andthe performance shares 2012 and 2013 of Chris Heutinkrelate to the performance share plan of senior management.

160
annual report 2014 − Randstad Holding nv
For the conditions and criteria governing the granting andexercise of stock options and performance shares, see note23.2.
Number of ordinary shares in Randstad Holding nv held by Executive Board membersas at December 31, 2014
locked up
total unrestricted shares number until
J.W. van den Broek 63,552 58,421 3,182 February 2016
1,949 February 2015
R.J. van de Kraats 52,719 46,874 3,626 February 2016
2,219 February 2015
F. Béharel 34,001 34,001 - -
- -
L.Galipeau 7,401 7,401 - -
- -
C. Heutink 118 118 - -
- -
L.J.M.V. Lindelauf 20,036 14,905 3,182 February 2016
1,949 February 2015
24.3 Remuneration of the members of theSupervisory BoardRemuneration of the members of the Supervisory Board isincluded in the income statement.
Supervisory Board remuneration
2014 2013
Current board members
F.W. Fröhlich 134,500 137,500
F. Dorjee 65,250 -
H.M.E.V. Giscard d'Estaing 86,550 88,500
B.C. Hodson 83,800 91,000
G. Kampouri Monnas 86,500 86,500
J. Winter 89,750 90,500
W. Dekker 100,250 84,500
646,600 578,500
Former board members
L.M. van Wijk 27,250 110,500
Total 27,250 110,500
Mr. F. Dorjee was appointed as a member of the SupervisoryBoard as of April 3, 2014.
Mr. J.C.M. Hovers and Mr. W.A.F.G. Vermeend, both formermembers of the Supervisory Board, received as members ofthe Supervisory Board of the Dutch sub-holding RandstadHolding Nederland bv (formerly named Randstad GroepNederland bv) an annual allowance of € 12,000 in 2014 and2013. Mr. H.M.E.V. Giscard d’Estaing holds 450 ordinaryshares in Randstad Holding nv as at December 31, 2014 and2013.
The company has not issued any loans, commitments toprovide loans or guarantees to members of the SupervisoryBoard.
24.4 Other related-party transactionsThe founder of the Randstad Group has an interest in a legalentity, which, based on the ‘Wet financieel toezicht’ (Act onFinancial Supervision), is registered as a shareholder inRandstad Holding nv in the 30% − 40% category. There wereno transactions with this related party, other than the rentalof a ship, Clipper Stad Amsterdam, for promotional activities,at an annual rent of approximately € 1.9 million (2013: € 2.2million).
other notes to the consolidated financial statements

161
annual report 2014 − Randstad Holding nv
25. Employee benefit obligationsdefined benefit pension plans other post-
employment
benefits
other employee
benefits totalobligation plan assets net
Balance at January 1, 2014 124.0 (78.0) 46.0 3.9 31.2 81.1
Reclassifications - (3.4) (3.4) - - (3.4)
Current service costs, total 16.5 - 16.5 0.7 44.4 61.6
Contributions, employees - (5.1) (5.1) - - (5.1)
Contributions, employers - (7.9) (7.9) - - (7.9)
Withdrawals/benefits paid (8.8) 7.6 (1.2) (0.7) (43.7) (45.6)
Total amount in statement of cash flows 7.7 (5.4) 2.3 0.0 0.7 3.0
Actuarial results 34.3 (9.0) 25.3 0.6 - 25.9
Interest due to passage of time 4.1 (2.4) 1.7 0.2 - 1.9
Translation differences 1.0 (0.9) 0.1 0.1 0.1 0.3
Balance at December 31, 2014 171.1 (99.1) 72.0 4.8 32.0 108.8
Non-current 171.1 (99.1) 72.0 4.4 14.6 91.0
Current - - - 0.4 17.4 17.8
Balance at December 31, 2014 171.1 (99.1) 72.0 4.8 32.0 108.8
Balance at January 1, 2013
Non-current 1 96.8 (65.8) 31.0 2.5 9.8 43.3
Current - - - - - -
96.8 (65.8) 31.0 2.5 9.8 43.3
Movements in 2013
Acquisition of subsidiaries 4.0 (3.3) 0.7 0.6 - 1.3
Disposal of subsidiaries - - - - (0.2) (0.2)
Current service costs, total 14.4 - 14.4 0.9 45.0 60.3
Contributions, employees - (4.9) (4.9) - - (4.9)
Contributions, employers - (8.2) (8.2) - - (8.2)
Withdrawals/benefits paid (12.0) 10.1 (1.9) - (23.2) (25.1)
Total amount in statement of cash flows 2.4 (3.0) (0.6) 0.9 21.8 22.1
Actuarial results 19.6 (4.4) 15.2 - - 15.2
Interest due to passage of time 3.2 (2.1) 1.1 - 0.1 1.2
Translation differences (2.0) 0.6 (1.4) (0.1) (0.3) (1.8)
Balance at December 31, 2013 124.0 (78.0) 46.0 3.9 31.2 81.1
Non-current 124.0 (78.0) 46.0 3.8 12.8 62.6
Current - - - 0.1 18.4 18.5
Balance at December 31, 2013 124.0 (78.0) 46.0 3.9 31.2 81.11 The balance as per January 1, 2013 is after the IAS19 amendments in the amount of € 19.2 million on non-current. Before these adjustments, the non-current part amounted
to € 24.1 million.
The Group has various other post-employment benefit plans,which have historically been presented as part of 'otheremployee benefits', due to the relative small size of theseplans. For transparency purposes, the Group decided toseperately present these 'other post-employment benefits' inthe notes to the financial statements 2014, includingcomparative figures 2013.

162
annual report 2014 − Randstad Holding nv
25.1 Pensions
Defined benefit pension plan schemes
2014 2013
Defined benefit plan, corporate
employees in France 36.3 9.8
Defined benefit plan, corporate
employees in the Netherlands - 0.1
Defined benefit plan, corporate
employees in Germany 9.0 10.3
Defined benefit plan, corporate
employees in Belgium 17.2 13.6
Defined benefit plan, staffing and
corporate employees in other European
countries 4.6 7.1
Defined benefit plan, corporate
employees in Japan 4.9 5.1
72.0 46.0
Breakdown of obligations for defined benefitpension plans
2014 2013
Present value of funded obligations 171.1 123.9
Present value of unfunded obligations - 0.1
Total present value of obligations 171.1 124.0
Fair value of plan assets (99.1) (78.0)
Liability in the balance sheet 72.0 46.0
Major categories of plan assetsas a % of fair value of total plan assets
2014 2013
Cash 5.5% 3.5%
Bonds 38.4% 50.9%
Equity instruments 41.5% 39.7%
Real estate 9.7% 4.8%
Other 4.9% 1.1%
100.0% 100.0%
The overall expected rate of return on plan assets isdetermined by considering the expected market returnsavailable on the assets underlying the current investmentpolicy, supported by rates of returns experienced in therespective markets. The actual return on plan assets was€ 11.4 million (2013: € 3.9 million).
Principal actuarial assumptions used for definedbenefit pension plans
2014 2013
Discount rate 0.7%-1.9% 0.9% - 3.5%
Expected salary increases 0.0%-3.6% 0.0% - 4.5%
Expected pension increases 0.0%-1.8% 0.1% - 2.0%
Average life expectancy1
in years
2014 2013
Male 18.1 - 22.5 18.0 - 22.0
Female 22.3 - 26.3 21.5 - 25.81 Average life expectancy of an individual retiring at the age of 65 on the balance
sheet date.
The assumptions regarding future mortality are based onpublished statistics and mortality tables in each territory.
The Group expects the 2015 contributions to be paid fordefined benefit plans to be approximately € 11.5 million(expectation 2014: € 8.0 million), excluding the impact ofacquisitions and disposals.
SensitivityWith respect to the provision for pensions, a change in theinterest rate of 1 percentage point, with all other variablesheld constant, would result in a deviation in the range of € 10to € 15 million (2013: € 7 to € 9 million).
25.2 Employee benefit obligationsFor more information on pensions and other employeebenefit obligations, see note 4.2.2.
other notes to the consolidated financial statements
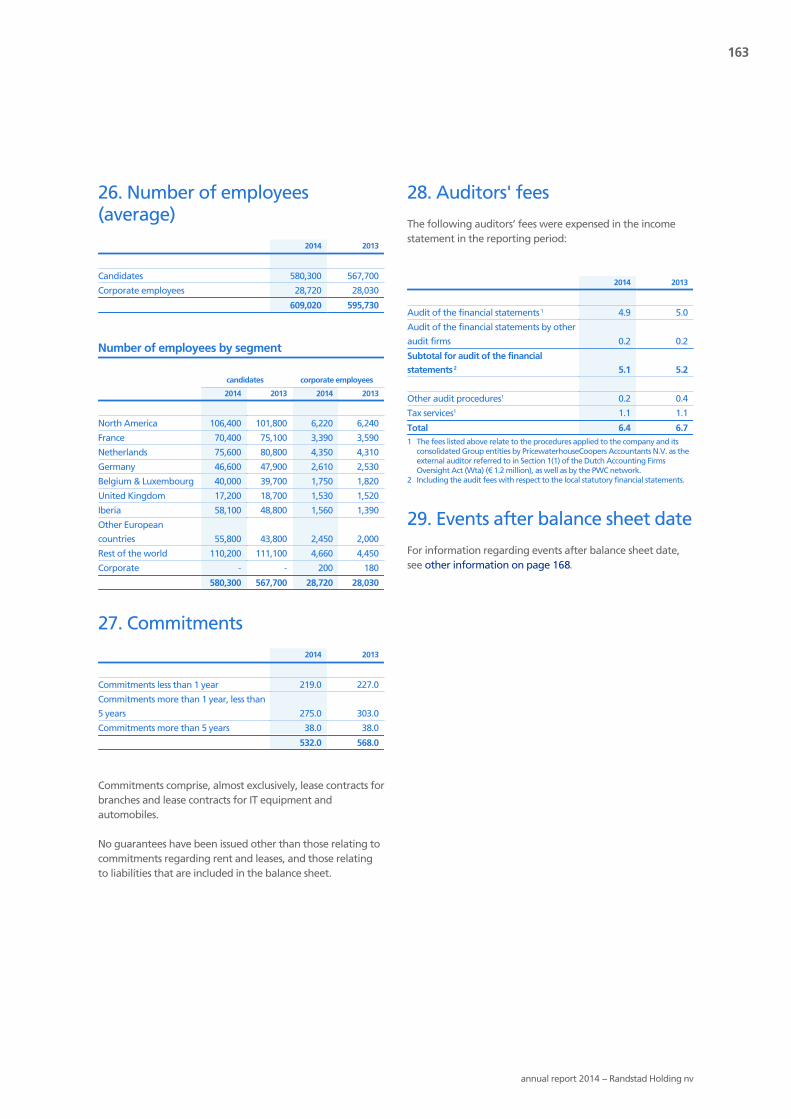
163
annual report 2014 − Randstad Holding nv
26. Number of employees(average)
2014 2013
Candidates 580,300 567,700
Corporate employees 28,720 28,030
609,020 595,730
Number of employees by segment
candidates corporate employees
2014 2013 2014 2013
North America 106,400 101,800 6,220 6,240
France 70,400 75,100 3,390 3,590
Netherlands 75,600 80,800 4,350 4,310
Germany 46,600 47,900 2,610 2,530
Belgium & Luxembourg 40,000 39,700 1,750 1,820
United Kingdom 17,200 18,700 1,530 1,520
Iberia 58,100 48,800 1,560 1,390
Other European
countries 55,800 43,800 2,450 2,000
Rest of the world 110,200 111,100 4,660 4,450
Corporate - - 200 180
580,300 567,700 28,720 28,030
27. Commitments
2014 2013
Commitments less than 1 year 219.0 227.0
Commitments more than 1 year, less than
5 years 275.0 303.0
Commitments more than 5 years 38.0 38.0
532.0 568.0
Commitments comprise, almost exclusively, lease contracts forbranches and lease contracts for IT equipment andautomobiles.
No guarantees have been issued other than those relating tocommitments regarding rent and leases, and those relatingto liabilities that are included in the balance sheet.
28. Auditors' fees
The following auditors’ fees were expensed in the incomestatement in the reporting period:
2014 2013
Audit of the financial statements 1 4.9 5.0
Audit of the financial statements by other
audit firms 0.2 0.2
Subtotal for audit of the financial
statements 2 5.1 5.2
Other audit procedures1 0.2 0.4
Tax services1 1.1 1.1
Total 6.4 6.71 The fees listed above relate to the procedures applied to the company and its
consolidated Group entities by PricewaterhouseCoopers Accountants N.V. as theexternal auditor referred to in Section 1(1) of the Dutch Accounting FirmsOversight Act (Wta) (€ 1.2 million), as well as by the PWC network.
2 Including the audit fees with respect to the local statutory financial statements.
29. Events after balance sheet date
For information regarding events after balance sheet date,see other information on page 168.

164
annual report 2014 − Randstad Holding nv
Income statementin millions of € note 2014 2013
Income from subsidiaries after taxes 3 370.8 273.2
Other income after taxes (30.7) (42.5)
Net income 340.1 230.7
Balance sheet at December 31in millions of € note 2014 2013
ASSETS
Software 2 1.5 -
Intangible assets 1.5 -
Subsidiaries 3 5,743.9 5,544.6
Long-term loans receivable from subsidiaries 4 600.0 -
Financial fixed assets 6,343.9 5,544.6
Non-current assets 6,345.4 5,544.6
Receivables 5 277.1 486.6
Income tax receivable 14.1 6.1
291.2 492.7
Current assets 291.2 492.7
TOTAL ASSETS 6,636.6 6,037.3
EQUITY AND LIABILITIES
Issued capital 25.5 25.3
Share premium 2,261.1 2,258.7
Legal reserves 65.0 9.8
Other reserves 621.4 383.3
Net income for the year 340.1 230.7
Shareholders' equity 6 3,313.1 2,907.8
Non-current liabilities/borrowings 7 915.0 588.7
Borrowings 7 124.5 81.6
Short-term part of non-current borrowings 7 - 99.6
Trade and other payables 8 2,284.0 2,359.6
Current liabilities 2,408.5 2,540.8
TOTAL EQUITY AND LIABILITIES 6,636.6 6,037.3
company financial statements(before profit appropriation for ordinary shares)

165
annual report 2014 − Randstad Holding nv
1. Accounting policies for thecompany financial statements
The company financial statements of Randstad Holding nvare prepared in accordance with the legal requirements ofPart 9, Book 2 of the Dutch Civil Code. The company hasmade use of the possibility based on Article 362, paragraph 8,Part 9, Book 2 of the Dutch Civil Code to prepare companyfinancial statements based on the accounting policies usedfor the consolidated financial statements.
The subsidiaries are presented in accordance with the equitymethod.
A summary of the significant accounting policies and asummary of the critical accounting estimates, assumptionsand judgments are given in note 2 and note 4 respectively ofthe notes to the consolidated financial statements.
With respect to the company income statement of RandstadHolding nv, the company makes use of the exceptionprovided for in Article 402, Part 9, Book 2 of the Dutch CivilCode.
2. Software
Software
2014 2013
Balance at January 1 - -
Additions 1.9 -
Amortization (0.4) -
Balance at December 31 1.5 -
Cost 1.9 -
Accumulated amortization and impairment (0.4) -
Balance at December 31 1.5 -
Additional information with respect to software is given innote 14 of the notes to the consolidated balance sheet.
3. Subsidiaries
2014 2013
Balance at January 1 5,544.6 6,097.0
Capital (reductions)/contributions (316.7) (695.0)
Net income 370.8 273.2
Share-based payments, subsidiaries (1.7) 7.7
IAS 19 effects, subsidiaries (16.1) (23.9)
Translation differences 163.0 (114.4)
Balance at December 31 5,743.9 5,544.6
See note 22.3 of the notes to the consolidated financialstatements for an overview of the major subsidiaries.
4. Long-term loans receivable fromsubsidiaries
A loan to a subsidiary was issued during the year 2014. Thematurity date of this loan is July 2018. The interest rate is6,26% per year.
5. Receivables
2014 2013
Receivables from subsidiaries 274.2 483.9
Other receivables 2.9 2.7
277.1 486.6
6. Shareholders' equity
Additional information is given in the consolidated statementof changes in equity and in note 19 of the notes to theconsolidated financial statements.
6.1 Legal reservesBased on Dutch law, a legal reserve needs to be establishedfor currency translations and capitalized costs ofdevelopment of software. The legal reserve cannot be usedfor dividend distribution and is therefore restricted in usage.
Legal reserves
2014 2013
Translation reserve 55.0 (90.8)
Transfer from other reserves - 90.8
Developed software 10.0 9.8
65.0 9.8
notes to the company financial statements(amounts in millions of €, unless stated otherwise)
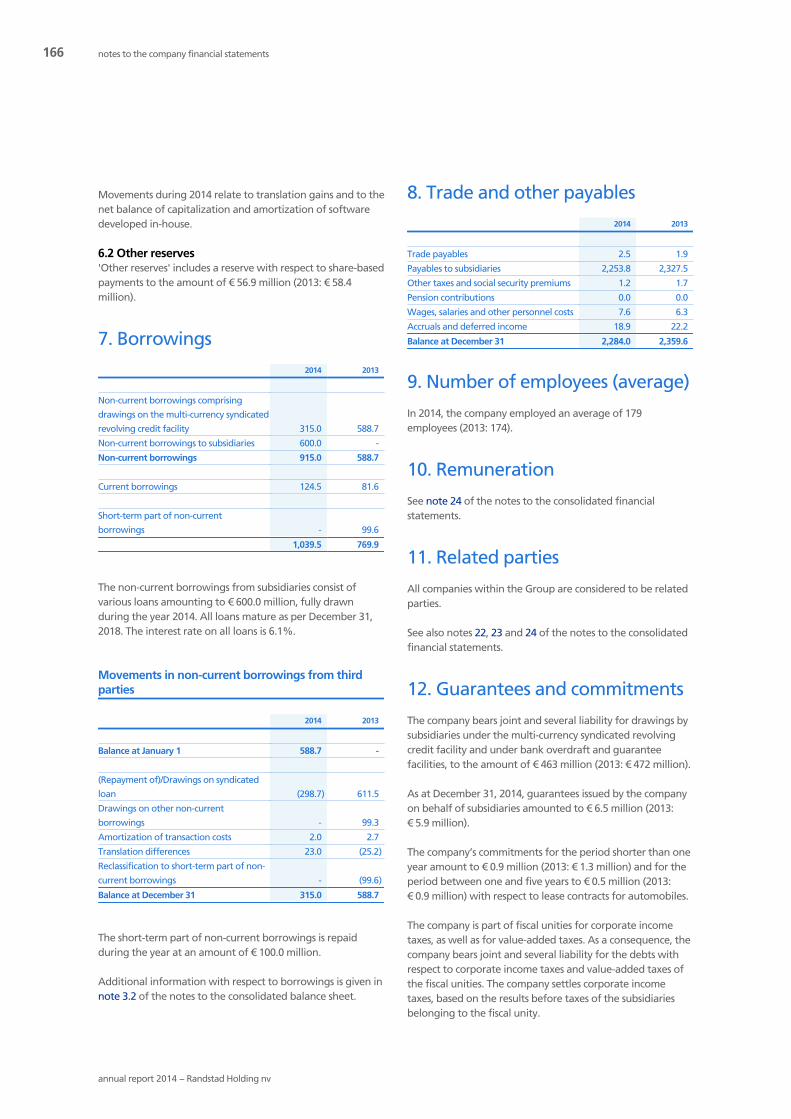
166
annual report 2014 − Randstad Holding nv
Movements during 2014 relate to translation gains and to thenet balance of capitalization and amortization of softwaredeveloped in-house.
6.2 Other reserves'Other reserves' includes a reserve with respect to share-basedpayments to the amount of € 56.9 million (2013: € 58.4million).
7. Borrowings
2014 2013
Non-current borrowings comprising
drawings on the multi-currency syndicated
revolving credit facility 315.0 588.7
Non-current borrowings to subsidiaries 600.0 -
Non-current borrowings 915.0 588.7
Current borrowings 124.5 81.6
Short-term part of non-current
borrowings - 99.6
1,039.5 769.9
The non-current borrowings from subsidiaries consist ofvarious loans amounting to € 600.0 million, fully drawnduring the year 2014. All loans mature as per December 31,2018. The interest rate on all loans is 6.1%.
Movements in non-current borrowings from thirdparties
2014 2013
Balance at January 1 588.7 -
(Repayment of)/Drawings on syndicated
loan (298.7) 611.5
Drawings on other non-current
borrowings - 99.3
Amortization of transaction costs 2.0 2.7
Translation differences 23.0 (25.2)
Reclassification to short-term part of non-
current borrowings - (99.6)
Balance at December 31 315.0 588.7
The short-term part of non-current borrowings is repaidduring the year at an amount of € 100.0 million.
Additional information with respect to borrowings is given innote 3.2 of the notes to the consolidated balance sheet.
8. Trade and other payables
2014 2013
Trade payables 2.5 1.9
Payables to subsidiaries 2,253.8 2,327.5
Other taxes and social security premiums 1.2 1.7
Pension contributions 0.0 0.0
Wages, salaries and other personnel costs 7.6 6.3
Accruals and deferred income 18.9 22.2
Balance at December 31 2,284.0 2,359.6
9. Number of employees (average)
In 2014, the company employed an average of 179employees (2013: 174).
10. Remuneration
See note 24 of the notes to the consolidated financialstatements.
11. Related parties
All companies within the Group are considered to be relatedparties.
See also notes 22, 23 and 24 of the notes to the consolidatedfinancial statements.
12. Guarantees and commitments
The company bears joint and several liability for drawings bysubsidiaries under the multi-currency syndicated revolvingcredit facility and under bank overdraft and guaranteefacilities, to the amount of € 463 million (2013: € 472 million).
As at December 31, 2014, guarantees issued by the companyon behalf of subsidiaries amounted to € 6.5 million (2013:€ 5.9 million).
The company’s commitments for the period shorter than oneyear amount to € 0.9 million (2013: € 1.3 million) and for theperiod between one and five years to € 0.5 million (2013:€ 0.9 million) with respect to lease contracts for automobiles.
The company is part of fiscal unities for corporate incometaxes, as well as for value-added taxes. As a consequence, thecompany bears joint and several liability for the debts withrespect to corporate income taxes and value-added taxes ofthe fiscal unities. The company settles corporate incometaxes, based on the results before taxes of the subsidiariesbelonging to the fiscal unity.
notes to the company financial statements

167
annual report 2014 − Randstad Holding nv
The company has issued joint and several liability statementsin accordance with Section 403, Part 9, Book 2 of the DutchCivil Code for a limited number of its Dutch subsidiarycompanies, mainly serving as sub-holding companies.
13. Auditors' fees
Information with respect to auditors' fees is given in note 28of the notes to the consolidated financial statements.
Diemen, the Netherlands, February 17, 2015
The Executive BoardJacques van den Broek (Chairman)Robert Jan van de Kraats (Vice-Chairman)François BéharelChris HeutinkLinda GalipeauLeo Lindelauf
The Supervisory BoardFritz Fröhlich (Chairman)Wout Dekker (Vice-Chairman)Frank DorjeeHenri Giscard d'EstaingBeverley HodsonGiovanna Kampouri MonnasJaap Winter

168
annual report 2014 − Randstad Holding nv
Events after balance sheet date
Subsequent to the date of the balance sheet, no eventsmaterial to the Group as a whole occurred that requiredisclosure in this note.
Provisions in the Articles ofAssociation concerning profitappropriation
The following is a summary of the most importantstipulations of Article 28 of the Articles of Associationconcerning profit appropriation.
Subsection 1.Any such amounts from the profits as will be fixed by theExecutive Board with the approval of the Supervisory Boardwill be allocated to reserves. As far as possible, from theremaining profits (hereinafter also called the total profits):
a. A dividend will first be distributed to the holders ofpreference A shares on the amount paid on said shares, ofwhich the percentage will be equal to the average of thestatutory interest – in the event of a change in the meantimeto the respective percentages – during the financial year forwhich the distribution is made. This percentage will beincreased by a surcharge fixed by the Executive Board, subjectto the approval of the Supervisory Board, amounting to amaximum of three percent (3%). If, in any year, the profitdistribution on preference A shares cannot be made or canonly be made partially, the overdue dividend on the shareswill be distributed in the subsequent years before any otherdividend distribution is made.
b.1 A dividend will subsequently be distributed per series toholders of preference B shares (equal to the basic percentageto be mentioned under b.2) of the sum of the nominalamount and the amount in share premium which was paidupon the first issue of the shares of said series, whichpercentage will be increased upon said issue by a surcharge,fixed by the Executive Board, subject to approval of theSupervisory Board, of a maximum of one hundred andseventy-five (175) base points. If the share premium reservehas not shown the same balance for the whole financial year,the dividend shall be calculated on the time-weightedaverage balance for that financial year.
b.2 The basic percentage referred to under b.1 will be thearithmetic average of the effective yield on the governmentbonds issued by the Kingdom of the Netherlands with a termor remaining term of six to seven years. For the first time onthe date that the preference B shares (of a series) have beenoutstanding for seven years, and subsequently each period ofseven years after this, the basic percentage of the preferenceB shares (of the series concerned) will be adjusted to the yield
then effective of the state loans referred to in the above-mentioned provisions.
b.3 A dividend will be distributed per series of preference Cshares to holders thereof equal to the basic percentagementioned under b.4 increased with the incrementmentioned under b.4 calculated over the sum of the nominalamount increased by the daily time weighted average overthe relevant financial year of the sum of the share premiumamount and the preference C shares dividend reserve of saidseries. Notwithstanding the preceding sentence the dividendon the preference C shares for the period until theeighteenth day of November two thousand and nineteen willbe five hundred eighty (580) basis points.
b.4 For the first time on the eighteenth day of November twothousand nineteen and subsequently each period of sevenyears after this, the basic percentage of the preference Cshares (of the series concerned) will be adjusted to theaverage effective return on Dutch government bonds with a(remaining) life of seven years.
The increment is to be determined by the Executive Boardwith the approval of the Supervisory Board with a minimumof fifty (50) basis points and a maximum of six hundred andfifty (650) basis points, depending on the marketcircumstances (as a function of, among other things,illiquidity, perpetuality, creditworthiness, subordination andtax treatment) at that time and is subject to the approval ofthe meeting of shareholders of the preference C shares orseries concerned, which approval requires unanimous votesof the holders of the preference C shares present orrepresented at such meeting.
b.5 The Executive Board is authorized, subject to the approvalof the Supervisory Board, to resolve that dividend on thepreference B shares or on the preference C shares of anyseries shall not be distributed but reserved instead in order tobe distributed at a later date following a resolution to thiseffect by the Executive Board, subject to the approval of theSupervisory Board. When it is resolved that dividend on thepreference B shares shall not be distributed but reserved thenit shall also be resolved that dividend on the preference Cshares shall not be distributed but reserved and vice versa.
b.6 If and insofar as the profit is not sufficient to fully makethe distribution referred to hereinbefore on preference Bshares and on preference C shares, the Executive Board mayresolve, subject to the approval of the Supervisory Board, tomake these distributions from the freely distributablereserves, with the exception of the share premium reservesreferred to in Article 4, paragraph 4 under b and c,preference A shares dividend reserves, preference B sharesdividend reserves and preference C shares dividend reserves.
b.7 If and insofar as in any financial year no distribution canbe made, or it is resolved not to make a distribution onpreference B shares, from the profit realized in the
other information

169
annual report 2014 − Randstad Holding nv
subsequent years after allocation to reserves and reduction ofthe amounts accruing to holders of preference A shares inaccordance with the provisions in paragraph 1 subparagrapha of Article 28, following a resolution to that effect by theExecutive Board, subject to the approval of the SupervisoryBoard, such distribution will be made to the holders of saidpreference shares or reserved that the deficit will have beenfully made good before the provisions laid downhereinbefore can be applied.
b.8 If and insofar as in any financial year no distribution canbe made, or it is resolved not to make a distribution onpreference C shares, from the profit realized in thesubsequent years after allocation to reserves and reduction ofthe amounts accruing to holders of preference A shares inaccordance with the provisions in paragraph 1 subparagrapha of Article 28, following a resolution to that effect by theExecutive Board subject to the approval of the SupervisoryBoard, such distribution will be made to the holders of saidpreference shares or reserved as such that the deficit willhave been fully made good before the provisions laid downhereinbefore can be applied. Such deficit will be increasedwith the percentage referred to in paragraph 1 under b.3 orunder b.4 of this Article 28 calculated over the period thedeficit occurred and the moment the deficit has been madegood.
b.9 If preference B shares or preference C shares have beenissued in the course of any financial year, the dividend on theshares concerned for said financial year will be reducedproportionately until the first day of issue.
Subsection 2.The balance then remaining will be available to the GeneralMeeting, subject to the proviso that (i) no distribution will bemade as long as not all the profit distributions on thepreference shares have been made and the reserves aredistributed on the preference shares as referred to in thisArticle 28 and (ii) no further distribution will be made onpreference shares, nor will any amounts be reserved for thispurpose.
Subsection 3.The company may only make distributions to shareholdersfrom the profit susceptible to distribution insofar as itscommon equity exceeds the amount of the paid and claimedpart of the capital increased by the reserves to be kept byvirtue of the law.
Subsection 4.Subject to the approval of the Supervisory Board, theExecutive Board may pass a resolution for distribution of aninterim dividend, to be deducted from the dividend expectedfor the financial year concerned, if the requirement of thepreceding paragraph has been fulfilled, as will be evidentfrom an interim specification of equity and all thedistributions on preference B shares and preference C shareshave been made. Said specification of equity will relate to the
position of the equity at the earliest on the first day of thethird month prior to the month in which the resolution fordistribution will be announced. It will be drawn up with dueobservance of the valuation methods deemed acceptable insociety. The specification of equity will include the amountsto be allocated to the reserves by virtue of the law. It will besigned by the members of the Executive Board. In the eventthat the signature(s) of one or more of them should belacking, the reason thereof will be stated. The company willdeposit the specification of equity at the office of the TradeRegister within eight days after the date on which theresolution for distribution will be announced. A resolution fordistribution of an interim dividend may be limited to adistribution of an interim dividend exclusively to shareholdersof a particular class, without prejudice to the rights ofshareholders of other classes.
Subsection 5.Resolutions for the complete or partial cancellation ofreserves as stated in paragraph 1 of this Article may only bepassed by the General Meeting on a proposal of theExecutive Board approved by the Supervisory Board, with theexception of resolutions in respect of: (i) distributions fromreserved dividend on preference B shares and on preferenceC shares, which shall be resolved upon by the Executive Boardsubject to the approval of the Supervisory Board; and (ii)annual distributions of twenty per cent (20%) of thepreference C shares share premium reserve on preference Cshares, which may be increased with an additional amount atthe expense of the general reserves, such amount as to bedetermined at the time of issuance, which distributions maybe resolved upon by the Executive Board, subject to theapproval of the Supervisory Board, once the preference Cshares (of a series) have been outstanding for four years. If inany financial year a distribution as referred to under (ii) doesnot occur or does not wholly occur, such distribution maytake place in a subsequent year, provided that in anyfinancial year not more than thirty percent (30%) may bedistributed. When it is resolved that distributions shall bemade from the preference B shares dividend reserve then itshall also be resolved that distributions shall be made fromthe preference C shares dividend reserve and vice versa.
Resolutions of the General Meeting for the complete orpartial cancellation of a share premium reserve will requirethe prior approval of the meeting of holders of shares of theclass and series concerned, without prejudice to theprovisions in Article 4, paragraph 5, under b.1. Only holdersof ordinary shares will be entitled to distributions deductedfrom allocations to reserves other than those mentioned inthe preceding sentence. However, without prejudice to theamounts that would accrue to holders of preference B sharesor holders of preference C shares, in accordance with theprovisions in Article 28, paragraph 1b.4. and Article 34,paragraph 4.6., resolutions for the complete or partialcancellation of reserves as stated in paragraph 1 of this Articlemay only be passed by the General Meeting on a proposal ofthe Executive Board approved by the Supervisory Board, with

170
annual report 2014 − Randstad Holding nv
the exception of distributions from reserved dividend onpreference B shares, which shall be resolved upon by theExecutive Board subject to the approval of the SupervisoryBoard. Resolutions of the General Meeting for the completeor partial cancellation of a share premium reserve as stated inArticle 4, paragraph 4.b. will require the prior approval of themeeting of holders of shares of the class and seriesconcerned, without prejudice to the provisions in Article 4,paragraph 5, under b.1. Only holders of ordinary shares willbe entitled to distributions deducted from allocations toreserves other than those mentioned in the precedingsentence. However, without prejudice to the amounts thatwould accrue to holders of preference B shares in accordancewith the provisions in Article 28, paragraph 1b.4. and Article34, paragraph 4.
Article 29 of the Articles of Association concerning paymentin shares or from the reserves states:1. The General Meeting may, at the proposal of the
Executive Board and with the approval of theSupervisory Board, decide to distribute a dividend onordinary shares in whole or in part in shares of thecompany and not in cash.
2. The General Meeting may decide to make a distributionon ordinary shares, in whole or in part, in shares of thecompany and not in cash.
3. The General Meeting may, at the proposal of theExecutive Board and with the approval of theSupervisory Board, decide to make a distribution toholders of ordinary shares from the distributable part ofthe shareholders’ equity. The provisions in paragraph 1of this article will apply mutatis mutandis. Distributionas meant in the present paragraph 3 will only apply ifall the amounts owed by virtue of Article 28, paragraph1 have been paid.
4. In the event of a merger of a Subsidiary of thecompany, the General Meeting will have the authorityto issue shares from one or more of the company’sreserves, which do not need to be retained pursuant tothe law or these Articles of Association.
Proposed profit appropriation
It is proposed that a dividend of € 4.5 million and of € 8.1million be paid on the type-B and type-C preference shares,respectively, and that a dividend of € 232.3 million be paid onthe ordinary shares. It is proposed that € 95.2 million beadded to retained earnings.
other information
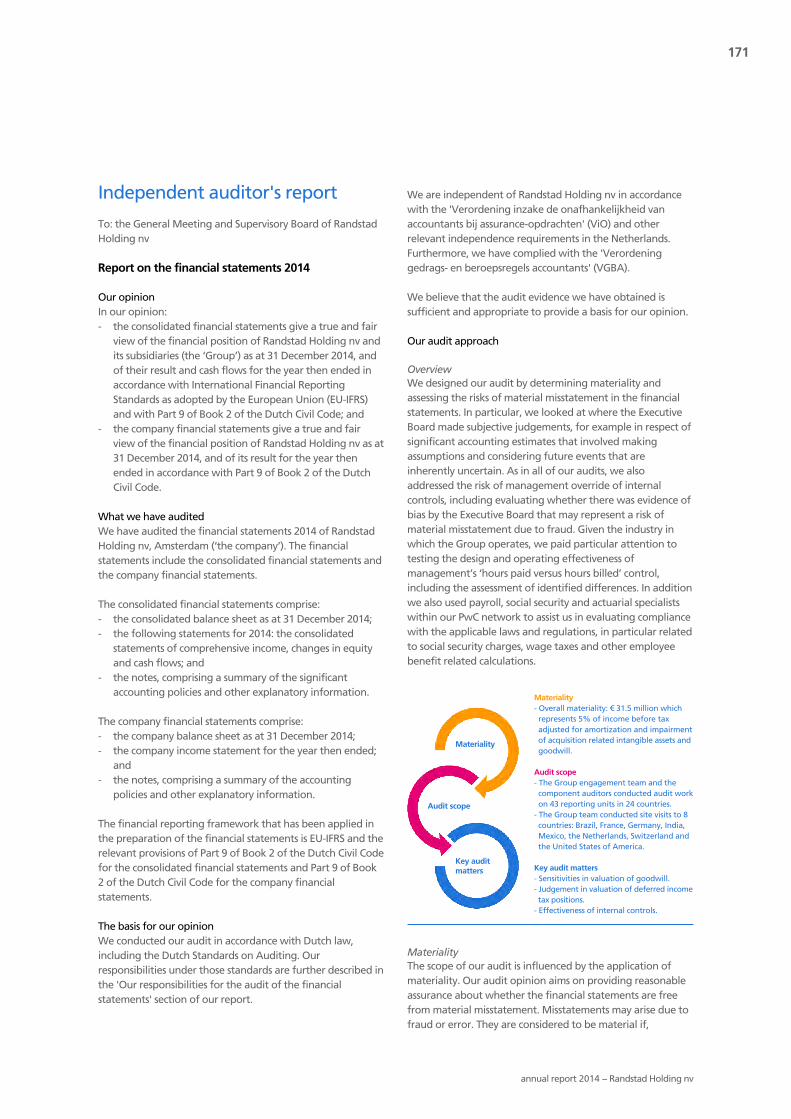
171
annual report 2014 − Randstad Holding nv
Independent auditor's report
To: the General Meeting and Supervisory Board of RandstadHolding nv
Report on the financial statements 2014
Our opinionIn our opinion:- the consolidated financial statements give a true and fair
view of the financial position of Randstad Holding nv andits subsidiaries (the ‘Group’) as at 31 December 2014, andof their result and cash flows for the year then ended inaccordance with International Financial ReportingStandards as adopted by the European Union (EU-IFRS)and with Part 9 of Book 2 of the Dutch Civil Code; and
- the company financial statements give a true and fairview of the financial position of Randstad Holding nv as at31 December 2014, and of its result for the year thenended in accordance with Part 9 of Book 2 of the DutchCivil Code.
What we have auditedWe have audited the financial statements 2014 of RandstadHolding nv, Amsterdam (‘the company’). The financialstatements include the consolidated financial statements andthe company financial statements.
The consolidated financial statements comprise:- the consolidated balance sheet as at 31 December 2014;- the following statements for 2014: the consolidated
statements of comprehensive income, changes in equityand cash flows; and
- the notes, comprising a summary of the significantaccounting policies and other explanatory information.
The company financial statements comprise:- the company balance sheet as at 31 December 2014;- the company income statement for the year then ended;
and- the notes, comprising a summary of the accounting
policies and other explanatory information.
The financial reporting framework that has been applied inthe preparation of the financial statements is EU-IFRS and therelevant provisions of Part 9 of Book 2 of the Dutch Civil Codefor the consolidated financial statements and Part 9 of Book2 of the Dutch Civil Code for the company financialstatements.
The basis for our opinionWe conducted our audit in accordance with Dutch law,including the Dutch Standards on Auditing. Ourresponsibilities under those standards are further described inthe 'Our responsibilities for the audit of the financialstatements' section of our report.
We are independent of Randstad Holding nv in accordancewith the 'Verordening inzake de onafhankelijkheid vanaccountants bij assurance-opdrachten' (ViO) and otherrelevant independence requirements in the Netherlands.Furthermore, we have complied with the 'Verordeninggedrags- en beroepsregels accountants' (VGBA).
We believe that the audit evidence we have obtained issufficient and appropriate to provide a basis for our opinion.
Our audit approach
OverviewWe designed our audit by determining materiality andassessing the risks of material misstatement in the financialstatements. In particular, we looked at where the ExecutiveBoard made subjective judgements, for example in respect ofsignificant accounting estimates that involved makingassumptions and considering future events that areinherently uncertain. As in all of our audits, we alsoaddressed the risk of management override of internalcontrols, including evaluating whether there was evidence ofbias by the Executive Board that may represent a risk ofmaterial misstatement due to fraud. Given the industry inwhich the Group operates, we paid particular attention totesting the design and operating effectiveness ofmanagement’s ‘hours paid versus hours billed’ control,including the assessment of identified differences. In additionwe also used payroll, social security and actuarial specialistswithin our PwC network to assist us in evaluating compliancewith the applicable laws and regulations, in particular relatedto social security charges, wage taxes and other employeebenefit related calculations.
Materiality
Audit scope
Materiality - Overall materiality: € 31.5 million which represents 5% of income before tax adjusted for amortization and impairment of acquisition related intangible assets and goodwill.
Audit scope- The Group engagement team and the component auditors conducted audit work on 43 reporting units in 24 countries. - The Group team conducted site visits to 8 countries: Brazil, France, Germany, India, Mexico, the Netherlands, Switzerland and the United States of America.
Key audit matters- Sensitivities in valuation of goodwill.- Judgement in valuation of deferred income tax positions.- Effectiveness of internal controls.
Key audit matters
MaterialityThe scope of our audit is influenced by the application ofmateriality. Our audit opinion aims on providing reasonableassurance about whether the financial statements are freefrom material misstatement. Misstatements may arise due tofraud or error. They are considered to be material if,

172
annual report 2014 − Randstad Holding nv
individually or in the aggregate, they could reasonably beexpected to influence the economic decisions of users takenon the basis of the financial statements.We set certain quantitative thresholds for materiality. These,together with qualitative considerations, helped us todetermine the nature, timing and extent of our auditprocedures and to evaluate the effect of identifiedmisstatements on our opinion.Based on our professional judgement, we determinedmateriality for the financial statements as a whole as follows:
Overall Group
materiality € 31.5 million (2013: € 25.0 million).
How we
determined it
5% of income before tax adjusted for amortization
and impairment of acquisition related intangible
assets and goodwill.
Rationale for
benchmark
applied
We have applied this benchmark based on our
analysis of the common information needs of users
of the financial statements. On this basis we believe
that adjusted income before tax is an important
metric for the financial performance of the
company.
We also take misstatements and/or possible misstatementsinto account that, in our judgment, are material forqualitative reasons.We agreed with the Audit Committee that we would reportto them misstatements identified during our audit above€ 1.5 million (2013: € 1.3 million) as well as misstatementsbelow that amount that, in our view, warranted reportingfor qualitative reasons.
The scope of our Group auditRandstad Holding nv is head of a group of entities. Thefinancial information of this Group is included in theconsolidated financial statements of Randstad Holding nv.
Considering our ultimate responsibility for the opinion on thecompany’s consolidated financial statements we areresponsible for the direction, supervision and performance ofthe Group audit. In this context, we have determinedtogether with management and the Audit Committee theaudit procedures that needed to be performed at thereporting units by the Group engagement team and thecomponent auditors from (other) PwC network firms to beable to give an opinion on the financial statements as awhole. Determining factors are the geographic structure ofthe Group, the significance and/or risk profile of Groupentities or activities, the accounting processes and controls,and the industry in which the Group operates. On this basis,we selected reporting units for which an audit or review offinancial information or specific balances was considerednecessary.
All component auditors performed an audit of the completefinancial information of their respective reporting unit(s). Forthe holding company, the Group engagement teamperformed the audit work. For the other 42 reporting unitswe used component auditors from (other) PwC network firmsaround the world who are familiar with the local laws andregulations to perform this audit work. In our view, theGroup audit has been designed adequately and has properlytaken into consideration significance and/or riskcharacteristics from the perspective of the financialinformation of Randstad Holding nv.
Where the work was performed by component auditors, wedetermined the level of involvement we needed to have inthe audit work at those functions to be able to concludewhether sufficient appropriate audit evidence had beenobtained as a basis for our opinion on the Group financialstatements as a whole. The Group engagement team visitsthe component auditors on a rotational basis. In the currentyear, the Group audit team visited local management of therespective Randstad operations and the related PwCcomponent auditors in Brazil, France, Germany, India,Mexico, the Netherlands, Switzerland and the United Statesof America. The Group consolidation, financial statementdisclosures and a number of complex items are audited bythe Group engagement team at the head office. Theseinclude, the annual goodwill impairment test and valuationof deferred tax assets.
As agreed with management and the Audit Committee wealso included several smaller reporting units in scope for anaudit of their complete financial information. Thereforetaken together, our audit work performed at individualreporting units and at the head office addressed 98% ofGroup revenues and 97% of absolute Group EBITA (i.e. thesum of the numerical values without regard to whether theywere profits of losses for the relevant reporting units). Thisgave us appropriate audit evidence regarding the financialinformation of the Group as a whole to provide a basis forour opinion on the consolidated financial statements.
The key audit matters from our auditKey audit matters are those matters that, in our professionaljudgment, were of most significance in the audit of thefinancial statements. We have communicated the key auditmatters to the Supervisory Board, but they are not acomprehensive reflection of all matters that were identifiedby our audit and that we discussed. We described the keyaudit matters and included a summary of the auditprocedures we performed on those matters.
The key audit matters were addressed in the context of ouraudit of the financial statements as a whole, and in formingour opinion thereon. We do not provide a separate opinionon these matters.
other information

173
annual report 2014 − Randstad Holding nv
Key audit matter How our audit addressed the matter
Sensitivities in valuation of goodwillAt 31 December 2014 the Group’s goodwill balance isvalued at € 2,375 million. Under EU-IFRS, the companyis required to annually test for impairment of goodwill.This annual impairment test was significant to our auditbecause the assessment process is complex and involvessignificant management judgment and is based onassumptions that are affected by expected futuremarket and economic conditions. Based on the annualgoodwill impairment test the Executive Boardconcluded that no goodwill impairment was needed.The key assumptions and sensitivities are disclosed innote 4.1.2 to the financial statements.
Our audit procedures included, among others an assessment of the mathematical accuracy of thecalculations and a reconciliation to the 2015 forecast as approved by the Executive Board. We used ourvaluation experts to assist us in evaluating the assumptions and methodologies used in the annualimpairment test prepared by the company assisted by their external valuation experts, for which weassessed their respective objectivity and competence. We have challenged management, primarily ontheir assumptions applied where upon which the outcome of the impairment test is most sensitive,including, for example, projected revenue growth, EBITA margin, discount rate and terminal growth.Further, we challenged management by comparing the assumptions to historic performance of thecompany, local economic development and industry outlook, taking into account the sensitivity of thegoodwill balances to changes in the respective assumptions. In particular we assessed the recoverabilityof goodwill balances recorded for the operating segments - Australia (€ 59 million), France (€ 399million) and the United Kingdom (€ 128 million), due to their relative low level of headroom andaccordingly the higher risk of impairment that may be triggered based upon a small change to therespective key assumptions. We also focused on the adequacy of the company’s disclosures concerningthose key assumptions to which the outcome of the impairment test is most sensitive. The company’sdisclosures concerning impairment and goodwill are included in notes 4.1 to the consolidated financialstatements, which specifically explains that Australia is most sensitive to a change in key assumptionsthat could give rise to an impairment of the goodwill balance in the future.
Judgement in valuation of deferred income taxpositionsThe Group’s deferred income tax assets and deferredincome tax liabilities as at 31 December 2014 are valuedat € 534.7 million and € 34.8 million respectively. UnderEU-IFRS, the company is required to periodicallydetermine the valuation of deferred tax positions. Thisarea was significant to our audit because of the relatedcomplexity of the valuation process which involvessignificant management judgment given it is based onassumptions that are affected by expected futuremarket or economic conditions.
Our audit procedures included, among others an assessment of the recoverability of deferred tax assetsin the USA and Luxembourg because of the respective value of these deferred tax assets and for Franceand Brazil due to the level of management judgment involved. We compared the consistency ofmanagement’s profitability forecasts with those included in the annual goodwill impairment test. Wealso assessed local fiscal developments, in particular those related to changes in the statutory income taxrate and of the statutes of limitation since these are key assumptions underlying the valuation of thedeferred tax assets. For example, the recent changes to the statutory rate and the statute of limitation inSpain were adequately taken into consideration in management’s assessment. Further, we used our taxspecialists to assist us in evaluating the assumptions and methodologies used by the company. Inaddition we also focused on the adequacy of the company’s disclosures on deferred income taxpositions and assumptions used. The company’s disclosures concerning income taxes are included innote 4.3 to the consolidated financial statements.
Effectiveness of internal controlsThe effectiveness of the Company’s internal controlswas important to our audit since we had planned toapply an audit approach with reliance on internalcontrols. Overall the internal control environment of theGroup has further improved over the last few years,among others through management’s continuousfocus on improving controls and making the financialreporting more accurate. Examples of management’sinitiatives in this area in 2014 were the update of thekey controls framework and the roll out of the blueprintfor the financial close process. The financial controlsacross the Group are at varying stages of maturity andthere are a large number of different financial systemsin operation. We focused on this area because financialinformation at locations where the control environmentis less mature is inherently more at risk of misstatement.
We assessed the overall control environment of the Group including meetings with members of theExecutive Board, the legal department and the Business Risk & Audit department as well as throughmeetings with management of reporting units around the world, to obtain their feedback on the toneat the top set by management of the Group. All our component auditors performed internal controlstesting including testing of the effectiveness of the ‘hours paid versus hours billed’ control, which giventhe industry in which the Company operates, is one of the most important controls we rely upon in ouraudit. Our audit included varied testing procedures on IT general controls, automated controls andsegregation of duties, for example within the large number of different HR and payroll related systemsand applications used within the Group. We evaluated the progress of the implementation of theupdated key control framework that is designed to improve the robustness of the internal controlenvironment throughout the Group. At a limited number of locations we concluded the controls to beless formal and as a result our audit incorporated a greater emphasis on substantive testing oftransactions, balances and key reconciliations and a greater emphasis on testing of journal entries.
Responsibilities of the Executive Board and the SupervisoryBoardThe Executive Board is responsible for:- the preparation and fair presentation of the financial
statements in accordance with EU-IFRS and with Part 9 ofBook 2 of the Dutch Civil Code, and for the preparation ofthe Executive Board report in accordance with Part 9 ofBook 2 of the Dutch Civil Code, and for
- such internal control as the Executive Board determines isnecessary to enable the preparation of financial
statements that are free from material misstatement,whether due to fraud or error.
As part of the preparation of the financial statements, theExecutive Board is responsible for assessing the company’sability to continue as a going concern. Based on the financialreporting frameworks mentioned, the Executive Boardshould prepare the financial statements using the goingconcern basis of accounting unless the Executive Board eitherintends to liquidate the company or to cease operations, or

174
annual report 2014 − Randstad Holding nv
has no realistic alternative but to do so. The Executive Boardshould disclose events and circumstances that may castsignificant doubt on the company’s ability to continue as agoing concern in the financial statements.
The Supervisory Board is responsible for overseeing thecompany’s financial reporting process.
Our responsibilities for the audit of the financial statementsOur responsibility is to plan and perform an auditengagement to obtain sufficient and appropriate auditevidence to provide a basis for our opinion. Our audit hasbeen performed with a high but not absolute level ofassurance which makes it possible that we did not detect allfrauds or errors.
A more detailed description of our responsibilities is set out inthe appendix to our report.
Report on other legal and regulatory requirements
Our report on the Executive Board report and the otherinformationPursuant to the legal requirements of Part 9 of Book 2 of theDutch Civil Code (concerning our obligation to report aboutthe Executive Board report and other information):
- We have no deficiencies to report as a result of ourexamination whether the Executive Board report, to theextent we can assess, has been prepared in accordancewith Part 9 of Book 2 of this Code, and whether theinformation as required by Part 9 of Book 2 of the DutchCivil Code has been annexed.
- We report that the Executive Board report, to the extentwe can assess, is consistent with the financial statements.
Our appointmentWe were appointed as auditors for the audit of the 2014financial statements of Randstad Holding nv at the annualmeeting held on 28 March 2013 and have been the auditorfor more than 50 years. The most recent rotation of thesigning external auditor on the audit of the financialstatements of Randstad Holding nv was in 2010. Rotation ofthe signing external auditor is one of our safeguards tomaintain our auditor independence.
Amsterdam, 17 February 2015
PricewaterhouseCoopers Accountants N.V.
Original has been signed by M. de Ridder RA
Appendix to our auditor’s report on the financial statements 2014 of Randstad Holding nv
In addition to what is included in our auditor’s report we have further set out in this appendix our responsibilities for the audit of the financial statements andexplained what an audit involves.
The auditor’s responsibilities for the audit of the financial statementsWe have exercised professional judgment and have maintained professional scepticism throughout the audit in accordance with Dutch Standards on Auditing,ethical requirements and independence requirements. Our objectives are to obtain reasonable assurance about whether the financial statements as a whole arefree from material misstatement, whether due to fraud or error. Our audit consisted, among others of:- Identifying and assessing the risks of material misstatement of the financial statements, whether due to fraud or error, designing and performing auditprocedures responsive to those risks, and obtaining audit evidence that is sufficient and appropriate to provide a basis for our opinion. The risk of not detecting amaterial misstatement resulting from fraud is higher than for one resulting from error, as fraud may involve collusion, forgery, intentional omissions,misrepresentations, or the intentional override of internal control.- Obtaining an understanding of internal control relevant to the audit in order to design audit procedures that are appropriate in the circumstances, but not for thepurpose of expressing an opinion on the effectiveness of the company’s internal control.- Evaluating the appropriateness of accounting policies used and the reasonableness of accounting estimates and related disclosures made by the Executive Board.- Concluding on the appropriateness of the Executive Board’s use of the going concern basis of accounting, and based on the audit evidence obtained, concludingwhether a material uncertainty exists related to events and/or conditions that may cast significant doubt on the company’s ability to continue as a going concern. Ifwe conclude that a material uncertainty exists, we are required to draw attention in our auditor’s report to the related disclosures in the financial statements or, ifsuch disclosures are inadequate, to modify our opinion. Our conclusions are based on the audit evidence obtained up to the date of our auditor’s report and aremade in the context of our opinion on the financial statements as a whole. However, future events or conditions may cause the company to cease to continue as agoing concern.- Evaluating the overall presentation, structure and content of the financial statements, including the disclosures, and evaluating whether the financial statementsrepresent the underlying transactions and events in a manner that achieves fair presentation.We communicate with the Supervisory Board regarding, among other matters, the planned scope and timing of the audit and significant audit findings, includingany significant deficiencies in internal control that we identify during our audit. We provide the Supervisory Board with a statement that we have complied withrelevant ethical requirements regarding independence, and to communicate with them all relationships and other matters that may reasonably be thought to bearon our independence, and where applicable, related safeguards. From the matters communicated with the Supervisory Board, we determine those matters thatwere of most significance in the audit of the financial statements of the current period and are therefore the key audit matters. We describe these matters in ourauditor’s report unless law or regulation precludes public disclosure about the matter or when, in extremely rare circumstances, not communicating the matter is inthe public interest.
other information

175
176 Summary quarterly income statement2014
177 Summary quarterly statement of cashflows 2014
178 Ten years of Randstad
180 Glossary
185 VSO partnership at a glance
186 Sustainability and industry membershipsand partnerships
187 Certifications, rankings, and awards
189 Highest Randstad positions in industryassociations
190 Financial calendar
supplementaryinformation

176
annual report 2014 − Randstad Holding nv
amounts in millions of €, unless stated otherwise first quarter second quarter third quarter fourth quarter year 2014
Revenue 3,969.7 4,268.1 4,516.3 4,495.7 17,249.8
Cost of services 3,252.4 3,481.4 3,680.9 3,657.5 14,072.2
Gross profit 717.3 786.7 835.4 838.2 3,177.6
Selling expenses 409.3 421.8 427.0 456.9 1,715.0
Other general and administrative expenses 189.9 191.7 203.9 216.4 801.9
Amortization and impairment of acquisition-related
intangible assets and goodwill, and badwill 36.0 36.0 36.6 36.8 145.4
Total operating expenses 635.2 649.5 667.5 710.1 2,662.3
Operating profit 82.1 137.2 167.9 128.1 515.3
Net finance costs (2.6) (4.0) (11.4) (12.5) (30.5)
Share in profit/(loss) of associates 0.1 0.0 0.1 0.1 0.3
Income before taxes 79.6 133.2 156.6 115.7 485.1
Taxes on income (24.7) (39.1) (43.3) (37.9) (145.0)
Net income 54.9 94.1 113.3 77.8 340.1
Calculation of earnings per ordinary share
Net income for holders of ordinary shares 51.8 90.9 110.2 74.6 327.5
Amortization and impairment of acquisition-related
intangible assets and goodwill, and badwill 36.0 36.0 36.6 36.8 145.4
Integration costs 4.9 0.9 - - 5.8
One-offs - - 5.7 33.8 39.5
Tax effect on amortization and impairment of
acquisition-related intangible assets and goodwill,
integration costs and one-offs (12.9) (11.6) (13.2) (20.6) (58.3)
Net income for holders of ordinary shares before
amortization and impairment of acquisition-related
intangible assets and goodwill, integration costs and
one-offs 79.8 116.2 139.3 124.6 459.9
Basic earnings per share (€) 0.29 0.51 0.61 0.41 1.83
Diluted earnings per share (€) 0.29 0.50 0.61 0.41 1.81
Diluted earnings per share before amortization and
impairment of acquisition-related intangible assets
and goodwill, badwill, integration costs and one-
offs (€) 0.45 0.64 0.77 0.68 2.54
Average number of ordinary shares outstanding (in
millions) 177.2 178.9 179.8 179.8 178.9
Average number of diluted ordinary shares
outstanding (in millions) 179.0 181.1 182.0 182.1 181.2
summary quarterly income statement 2014unaudited

177
annual report 2014 − Randstad Holding nv
amounts in millions of € first quarter second quarter third quarter fourth quarter year 2014
Operating profit 82.1 137.2 167.9 128.1 515.3
Amortization and impairment of acquisition-related
intangible assets and goodwill, and badwill 36.0 36.0 36.6 36.8 145.4
EBITA 118.1 173.2 204.5 164.9 660.7
Depreciation and amortization software 16.5 15.8 15.7 17.2 65.2
EBITDA 134.6 189.0 220.2 182.1 725.9
Provisions and employee benefit obligations (2.0) (6.1) (3.7) 18.4 6.6
Share-based payments 7.6 6.6 6.5 6.7 27.4
Other (22.8) (25.4) (26.3) (20.1) (94.6)
Cash flow from operations before operating
working capital and income taxes 117.4 164.1 196.7 187.1 665.3
Operating working capital (22.0) (186.8) 103.4 114.3 8.9
Income taxes paid (9.8) (43.6) (37.3) (26.0) (116.7)
Net cash flow from operating activities 85.6 (66.3) 262.8 275.4 557.5
Net additions to property, plant, equipment and
software (11.4) (15.9) (13.2) (22.8) (63.3)
Acquisition and disposal of subsidiaries/activities/
buyouts/equity investments (1.5) (0.4) (1.5) (2.3) (5.7)
Other - - - (6.5) (6.5)
Net cash flow from investing activities (12.9) (16.3) (14.7) (31.6) (75.5)
Net cash flow from financing activities (138.2) 83.3 (219.6) (303.9) (578.4)
Net (decrease)/increase in cash, cash equivalents
and current borrowings (65.5) 0.7 28.5 (60.1) (96.4)
Cash, cash equivalents and current borrowings at
beginning of period (17.6) (81.3) (80.4) (56.1) (17.6)
Net movement (65.5) 0.7 28.5 (60.1) (96.4)
Translation gains/(losses) 1.8 0.2 (4.2) 9.2 7.0
Cash, cash equivalents and current borrowings at
end of period (81.3) (80.4) (56.1) (107.0) (107.0)
Free cash flow 74.2 (82.2) 249.6 246.1 487.7
summary quarterly statement of cash flows 2014unaudited

178
annual report 2014 − Randstad Holding nv
amounts in millions of €, unless stated otherwise 2014 2013 2012 2011 2010 2009 2008 2007 2006 2005
Revenue 17,249.8 16,568.3 17,086.8 16,224.9 14,179.3 12,399.9 14,038.4 9,197.0 8,186.1 6,638.5
Growth % 4.1% (3.0)% 5.3% 14.4% 14.4% (11.7)% 52.6% 12.3% 23.3% 15.2%
Gross profit 1 3,177.6 3,010.0 3,107.3 2,953.9 2,669.3 2,421.3 2,972.3 2,029.7 1,730.6 1,405.2
EBITDA1 725.9 597.9 547.7 633.6 598.9 346.0 744.0 605.6 484.2 339.2
EBITA1 660.7 529.7 463.6 553.1 513.6 252.4 644.0 554.4 436.1 299.1
Operating profit/(loss)1 515.3 366.3 127.6 249.7 341.2 93.8 (34.7) 539.6 423.6 290.9
Net income 2 340.1 230.7 36.7 179.0 288.5 67.6 18.4 384.9 360.3 241.9
Growth % 47.4% 528.6% (79.5)% (38.0)% 326.8% 267.4% (95.2)% 6.8% 48.9% 19.3%
Net cash flow from operations 557.5 340.7 528.6 519.5 369.2 742.7 760.1 401.4 409.6 238.2
Free cash flow 487.7 292.9 466.5 435.2 309.3 698.1 672.7 328.4 350.0 180.3
Depreciation, amortization and impairment of property, plant, equipment, and
software 65.2 68.2 84.1 80.5 85.3 93.6 100.0 51.2 48.1 40.1
Additions to property, plant, equipment, and software 65.7 61.5 63.5 85.5 60.7 48.5 92.0 74.4 61.8 62.0
Amortization and impairment of acquisition-related intangible assets and
goodwill, and badwill 145.4 163.4 336.0 303.4 172.4 158.6 678.7 14.8 12.5 8.2
Shareholders' equity 3,313.1 2,907.8 2,724.9 2,898.4 2,850.8 2,491.0 2,416.9 1,021.6 790.3 536.2
(Net debt) / net cash (422.0) (761.0) (1,095.7) (1,302.6) (899.3) (1,014.7) (1,641.0) (144.2) 250.3 206.0
Operating working capital 3 487.7 459.5 527.6 631.6 525.5 395.2 711.5 409.5 354.5 398.7
Average number of staffing employees 580,300 567,700 581,700 576,800 521,300 465,600 555,600 369,200 312,300 254,400
Average number of corporate employees 28,720 28,030 29,320 28,700 25,680 27,640 28,230 17,570 15,380 13,430
Number of branches, year-end 2,816 3,161 3,191 3,566 3,085 3,182 4,146 1,889 1,827 1,708
Number of inhouse locations, year-end 1,595 1,426 1,305 1,145 1,110 947 1,087 997 843 703
Market capitalization, year-end 7,215.2 8,366.0 4,785.3 3,907.9 6,716.9 5,917.6 2,466.9 3,150.7 6,083.4 4,243.9
Number of ordinary shares outstanding (average in millions) 178.9 175.5 171.9 170.8 169.9 169.6 148.6 116.4 115.8 115.4
Closing price (in €) 40.06 47.15 27.81 22.86 39.50 34.90 14.55 27.02 52.40 36.69
Ratios in % of revenue
Gross profit1 18.4% 18.2% 18.2% 18.2% 18.8% 19.5% 21.2% 22.1% 21.1% 21.2%
EBITDA1 4.2% 3.6% 3.2% 3.9% 4.2% 2.8% 5.3% 6.6% 5.9% 5.1%
EBITA1 3.8% 3.2% 2.7% 3.4% 3.6% 2.0% 4.6% 6.0% 5.3% 4.5%
Operating profit1 3.0% 2.2% 0.7% 1.5% 2.4% 0.8% (0.2)% 5.9% 5.2% 4.4%
Net income 1.4% 0.2% 1.1% 2.0% 0.5% 0.1% 4.2% 4.4% 3.6%
Basic earnings per ordinary share (€) 1.83 1.25 0.17 1.00 1.65 0.36 0.07 3.31 3.11 2.10
Diluted earnings per ordinary share (€) 1.81 1.23 0.17 1.00 1.63 0.36 0.07 3.30 3.10 2.09
Diluted earnings per ordinary share before amortization and impairment of
acquisition-related intangible assets and goodwill (€) 2.35 1.87 1.73 2.42 2.32 0.99 4.38 3.38 3.17 2.15
Dividend per ordinary share (€) 1.29 0.95 1.25 1.25 1.18 - - 1.25 1.25 0.84
Payout per ordinary share in % 4 50% 45% 59% 53% 60% - - 38% 40% 40%1 The results as presented in this overview are reported results. As such, they have not been adjusted for one-offs, integration costs or acquisition-related costs.2 For the years 2005, 2006 and 2007, net income includes dividend on preferred shares as financial expenses under net finance costs.3 Operating working capital (as from 2014): trade and other receivables minus the current part of financial fixed assets, deferred receipts from disposed Group companies, and interest receivable minus trade and other payables, excluding interest payable. Comparative figure for 2013 is adjusted; all other years are not adjusted.4 Starting 2008: on basic earnings per ordinary share, adjusted for the net effect of amortization and impairment of acquisition-related intangible assets and goodwill, badwill, integration costs and one-offs.
ten years of Randstad

179
annual report 2014 − Randstad Holding nv
amounts in millions of €, unless stated otherwise 2014 2013 2012 2011 2010 2009 2008 2007 2006 2005
Revenue 17,249.8 16,568.3 17,086.8 16,224.9 14,179.3 12,399.9 14,038.4 9,197.0 8,186.1 6,638.5
Growth % 4.1% (3.0)% 5.3% 14.4% 14.4% (11.7)% 52.6% 12.3% 23.3% 15.2%
Gross profit 1 3,177.6 3,010.0 3,107.3 2,953.9 2,669.3 2,421.3 2,972.3 2,029.7 1,730.6 1,405.2
EBITDA1 725.9 597.9 547.7 633.6 598.9 346.0 744.0 605.6 484.2 339.2
EBITA1 660.7 529.7 463.6 553.1 513.6 252.4 644.0 554.4 436.1 299.1
Operating profit/(loss)1 515.3 366.3 127.6 249.7 341.2 93.8 (34.7) 539.6 423.6 290.9
Net income 2 340.1 230.7 36.7 179.0 288.5 67.6 18.4 384.9 360.3 241.9
Growth % 47.4% 528.6% (79.5)% (38.0)% 326.8% 267.4% (95.2)% 6.8% 48.9% 19.3%
Net cash flow from operations 557.5 340.7 528.6 519.5 369.2 742.7 760.1 401.4 409.6 238.2
Free cash flow 487.7 292.9 466.5 435.2 309.3 698.1 672.7 328.4 350.0 180.3
Depreciation, amortization and impairment of property, plant, equipment, and
software 65.2 68.2 84.1 80.5 85.3 93.6 100.0 51.2 48.1 40.1
Additions to property, plant, equipment, and software 65.7 61.5 63.5 85.5 60.7 48.5 92.0 74.4 61.8 62.0
Amortization and impairment of acquisition-related intangible assets and
goodwill, and badwill 145.4 163.4 336.0 303.4 172.4 158.6 678.7 14.8 12.5 8.2
Shareholders' equity 3,313.1 2,907.8 2,724.9 2,898.4 2,850.8 2,491.0 2,416.9 1,021.6 790.3 536.2
(Net debt) / net cash (422.0) (761.0) (1,095.7) (1,302.6) (899.3) (1,014.7) (1,641.0) (144.2) 250.3 206.0
Operating working capital 3 487.7 459.5 527.6 631.6 525.5 395.2 711.5 409.5 354.5 398.7
Average number of staffing employees 580,300 567,700 581,700 576,800 521,300 465,600 555,600 369,200 312,300 254,400
Average number of corporate employees 28,720 28,030 29,320 28,700 25,680 27,640 28,230 17,570 15,380 13,430
Number of branches, year-end 2,816 3,161 3,191 3,566 3,085 3,182 4,146 1,889 1,827 1,708
Number of inhouse locations, year-end 1,595 1,426 1,305 1,145 1,110 947 1,087 997 843 703
Market capitalization, year-end 7,215.2 8,366.0 4,785.3 3,907.9 6,716.9 5,917.6 2,466.9 3,150.7 6,083.4 4,243.9
Number of ordinary shares outstanding (average in millions) 178.9 175.5 171.9 170.8 169.9 169.6 148.6 116.4 115.8 115.4
Closing price (in €) 40.06 47.15 27.81 22.86 39.50 34.90 14.55 27.02 52.40 36.69
Ratios in % of revenue
Gross profit1 18.4% 18.2% 18.2% 18.2% 18.8% 19.5% 21.2% 22.1% 21.1% 21.2%
EBITDA1 4.2% 3.6% 3.2% 3.9% 4.2% 2.8% 5.3% 6.6% 5.9% 5.1%
EBITA1 3.8% 3.2% 2.7% 3.4% 3.6% 2.0% 4.6% 6.0% 5.3% 4.5%
Operating profit1 3.0% 2.2% 0.7% 1.5% 2.4% 0.8% (0.2)% 5.9% 5.2% 4.4%
Net income 1.4% 0.2% 1.1% 2.0% 0.5% 0.1% 4.2% 4.4% 3.6%
Basic earnings per ordinary share (€) 1.83 1.25 0.17 1.00 1.65 0.36 0.07 3.31 3.11 2.10
Diluted earnings per ordinary share (€) 1.81 1.23 0.17 1.00 1.63 0.36 0.07 3.30 3.10 2.09
Diluted earnings per ordinary share before amortization and impairment of
acquisition-related intangible assets and goodwill (€) 2.35 1.87 1.73 2.42 2.32 0.99 4.38 3.38 3.17 2.15
Dividend per ordinary share (€) 1.29 0.95 1.25 1.25 1.18 - - 1.25 1.25 0.84
Payout per ordinary share in % 4 50% 45% 59% 53% 60% - - 38% 40% 40%1 The results as presented in this overview are reported results. As such, they have not been adjusted for one-offs, integration costs or acquisition-related costs.2 For the years 2005, 2006 and 2007, net income includes dividend on preferred shares as financial expenses under net finance costs.3 Operating working capital (as from 2014): trade and other receivables minus the current part of financial fixed assets, deferred receipts from disposed Group companies, and interest receivable minus trade and other payables, excluding interest payable. Comparative figure for 2013 is adjusted; all other years are not adjusted.4 Starting 2008: on basic earnings per ordinary share, adjusted for the net effect of amortization and impairment of acquisition-related intangible assets and goodwill, badwill, integration costs and one-offs.

180
annual report 2014 − Randstad Holding nv
operational glossary
Activity-based field steeringOur activity-based field steering (ABFS) model is used tomanage and direct performance across our businesses. Byembedding operational performance tools at every level ofour organization, the input-based ABFS model helpsoperational managers to take the right decisions, at the righttime, and translate them into action. Managers receive up-to-date, accurate reports on a weekly basis, covering a range ofkey performance indicators. These data enable us to manageour units and teams in the field by adapting to changing clientand market demands as they occur.
Agency workAgency work is a special form of temporary work, wheregenerally the employer does not hire the employee directly ona contract with a limited duration, but through a privateemployment agency. The employee is mostly hired directly bythe employment agency, mostly on a temporary basis, butsometimes on a permanent contract. During the contractperiod, the employee can be assigned to different usercompanies.
Aging populationThe process in which the working population is shrinking dueto an increasing number of people leaving the labor marketbecause of their age.
Blue-collar workerWithin Staffing, we typically divide the market into blue-collarand white-collar work. The distinguishing factor is differencein skill sets. Blue collar is predominantly geared towardsindustrial and technical job profiles.
BranchesBranches are physical office locations from which ourconsultants operate.
BrandingRandstad is known for building strong brands in the HRservices sector. We believe strongly that branding is not justabout advertising. It is also very much about the philosophyand identity of the company behind it. Behind the Randstadbrand portfolio are a number of sophisticated systems thatenable smart and efficient collaboration between marketingmanagers worldwide, without constraining creativity. Allappearances of the Randstad brand, and the endorsed brandsthat have the same family characteristics, benefit from thesupport of a global, web-based marketing operationsmanagement system, incorporating state-of-the-art digitalasset management. In short, this means that the marketingmaterials that are developed in one country are also availablefor the others, and that various marketing disciplines arespearheaded by experts from different countries, workingtogether on a marketing intranet. Over the past years, the useof this system has lowered the non-visible part of ourmarketing costs considerably, freeing up resources for
investments in a wider reach. Other benefits are increasedspeed to market, enhanced learning, and more time to focuson local actions and adaptations where these make adifference.
CandidateAnother term for the people we help to find work at ourclients (temporary and permanent employees).
CiettOur worldwide industry federation, officially known asInternational Confederation of Private Employment Agencies.
ConceptsOur concepts represent the services we offer to our clients. Westandardize the working processes per concept in order toeasily 'copy and paste' them across our operations around theworld.
ConsultantA consultant is a front-office employee who is located at oneof our outlets, directly meeting the demands of clients andcandidates.
DeregulationDeregulation is a driver of market growth which we try toinfluence as much as possible. While deregulation is a well-known and accepted term, we stress that we are not lookingfor a system without rules. In fact, we strive for the lifting ofunjustified restrictions in overregulated markets on the onehand, and for a fair and effective regulatory environment inmarkets where this has yet to be introduced on the other.
Dividend policyOur dividend policy aims at a payout ratio of 40%−50% ofadjusted earnings per share. We also offer shareholders achoice between shares and cash dividend.
Employees working/candidates/staffing employeesThe number of temporary employees currently working forour clients.
EurociettOur European industry federation, officially known as theEuropean Confederation of Private Employment Agencies.
FTEFull-time equivalent.
Inhouse locationAn Inhouse location is a branch that is located at a client'spremises, where our consultants work on-site dedicated tothat specific client.
Managed Services Provider (MSP)An MSP is a company that takes on primary responsibility formanaging an organization's contingent workforce program.
glossary

181
annual report 2014 − Randstad Holding nv
An MSP may or may not be independent of a staffingsupplier.
OutletsOutlets are branches and Inhouse locations combined.
OutplacementWithin outplacement, we advise and support organizations insituations in which employment contracts need to beterminated because of a strategic decision or for otherreasons. We assist employees in their search for a suitable newjob to make the transition as smooth as possible.
OutsourcingOutsourcing is the sustainable transfer of several clientactivities with output responsibility both in the production/logistics and in the administrative environment.
Penetration rateThe penetration rate is the percentage of temporary workersin the total working population.
Permanent placementApart from attracting candidates for temporary jobs, we alsoservice clients by recruiting candidates for permanentpositions. The process involved is referred to as permanentplacement.
ProfessionalsProfessionals is the service we offer to our clients where weoffer a broad and deep range of candidates with an academicor equivalent degree on a temporary or interim basis, as wellas on a permanent placement basis through Search &Selection.
RecruitmentThe process of hiring candidates for permanent positions.
Recruitment Process Outsourcing (RPO)RPO is the transfer of operational responsibility for one ormore recruiting functions or tasks, including recruitmentadministration, from the client to a service provider.
SecondmentSecondment refers to a Staffing variant in which we are thelegal employer of the temporary worker.
SpecialtiesSpecialties are the specific market segments that dedicatedunits in our Staffing business focus on, such as healthcare,transport, airports, and call centers. The knowledge,experience, and expertise we gain by focusing on thesespecialties translate into added value for clients andcandidates.
Staff turnoverThe percentage of employees leaving our company.
StaffingA service we offer to our clients that involves matchingcandidates with temporary positions at our clients.
Statement of work (SOW)A formal document that captures and defines the workactivities, deliverables, and timelines a vendor must execute inthe performance of specified work for a client. The SOWusually includes detailed requirements and pricing, withstandard regulatory and governance terms and conditions.Themeaning of the SOW concept overlaps with that of a contract,and indeed SOWs are often legally equivalent to contracts.
Temporary workCompared to part-time work, temporary work is an evenmore flexible form of labor. This includes both agency workersand limited-duration contract workers.
Two-tier board structureA governance structure in which the board is split between anExecutive Board and a Supervisory Board. The Executive Boardis responsible for developing, driving, executing, andachieving the approved strategy and strategic targets, whilethe Supervisory Board acts in the interest of the company bysupervising and advising the Executive Board.
Vendor Management SystemA VMS is an internet-enabled contingent worker sourcing andbilling application that enables a company to procure andmanage a wide range of contingent workers and services inaccordance with client business rules.
White-collar workerWithin Staffing, we typically divide the market into blue-collarand white-collar work. The distinguishing factor is differencein skill sets. White collar is predominantly geared towardsadministrative job profiles.
sustainability glossary
European platformA Randstad platform, where representatives from ourEuropean operating companies – both candidates andemployees – and Group management, also in the presence ofthe representative trade union UNI-Europa, discuss relevantpolicy issues and operational developments. This EuropeanPlatform for Social Dialogue meets twice a year.
FatalityAn incident causing the death of a corporate staff member orcandidate at work, in traffic, while working, or whilecommuting.
Fixed-term contractAn employment contract with a particular end date, meaningthat the contract ends after a certain event or on thecompletion of a task.

182
annual report 2014 − Randstad Holding nv
IDPIndividual development plan for employees.
Local sickness rateNumber of working days lost due to sickness within Randstad,based on actual working days. Sickness rate calculation:number of workings days lost / (average FTE x available days).
Lost Time Injury (LTI)Days off work due to work-related injury, based on actualworking days. Injury rate calculation: number of workingsdays lost / (average FTE x available days).
Misconduct Reporting Procedure (MRP)Grievance mechanism; a facility operated by an independentexternal provider, where serious breaches of the Randstadbusiness principles can be reported if the regular avenues areinappropriate.
National sickness rateSickness rate in a country as most recently quoted by localpublic administration or authorities. In some countries,national sickness rates exclude absence due to work-relatedaccidents and/or pregnancy leave; in other countries, theseelements are included.
Permanent or open-term contractAn employment contract for an indefinite period of time; thismetric includes employees with a permanent or open-termjob but without an official contract, which is often the case inthe US, for example.
Senior managementRefers to all levels equal to or above district/regionalmanagement, including account management or commercialmanagement reporting to a regional director or higher.
Sickness absenceIncludes both short-term and long-term sickness. Generallyexcludes absence due to work-related accidents andpregnancy leave, unless local authorities use a differentdefinition.
Training costsTotal expenditure on training of candidates or employees. Inaddition to external costs of training, an estimate is made ofthe salary costs of internal trainers.
Training hoursNumber of hours spent on training of candidates oremployees, both in internal and external programs designedto train people in performing their job responsibilities.Training of employees excludes attendance at the FritsGoldschmeding Academy, which is reported separately.
Turnover rateThe number of employees (FTEs) who left the operatingcompany during the year (either leaving the Randstad Group
or leaving the operating company due to a transfer within theRandstad Group) divided by the average number ofemployees.
VSO volunteers in home country/pro bonoNumber of employees (headcount) working on an indefinitecontract with an operating entity, who have provided supportto VSO (e.g., HR/finance/marketing/legal or strategic advice,fundraisers) in their home country or at a VSO office (e.g., inthe UK or the Netherlands).
VSO volunteers on overseas placementNumber of employees (headcount) working on an indefinitecontract with an operating entity, who have carried out a VSOassignment in Africa or Asia.
Volunteer hoursThe number of hours actually worked by the volunteer(s) or:number of months of placement x 4 weeks x 36 hours; forshort-term volunteers: number of weeks x 36 hours.
Work-related injuriesAccidents during working hours, whether on work premisesor while traveling as part of work duties, causing candidatesor employees to be injured on a scheduled workday or normalwork shift, resulting in days off work.
financial glossary
Amortization (and impairment) of acquisition-relatedintangible assetsUpon acquisitions, Randstad identifies intangible assets, suchas customer relationships, brand names, and candidatedatabases. On average, these acquisition-related intangibleassets are amortized over 1 to 8 years, leading to an annualnon-cash amortization charge, which is included in operatingprofit.
Capital expendituresPart of cash flow from investing activities. Amounts incurredfor investments in property, plant and equipment (e.g.,furniture, computer hardware) and software.
Cash flow from operating activitiesEBITDA adjusted for changes in working capital, taxes onincome, movements in other balance sheet positions, such asprovisions, and certain other non-cash items.
Closing priceShare price of Randstad at the end of a given trading day onEuronext, where an ordinary share of Randstad is listed.
Cost of servicesExpenses which are directly attributable to revenue. Thesecosts mainly include expenses related to staffing employees,such as wages, social security charges, and taxes.
glossary

183
annual report 2014 − Randstad Holding nv
DSO (Days Sales Outstanding, moving average)This DSO KPI represents the number of days before we areable to convert sales into cash (received from our client).In the annual report, we use the moving average of themonthly DSO.
Diluted earnings per ordinary shareDiluted earnings per ordinary share are calculated byadjusting the weighted average number of ordinary sharesoutstanding, assuming conversion of all dilutive potentialordinary shares. The dilutive potential ordinary shares arisefrom various share-based payment arrangements.
Dividend on ordinary sharesPart of net income attributable to holders of ordinary sharesthat will be distributed to holders of ordinary shares.
EBITAEarnings Before Interest, Taxes and Amortization (andimpairment of acquisition-related intangible assets andgoodwill). It is basically the same as operating profit adjustedfor amortization charges on acquisition-related intangibleassets. This is the key performance indicator when looking atthe profitability of our business.
EBITA marginEBITA as percentage of revenue.
EBITDAEarnings Before Interest, Taxes, Amortization andDepreciation. It is basically the same as operating profitadjusted for amortization and impairment charges onacquisition-related intangible assets and goodwill,depreciation, amortization and impairment of property, plantand equipment, and software.
EPS (basic Earnings Per Share)Net income attributable to holders of ordinary shares dividedby the weighted average number of ordinary sharesoutstanding.
Economic value added (EVA)A financial performance method to calculate the trueeconomic profit of a corporation. EVA can be calculated as netoperating profit after taxes minus a charge for theopportunity cost of the capital invested.
Enterprise valueMarket capitalization plus net debt.
Free cash flowFree cash flow is the sum of net cash flow from operatingactivities and investing activities adjusted for cash flows foracquisitions and disposals of subsidiaries and associates.
Gross marginGross profit as percentage of revenue.
Gross profitRevenue minus cost of services.
IFRSInternational Financial Reporting Standards.
Incremental conversion ratioAdditional EBITA in a year, when compared with the previousyear, as a percentage of additional gross profit in a year, whencompared with the previous year, based on organic growth.We aim for an incremental conversion ratio of 50%, if grossprofit growth has been achieved.
Leverage ratioNet debt divided by 12-month EBITDA. We aim at a leverageratio of between 0 and 2x EBITDA, which is important forcontinuity. The syndicated loan documentation allows us aleverage ratio of 3.5x EBITDA.
Liquidity of sharesTotal number of shares traded on the stock echanges.
Market capitalizationTotal shares outstanding multiplied by the share price ofRandstad.
Net debtCash and cash equivalents minus current borrowings and non-current borrowings.
Net finance costsNet finance costs include net interest expenses in relation toour net debt position, foreign currency exchange results, netinterest expenses due to passage of time, and other items.
Net incomeOperating profit minus net finance costs, share of profit (orloss) of associates, and taxes on income.
Net income attributable to holders of ordinary sharesNet income adjusted for the dividend on preferred shares, aswell as for results of non-controlling interests.
Net income attributable to holders of ordinary sharesbefore amortization and impairment of acquisition-related intangible assets and goodwillNet income attributable to holders of ordinary shares,adjusted for amortization and impairment of acquisition-related intangible assets and goodwill after taxes.
Operating expensesOperating expenses comprise personnel and accommodationexpenses in relation to the activities at the outlets and thevarious head offices, IT expenses, other general andadministrative expenses, as well as the amortization andimpairment of acquisition-related intangible assets andgoodwill.

184
annual report 2014 − Randstad Holding nv
Operating expenses marginOperating expenses as a percentage of revenue.
Operating profitGross profit minus operating expenses.
Operating working capitalTrade and other receivables (excluding current part of held-to-maturity investments) minus trade and other payables.The level of working capital is related to the timing of theinvoicing and payrolling processes (weekly or monthly). Inaddition, the payment terms we negotiate with clients andthe effectiveness of our collection processes are equallyimportant.Liabilities, such as social security charges, wage tax, and valueadded tax are settled every month and in some countries on aquarterly basis. Payment terms are often determined by lawand therefore difficult to influence.
Payout per ordinary shareDividend on ordinary shares divided by net income per shareattributable to holders of ordinary shares before amortizationand impairment of acquisition-related intangible assets andgoodwill, and one-offs after taxes.
ProductivityWe measure productivity in three ways: (1) number oftemporary workers per staff member (EW/FTE), (2) gross profitper staff member (GP/FTE), and (3) gross profit in relation topersonnel expenses (GP/PE).
Recovery ratioThe total year-on-year change in operating expenses as apercentage of the decline in gross profit. We aim for arecovery ratio of 50% in case gross profit declines.
RevenueWe distinguish three categories of revenue: (1) revenue fromtemporary billings, (2) permanent placement fees, and (3)other revenue. 'Revenue from temporary billings' includes theamounts received or receivable for the services of temporarystaff, including the salary and salary-related employment costsof those staff. These revenues are generally based on thenumber of hours worked by the temporary staff. 'Revenuefrom permanent placements' includes the fee received orreceivable for the services provided. The fee is generallycalculated as a percentage of the candidate's remunerationpackage. The category 'other revenue' includes revenue forservices such as payrolling, outplacement, outsourcing, MSPservices, consultancy, and related HR offerings.
Revenue categoriesRevenue categories are our service concepts: Staffing(including HR Solutions), Inhouse Services, and Professionals.
Segment reportingSegments are geographical areas and are reported in line withinternal reporting.
Share in profit/loss of associatesAssociates are companies in which Randstad Holding nv hassignificant influence, but no control, over the financial andoperational policies, generally accompanying a shareholdingof between 20% and 50% of the voting rights. The share ofprofit or loss of the associate is presented in this line of theincome statement.
Syndicated credit facilityRandstad has a € 1,800 million multi-currency syndicatedrevolving credit facility at its disposal, which will maturemid-2019. In addition, the Group has at its disposal a standbyfacility with a small group of banks, which offers the Groupthe opportunity to sell accounts receivable of selectedEuropean entities up to a maximum of € 150 million. Randstadis entitled to activate this facility, which matures in February2015, at any time. The loan documentation of all creditfacilities allows a leverage ratio of 3.5 times EBITDA, althoughwe aim for a leverage ratio of between 0 and 2, which isimportant for continuity. In certain cases, we are allowed toreport a maximum leverage ratio of 4.25x EBITDA for alimited amount of time.
Taxes on incomeTaxes on income comprise current taxes and the realization ofdeferred taxes. Current taxes on income are the sum of taxeslevied on the results before taxes in the countries in whichthose results were generated, based on local tax regulationsand against tax rates of the applicable year. Tax-exemptincome and expenses not deductible for tax purposes aretaken into account in calculating taxes on income.
Velocity of sharesVelocity represents the average holding period of a share inRandstad. It is measured as the total number of shares tradeddivided by the average number of shares outstanding.
glossary

185
annual report 2014 − Randstad Holding nv
StartAt the center of our partnership, Randstadhelps to strengthen VSO by providingexpertise and increasing volunteer numbers.
Focused supportRandstad employees provide support in manyareas: HR, marketing, recruitment, finance, IT,fundraising, and organizational development.
VolunteersOver 150 employees have volunteered indisadvantaged communities in Africa andAsia.
CountriesWe support VSO projects in our home marketspro bono, while overseas volunteers go tocountries like Tanzania and Bangladesh.
ImpactTogether, volunteers and their counterpartscreate lasting change in communities wherehelp is needed most.
10th anniversaryWe celebrated the 10th anniversary of ourpartnership by increased internal and externalcommunications and a field visit to Nepal.
VSO partnership at a glance

186
annual report 2014 − Randstad Holding nv
Ciett
Through our membership in Ciett, the International
Confederation of Private Employment Agencies, we strive
for well-regulated working conditions for our corporate
employees and candidates.
Eurociett
Through our membership in Eurociett,
European Confederation of Private
Employment Agencies, we strive for well-
regulated working conditions for our
corporate employees and candidates.
CSR Europe
CSR Europe is a leading European business network for
corporate social responsibility, with more than 60 leading
multinational corporations as members. Randstad is
involved in CSR Europe projects in the areas of skills for
employability, mainstreaming diversity and well-being in
the workplace.
Global Reporting Initiative
Randstad is a registered organizational
stakeholder of the Global Reporting Initiative
(GRI) and supports its mission to make
sustainability reporting standard practice; one
which helps to promote and manage change
towards a sustainable global economy.
VSO
Our partnership with Voluntary Service
Overseas combines the strength of two
organizations driven by a common aim: to
help alleviate poverty across the globe by
sharing skills and expertise with local
communities.
VSO focuses on sustainable development and places volunteers through
partners in developing countries. Randstad supports VSO by providing
strategic support, expertise, funding, and most of all, through our
employees who can volunteer themselves.
FTSE4Good Index
Randstad Holding is a constituent company in the
FTSE4Good Index Series. FTSE4Good identifies companies
that meet globally recognized standards of responsible
business practice.
UN Global Compact
The United Nations Global Compact is a voluntary
business initiative for companies committed to aligning
their activities with ten universally accepted principles in
the areas of human rights, labor, environment, and
anticorruption. As signatories of the Compact since 2004,
it is Randstad's firm belief that responsible business
promotes the development of markets, commerce,
technology, and finance for the benefit of economies
and societies everywhere.
International Integrated Reporting Council
Randstad has been a member of the pilot initiative from
the IIRC that resulted in the release of a global Integrated
Reporting Framework in December 2013. An integrated
report is a concise communication about how an
organization's strategy, governance, performance, and
prospects, in the context of its external environment, lead
to the creation of value in the short, medium and long
term.
INSEAD
Randstad chairs and co-funds the alumni
sustainability executive roundtables of the
INSEAD Social Innovation Centre, where
business leaders share experiences on
advancing the sustainability agenda.
Global Apprenticeships Network
The GAN - established in 2013 - aims to
address the urgent issue of youth
unemployment and the need for businesses to
ensure skills for the future.
The Network has been developed jointly by the International
Organisation of Employers (IOE) and the Business and Industry Advisory
Committee to the OECD (BIAC), with the support of the International
Labour Organization (ILO).
International Organisation of Employers
The IOE is a private sector network of 150 business and
employer federations in 143 countries. The IOE guides its
members in matters of international labor standards,
business and human rights, CSR, occupational health and
safety, and international industrial relations.
Brussels European Employee Relations Group
BEERG is an information-sharing and networking group
of companies headquartered in the EU, the US, India, and
Japan, where labor and employment relations
professionals discuss topics of mutual concern.
Businesseurope AS Group
On behalf of its member federations,
BUSINESSEUROPE works to ensure that the
voice of business is heard in European policy-
making, and also represents its members in
the international political arena.
VNO-NCW
VNO-NCW, the Confederation of Netherlands
Industry and Employers, represents the
common interests of Dutch business, both at
home and abroad. They cover almost all
sectors of the economy, including more than
80% of all medium-sized companies in the
Netherlands and nearly all of the larger,
corporate institutions.
sustainability and industry memberships andpartnerships

187
annual report 2014 − Randstad Holding nv
Certifications
- Randstad Belgium and Randstad Italy hold the SocialAccountability SA 8000 accreditation.
- Tempo-Team, Randstad Netherlands, Randstad Sweden,Randstad Brazil, Randstad Professionals Germany, andYacht hold the ISO 14001 environmental managementcertification.
- Randstad Argentina holds a Sustainable CommitmentCertificate.
- Randstad Belgium is certified VCU and Qfor, where VCUstands for ‘Health and Safety’ and Qfor for ‘Qualitytraining and consulting organizations’.
- Randstad France, Germany including Professionals andTempo-Team, Belgium, Spain, Italy, Hungary, India, Japan,Brazil, Australia, Argentina, Poland, UK Care, UK Studentand Worker Support, Chile and the companies in theNetherlands are certified under the ISO 9001 label forquality management.
- Randstad Belgium, Randstad France, Randstad Italy andRandstad Holding continue to be certified with the GenderEquality European Standard (GEES) for their professionalgender diversity practices.
- Randstad Mexico has been certified under the GenderEquality Model (MEG) of the Women's National Institute,for fostering a healthy work environment, free of any typeof discrimination.
- Randstad Professionals Germany holds the BildungsträgerAZAV certificate.
- In 2011, Randstad Australia achieved AS/NZS 4801accreditation and were the first labor hire company toachieve Self Insurance status in 1999.
- Randstad Netherlands has published a self-declarationindicating that it will strictly adhere to the ISO 26000guideline. The declaration was made according to theofficial Dutch guideline NPR 9026, as established by NEN(the Dutch Standardization Institute).
- The labor management system 'AMS' of RandstadGermany was certified for systematic and effectiveindustrial protection of the employer's liability. Thiscertification includes the standards NFL/ILO-OSH 2001 andOHSAS 1800:2007.
- Randstad Brazil holds the OHSAS 18001 certificate(Occupation Health and Safety Assessment Series forhealth and safety management system).
- Randstad Spain holds the Youth Employment Certificate.- Diemermere Beheer BV, our facilities company in the
Netherlands, holds ISO 14001 environmental managementand ISO 50001 energy management certification.
- Randstad Argentina acquired the CMMI certificate in 2013.- Randstad France holds the Label Diversité.- In the field of data protection, Randstad Germany is
certified by the TÜV Rheinland Industrie Service GmbH.- Randstad France and Group Randstad France hold the
Label 'égalité professionnelle femmes/hommes'.
Rankings and awards
- Randstad Holding received confirmation of its continuedmembership of the FTSE4Good Index.
- In January 2014, Randstad Holding was elected the overallwinner of the Dutch IR Awards and won the Award forbest AEX company, while its director Investor Relationswon the Award for best AEX professional. The jury reporthighlights Randstad's transparency and clearcommunication, both from management and the IR team.
- Randstad Holding was nominated for the Building PublicTrust award 2014, in the category International Award forExcellence in Integrated Reporting, of the IIRC(International Integrated Reporting Council).
- Randstad Spain received the 'Telefónica Ability Award',which is a recognition for businesses that contribute to theintegration of disabled employees in the workforce.
- Randstad Japan was number 1 in the category of 'Wish toWork through this Agency' in the 'Temporary StaffingSatisfaction Survey' done by HR Business Magazine (JinzaiBusiness).
- GULP Information Services GmbH holds the seal ofapproval 'Arbeits- und Gesundheitsschütz nach LS-Standard' from TÜV SÜD Life Service GmbH as one of onlyfour enterprises in Bavaria.
- Randstad Belgium received the Volvo Quality throughExcellence award.
- In the Polish ‘Business Journal Book of Lists 2014’ RandstadPoland ranks as the No. 1 temporary work agency.
- Randstad Hungary is the No. 1 recruitment companyaccording to ‘Business Journal Book of Lists’, the mostprestigious English periodical publication in Budapest.
- Randstad Spain has been awarded 27th place in Spain’s‘Top 100 Best Companies To Work For’ and is the highestranking company among all HR services providers.
- Randstad Greece and Randstad Canada were awarded oneof the best workplaces by the Great Place to WorkInstitute.
- Randstad France is among the 2% best staffing companiesin labor practices out of more than 150 staffing companiesassessed by Ecovadis, a platform to monitor sustainabilityperformance in the supply chain.
- In 2014, Randstad France improved its grade from 73 to89/100 in CSR performance in an assessment ofemployment agencies monitored by Acesia, ranking 5thamong the 54 auto-assessed companies, and 2nd amongthe 7 companies whose assessment was controlled byAcesia.
- Randstad Argentina was recognized in 2014 by HuéspedFoundation with the 'Golden Stamp' for its successfulpractices regarding campaigns on labor inclusion of peoplewith HIV/AIDS.
- Randstad Canada received an ACE Award from theCanadian Public Relations Society for its successful publicrelations campaigns Randstad Award and Women ShapingBusiness.
certifications, rankings, and awardsFor a complete overview of certifications, rankings, and awards, see our online annual report.

188
annual report 2014 − Randstad Holding nv
Rankings and awards
- Randstad Canada was recognized and awarded forexcellence in communications throughout the GreaterToronto Area by the International Association of BusinessCommunicators.
- Several Randstad US companies are ranked in the LargestStaffing Firms by Staffing Industry Analysts. Professionals isat the second place, Technologies at the third, Pharma atthe sixth and Engineering at the eighteenth.
- Randstad Portugal was distinguished as the best HRsupplier 2014 in the category of 'Agency work andoutsourcing'.
- Randstad Holding received from our clientJohnson&Johnson a certificate of recognition for ourefforts towards their Healthy Future 2015 goals in theareas of environmental, social and economic sustainability.
- GULP Information Services GmbH has the followingrankings and awards: Junge Karriere Fair Company,Kununu Top Company and Open Company, listed asrecommended in FOCUS Top Personal Dienstleister 2014,BMEnet Gütesiegel (seal of approval), ConnexioPräqualifikation which is a standard in quality andcorporate social responsibility.
- Randstad US Healthcare, Professionals, Technologies andEngineering were all named 2014 Best of Staffing byInavero.
- Randstad UK Student and Worker Support has anaccreditation called 'Proud to be Clear Assured' whichrecognises an accessible recruitment process for peoplewith disabilities.
- Randstad Netherlands was awarded a San Accent Award in2014 for their first 'Youth Looking for Work' program,executed in 2013, dealing with youth unemployment. Thesame initiative also received a 'Golden Magnet Award'during the employer branding experience 2014.
- Randstad Canada was awarded the Health & Safety Awardfrom ACSESS for outstanding performance in workplacehealth and safety.
- Randstad Contact Centres Portugal won a Golden Medal inthe category 'Best Operational Manager' and two SilverMedals in the categories 'Best Sales Manager' and 'BestRecruitment Campaign' in the Contact Center WorldAwards 2014. And it was distinguished in the categories'Social responsibility in the Contact Centre' and 'Youngtalent'.
- Randstad Brazil received the award for best supplier fromour client Petrobras-RN.
- Randstad US Technologies was named 2014 TechServeAlliance Excellence Winner by TechServe Alliance. Thisinaugural award recognizes IT and engineering staffingand solutions firms that have demonstrated outstandingperformance, team productivity, and dedication tocontinuous improvement.
certifications, rankings, and awards

189
annual report 2014 − Randstad Holding nv
country federation name president vice-president board member member
ArgentinaFAETT x x
CASEEC 1 x
Austria VZA x
Australia RCSA x x
Belgium Federgon x
Brazil Sindeprestem (Sao Paolo) x
Canada
ACSESS
NACCB
x
x
Chile AGEST x
ChinaShanghai HR Consulting Association1 x
CAFTS (Bejing) x
Czech Republic APPS x
Denmark Vikarbureaernes Brancheforening x
France PRISME x
Germany BAP x
Greece ENIDEA x
Hungary SZTMSZ x
India ISF x
Italy Assolavoro x
Japan
JASSA x
JSLA1 x
JHR (umbrella organization)1 x
Luxembourg Fedil/F.E.S. (Fedil Employment Services) x
Mexico AMECH x
Netherlands ABU x
New Zealand RCSA x
Poland Polski HR Forum x
Singapore Singapore Professional Staffing Organisation x
Portugal APESPE x
Slovakia APAS x
Spain Asempleo x
Sweden Bemanningsforetagen x
Switzerland Swiss Staffing x
Turkey OIBD x
UK REC x
Uruguay CUDESP x
US ASA x
Europe Eurociett x
International Ciett x1 Non-Ciett member.
highest Randstad positions in industry associations

190
annual report 2014 − Randstad Holding nv
April 2, 2015Annual General Meeting of Shareholders
April 8, 2015Ex-dividend
April 30, 2015Dividend available for payment
April 30, 2015Publication of Q1 2015 results (pre-market)Analyst conference call Q1 2015 results
July 30, 2015Publication of Q2 2015 results (pre-market)Press conference and analyst presentation Q2 2015 results
October 29, 2015Publication of Q3 2015 results (pre-market)Analyst conference call Q3 2015 results
February 18, 2016Publication of Q4 2015 and annual results 2015 (pre-market)Press conference and analyst presentation annual results 2015
March 31, 2016Annual General Meeting of Shareholders
financial calendar

design conceptDr. Kominski
graphsBAS! Reclame & Vormgeving
photography of boards and CEOSander Stoepker
other photographyGert IjszengaSander StoepkerWilliams Martini RacingRandstad VSO volunteersRandstad photo database
text and editingRandstad Holding nvBaxter Communications BV
project managementCarola La Grouw/Report Company
This annual report is powered by Tangelo Software.
This annual report is available online at www.randstad.com/annualreport
Uitzendbureau Amstelveen founded in the Netherlands
Creation of the Randstad logo and visual identity
Randstad now has 32 branches in four countries
Company name changes to: Randstad Holding nv
Randstad celebrates its silver jubilee; 257 branches in four countries
Randstad shares are listed on the Amsterdam Stock Exchange
Randstad deploys 16,000 staffing employees at the Olympic Games in Atlanta
Randstad and Vedior become one. Randstad becomes the second-largest HR services provider in the world
Acquisition of SFN Group
International network doubled through acquisitions in the US, Germany and Spain
The company takes a new name: Randstad Uitzendbureau
Introduction of the core values
Staffing agency Tempo-Team acquired
Establishment of Randstad Option Fund for corporate employees
Randstad starts activities in the US
Randstad founder and president and CEO Frits Goldschmeding retires
Randstad, now present in 20 countries, is promoted to the AEX index
Acquisition of FujiStaff Japan
1960
1964
1977
1983
1988
1993
1998
1978
1985
1990
1996
1998/1999
1967
1970
2007
2008
2010
2011
2013
Acquisition of part of the European Staffing activities of USG People
Jacques van den Broek appointed CEO
2014

AddressDiemermere 251112 TC DiemenThe Netherlands
Mailing addressPO Box 126001100 AP Amsterdam-ZuidoostThe Netherlandswww.randstad.com
Phone +31 (0)20 569 59 11
E-mailcorporate.communications@[email protected]
If you have any comments on or questions about this annual report, please do not hesitate to contact us by email.