Embed Size (px)
Citation preview
How hospitals and health systems fit into the pay for performance puzzle
Richard A. NorlingPresident and CEOPremier Inc.

Topics
• Overview of Premier/CMS P4P project• How it works• Results through first two years
• Potential national impact of P4P• National outlook for P4P
• Funding scenarios• Focus on healthcare-associated infections• Political landscape
• Recommendations for future P4P efforts

Bringing nationwide knowledge to benefit local healthcare
Local healthcare
Owners
Affiliates
• Owned by 200+ not-for-profit hospitals and health systems• Serving more than 1,700 hospitals and 42,000 other providers • Sharing of clinical, labor and supply chain data for benchmarking• $27 billion in group purchasing volume – largest in U.S.• Highest ethical standards - leading Code of Conduct• Diversity, safety and environmental programs• Recipient of 2006 Malcolm Baldrige National Quality Award
• Owned by 200+ not-for-profit hospitals and health systems• Serving more than 1,700 hospitals and 42,000 other providers • Sharing of clinical, labor and supply chain data for benchmarking• $27 billion in group purchasing volume – largest in U.S.• Highest ethical standards - leading Code of Conduct• Diversity, safety and environmental programs• Recipient of 2006 Malcolm Baldrige National Quality Award
National alliance
Shared goals:
Better outcomes
Safely reducing cost
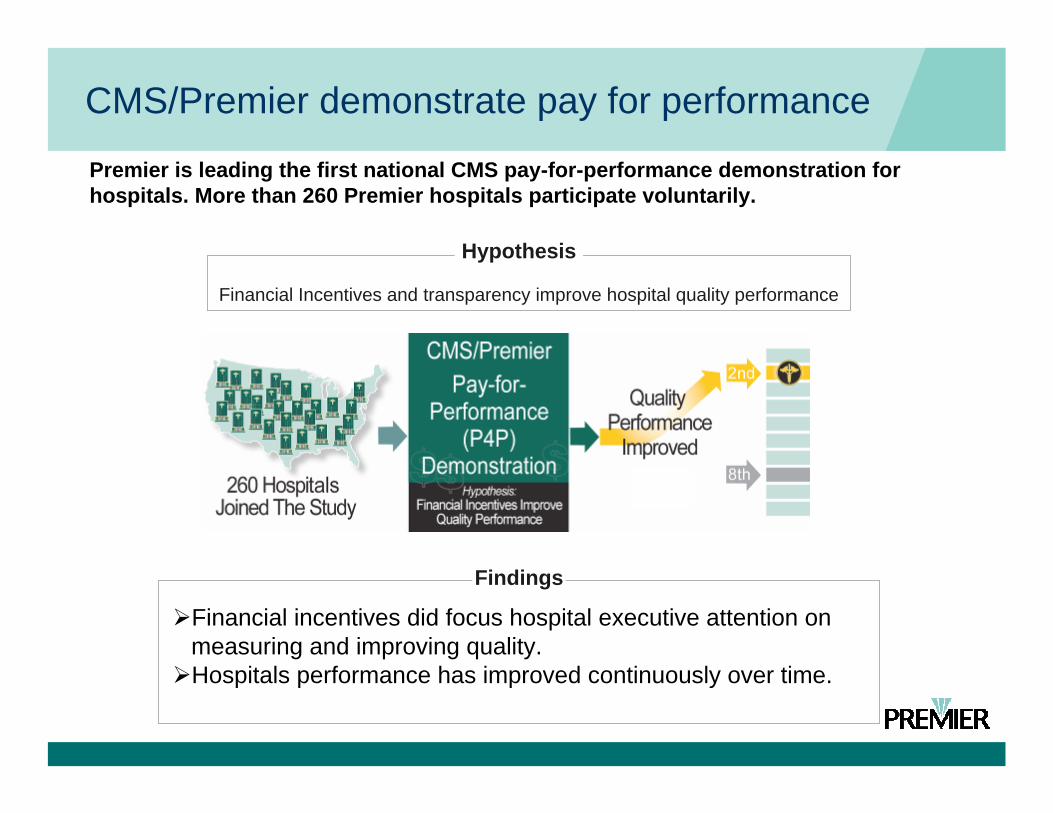
CMS/Premier demonstrate pay for performance
Premier is leading the first national CMS pay-for-performance demonstration for hospitals. More than 260 Premier hospitals participate voluntarily.
Financial incentives did focus hospital executive attention on measuring and improving quality. Hospitals performance has improved continuously over time.
Financial Incentives and transparency improve hospital quality performance
Findings
Hypothesis

CMS/Premier HQI demonstration project
• A three-year effort linking payment with quality measures (launched October, 2003)
• Top performers identified in five clinical areas• Acute Myocardial Infarction• Congestive Heart Failure• Coronary Artery Bypass Graft• Hip and Knee Replacement• Community Acquired Pneumonia
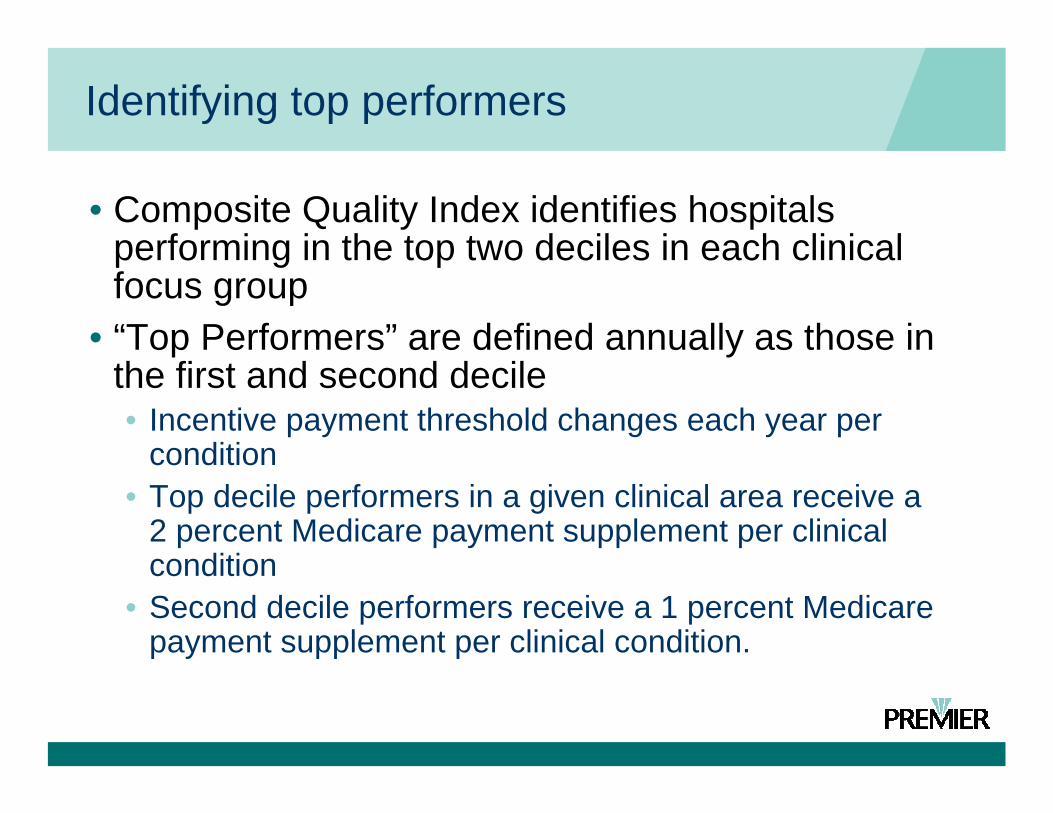
Identifying top performers
• Composite Quality Index identifies hospitals performing in the top two deciles in each clinical focus group
• “Top Performers” are defined annually as those in the first and second decile• Incentive payment threshold changes each year per
condition• Top decile performers in a given clinical area receive a
2 percent Medicare payment supplement per clinical condition
• Second decile performers receive a 1 percent Medicare payment supplement per clinical condition.

HQID official results: Years 1 and 2
• 11.8 percent improvement in composite quality score • Over first two years of project• 6.7 percent improvement in year 2 alone
• 1,284 lives saved due to improvements in the mortality rate for AMI patients• Over first two years of project
• $17.55 million in Medicare incentive payments• Year 1: $8.85 million
• 123 top-performing hospitals• Year 2: $8.7 million
• 115 top-performing hospitals
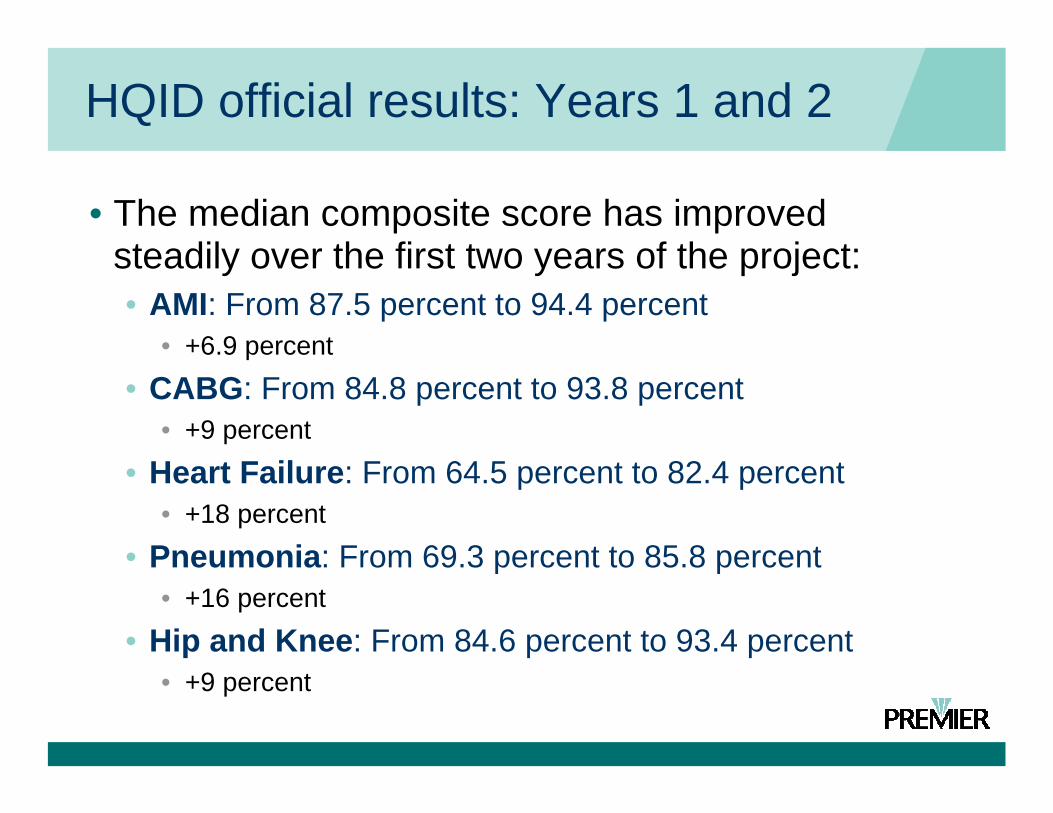
HQID official results: Years 1 and 2
• The median composite score has improved steadily over the first two years of the project: • AMI: From 87.5 percent to 94.4 percent
• +6.9 percent
• CABG: From 84.8 percent to 93.8 percent• +9 percent
• Heart Failure: From 64.5 percent to 82.4 percent• +18 percent
• Pneumonia: From 69.3 percent to 85.8 percent• +16 percent
• Hip and Knee: From 84.6 percent to 93.4 percent• +9 percent

Bottom line: Better care delivery
• Patients have received approximately 150,000 additional recommended evidence-based clinical quality measures• Over first two years of HQID project
“The main point is that the majority of hospitals in the HQID project, even those on the lower end of the scale, improved their quality of care across the board with respect to reliable use of scientifically based practices.”
Donald M. Berwick, MD, MPP, FRCP, president and CEO at the Institute for Healthcare Improvement (IHI).

Improvements continue beyond Year 2CMS/Premier HQID Project Participants Composite Quality Score:
Trend of Quarterly Median (5th Decile) by Clinical Focus AreaOctober 1, 2003 - June 30, 2006 (Year 1 and Year 2 Final Data, and Yr 3 YTD Preliminary)
70.0
0%
64.1
0%
73.1
3%
68.1
1%
86.8
7%
93.7
0%
82.4
9%
78.2
2%
91.6
3%93.3
6%
94.8
9%
82.7
2%
81.5
7%
93.4
0%
95.0
8%
96.1
6%
84.8
1%
82.9
8%
95.2
0%
95.7
7%
97.0
1%
86.3
0%
84.3
8%
95.9
2%
95.9
8%
96.7
7%
88.5
4%
86.7
3%
96.0
5%
96.1
4% 98.2
8%
89.2
8%
88.7
9%
96.8
9%
96.8
4%
98.4
4%
90.0
9%
90.0
0%
97.5
0%
85.1
3%
89.8
8%
85.1
4%85
.92%
90.0
6%
89.0
%
73.1
%
78.3
%
91.5
%
88.9
%
90.5
%
76.2
%80.0
%
92.6
%
90.0
%93.5
0%
60%
65%
70%
75%
80%
85%
90%
95%
100%
105%
AMI CABG Pneumonia Heart Failure Hip and Knee
Clinical Focus Area
Com
posi
te Q
ualit
y Sc
or
Q4-03 Q1-04 Q2-04 Q3-04 Q4-04 Q1-05 Q2-05 Q3-05 Q4-05 Q1-06 Q2-06

P4P accelerates improvement
Comparison to National GroupHospital Compare Data From Q2-05 to Q1-06 (April 1,2005 - March 31,2006)
18 Process Measures Aggregated to Overall Composite Process Score
87.49
81.13
86.46
81.08
84.35
81.12 81.22
82.77
76
78
80
82
84
86
88
HQIDParticipant**
Not in HQID Clinical AdvisorClient**
Non-Client Premier Owner** Non-Owners PremierMember**
Non-Premier
Comparison of HQID Participation, Clinical Advisor Use, Premier Owner and Premier Member Status
Com
posi
te P
roce
ss S
core
(Mea
n Va
lue,
Per
cent
** = p < 0.001** = p < 0.001

P4P accelerates improvement
• New England Journal of Medicine, February 2007.• P4P hospitals showed
greater improvement in all composite measures of quality• Compared to hospitals
engaged in public reporting only
• P4P associated with improvements above public reporting ranging from 2.6 to 4.1% over the 2-year study period
“Public Reporting and Pay for Performance in Hospital Quality Improvement”; New England Journal of Medicine; February 2007; Peter K. Lindenauer, M.D., M.Sc.; Denise Remus, Ph.D., R.N.; Sheila Roman, M.D., M.P.H.; Michael B. Rothberg, M.D., M.P.H.; Evan M. Benjamin, M.D.; Allen Ma, Ph.D.; and Dale W. Bratzler, D.O., M.P.H.

Performance Pays study: Potential national impact
“MEDIUM”50% - 99%
“HIGH”100%
“LOW”0% - 49%
Analysis of potential national impact
71%
PPM*M7M6M5M4M3M2M1
100%
PPM*M7M6M5M4M3M2M1
43%
PPM*M7M6M5M4M3M2M1
M
H
L
Care Measures
Care Measures
Care Measures
* Patient Process Measure

Performance Pays: Positive impact on outcomes
More detail on these findings in tomorrow’s plenary
Example: AMI surgical patients

P4P can be self-funding
For Pneumonia, Heart Bypass Surgery, Hip and Knee Surgery, and AMI Patients
SAVINGS$1.4 Billion
6,000 Avoidable Deaths6,000 Complications
10,000 Readmissions800,000 Days
in One Year Alone

Self-funding not likely in near term
• Complexities of DRG system make it more difficult to clearly identify Medicare savings tied to P4P
• Federal budgeting process requires break-even analysis
• Incentives must pay for themselves OR there must be offsetting cuts elsewhere
• Recent IOM report calls for any reductions in base payments to be phased out as soon as possible

The cost of medication errors and HAIs
• Medication errors are among the most common errors in care, harming at least 1.5 million people every year• Extra medical costs of treating drug-related injuries conservatively
amount to $3.5 billion a year
• HAIs account for an estimated $5+ billion in excess healthcare costs annually
• According to the Centers for Disease Control:• 90,000 people die each year from hospital-acquired infections• An additional 1.9 million patients, or 6% to 10% of inpatients,
acquire infections during their hospital stay. • Over 70% of hospital infections have shown some resistance to
antibiotics.• Up to 50 percent of hospital antibiotic use is unnecessary.

Penalties for preventable errors are coming
• Starting in October 2008, when a hospital fails to prevent specified types of hospital-associated infections, payment will be at the rate for conditions without complications, instead of the higher rate for conditions with complications
• Recent studies state that infection is largely the result of processes of care, rather than the medical condition of the patients upon admission• American Journal of Medical Quality, November 27, 2006
• "This one is here for the taking—and it's billions and billions of dollars,“
• Marc P. Volavka, executive director, Pennsylvania Health Care Cost Containment Council
• CQ HealthBeat, November 27, 2006
•

IHI 5 Million Lives Campaign
• Campaign Objectives:• Avoid 5 million incidents of harm over the next 24
months;• Enroll more than 4,000 hospitals and their communities
in this work;• Strengthen the Campaign’s national infrastructure for
change and transform it into a national asset; • Raise the profile of the problem – and hospitals’
proactive response – with a larger, public audience.

P4P is coming
• The U.S. Congress has mandated that the Centers for Medicare and Medicaid Services develop a plan for hospital “value-based purchasing” starting in FY 2009• CMS is considering modifying and extending the
Premier demonstration to support this requirement
• Recently, Institute of Medicine urged HHS and CMS to gradually phase-in P4P nationwide as way to accelerate quality improvement.• IOM urged HHS/CMS to develop models in which
improvements pay for incentives

Creating a P4P framework
• P4P programs need to address:• Undue fragmentation, duplication, and after-the-fact
inspection, which result in suboptimal effectiveness and efficiency
• Complications and errors• Strongly associated with high cost of care, readmissions, and
mortality/disability.• Unnecessary variation
• In hospitalizations, testing, and drug and device utilization• Target through research into the standard cost of a reliably
executed DRG• Knowledge-sharing and collaboration
• To accelerate rising tide of improvement

Creating a P4P framework
• New P4P programs should focus on:• Building the productive capacity of the care delivery
system• Improving reliable execution of evidence-based
medicine• Managing handoffs between care levels and sites
• Removing financial and regulatory barriers to integrated care for beneficiaries
• Measuring return on investment via population-based efficiency and effectiveness measures

Recommendations for new P4P programs
• Focus on care bundles rather than individual measures
Burger and Resar (Ltr to Editor) Mayo Clin Proc June 2006 81 (6):849
Southeastern. U.S. HospitalVAP rate after implementing ventilator bundle

Recommendations for new P4P programs
• Incentives coupled with transparency are strongly preferable to penalties to create systemic improvement
• Hospitals should be able to share savings with other stakeholders, particularly physicians
• Incentives should align across the continuum of care

Recommendations for new P4P programs
• Medicare, as the largest payer, should lead the way• Appropriate data elements to track• Research into best practices
• Other payers should follow Medicare’s lead• All-payer approach is best for hospitals
• Patchwork of dozens of programs is inefficient

Thank you
Questions? Comments?