Embed Size (px)
Citation preview

Preliminary and Incomplete: 1 9/28/2010For Comments Only
How Good are Good Transitions For Growth and Poverty?
Indonesia since Suharto, For Instance
Lant PritchettHarvard Kennedy School
September 24, 2010
Presented at the Indonesia Update, ANU
Abstract. On May 22nd 1998 no one knew what to expect about the future of Indonesia over any horizon, from days to years to decades. The previous day Suharto has resigned after over 30 years in power and all bets were off. From the vantage point of 2010 we know what did happen politically, elections were held in June of 1999 as promised and “democracy” has proved more robust in Indonesia than many have feared and, after the re-election of Yudhoyono in 2009 one can say that May 21st 1998 began a transition to electoral democracy. In this paper I examine how other outcomes, particularly economic outcomes such as GDP growth and poverty, but also governance outcomes have evolved in this period of democracy. Overall, I argue that outcomes are roughly as good as should have been expected—not that outcomes were terrifically better than in the pre-transition period, but because the empirical data from other transitions should have warned against over-optimistic predictions on how much or how rapidly transitions to electoral democracy, a positive transition in its own right, should have created positive transitions—in growth, in poverty reduction, or even in “governance” in practice.

Preliminary and Incomplete: 2 9/28/2010For Comments Only
How Good are Good Transitions? Indonesia, For Instance
Introduction
Benchmarking is an essential component of any performance assessment. While
the world of high finance is hardly the place to draw positive lesson just these days, the
rewards to portfolio managers give a simple and clear example. People who manage
allocated a portfolio within a certain asset class, say US bonds, or European equities, or
“emerging market” bonds, or small cap equities or so on, are rewarded based on how well
their investments do relative to an index of the entire class of assets. Although this
compensation scheme has its problems, it makes sense as you cannot ask the person
allocating your portfolio among various US municipal bond options to make the same
returns as the person managing the “value equity” makes, as this holds the portfolio
manager responsible for events beyond their control, like whether stocks outperformed
bonds, not the results of their own actions or decisions.
After the crisis, Indonesia did not return to the very rapid rates of economic
growth that prevailed for over 30 years during the Suharto regime. Growth, which was
5.9 ppa from 1987 to 1997 was only 3.7 ppa from the nadir of the crisis in 1999 to 2008.
Growth was slower by (roughly) 2.2. ppa. Is that a “disappointment”? Are those growth
rates an indictment of the policies or economic management of the democratic
governments? How one assesses performance depends on the benchmark. I argue that
Indonesia’ past growth is not an appropriate benchmark for assessing the growth
performance of Indonesia 1999 to 2008 as it ignores two key facts relevant to
benchmarking performance.

Preliminary and Incomplete: 3 9/28/2010For Comments Only
First, the literature on economic growth has documented that economic growth is
“episodic” rather than steady and that there is very powerful “regression to the mean” in
economic growth rates so that economies that have growth fast in the past are expected to
slow down (not necessarily have slower than average growth, but to be slower than their
previous pace). If one takes as a benchmark the expected rate of growth based on cross-
national estimates of the magnitude of regression to the mean then, with just this factor
alone, Indonesia performs right at the benchmark.
Second, it is likely that a major political transition affects the rate of economic growth
through a variety of channels. In analysis original to this paper I identify all country
episodes of rapid democratization and examine the growth rates ten years before and ten
years after this political transition. For countries that went into growth rates with an
above average growth rate there appears to be a “democratic transition” affect that slows
post-transition growth by about 2 ppa. Again, this affect alone could fully account for
Indonesia’s slower growth.
The combination of the two effects implies that if the “benchmark” for growth
1999 to 2008 is “countries with rapid growth up to 1997 and a large democratizing
transition” then the expected deceleration of growth is between 3.5 ppa and 4.3 ppa. By
this benchmark Indonesia’s actual post-transition growth rate of 3.7 ppa and deceleration
of only 2.2 relative to the pre-crisis rates of 5.9 ppa are actually a substantial better
performance than realistic benchmarks based on the performance of other countries.
Using the same type of benchmarking exercise I also look at how Indonesia has
done on various aspects of “governance” since the political transition. In that domain
there are mixed messages. There has been no progress in “bureaucratic capability”—but

Preliminary and Incomplete: 4 9/28/2010For Comments Only
it is not clear from the benchmarking analysis that much progress should have been
expected. On the other hand, there is more progress on the control of corruption than
would have been expected.
Finally, on poverty, although the headcount of consumption expenditure has
declined, not nearly as fast as might have been expected. On this there is less ability to
tell, either from theory or empirics, what should have been expected from democracy.

Preliminary and Incomplete: 5 9/28/2010For Comments Only
I. Democratic Transitions and Economic Growth
It is tough to make predictions,Especially about the future.
Yogi Berra (Baseball player)
As the famous New York Yankee and noted savant pointed out, it is much easier
to predict the past than the future. I therefore start with the easy part, reviewing
Indonesia’s growth performance before, during, and after the economic crisis and
political transition of 1997/98. But even about the past, the much trickier question is, “is
the growth performance since the crisis and political transition better or worse that was
expected?” That requires some statement of what was “expected”—should we have
expected Indonesia’s growth to return to the same pace as before the crisis? Should we
have expected growth under democracy to have accelerated, which we might have
expected if a democratic government could provide better or more stable economic
policy. Should we have expected growth to decelerate, which we might have expected if
democracy has a difficult time in providing the impetus for rapid growth, given the
conflicting pressures.
I.A) Indonesia’ growth performance, in pictures
Figure 1 shows five periods of Indonesia’s growth in GDP per capita since 1960
(which is where the standard available data series begin). From 1960 to 1967 there was
essentially zero growth, a lack of growth was accompanied by other economic disruption,
such as shortages and rapid inflation. Moreover, it is worth remembering that in this
period Indonesia was a quite poor country. For instance, according to the purchasing
power adjusted estimates from the Penn World Tables 6.3 Indonesia in the early 1960s

Preliminary and Incomplete: 6 9/28/2010For Comments Only
had per capita GDP lower than that of Mali or Ethiopia today, Indonesia’s GDP per
capita in the 1960s was that of Somalia in the 1970s before its descent into chaos. Even
countries thought of as very poor today, such as Bangladesh or Nepal currently have
twice the GDP per capita that Indonesia had in the 1960s.
After the political chaos and violence that occasioned the beginning of the New
Order government under Suharto the economy began to grow. From 1967 to 1987
growth was 4.8 ppa (percent per annum). This put Indonesia among the growth stars of
the time. If one takes the period from 1987 to 1997 growth accelerated to an even more
rapid pace, with Indonesia experiencing nearly 6 ppa growth.
The financial crisis that began in Thailand and spread to other East Asian
countries resulted in a particularly severe crisis for Indonesia. The Rupiah collapsed
(before any inflation), most of the banking sector was illiquid and insolvent, and new
investment ground to a halt. This was followed by inflation, a rapid rise in rice prices, a
huge rise in poverty (see section on poverty below). However, somewhat amazingly to
those of us living through it, by 1999 the crisis was stemmed and the economy
“stabilized” at a much lower level. On June 7, 1999 the first post-New Order national
elections were held and the democratic transition moved along.
From 1999 to 2008 the economy has grown at a pace of 3.7 ppa. I only take the
data through to 2008 primarily because this is what is available on a standardized basis
for comparisons with other countries which I use below. This means I am not attempting
an “update” on GDP per capita—and in particularly on how the global crisis, this time
caused by the rich countries, affected Indonesia--but a retrospective on the decade
following the transition. Indonesia took until 2004 to recover to the 1997 pre-crisis level,

Preliminary and Incomplete: 7 9/28/2010For Comments Only
which seemed, at the time, slow relative to the pace of recovery East Asian countries.
For instance, Korea regained its 1997 peak already by 1999 after a severe but short jolt,
Thailand had recovered by 2002 (before the onset of the more recent troubles there). By
2008 Korea GDPPC was 47 percent above its 1997 level, Thailand’s 26 percent, while
Indonesia’s only 19 percent. In 2008 GDP per capita was almost exactly 40 percent
higher than at the nadir of the crisis (and almost 20 percent higher than the pre-crisis
peak).
Whether this growth performance has under or over performed “expectations”
depends on what “expectations” were. One, super-optimistic, scenario would be a quick
recovery (a ‘V’ shaped recovery to the 1997 level in two years) plus a resumption of the
rapid pre-crisis growth rate of 5.9 percent. In that scenario output would have increased

Preliminary and Incomplete: 8 9/28/2010For Comments Only
nearly 75 percent in the ten years from 1999 to 2008. Another possible scenario would
be that the economy would start back again on the rapid growth path of 87 to 97 (but no
particularly rapid crisis recovery). But 1987 to 1997 growth was rapid even by long-term
Indonesia averages, so another would be just to return to the 1967 to 1987 growth rate.
This exceeds the actual, but not by a tremendous amount. Moreover, in the four years
from 2004 to 2008 growth was actually at the same pace as 67-87 (4.5 ppa versus 4.8
ppa). Finally, another scenario would be that after the crisis Indonesia would grow at an
average pace, so Figure 2 also shows the median growth of GDP per capita of all other
countries in Indonesia’s income range. Compared to that standard Indonesia did well,
growing at 3.7 ppa compared to the median country growth of 2.9 ppa, but few countries
strive to have merely “ordinary” growth performance.

Preliminary and Incomplete: 9 9/28/2010For Comments Only
I.B) What is the expected outcome of a big and good political transition
The scenarios in Figure 2 are entirely mechanical and really do not address the
question of whether growth was “as expected” or whether growth in the democratic post-
transition era has been “disappointing.” Having lived in Indonesia from 1998 to 2000 I
can reassure you the “expected” growth rate after the crisis was not a well-defined
concept. No one knew what the trajectory of the other events, social, political and policy,
was going to be. Under many of the political and social outcomes that seemed possible,
if not probable, in 1998—military intervention, increased separatism and unrest, ethnic
violence, unstable democracy, various stripes of populism—the growth expectations were
very negative.
The more interesting, if only because it is tractable, question is, if you had known
the political and social trajectory that has actually happened—which, relative to the more
pessimistic expectations and downside scenarios at the time is enormously positive—
what would have been your growth expectations? If you had been reassured in 1998 by a
visitor from the future that national elections would be held peacefully in June 1999 and
that these would be reasonably free and fair, that the party that had controlled Indonesia
for 30 years would peacefully cede power to the elected government, that Indonesia
would then have ordered democratic transitions from June 1999 onwards. Moreover,
let’s even assume you knew in 1998 who the elected leaders would be: Gus Dur,
Megawati, Yudohyono (all well known political figures and none of them among the
more feared outcomes of democracy). What would have been growth expectations

Preliminary and Incomplete: 10 9/28/2010For Comments Only
conditional on knowing that the political transition from 30 years of authoritarian one-
party rule had gone so smoothly?
It might not seem unreasonable to “expect” that this good political transition to
democracy would be accompanied by good outcomes on the economic front: that growth
and poverty reduction would be as rapid, or perhaps even more rapid, than during the
Suharto years. It is in this light that Indonesia’s post-crisis, post-transition growth could
be seen as “disappointing.”
However, is this really what the experience and data from other countries around
the world would really lead us to expect? Have other countries that have had very rapid
transitions to democracy experienced more or less rapid growth after their political
transition. This question I can answer.
The concept of “governance” is hugely complicated, but can be divided into two
conceptually distinct components, the “polity”—how political leadership arrives to
power—and the second is “administrative performance” of the government itself (to
which we return in the next section). One commonly used indicator of the “polity” is a
measure called, unsurprisingly, POLITY which ranks countries on a scale of “autocracy”
from zero to negative 10 and “democracy” from zero to positive 10. The simple sum of
those two indicators gives an empirical ranking that ranges from negative 10 (completely
autocratic) to positive 10 (completely democratic). Just to illustrate the range of the
ranking selected East Asian examples are given in Table 1. As can be seen this rating has
nothing intrinsic to do with economic performance (both China and Vietnam are rated as
-7) not even with quality of “governance” in the sense of administrative capability to

Preliminary and Incomplete: 11 9/28/2010For Comments Only
carry out governmental functions (Singapore is a -2 and Malaysia in 2007 a 3 while both
have very capable administrations).
Table 1: Selected East Asian examples of the POLITY IV rankings, from -10 (autocracy) to +10 (Democracy)
Country Year POLITYIndonesia 1996 -7China 2008 -7Vietnam 2008 -7Singapore 2008 -2Malaysia 2007 3Philippines 2008 8Indonesia 2008 8Japan 2008 10
This POLITY ranking captures Indonesia’s massive, rapid, and sustained transition to
democracy. Figure 3 shows Indonesia’s POLITY ranking from 1960 to 2008. Obviously
to Indonesia experts this adds no new information, but does show the ranking follows the
known major events of Indonesia’s political trajectory in a not unreasonable way—the
Sukarno era was rated as -5, during the entire Suharto period from 1967 to 1997 was
rated a -7, improving dramatically to a positive 6 in 1999 with the June elections and then
increasing to 8 with the election of 2004 that brought in SBY as president.

Preliminary and Incomplete: 12 9/28/2010For Comments Only
Figure 3: Indonesia’s political transition to democracy as rated in the POLITY data
-8
-6
-4
-2
0
2
4
6
8
10
1960 1970 1980 1990 2000 2010
Year
PO
LIT
Y R
aa
nk
ing
Source: POLITY data from WDR 2011 data.
Knowing that Indonesia has been a democracy since 1999 however does very little to
help in what one should have “expected” from its growth rate. Figure 4 is the simple
display of countries’ average POLITY score and their growth rate over the 1998-2007
period (each country is identified with a three letter code and Indonesia is highlighted
inside the circle). The median growth rate of the “imperfect democracies” in this period
(defined as those countries with an average POLITY score above 5 but less than 10) is
2.95 ppa, which puts Indonesia’s growth rate over this period (in this data set) of 3.3 ppa
pretty squarely in the middle of growth performance. But, there is really no strong
association between growth and POLITY score, the “autocracies” do slightly better, 4.3
ppa, the countries in between do worse, 1.39 ppa but mostly there are countries at a large
range of economic growth in each POLITY category1.
1 There is a substantial literature by economists on the question of whether democracies tend to have higher or lower growth rates than non-democracies. The current conventional wisdom is that there is very little connection between the average growth of democracies and non-democracies as distinct groups but that there is a much higher variance in growth rates among non-democracies, with really rapid growth (e.g.China, Vietnam, Indonesia under Suharto) but also very slow growth and even growth implosions. That said, one can find specifications in which “democracy” appears to matter. For instance, Persson and

Preliminary and Incomplete: 13 9/28/2010For Comments Only
The simple comparison “democracies” grow faster or slower than “non-democracies”
does not capture the possibility that transitions themselves might have impacts. In this
case while in the long-run democracies might be capable of sustaining rapid growth the
transition period itself creates an adjustment period of slow growth. To examine this
question we need to compare growth before and after rapid, large, political transitions
from autocracy to democracy, for which we need to identify “large” transitions.
First, I searched over the POLITY combined democracy indicator (sum of autocracy
and democracy) to identify all instances in which the POLITY index changed by more
Tabellini (2006) regress annual growth rates on a dummy variable that =1 if the POLITY score is above zero and 0 if POLITY is below zero and show this is associated with more rapid growth. This is a particular functional form of a “step function” in which an improvement in democracy from Malaysia’s 2006 value of 4 to Netherlands at 10 would have no effect and the reduction in autocracy in Jordan from -9 to -2 should have no impact, but moving across exactly zero should have all of the impact.

Preliminary and Incomplete: 14 9/28/2010For Comments Only
than 5 units in a single year (say from -7 to -1 or from 2 to 8). These are candidates for
large democratic transition. Then there is a decision tree to classify and time to the
transition, especially to cope with countries with multiple transitions that is described in
Table 2, with examples (starting with Indonesia). The results of this classification
scheme are 52 episodes of large democratic transitions (see Appendix Table A.1 for the
complete list).
Table 2: Classification of candidate large democratic transitions (all years with a greater than 5 point absolute change in POLITY rating)
Empirical criteria Decision Rule Country exampleIf country has only one candidate episode
Keep that episode with transition dated to year of new value
Indonesia 1998=-6, 1999=5, Δ=11, transition year is 1999
If the country has two episodes…
…episodes are more than 3years apart
Keep both episodes Taiwan, 1986=-7, 1987=-1, 1991=-1. 1992=7, two transitions 1987 and 1992
…if episodes are closer than 3 years and in the same direction
Classify as one episode, dated to the earlier period
Madagascar 1990=-6, 1991=2, 1992=9, one transition dated to 1992
…if episodes are closer than 3 years and in the opposite direction
Do not keep as an episode Armenia, 1995=3, 1996=-6, 1997=-6, 1998=5 (no sustained democratic transition, brief cycle into autocracy)
If a country has three or more episodes then each was classified separately depending on the timing and direction of changes (20 countries) to keep and date distinct episodes.
Once the episodes of large democratic transitions had been identified the next step is
calculate growth rates “before” and “after” the episode. But as we want to capture the
medium term we calculate the 10 year growth rate up to 3 years before the transition and
the growth rate from one year after the transition for 10 years (or until the data ends).

Preliminary and Incomplete: 15 9/28/2010For Comments Only
Figure 5 illustrates the timing of the growth episodes, using Indonesia’s transition in 1999
as an example2.
Table 3 gives the first key result of the empirical analysis of the transitions, which is
that countries that have experienced large democratic transitions beginning from a
preceding period of above average growth (higher than the cross-national average of 2
ppa) experienced sharp decelerations of growth rates in the 10 years following the (year
after) the transition. So, according to the PWT6.3 data on the growth rate of purchasing
power parity adjusted real GDP per capita, Indonesia’s growth rate from 1986 to 1996
2 These timing assumptions are not innocuous. Often a political transition is preceded by a large fall in GDP per capita, sometimes as the result of the chaos of the political transition itself. If one then calculates the growth “before” the transition to include this fall, which could be the result of the transition itself, then it will look like the political transition accelerated growth. This is why I go back some years before the transition so that the pure disruption effects are not counted as part of the “pre-democratic” period. Rodrik and Wacziag (2005) for instance do an analysis similar to examine growth impacts of democratic transitions and date the transitions to just before the transition. They find similar results overall, of the nine countries they identify with democratizing transitions begun from above 2 ppa growth the average deceleration was 3.53 ppa which is exactly what we find in Table 3. But in some instances the differences in timing produce clearly different country results. For instance, we both find a democratic transition in the Philippines dated to 1986. Since GDP fell from 1984 to 1986 by their dating growth in the Philippines accelerated whereas my timing compares growth of 1974 to 1984 and finds growth decelerated.
T+1+10 (2007)
T(1999)
T-3(1996)
T-3-10(1986)
T+1(2000)
10 year growth three years pre-transition(e.g. 1986-1996=5.5 ppa
(up to) 10 year growth post transition(e.g. 2000-2007=3.3 ppa)
Figure 5: Illustration of the calculation of the “pre” and “post” large democratic transition growth rates (with example dates from Indonesia)

Preliminary and Incomplete: 16 9/28/2010For Comments Only
was 5.54 ppa, but over the period 2000 to 2007 was only 3.28 ppa. This is the growth
deceleration observed in the analysis above, with growth 2.2 ppa slower in the
democratic, post-Suharto era than in the authoritarian period.
This, first-cut, analysis suggests Indonesia has had less deceleration of economic
growth than Indonesia should have “expected” if expectations were grounded in the
experience of other countries. First, of the 22 country episodes of large democratic
transition from above average growth all but one experienced a growth deceleration
(Korea 1987 is the sole exception with an acceleration of only .22 ppa). The combination
of high initial growth and democratic transition makes some deceleration all but
inevitable. Second, the magnitude of the decelerations experiences was very large: the
median deceleration across these 22 countries was 2.99 ppa and the average deceleration
3.5 ppa. So if Indonesia had experience the “typical” (median) or average (mean)
deceleration of this group of countries its growth rate would have been 2.55 ppa (5.54
less 2.99) or 2.01 ppa (5.54 less 3.53) rather than the 3.3 ppa growth it actually
experienced. So, while one framing is that Indonesian growth has been “disappointing”
in the democratic era, this is only relative to an arbitrary expectation that it would
maintain the same growth rate. But there is no evidence to suggest that zero deceleration
is a reasonable “expectation” for post democratic transition growth.

Preliminary and Incomplete: 17 9/28/2010For Comments Only
Table 3: Countries with large democratic transitions starting from above average growth (higher than 2 percent) before the transition
Country Year of large democratic transitions
Magnitude of POLITY increase
Growth pre-transition (T-10-3 to T-3)
(sorted)
Growth post-transition(T+1 to T+10 (or end of data)
Change in growth pre and post transition
GRC 1975 7 7.19% 0.02% -7.17%IRN 1979 10 7.11% 0.11% -7.01%PRT 1976 6 7.11% 1.48% -5.63%TWN 1992 8 6.47% 3.95% -2.52%TWN 1987 6 6.42% 5.78% -0.64%NGA 1979 7 5.81% -2.44% -8.25%ECU 1979 14 5.69% -1.66% -7.36%COG 1992 6 5.68% 0.57% -5.11%IDN 1999 11 5.54% 3.28% -2.26%DOM 1978 9 5.50% 1.35% -4.14%KOR 1987 6 5.36% 5.57% 0.22%THA 1992 10 4.67% 0.82% -3.85%MNG 1990 9 4.39% 2.09% -2.30%BGR 1990 15 4.02% -0.10% -4.12%PAN 1989 16 3.91% 1.68% -2.23%BEN 1990 7 3.62% 1.30% -2.32%PAK 1988 12 3.50% 1.32% -2.18%URY 1985 16 3.44% 3.16% -0.27%BRA 1985 10 3.31% -0.34% -3.65%PRY 1989 10 2.70% -0.75% -3.45%BOL 1982 15 2.37% 0.27% -2.09%ROM 1989 6 2.14% 0.85% -1.28%Median, high initial growth transitions
5.01% 1.08% -2.99%Average, high initial growth transitions
4.82% 1.29% -3.53%
Source: Author’s calculations with POLITY and PWT6.3 data.
The data in Table 3 does not suggest that “democracy” or “democratic transitions”
necessarily reduce growth uniformly as this only analyzed those countries which entered
their transition from rapid growth. If we take the polar extreme of countries that entered
an episode of democratic transition from negative growth rates in the previous decade

Preliminary and Incomplete: 18 9/28/2010For Comments Only
then growth accelerated substantially after the transition. The negative growers in the
period leading up to the POLITY change actually accelerated by 3.3 ppa (median) to 3.7
ppa (mean) in the ten years after their large democratic transition. Actually, the average
growth change of all democratizing episodes is only -.3 ppa, a very modest deceleration
(consistent with Rodrik and Wacziag 2005).
Table 4: Countries with large democratic transitions starting from negative growth before the transition
Country Year of large democratic transitions
Magnitude of POLITY increase
Growth pre-transition (T-10-3 to T-3)
(sorted)
Growth post-transition (T+1 to T+10 (or end of data)
Change in growth pre and post transition
FJI 1990 8 -0.56% 1.43% 1.99%MWI 1994 14 -0.84% 0.96% 1.80%MOZ 1994 12 -0.96% 6.58% 7.54%ZAR 1992 8 -1.07% -7.17% -6.10%POL 1989 11 -1.09% 4.75% 5.84%NIC 1990 7 -1.28% 1.03% 2.31%CAF 1993 11 -1.39% -0.60% 0.79%SLE 1996 11 -1.57% 4.59% 6.16%ETH 1991 8 -2.13% 1.93% 4.05%ZMB 1991 15 -2.64% -1.54% 1.10%HRV 1999 6 -3.21% 5.07% 8.28%LBR 1990 6 -3.99% 5.75% 9.73%DJI 1999 8 -4.94% -2.29% 2.65%GUY 1992 13 -5.40% 1.05% 6.45%Median, low growth -1.48% 1.24% 3.35%
Mean, low growth -2.22% 1.54% 3.76%
The data say the countries that had above average growth before their large
democratic transition had very substantial growth decelerations in the medium run (10
years) after that transition. There are two immediate questions about whether this has
Preliminary and Incomplete: 19 9/28/2010For Comments Only
anything to do with “transitions” at all, and if so whether it had anything to do with
“democratic” transitions.
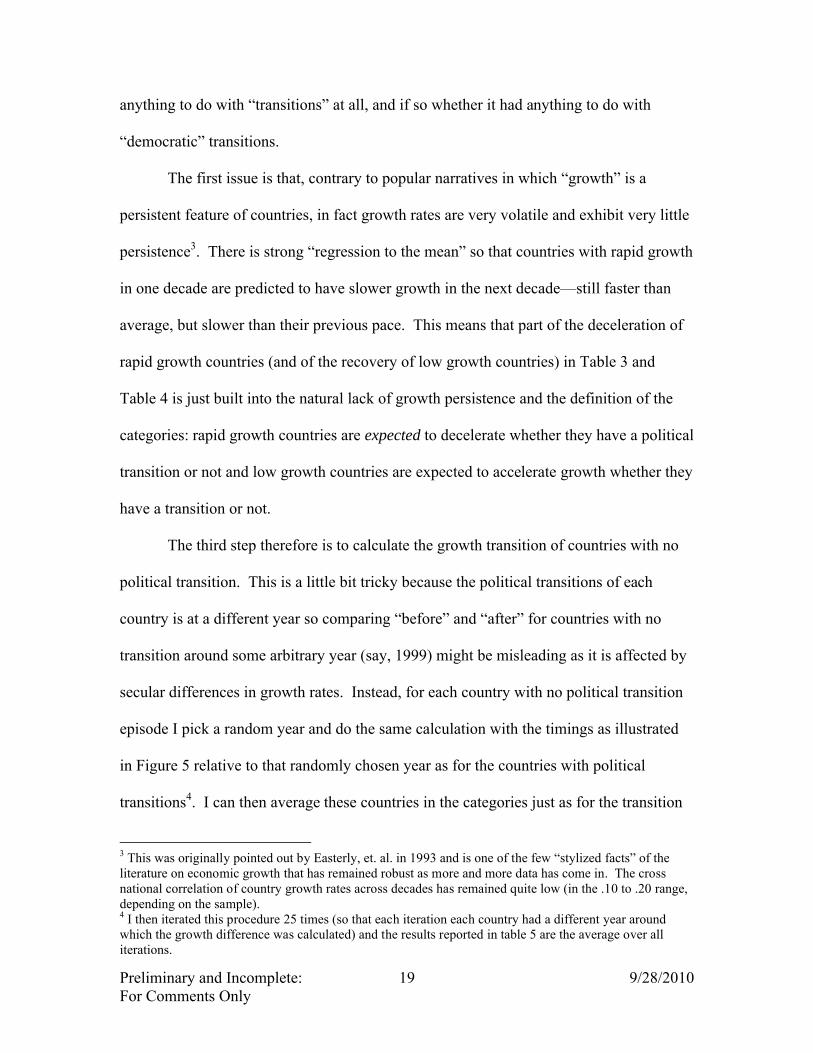
The first issue is that, contrary to popular narratives in which “growth” is a
persistent feature of countries, in fact growth rates are very volatile and exhibit very little
persistence3. There is strong “regression to the mean” so that countries with rapid growth
in one decade are predicted to have slower growth in the next decade—still faster than
average, but slower than their previous pace. This means that part of the deceleration of
rapid growth countries (and of the recovery of low growth countries) in Table 3 and
Table 4 is just built into the natural lack of growth persistence and the definition of the
categories: rapid growth countries are expected to decelerate whether they have a political
transition or not and low growth countries are expected to accelerate growth whether they
have a transition or not.
The third step therefore is to calculate the growth transition of countries with no
political transition. This is a little bit tricky because the political transitions of each
country is at a different year so comparing “before” and “after” for countries with no
transition around some arbitrary year (say, 1999) might be misleading as it is affected by
secular differences in growth rates. Instead, for each country with no political transition
episode I pick a random year and do the same calculation with the timings as illustrated
in Figure 5 relative to that randomly chosen year as for the countries with political
transitions4. I can then average these countries in the categories just as for the transition
3 This was originally pointed out by Easterly, et. al. in 1993 and is one of the few “stylized facts” of the literature on economic growth that has remained robust as more and more data has come in. The cross national correlation of country growth rates across decades has remained quite low (in the .10 to .20 range, depending on the sample). 4 I then iterated this procedure 25 times (so that each iteration each country had a different year around which the growth difference was calculated) and the results reported in table 5 are the average over all iterations.

Preliminary and Incomplete: 20 9/28/2010For Comments Only
countries. As expected, it really is the case that countries with above average growth are
expected to have their growth decelerate and with below zero growth are expected to
have their growth accelerate (that is, there is “regression to the mean”) even around some
arbitrarily chosen year. The average deceleration for countries with growth above 2 ppa
is 1.8 ppa, which returns them roughly to the cross-national average. The average
acceleration for countries with less than zero growth is larger, 4.6 ppa, which is larger in
part because these country’s growth rate is further from the cross-national average than
the “high growth” countries (as they are defined as those not just below the average, but
below zero).
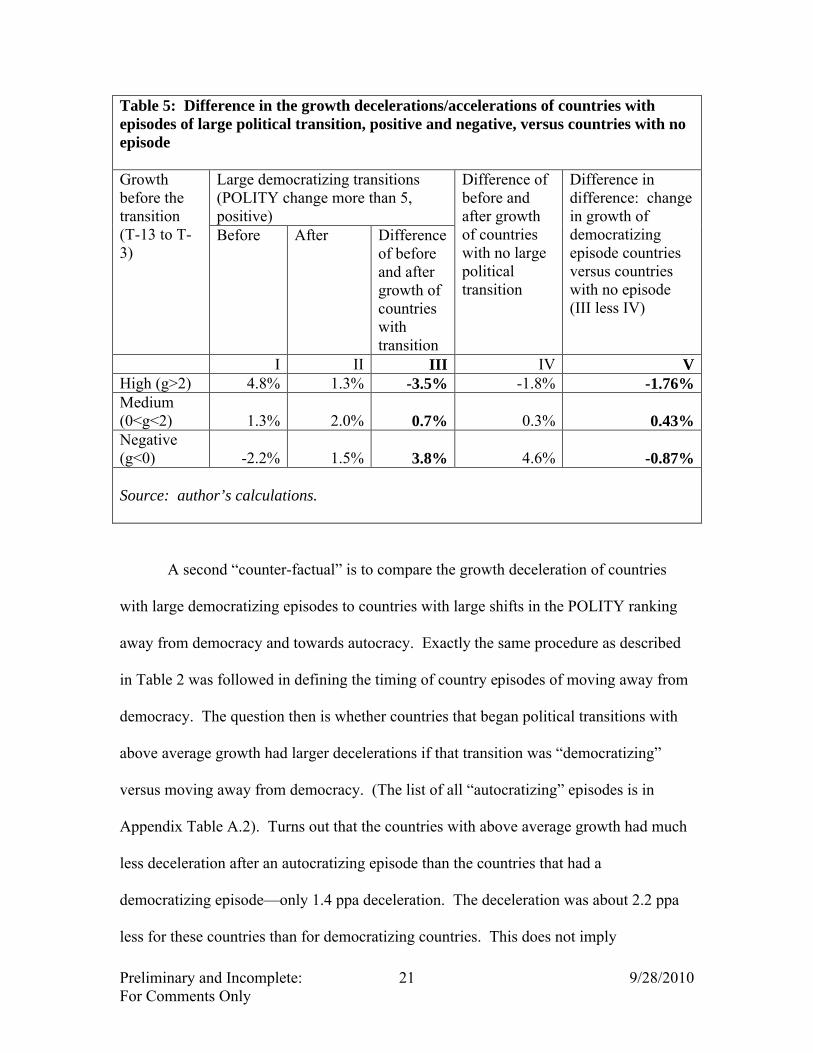
The deceleration of the growth rate of countries that started with above average
growth and did have a large democratizing transition of 3.5 ppa is substantially larger
than the counter-factual of the growth deceleration of countries with no transition 1.8
ppa. So the “difference in difference”—the change in growth rates before and after
(difference) between the democratizing countries and no transition countries (difference)
is itself -1.76 ppa—countries with large democratizing transitions, on average,
decelerated by 1.76 ppa more than countries with no political transition. So, crudely put,
the growth deceleration of rapidly growing economies following a large democratizing
transition seems to be about half “natural” deceleration due to regression the mean and
half due to the democratizing episode itself.
Preliminary and Incomplete: 21 9/28/2010For Comments Only
Table 5: Difference in the growth decelerations/accelerations of countries with episodes of large political transition, positive and negative, versus countries with no episode
Growth before the transition(T-13 to T-3)
Large democratizing transitions (POLITY change more than 5, positive)
Difference of before and after growth of countries with no large politicaltransition
Difference in difference: change in growth of democratizing episode countries versus countries with no episode(III less IV)
Before After Difference of before and after growth of countries with transition
I II III IV VHigh (g>2) 4.8% 1.3% -3.5% -1.8% -1.76%Medium (0<g<2) 1.3% 2.0% 0.7% 0.3% 0.43%Negative (g<0) -2.2% 1.5% 3.8% 4.6% -0.87%
Source: author’s calculations.
A second “counter-factual” is to compare the growth deceleration of countries
with large democratizing episodes to countries with large shifts in the POLITY ranking
away from democracy and towards autocracy. Exactly the same procedure as described
in Table 2 was followed in defining the timing of country episodes of moving away from
democracy. The question then is whether countries that began political transitions with
above average growth had larger decelerations if that transition was “democratizing”
versus moving away from democracy. (The list of all “autocratizing” episodes is in
Appendix Table A.2). Turns out that the countries with above average growth had much
less deceleration after an autocratizing episode than the countries that had a
democratizing episode—only 1.4 ppa deceleration. The deceleration was about 2.2 ppa
less for these countries than for democratizing countries. This does not imply

Preliminary and Incomplete: 22 9/28/2010For Comments Only
autocratizing episodes “helped” in some absolute sense as remember the “no episode”
countries decelerated by only 1.8 ppa so the rapidly growing autocratizing countries had
only slightly less than the “natural” deceleration.

Preliminary and Incomplete: 23 9/28/2010For Comments Only
Table 6: Difference in the growth decelerations/accelerations of countries with episodes of large political transition, positive and negative, versus countries with no episode
Growth before the transition(T-13 to T-3)
Large democratizing transitions (POLITY change more than 5, positive)
Large “autocratic” transitions (POLITY change more than 5, negative)
Difference between “democratic” episode and “autocratic” episode
Before After Change Before After Change
High (g>2) 4.8% 1.3% -3.5% 3.5% 2.2% -1.4% -2.2%Medium (0<g<2) 1.3% 2.0% 0.7% 1.2% 1.8% 0.6% 0.2%Negative (g<0) -2.2% 1.5% 3.8% -1.9% 1.2% 3.1% 0.6%
Two final benchmark comparisons are to use simple regressions that associate the
change in countries growth rates with their previous growth rate (and level of income).
The first simple comparison is to just take all the “developing” countries (with GDP per
capita lower than PPP$10,000 in 19987) and regress the change in growth rates between
1987 to 1997 and 1999 and 2007 for all countries. In this regression Indonesia’s
“predicted” deceleration is 1.97 ppa versus the actual of 2.15 ppa. So regression to the
mean alone can explain all of Indonesia’s growth deceleration.
The second simple regression is to regress the change in growth rates for all 52
countries with large democratizing transitions on their initial growth rate (and level of
income at the beginning of the post transition growth period). This is the predicted
deceleration for those countries which experienced democratic transition. From this the
predicted deceleration for Indonesia is 4.26 ppa—which combines the “regression to the
mean” and the “large democratizing transition.”
I.C) Summary of the post-transition growth performance

Preliminary and Incomplete: 24 9/28/2010For Comments Only
Table 7 brings together the main empirical results of my attempt to benchmark
Indonesia’s growth performance since the economic crisis that began in 1997 and the
political transition that began in 1998. The naive “expectation” that growth would return
to the previous high levels might imply “disappointment” with Indonesia’ growth as
growth decelerated by 2.28 ppa. However, any number of a variety of other ways of
setting an empirical “benchmark” for the performance of Indonesia’s economy suggest
that the economy has actually outperformed what would have been expected as there are
two forces leading to a deceleration in growth: first, regression to the mean and second, a
large democratizing transition.
The simplest possible regression of growth rates 1999-2007 on countries’ growth
rates 1987-1997 actually predicts growth for Indonesia of 3.47 ppa versus the actual of
3.29. So typical “regression to the mean” fully explains Indonesia’s growth deceleration.
But, the analysis of large democratizing episodes suggests that countries that go
into these episodes with above average growth (nearly) always experience significant
deceleration of growth. The average deceleration among the 22 countries was 3.53 so the
predicted for Indonesia if it experience the average deceleration was growth of only 2.01
ppa so Indonesia outperformed in growth by 1.27 ppa.
Preliminary and Incomplete: 25 9/28/2010For Comments Only
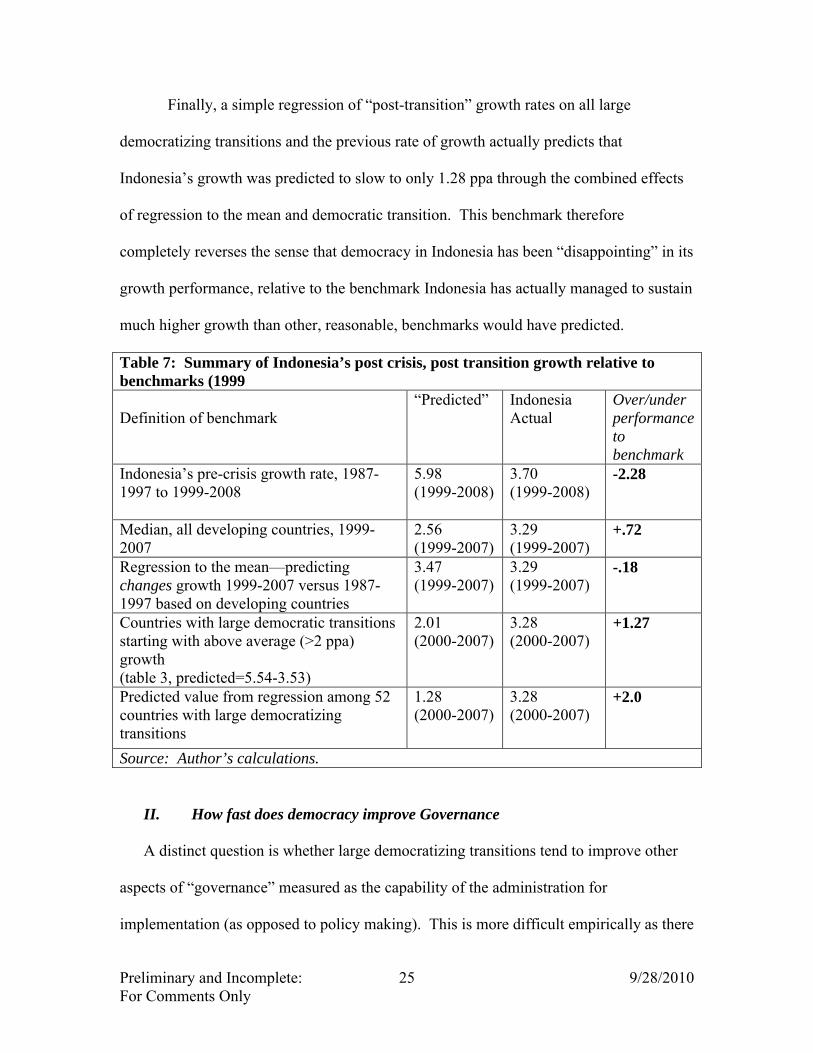
Finally, a simple regression of “post-transition” growth rates on all large
democratizing transitions and the previous rate of growth actually predicts that
Indonesia’s growth was predicted to slow to only 1.28 ppa through the combined effects
of regression to the mean and democratic transition. This benchmark therefore
completely reverses the sense that democracy in Indonesia has been “disappointing” in its
growth performance, relative to the benchmark Indonesia has actually managed to sustain
much higher growth than other, reasonable, benchmarks would have predicted.
Table 7: Summary of Indonesia’s post crisis, post transition growth relative to benchmarks (1999
Definition of benchmark“Predicted” Indonesia
Actual Over/under performance to benchmark
Indonesia’s pre-crisis growth rate, 1987-1997 to 1999-2008
5.98(1999-2008)
3.70(1999-2008)
-2.28
Median, all developing countries, 1999-2007
2.56(1999-2007)
3.29(1999-2007)
+.72
Regression to the mean—predicting changes growth 1999-2007 versus 1987-1997 based on developing countries
3.47(1999-2007)
3.29(1999-2007)
-.18
Countries with large democratic transitions starting with above average (>2 ppa) growth(table 3, predicted=5.54-3.53)
2.01(2000-2007)
3.28(2000-2007)
+1.27
Predicted value from regression among 52 countries with large democratizing transitions
1.28(2000-2007)
3.28(2000-2007)
+2.0
Source: Author’s calculations.
II. How fast does democracy improve Governance
A distinct question is whether large democratizing transitions tend to improve other
aspects of “governance” measured as the capability of the administration for
implementation (as opposed to policy making). This is more difficult empirically as there

Preliminary and Incomplete: 26 9/28/2010For Comments Only
are fewer widely accepted empirical indicators of “governance” that have a long enough
span of coverage so as to allow “before” and “after” analysis. The most plausible set of
indicators are those from the International Country Risk Guide (ICRG) which has
produced ratings on a number of dimensions including political, economic, and financial
risk for use by international business for a large number of countries since 1984.
I use four of the component indicators from the “Political Risk” section—
“Democratic Accountability”, “Bureaucratic Quality”, “Control of Corruption” and “Law
and Order.” These rank countries from a scale of 0 (worst) to 6 (best)—except for
bureaucratic quality where the scale is only 0 to 4.
In this instance I compare the actual value in the year before the transition to the
value 10 years following the transition5.
The first component is really just to reassure myself that the comparisons between
the two sources, POLITY and ICRG, make sense and hence I examine whether countries
with a large democratizing POLITY transition have a reported increase in Democratic
Accountability according to ICRG. Indeed, the changes for democratizing transitions are
positive and very large while those for autocratic transitions are negative.
One interesting question is whether democracies have, on average, more capable
administrations, as there if often the argument that authoritarian regimes can “make the
trains run on time.” In the case of Indonesia ICRG rates that there has been neither
improvement nor deterioration in bureaucratic quality since 1998—ranked a 2 on a o to 4
scale in both periods. Interestingly, democratizing transitions are not really “expected” to
lead to that much improvement as those countries with transitions had an average
improvement of only .4 units larger than countries with no transition at all. 5 Analysis using the pre-transition average to 10 years post-transition gave quite similar results.

Preliminary and Incomplete: 27 9/28/2010For Comments Only
After the transition, and especially in recent years, there has been an effort to check
corruption. According to the ICRG ratings Indonesia has been quite successful as control
of corruption has improved from 1.25 to 3.83—a massive increase (more than two cross-
national standard deviations). Interestingly, the data does not predict nearly that much
improvement—only a .32 greater gain for large democratizing transitions than others.
Table 8: Democratizing transitions in POLITY and changes in other governance indicators
Indicators from the Political Risk section of the International Country Risk Guide
Indonesia Difference in countries with large POLITY transitions and tocountries without transitions (before and after 1999)
Cross national std. dev. of variable in 2009
1998 2009 Change 1998 to 2009
Democratictransitions(POLITY change >5)
Autocratictransitions (POLITY change<-5)
Democratic Accountability(Range: 0 to 6)
1.00 5.00 4.00 1.37 -0.52 1.69
Bureaucratic Quality(Range: 0 to 4)
2.00 2.00 0.00 0.37 0.26 1.11
Corruption(Range: 0 to 6)
1.25 3.83 2.58 0.32 -0.40 1.18
Law and Order(Range: 0 to 6)
2.5 3 0.50 1.08 0.92 1.32
A final comparison of interest is “law and order.” On this score there has been some
improvement, but quite modest. Interestingly, on this indicator progress has been
actually less than predicted among transition countries, rising by .5 compared to an
“expected” rise among large democratic transitions of 1.08 units.
III. Democracy and Poverty
A final domain over which one might have expected a democratic transition to be a
good transition is poverty reduction. Here one might have thought that a democratic

Preliminary and Incomplete: 28 9/28/2010For Comments Only
government, motivated by elections and disciplined by democratic accountability
(which did, as we saw, actually increase) would be able to engineer larger poverty
reductions than during the previous authoritarian regime. That was not so, nor, I
would argue, was there any good reason to expect it to be so.
Figure 6 shows the evolution of the headcount poverty rate—the proportion of the
population below an absolute threshold of household per capita consumption
expenditures. The series breaks in 1996 as the poverty line calculation was re-done
so the first series and second series are comparable to within but not to each other.
This shows the extremely rapid reduction of poverty from 1976 to 1996—from 40
percent points of the population to only 11.6 percent in only 20 years. This is one, if
not the most rapid reduction in mass destitution in all of history. This is of course
interrupted by the crisis, with poverty increasing quite dramatically, then resuming a
downward trend, but less rapidly than prior to the crisis and with an actual reversal in
2005 to 2006.
Figure 6: Evolution of poverty, 1976 to 2010 (with break in series at 1996)
5
10
15
20
25
30
35
40
45
1975 1980 1985 1990 1995 2000 2005 2010
Year
Po
ve
rty
he
ad
co
un
t ra
te
New Series
Old series

Preliminary and Incomplete: 29 9/28/2010For Comments Only
The question is whether the downward trend good enough news or whether it is
“disappointing”—which again depends on what one expected to happen. Here there is
insufficient comparable cross-national, time-series data on poverty headcount rates to do
the episodic analysis of democratizing episodes that were possible for growth or
governance indicators. Instead, I discuss three scenarios to illustrate that part of the
puzzle is not just that growth was slower in the democratic period but also the
responsiveness of poverty reductions to growth (the poverty elasticity) appears to have
fallen.
Figure 7 shows the evolution of the poverty headcount rate with the actual data (the
“new series” of Figure 6) and three scenarios.
Figure 7: Actual headcount poverty and alternative three scenarios for the path of poverty reduction
5.00
7.00
9.00
11.00
13.00
15.00
17.00
19.00
2000 2002 2004 2006 2008
Yerar
Po
ve
rty
he
ad
co
un
t ra
te Actual
At 76-96 elasticity,actual growth
At 76-96 elasticity,1987-97 growth
Elasticity=2 (int'laverage), actualgrowth
The first scenario asks what the evolution of the poverty rate would have been had
poverty had the same responsiveness to growth (elasticity) as in the 1976 to 1996 period.
Table 9 shows the calculation of the “poverty elasticity of growth” which is simply the
ration of the percentage reduction in the poverty headcount rate to the percentage

Preliminary and Incomplete: 30 9/28/2010For Comments Only
increase in GDP per capita. Overall during the 1976 to 1996 period (using the old
poverty headcount series) the average (median) elasticity was -1.15 (-1.24).
Table 9: Poverty reduction, economic growth, and implied poverty elasticity in the 1976-1996 period
Year Headcountpoverty rate
Percentage Change in headcount poverty rate
GDP PC(1976=100)
Percentage Change in GDP per capita
Implied Growth elasticity(ratio of col. II to col. IV)
I II III IV V1976 40.1 100.01978 33.3 -17.0% 113.6 13.6% -1.251980 28.6 -14.1% 126.5 11.4% -1.241984 21.6 -24.5% 147.9 17.0% -1.441987 17.4 -19.4% 161.5 9.2% -2.121990 15.1 -13.2% 194.0 20.1% -0.661993 13.7 -9.3% 231.9 19.5% -0.481996 11.3 -17.5% 278.5 20.1% -0.87
Average -1.15Median -1.24
Table 10 shows the same calculation for the period 1996 to 2008, which is more
complicated by the huge rise and fall in poverty rates during the crisis. I take two periods
as the “start to finish” elasticities: 1996 (pre-crisis) to 2008 or 2000 (post crisis) to 2008.
Both give the same result that the elasticity of poverty reduction with respect to growth
declined to only around .5 (compared to 1.15 or 1.2). But, as both the table and Figure 7
illustrate, this was mainly the result of the anomalous increase in poverty while GDP per
capita was declined during 2005-2006 as otherwise the elasticities are quite similar to
those 1976 to 1996.

Preliminary and Incomplete: 31 9/28/2010For Comments Only
Table 10: Poverty and economic growth and implied elasticities, 1996 to 2008
Year Headcount poverty rate
Percentage Change in headcount poverty rate
GDP PC(1976=100)
Percentage Change in GDP per capita
Implied Growth elasticity(ratio of col. II to col. IV)
I II III IV V1996 17.5 109.82000 19.1 9.6% 100.0 -8.9% -1.072001 18.4 -3.8% 102.2 2.2% -1.702002 18.3 -0.8% 105.5 3.2% -0.262003 17.4 -4.6% 109.1 3.4% -1.352004 16.7 -4.4% 113.1 3.6% -1.202005 16.0 -4.1% 117.9 4.3% -0.972006 17.8 11.1% 122.9 4.2% 2.642007 16.6 -6.6% 129.1 5.1% -1.302008 15.4 -7.0% 135.2 4.7% -1.48
Average -0.70Median -1.25End to end, 2000-2008 -19.4% 35.2% -0.55
End to End, 1996-2008 -11.73% 23.10% -0.51
The second scenario shows what would have happened if there had been the faster
growth rate of 1987-1997 and the elasticity of the 1976-1996 period. In this instance
poverty would be lower by 5 percentage points in 2008 than it actually was, which, given
Indonesia’s population is almost 12 million fewer people in poverty.
Finally, even in the 1976 to 1996 period Indonesia’s poverty elasticity was lower
than might have been expected from international norms, or from the mechanical
calculations of these elasticities from assumptions about the distribution of income and
the poverty line. The fourth scenario shows what poverty would have been had there
been the actual growth rates but a poverty elasticity equal to 2 (a large increase over the
previous period).

Preliminary and Incomplete: 32 9/28/2010For Comments Only
However it is sliced, it appears that poverty declined over the entire period by less
than would have been “expected”—even given the lower overall economic growth rate—
though nearly all of this is because of the sudden rise from 2005-2006 and the subsequent
lack of the return to the previous trend.
This brings us back to the same question: was there any reason to expect that the
democratic transition would have led to more rapid poverty reduction? Changes in the
standard consumption expenditures based poverty head count rates can be exactly
decomposed into three elements: (a) the pure growth effect, shifts in consumption
expenditures (net of taxes or transfers) keeping the shape of the distribution across
households constant, (b) the real income distributional effect, shifts in the consumption
expenditures favorable to the poor due to shifts in the distribution (included in this are
shifts in relative prices, such as goods consumed disproportionately by the poor
becoming relatively more expensive) and (c) shifts in net transfers which would be the
impact of either larger social transfers or improvements in their targeting.
We have seen above that there is no reason to expect more rapid growth following
democratizing transitions for growing countries so this rules out the first effect, but even
compensating for that poverty did not fall as fast so it might appear that factors (b) and
(c) worked against more rapid poverty reduction.
The better distribution of income would have been the name for more “pro-poor”
growth, which one might have expected from a democratic government. However, the
principal difficulty is that in spite of the huge number of references to “pro-poor growth”
or “inclusive growth” or “broad-based growth”6 there is no firm, empirically based,
guidance as to which actual governmental actions or policies might produce such growth. 6 Terms which get 130,000, 611,000 and 475,000 Google hits each.

Preliminary and Incomplete: 33 9/28/2010For Comments Only
Since the distribution of income across households is the result of the complete general
equilibrium outcome of an economy involving millions of firms and individuals taking
investment, production, and consumption decisions it is unlikely that any simple formula
are likely to emerge. In fact, as with any complex problem, it is perfectly possible for
well-meaning but naïve actions to have counter-productive results. For instance, it might
seem that since the main asset of the poor is (unskilled) labor that “pro-labor” actions
would be pro-poor, and that “strengthening” labor production would therefore be pro-
poor. But, it is possible that the increased labor protections are only effective in the
formal sector, where wages are already high, which causes a reduction for demand for
labor in the formal sector which then expands the supply of labor in the informal section
which then reduces the relative wages in the informal sector, which actually increases
poverty. Note that I am not asserting that this is the case, I am just giving an example in
which a democratic government could adopt a seemingly “pro-poor” action (that was also
in some quarters politically popular) than nevertheless actually would, through the
repercussions of the actions of economic agents have exactly the opposite effect.
Another example, might be raising the price of rice by say, banning imports. While it
might seem “pro-poor” as “the poor” are rice farmers, in fact many of the poor are net
consumers of rice so that an increase in the price of rice through a ban on imports—again
an action both politically popular and seemingly “pro-poor”—would actually increase
poverty. Again, the point is not about particular actions but rather that one can hardly
have expected democratic governments to have been more “pro-poor” in the absence of
reliable guidance as to what actions would in fact be pro-poor and that those would be
politically more popular in a democratic arena.

Preliminary and Incomplete: 34 9/28/2010For Comments Only
A second reason that a democratic government might have been expected to have
more rapid poverty reduction is that it would pursue policies of more “pro-poor” public
expenditures, such as larger or better targeted social transfer programs. This might be
true if one were to define poverty broadly, but with a narrow and penurious definition of
poverty that includes only roughly 15 percent of the population it is not at all clear why a
democracy would aggressively target this definition of “poverty.” After all, poverty, in
that sense, affects, at any point in time only one in six citizens whereas in a democracy
you need 50 percent of the votes. Theoretical papers of targeting that I have done with
Jonah Gelbach (e.g. Gelbach and Pritchett 1996) show that voters prefer less sharp
targeting than the poverty minimizing allocation of a fixed budget by a technocrat would
produce---that is, in a simple three income group setting (poor, middle, rich) sharp pro-
poor targeting only emerges when the rich are disproportionately powerful. When the
middle group has a political weight equal to its population share then uniform targeting
(everyone gets a transfer of the same amount) is the “strongest” targeting that is
politically feasible. A recent experimental paper (Alatas, et al 2010) also suggests that
voter satisfaction with sharp “proxy means test” targeting without community
engagement in selection of beneficiaries is not locally popular. So, while naively one
might associated “democracy” and “pro-poor” there is not theoretical or empirical
justification for that when “poor” is construed on narrow consumption expenditure
definitions.
Conclusion

Preliminary and Incomplete: 35 9/28/2010For Comments Only
Looking at the simple numbers or Figure 1 it might seem a reasonable question to ask
“what has Indonesia’s democratic governments done wrong, that growth performance has
been so poor”? But this assumes that a “natural” prediction of growth for a country is its
own past performance. That is perhaps a “natural” assumption in Newtonian physics—
that objects in motion remain in motion—but it is not a natural assumption in any activity
that involves regression to the mean. If you just shot your best round of golf ever, the
best guess is that your next round will be worse.
Moreover, there are reasons to believe, and an analysis of democratic episodes
suggests, that large political transitions create at least a short to medium term slow down
in growth. The estimates in this paper are that for countries that begin an episode of
large, rapid, democratization with above average growth the “expected” deceleration of
growth is 2.2 ppa.
The combination of these benchmarking adjustments is that perhaps the right question
is “what is it about the democratizing transition in Indonesia such that growth decelerated
so little?”
On the other hand, Indonesia appears to have made more progress on control of
corruption that would have been expected after a democratic transition. But on general
“bureaucratic quality” in implementation Indonesia, by the ICRG measures, has made no
progress—but was not expected to make much.
Finally, I cannot do “with and without” democratic transition measures of poverty
reduction, but it does appear that Indonesia made less progress on consumption
expenditure measures of headcount poverty than even could be accounted for by the
lower growth rate.

Preliminary and Incomplete: 36 9/28/2010For Comments Only
References
[to be added]

Preliminary and Incomplete: 37 9/28/2010For Comments Only
Appendix Table A.1: All large democratizing episodes (sorted by change in growth) Country Year Shift in
POLITY(countries larger that +5)
Growth before(t-13 to t-3)
Growth After(t+1 to t+11)
Growth Change
NGA 1979 7 5.8% -2.4% -8.2%ECU 1979 14 5.7% -1.7% -7.4%GRC 1975 7 7.2% 0.0% -7.2%IRN 1979 10 7.1% 0.1% -7.0%ZAR 1992 8 -1.1% -7.2% -6.1%PRT 1976 6 7.1% 1.5% -5.6%NIC 1979 8 1.3% -4.0% -5.3%COG 1992 6 5.7% 0.6% -5.1%DOM 1978 9 5.5% 1.4% -4.1%BGR 1990 15 4.0% -0.1% -4.1%THA 1992 10 4.7% 0.8% -3.9%BRA 1985 10 3.3% -0.3% -3.7%PRY 1989 10 2.7% -0.7% -3.4%MDG 1991 8 1.5% -1.4% -3.0%TWN 1992 8 6.5% 4.0% -2.5%BEN 1990 7 3.6% 1.3% -2.3%MNG 1990 9 4.4% 2.1% -2.3%IDN 1999 11 5.5% 3.3% -2.3%PAN 1989 16 3.9% 1.7% -2.2%PAK 1988 12 3.5% 1.3% -2.2%BOL 1982 15 2.4% 0.3% -2.1%DZA 1989 7 1.7% 0.1% -1.6%ROM 1989 6 2.1% 0.9% -1.3%PHL 1987 7 1.5% 0.8% -0.8%TWN 1987 6 6.4% 5.8% -0.6%ARG 1983 16 1.0% 0.4% -0.6%URY 1985 16 3.4% 3.2% -0.3%KOR 1987 6 5.4% 5.6% 0.2%CYP 1968 7 1.4% 2.0% 0.6%NPL 1990 7 1.3% 1.9% 0.6%MLI 1991 7 1.9% 2.5% 0.6%BGD 1991 11 0.9% 1.6% 0.7%CAF 1993 11 -1.4% -0.6% 0.8%ZMB 1991 15 -2.6% -1.5% 1.1%HUN 1989 6 1.6% 2.8% 1.2%NPL 1981 7 0.7% 2.0% 1.3%IRN 1997 9 1.9% 3.5% 1.7%MWI 1994 14 -0.8% 1.0% 1.8%FJI 1990 8 -0.6% 1.4% 2.0%NIC 1990 7 -1.3% 1.0% 2.3%GTM 1966 8 1.4% 3.8% 2.4%

Preliminary and Incomplete: 38 9/28/2010For Comments Only
DJI 1999 8 -4.9% -2.3% 2.6%ALB 1990 10 0.6% 4.3% 3.7%ETH 1991 8 -2.1% 1.9% 4.1%CHL 1989 9 0.4% 5.3% 4.9%ECU 1968 6 1.3% 6.8% 5.4%POL 1989 11 -1.1% 4.7% 5.8%SLE 1996 11 -1.6% 4.6% 6.2%GUY 1992 13 -5.4% 1.1% 6.4%MOZ 1994 12 -1.0% 6.6% 7.5%HRV 1999 6 -3.2% 5.1% 8.3%LBR 1990 6 -4.0% 5.7% 9.7%

Preliminary and Incomplete: 39 9/28/2010For Comments Only
Appendix Table A.2: All “autocratizing” episodes
Country Year Shift in POLITY
Growth before
Growth After
Growth Change
ZMB 1972 -9 3.8% -5.5% -9.3%GUY 1980 -7 4.7% -1.5% -6.2%GHA 1972 -10 3.8% -0.9% -4.7%ARG 1976 -15 2.8% -1.3% -4.1%ETH 1975 -7 2.0% -1.2% -3.2%BFA 1980 -12 2.5% 0.1% -2.4%SLE 1971 -7 2.8% 0.6% -2.3%PER 1968 -12 2.9% 1.0% -1.9%GRC 1967 -11 5.7% 4.5% -1.2%PAN 1968 -11 3.8% 2.7% -1.2%THA 1976 -10 5.0% 3.9% -1.0%CHL 1973 -13 2.0% 1.0% -1.0%GHA 1981 -13 0.5% 0.6% 0.1%NGA 1984 -14 -0.7% -0.5% 0.2%PHL 1972 -11 1.7% 2.1% 0.5%COG 1997 -11 -1.9% -1.3% 0.6%KOR 1972 -12 4.8% 5.5% 0.6%ZWE 1987 -7 0.2% 1.3% 1.2%MAR 1965 -6 1.6% 2.8% 1.2%BGD 1974 -10 -0.7% 0.6% 1.2%FJI 1987 -12 1.0% 2.8% 1.8%CYP 1963 -8 3.2% 5.1% 1.9%DOM 1963 -8 2.5% 4.5% 2.1%GMB 1994 -15 -1.2% 1.1% 2.3%GNQ 1969 -9 2.2% 4.5% 2.3%BRA 1965 -6 4.3% 6.7% 2.4%PAK 1999 -13 1.8% 4.3% 2.5%URY 1972 -6 -0.3% 2.3% 2.6%MYS 1969 -9 3.2% 5.9% 2.7%PER 1992 -11 -1.5% 1.8% 3.4%SDN 1989 -14 -6.3% 4.9% 11.1%NGA 1984 -14 -0.7% -0.5% 0.2%BGD 1974 -10 -0.7% 0.6% 1.2%GMB 1994 -15 -1.2% 1.1% 2.3%PER 1992 -11 -1.5% 1.8% 3.4%COG 1997 -11 -1.9% -1.3% 0.6%SDN 1989 -14 -6.3% 4.9% 11.1%