Embed Size (px)
Citation preview
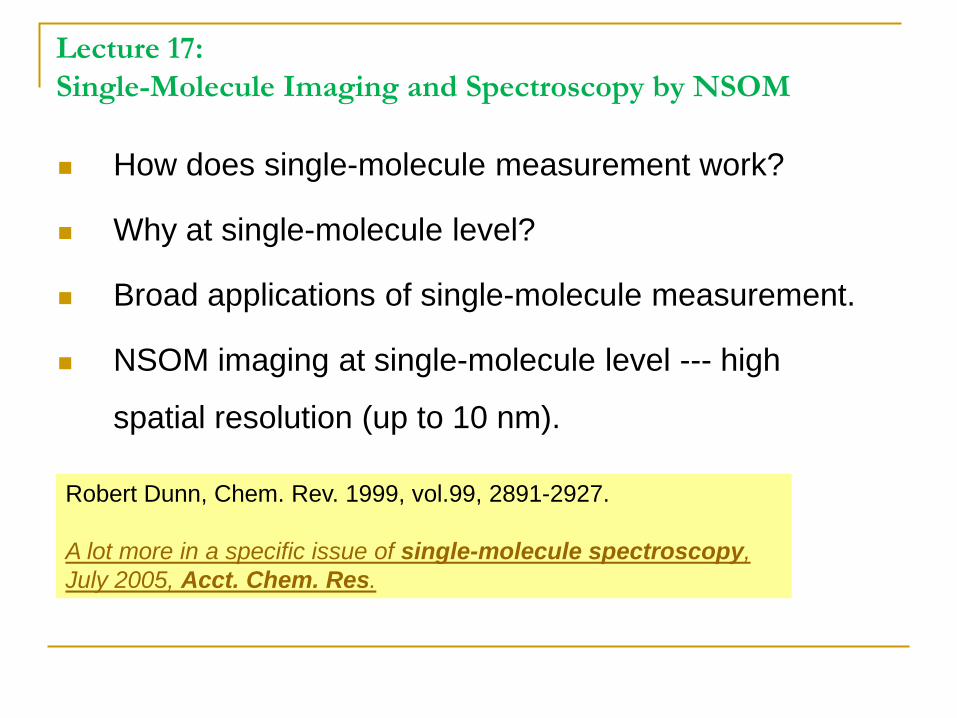
Lecture 17: Single-Molecule Imaging and Spectroscopy by NSOM
How does single-molecule measurement work?
Why at single-molecule level?
Broad applications of single-molecule measurement.
NSOM imaging at single-molecule level --- high
spatial resolution (up to 10 nm).
Robert Dunn, Chem. Rev. 1999, vol.99, 2891-2927.
A lot more in a specific issue of single-molecule spectroscopy, July 2005, Acct. Chem. Res.

Vol. 38, Issue 07July 19, 2005 Cover
The Power of One !
Special Issue on Single-Molecule Spectroscopy

Single-molecule spectroscopy (SMS) was initiated and pioneered by Morener
and others in late 1980’s, and promoted and motivated by the high resolution
investigation of NSOM by Betzig and others in 1993 and 1994.
The ultimate degree of sensitivity for detecting local structure, dynamics,
chemical reactions, and physical processes.
SMS is operated under ambient conditions.
Taking the advantages of high sensitivity of fluorescence detection.
NSOM based SMS provides the capability for local field modulation (bias
between tip and sample substrate) to mimic the field-effect transistor (FET).
Brief Overview of Single-Molecule Imaging and Spectroscopy

Single-molecule calibration of a molecular transistor
Adjust the linker to modulate the electric field effect on charge transfer.

Single Molecule Imaging
Focus on one
Advantages of Single-Molecule Spectroscopy(high resolution and more detailed information)
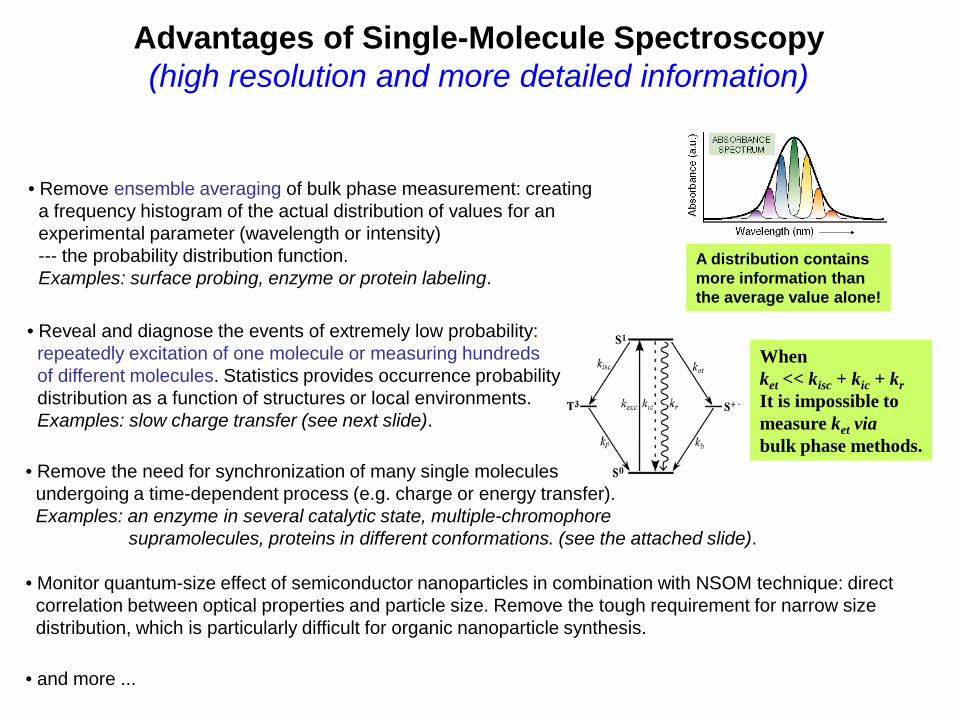
• Remove ensemble averaging of bulk phase measurement: creating a frequency histogram of the actual distribution of values for an experimental parameter (wavelength or intensity) --- the probability distribution function.Examples: surface probing, enzyme or protein labeling.
A distribution contains more information than the average value alone!
• Reveal and diagnose the events of extremely low probability: repeatedly excitation of one molecule or measuring hundreds of different molecules. Statistics provides occurrence probability distribution as a function of structures or local environments.Examples: slow charge transfer (see next slide).
When ket << kisc + kic + krIt is impossible to measure ket viabulk phase methods.
• Remove the need for synchronization of many single molecules undergoing a time-dependent process (e.g. charge or energy transfer). Examples: an enzyme in several catalytic state, multiple-chromophore
supramolecules, proteins in different conformations. (see the attached slide).
• Monitor quantum-size effect of semiconductor nanoparticles in combination with NSOM technique: direct correlation between optical properties and particle size. Remove the tough requirement for narrow size distribution, which is particularly difficult for organic nanoparticle synthesis.
• and more ...

Single-Molecule Imaging: revealing more detailed information
A distribution contains more information than the average value alone!

Single-Molecule Imaging: heterogeneous distribution of intensity
Emission intensity is often used for probing local environments!

Single Molecule Imaging: revealing rare events.
P—P
Pdead—Pdead
Pdead—PdeadP+—P-
P—P
N N
O
O
O
O
NR
O
O
O
O
N R
e-
Zang & Adams et al. J. Am. Chem. Soc. 126 (2004) 16126 -16133.

Single Molecule Imaging: revealing rare events.
Pdead—Pdead
Pdead—P
P—P
Pdead—Pdead
Pdead—P
P+—P-P—P
Pdead—Pdead
Pdead—P
P—P
Pdead—Pdead
Pdead—P
P+—P-P—P
N N
O
O
O
O
NR
O
O
O
O
N R
e-
Zang & Adams et al. J. Am. Chem. Soc. 126 (2004) 16126 -16133.

Some Publications in 2003 Science: single-molecule imaging of proteins
VOL 302 10 OCTOBER 2003, 262
VOL 301 10 AUGUST 2003, 1233

VOL 301 29 AUGUST 2003, 1235VOL 300 27 JUNE 2003, 2061
VOL 302, 19 DECEMBER 2003, 2130
Some Publications in 2003 Science: single-molecule imaging of enzymes

4 major papers from 1 lab in 1 year: all about single-molecule
Science, VOL 312, 16 April 2006, p228Science, VOL 311, 17 March 2006, p1600
Nature, VOL 440, 16 March 2006, p358Nature, VOL 439, 2 Feb. 2006, p621

Typical Applications of Single-Molecule Measurement
• Basic properties of molecules: chemical reactivity, dynamics, optical sensitivity (switching/intensity, probing/wavelength), electrical properties (charge transfer). The modulation of properties can be due to the molecular structure itself, the molecule orientation, or the interaction (location) with the local environment. Three slides (see research by van Hulst, Robert Dunn, W. E, Moerner, Dan Higgins.)
• Molecular electronic devices: contact problem (particularly for a multiple-molecule device), requiring an alternative way to justify the promise --- photodriven charge transfer. PET rate can be correlated to the conductivity via theories. (see research by Paul Barbara, David Adams, De Schryver.)
• Protein conformation and dynamics: protein probing with attached fluorophores. Heterogeneity of localization of fluorophore on proteins and the heterogeneity of protein conformation distribution. (see research by Shimon Weiss, X. Sunney Xie, Robert Dickson, William A. Eaton, Taekjip Ha.)
• Enzyme catalysis: removing the need for synchronization, and thus revealing the multiple active states of an enzyme. (see research by Xiaowei Zhuang, Steve Chu, X. Sunney Xie.)
• Single-virus dynamics: the interaction with living cells (see research by Xiaowei Zhuang).
• DNA conductivity --- one of the huge debates. Huge heterogeneity of DNA configuration (folding, kinks, etc.) and defects.
• Nanocrystals: inorganic vs. organic. (see research by Shuming Nie)

NSOM imaging of molecular orientation
yx
z
Ex2
Ey2
Ez2
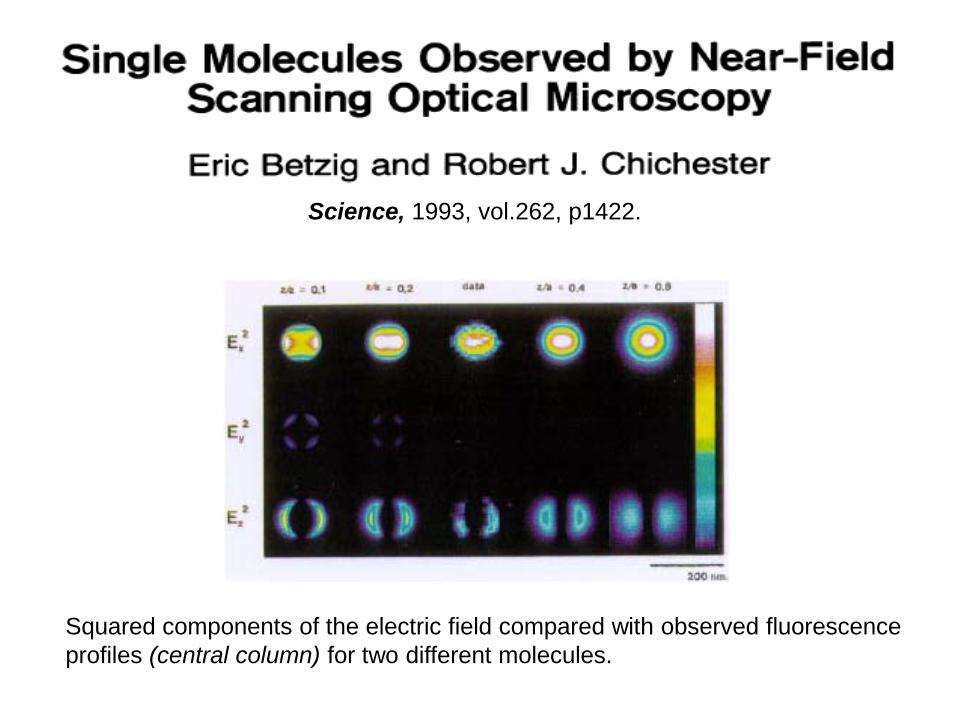
Squared components of the electric field compared with observed fluorescence profiles (central column) for two different molecules.
Science, 1993, vol.262, p1422.

Single-Molecules Embedded in Polymer Films: NSOM imaging reveals the local environmental effects

Two same molecules on the same surface show different emission wavelengths.
Near-field spectroscopy of single-molecule at room temperature
Betzig and Brus, et al. Nature, 1994, vol.262, p1422.

• Emission spectra of single molecules are narrower, relative to the ensemble
spectra obtained in solutions.
• Emission of a single molecule shifts ± 8 nm --- inhomogeneous local
environments.
• Single molecules also exhibit time-dependent shift of up to 10 nm --- different
environment effect at excited states.
Near-field spectroscopy of single-molecule at room temperature
Betzig and Brus, et al. Nature, 1994, vol.262, p1422.

Science, 1994, vol.265, p361.
Sulforhodamine 101

Science, 1994, vol.265, p361.
• Emission modulation by polarization.
• NSOM takes most of advantages of optical microscopes --- highly tunable with polarization.
• High sensitivity of detection by APD.

Fabrication and Evaluation of Molecular Devices:2). Single Molecule Approach with Photochemical Methods

Modulation of Intramolecular Charge Transfer:Solvent Polarity vs. Electric Field
Zang & Adams et al. J. Am. Chem. Soc. 126 (2004) 16126 -16133.

Single-Molecule Probing of Protein Structure
Single-moleculesensor
0 100 200 300 400 5000100200
0 20 40 60 80 100
0100200
Fluo
resc
ence
C
ount
s
Time / sec


• A NSOM system based on operation mode of illumination-collection through the same aperture probe.
• Fluorescence images of single dye molecules were obtained with a spatial resolution of 15 nm, which is smaller than the diameter of the aperture (20 nm) of the probe employed.
• Such super-resolution may be attributable to non-radiative energy transferfrom the molecules to the coated metal of the probe since the resolution obtained in the case of conventional NSOM is limited to 30 - 50 nm due to penetration of light into the metal.
Hosaka, J.Microscopy, 2001, Vol 202, p362
Outline

A NSOM of illumination-collection mode
Hosaka, J.Microscopy, 2001, Vol 202, p362

SEM images of an aperture probe
Hosaka, J.Microscopy, 2001, Vol 202, p362
a side view
an overhead view
cross-sectional illustration
20 nm

A fluorescence image of single dye molecules in a 1 X 1 µm2 area.
Hosaka, J.Microscopy, 2001, Vol 202, p362
High background

Hosaka, J.Microscopy, 2001, Vol 202, p362
Push the NSOM
resolution to the limit.


• Dendritic molecules are regular hyperbranched polymers that originate from a core by means of repetitive reactions.
• With dimensions from few to hundreds of nanometers, they are ideal "molecular platforms" to attach functional groups in well-defined three-dimensionalarchitectures.
In this study:• Individual dendritic molecules adsorbed on glass containing a single
fluorescent rhodamine B core have been observed with NSOM; • height and fluorescence images were obtained simultaneously. • The dendritic assemblies can be discriminated from free fluorescent cores
based on accurate simultaneous mapping of both the fluorescent core and the surrounding dendritic shell. See the slide.
• The full three-dimensional orientation of each individual fluorescent core can be resolved.
• Most dendritic structures exhibited rotational motion of the fluorescent core on a ms time scale, revealing intramolecular conformational dynamics.
Veerman, JPC-A, 1999, vol. 103, p11264
Research Outline


3-D structure of dendrimer

A typical dendrimer with fluorophore core


Veerman, JPC-A, 1999, vol. 103, p11264
Fluorescent core unit (RhB-G0) and building blocks (BB-Cl);
Assembly of the dendritic molecules

AFM image (2 × 2 µm2) showing dispersed spheres corresponding to individual dendritic molecules adsorbed on a glass surface, with a mean height of 7.5 ± 0.5 nm and a mean width of 21 ± 1 nm.
Veerman, JPC-A, 1999, vol. 103, p11264
500 nm

Focused ion beam (FIB) image recorded after side-on milling of the 70 nm apertureNSOM probe that was used for the measurements. The white dot indicates the position of the shear-force sensing local protrusion at the edge of the end-face.
Veerman, JPC-A, 1999, vol. 103, p11264
500 nm

(a) Schematic view of the height tracking of an adsorbed dendritic molecule by a local protrusion on the NSOM probe;
(b) the optical imaging of the fluorescent core-unit by the aperture. Veerman, JPC-A, 1999, vol. 103, p11264

Combined shear-force (gray scale) and fluorescence (red-green color scale) image (a + b) illustrating the correlation between height and optical signals.
Veerman, JPC-A, 1999, vol. 103, p11264
450 nm
NSOM shear-force image (1.65 × 1.65 µm2) showing both isolated and clustered dendritic molecules on a glass surface. Height of spheres: 5-7 nm.
Simultaneously obtained fluorescence image, with ~70 nm optical resolution. Circularly polarized excitation light at 514.5 nm was used. A false-color scale indicates the polarization of the fluorescence (red, horizontal direction; green, vertical direction, yellow, non-polarized or 45o
polarized). Draw a scheme for polarized NSOM system.

Characteristic NSOM single-molecule emission patterns.Resolution: 65 - 90 nm fwhm for the elliptical in-plane molecule patterns; 45 nm fwhm for the double-lobed and ringlike patterns.
Veerman, JPC-A, 1999, vol. 103, p11264
in-plane absorption horizontal dipole orientation
in-plane absorption vertical dipole orientation
out-of-plane tilted absorption dipole orientation:
Excited with linear polarized light.
out-of-plane tilted absorption dipole orientation:
Excited with circular polarized light.

Emission dipole rotational movements visualized by the red-green transitions (red, horizontal direction; green, vertical direction). Rotations occur on a ms time scale.
pixel dwell time, 5 ms; time between successive lines, 4 s.
Veerman, JPC-A, 1999, vol. 103, p11264
a fluorescent dendritic molecule
A smaller assembly of fluorescent core unit
110 nm

Veerman, JPC-A, 1999, vol. 103, p11264
Comments for the next slide:
• The fluorescence of the molecule in region 1 exhibits a strong on-off behavior,
due to the fast molecular rotation.
• Out-of-plane reorientations are observed for the molecule in region 2.
a: the molecular fluorescence pattern is circular and yellow-colored, which
indicates a major in-plane orientation at about 45°.
c: it changes to a double-lobed pattern, which is characteristic for a mainly
perpendicularly (out of plane) oriented dipole.
d: it changes to a elliptical shape, which indicates an in-plane horizontal
orientation along the x-direction.
Draw the 3 orientations on board.

Series of four successive combined shear-force (gray scale) and fluorescence (red-green false-color scale) images of the same area (750 × 750 nm2) obtained with different excitation polarization conditions.
Veerman, JPC-A, 1999, vol. 103, p11264
210 nm
2 adjacent lines.