Embed Size (px)
Citation preview

AAMJAF, Vol. 10, No. 2, 81–115, 2014
© Asian Academy of Management and Penerbit Universiti Sains Malaysia, 2014
ASIAN ACADEMY of MANAGEMENT JOURNAL
of ACCOUNTING and FINANCE
HOW DOES GROUP AFFILIATION AFFECT THE DIVERSIFICATION PERFORMANCE OF FAMILY-
CONTROLLED FIRMS IN MALAYSIA? – A GOVERNANCE PERSPECTIVE
Ng Sin Huei
Faculty of Business, Communications & Law, INTI International University,
Persiaran Perdana BBN, Putra Nilai, 71800 Negeri Sembilan, Malaysia
E-mail: [email protected] ABSTRACT This paper examines the roles of business group affiliations and whether the size and ownership structure of business groups influence the performance outcomes of diversification among family-controlled firms in Malaysia. It presents evidence that agency-driven and thus performance-diminishing firm diversification is more likely to take place in firms affiliated with a family-controlled business group than in independent firms. The findings support the hypothesis that if the benefits of diversification can be captured through group-level diversification, then diversification at the firm level is more of an act of expropriation. In Malaysia, the undue political interference in business that to a certain extent has contributed to a weak enforcement of rules causes the enhanced control of family ownership through the formation of large and structurally complicated business groups to go unchecked. This grants the controlling families opportunities to pursue sub-optimal firm diversification policies that bring them more self-interested benefits at the expense of firm performance. Keywords: family-controlled business groups, firm performance, group size, group structure, agency problems, firm diversification INTRODUCTION As in many other East Asian countries, the majority of firms in Malaysia are highly concentrated in their ownership structure, and families are the most common type of controlling shareholders (World Bank, 2005). A controlling shareholder is the largest shareholder that has the capacity to influence the policies and course of action of the firm. It is reported that about two-thirds of the publicly listed firms in Malaysia have a family as the controlling shareholder (Haslindar & Fazilah, 2009). Controlling families generally enhance their private benefits by engaging in non-value maximisation policy- or strategy-related activities (Shleifer &Vishny, 1997).
Ng Sin Huei
82
The formation of business groups and firm diversification are two such activities that could be part of the strategy of controlling families to facilitate their expropriation activities and strengthen their power for further expropriation. Put differently, business group affiliation and firm diversification are among the corporate governance issues underlying concentrated ownership structures that are specific to Asia or at least more important in Asia (Claessens & Fan, 2002).
In Malaysia, a family-controlled business group is formed when two or more publicly listed firms are simultaneously controlled by the same family (Claessens, Fan, & Lang, 2006; Zuaini & Napier, 2006). In the business group, each firm still enjoys a certain amount of autonomy, such as having its own board of directors and its own management team as well as its own shareholder base (Khanna & Rivkin, 2001). It is thus different from the conglomerate type of business organisation found in the United States whereby the various subordinate businesses do not have such autonomy.
The opportunity to form a low transparency of sprawling, loosely affiliated business groups makes it difficult to determine where control resides and identify and challenge unjust intra-group transactions (transactions between member firms of the group) in which "such networks provide significant opportunity for collusion or other unethical transactions" (Young, Peng, Ahlstrom, Bruton, & Yi, 2008, p. 206). The expanded control (over a number of publicly listed member firms) made possible by business groups increases the chances of controlling families to engage in diversification activities that only benefit themselves without much consideration of the impact on, and often at the expense of, the rest of the shareholders. The larger and the more complicated the structure of a business group, the more serious the problem may be. This is especially true in a country such as Malaysia, where it is widely known that the controlling families of many business groups, particularly the large and complex ones, have close relationships with the ruling party or senior government officials (Gomez & Jomo, 1999; Gomez, 2006).
Family-controlled business groups in Malaysia often operate across a diversified range of activities within a sector as well as across many sectors as diverse as plantation, manufacturing, trading, services, construction and property development (Thillainathan, 1999). Diversification is thus a way for a firm to expand and become larger in Malaysia, and, as mentioned above, larger firms stand a better chance to form 'relationships' with political figures and 'work together' with them for quid-pro-quo benefits (for instance, receiving political patronage for controlling shareholders and funds for politicians and their ruling political party). The information compiled by Gomez and Jomo (1999) shows that many of the firms that are politically well connected to high-ranking political figures are larger firms or business groups that are widely diversified.
Group Affiliation and Diversification Performance
83
Moreover, the controlling shareholders of business groups are more likely to engage in self-interested and dubious diversification activities, as their close connection with the ruling party can shield them from the risk of any serious legal punishment from regulators (Gomez, 2006; Gunasegaram, 2007; Berkman, Cole, & Fu, 2010). Qian, Pan and Yeung (2010) find that firms with political connections perform more poorly than do firms without such connections because controlling shareholders who have political connections "steal more than political ties can bring in" (p. 5). OBJECTIVES OF THE STUDY AND RESEARCH FRAMEWORK From the discussion in the above section, this study aims to achieve the following two-fold objectives for publicly listed family-controlled firms in Malaysia:
(i) To examine the importance of group affiliation in influencing the performance outcomes of firm diversification (Hypothesis 1).
(ii) To examine the moderating influence of group heterogeneity (group
size and group complexity) on the firm diversification-performance relationship (Hypotheses 2a–2b).
The conceptualisation of the study and the relationship between the
objectives of the study and the hypotheses can be seen in the flowchart diagram of the conceptual research framework in Figure 1. The diagram depicts the main and moderating variables involved in the study and their influences on firm performance, as indicated by the numbered hypothesis. The development of the hypotheses as numbered in the diagram is explained and justified in the hypothesis development section.

Ng Sin Huei
84
Figure 1. Conceptual framework of the study
Notes: 1. Arrows ( ) from the main (moderating) variables indicate that the variables are hypothesised
as having an influence (moderating influence) on firm performance. 2. Solid lines joining two variables ( ) indicate an association between the variables. 3. H: hypothesis
LITERATURE REVIEW AND HYPOTHESIS DEVELOPMENT Roles of Business Groups in Firm Diversification Chakrabarti, Singh and Mahmood (2007), who examine the efficiency and performance outcomes of firm diversification between group-affiliated firms and non-group firms in six East Asian countries, state that:
group affiliation often affects the outcomes of diversification. In most cases, the outcomes of diversification differ significantly, though not in a consistent direction, between group-affiliated and non-group firms within and across countries…. This suggests that the nature of business groups varies across country and institutional environments, and that this variation substantially affects the outcomes of their affiliated firms' diversification (p. 117).
The above statement suggests that it is important to conduct more research in different countries and institutional environments to capture the 'contextual variations' that can contribute to the improved understanding of the role of family business groups in affecting the outcomes of diversification in different countries. Khanna and Yafeh (2007), who perform a comprehensive review of the business group literature, also concur with Chakrabarti's et al. (2007) findings that the performance of business groups is connected to the specific institutional environment in which they evolve. Singh, Nejadmalayeri and Mathur (2007) argue that a firm's diversification-performance link will be moderated by it being

Group Affiliation and Diversification Performance
85
part of a large business group because of the possibility of greater information asymmetries, conflicts of interest among member firms, inefficient investment plans and cross-subsidisation in large business groups.
According to Chakrabarti et al. (2007), business groups as a network type of organisation tend to diversify themselves by having affiliates operating in various industries. Chakrabarti et al. (2007) state that "to the extent that diversified groups act as internal markets for affiliated firms, there might be less need and fewer benefits to affiliates diversifying themselves" (p. 102). However, they also mention that using readily available group resources may improve the outcomes of diversification made at the individual firm level. Both anecdotal and empirical evidence shows that member firms in the group diversify (Chang & Hong, 2002). "Because of the expectation that diversification occurs at the group level and not at the individual firm level" (Chakrabarti et al., 2007, p. 102), it is thus intriguing to find out how firm-level diversification can be affected by group affiliation in emerging economies.
Are group-affiliated firms more efficient and perform better in diversification compared to non-group firms? Will member firms in the group benefit more or less from diversifying than non-group firms? Chakrabarti et al. (2007) provide some views on the above questions. Among the advantages of firm-level diversification in business groups according to them are: Firstly, member firms in the group may be able to diversify effectively by taking advantage of 'spillovers' from resource transfers within the group. Secondly, group affiliation may provide "reputation benefits and privileged access" (Chakrabarti et al., 2007, p. 106), which enable member firms to mobilise resources more easily or at lower prices from external parties. Finally, member firms may also gain from the spillover effects of the development of "greater managerial and organisational sophistication and resources" (Chakrabarti et al., 2007, p. 106) that are expected to occur at the group level. Kim, Hoskisson and Wan (2004) find evidence that keiretsu (Japanese business groups)-affiliated firms benefit from keiretsu's internal market when they pursue diversification compared to independent Japanese firms, which generally do not perform well following diversification. Through diversification, business groups are also able to reduce risk and uncertainty in the operation of member firms (Joh, 2003). This has the effect of reducing default and bankruptcy risks.
On the contrary, the inefficient transfer of resources in business groups could cause a group-affiliated firm to relinquish potential investment opportunities if funds/resources are used by the controlling family to subsidise weaker affiliates in the group. Moreover, Lins and Servaes (2002), who examine the value of corporate diversification in seven emerging markets (including Malaysia), find that diversified firms are traded at a discount of 7% compared to

Ng Sin Huei
86
focused firms, and more importantly, the discounts are mainly from group-affiliated diversified firms and less from independent (non-group) diversified firms. They contend that because business groups are able to capture the benefits of diversification through group diversification, there are few reasons for individual firm diversification within groups. Thus, the choice to diversify in member firms is more likely an act of expropriation (Lins & Servaes, 2002). Business groups may use their member firms for excessive diversification that fulfils a personal or family agenda at the expense of firm efficiency and performance (Backman, 1999; Young et al., 2008). As such, agency problems can be more serious among these firms, especially in countries such as Malaysia where the enforcement of the legal and regulatory systems are weak and politicians and businessmen collude to create private benefits (Claessens & Fan, 2002; Low, 2004; Gomez, 2006; Gunasegaram, 2007). The inverse impact of firm diversification on performance could therefore be worse in these firms compared to non-group firms.
Why would member firms in a group diversify when their group can perform the task more effectively? According to Chakrabarti et al. (2007), the research has paid little attention to questions that are related to firm-level diversification in business groups, most likely because past research has been "implicitly relying on the proposition that group diversification substitutes for and precludes affiliated-firm diversification" (Chakrabarti et al., 2007, p. 106). It is thus the intention of this study to fill the gap in the literature to respond to the above question.
From the above discussion, it is believed that the disadvantages of group affiliation outweigh its advantages in influencing the outcomes of firm diversification under the current context of the political-business environment in Malaysia. Thus, it is hypothesised that:
H1: The greater the firm diversification, the lower the performance of the firms. This relationship is more obvious for firms with group affiliation compared to firms without group affiliation.
Moderating Effects of Group Size and Group Structure on the Performance Outcomes of Firm Diversification Not all business groups are alike. Business groups may have various features (group heterogeneity) that could affect firm performance differently (Khanna & Palepu, 2000a; Kim et al., 2004). For instance, the size or scope of a business group is one such feature. Larger business groups consist of more member firms and might therefore be associated with a more complex group structure involving the use of direct as well as indirect equity holdings via a pyramidal structure or

Group Affiliation and Diversification Performance
87
cross-holdings. Thus, this may impose additional governance issues, as indirect holdings via a pyramidal structure or cross-holdings are associated with higher control rights but lower cash flow rights for the controlling shareholders (Claessens, Djankov, & Lang, 2000). This divergence of cash flow and control rights could lead to a greater inclination for the controlling shareholders to expropriate the minority shareholders. One such activity is to restrain dividend payments and invest free cash flows into questionable business diversifications for empire-building and enhanced private benefits of control. Lins and Servaes (2002) discover that a 'diversification discount' is commonly found in firms where there is a considerable difference in the management's cash flow rights and control rights.
In addition, the complexity of the ownership structure of large business groups fosters a greater tendency of controlling shareholders to expropriate because the expropriatory activities or transactions that occur within the internal markets of business groups can be easily concealed and undiscovered. For instance, instead of paying dividends, the earnings are retained and reinvested to diversify and expand into various business lines. In such circumstances, as explained above, opportunities arise, particularly for large or structurally complicated business groups, to be involved in asset transactions that benefit the controlling families at the expense of firm performance and minority shareholders' interests [for example, using the target firm to purchase assets (as part of diversification activities) from the private companies owned by the controlling families at a price higher than the market rate]. As highlighted earlier, such expropriation activities could be more prevalent in business groups that have close political connections. It is believed that these political connections are more prevalent and clearly displayed in large or complex business groups (Gomez & Jomo, 1999; Searle, 1999; Nazli & Weetman, 2006; Sahoo, 2010; Yeoh, 2010). Accordingly, larger or more complex business groups may tend to engage more in the above-mentioned 'agency-driven' diversification, which would in turn negatively affect the performance of group-affiliated firms.
A business group has a choice of whether to undertake diversification at the group or firm level. A smaller business group with a small number of firms (simple structure) may not be as diversified as a large group. However, the less-diversified nature of smaller groups can be compensated for by increasing the diversification at the firm level. In other words, the affiliated firms can be used to advance the group's activities into different industries and business sectors. With this reasoning, a large or a structurally complicated business group is capable of proceeding with group diversification through its numerous affiliated firms that are involved in different industries (Chakrabarti et al., 2007). Therefore, the group does not need to undertake diversification at the firm level as much as a smaller business group does. Thus, in this case, firm-level diversification would
Ng Sin Huei
88
be negatively related to the size and structure of the business group, and this in turn would affect the performance of the firms in the group.
In contrast, Khanna and Palepu (2000a) observe that the majority of small and medium-sized business groups in India do not have the "management skills, the internal processes, or the political connections to generate benefits from diversification" (p. 888). As a result, coupled with the poor monitoring institutions in India, these business groups are susceptible to serious agency problems, and consequently, the member firms of these business groups generally perform worse than the independent (non-group) firms. Moreover, large business groups have the scale and scope to internalise the costs associated with creating internal structures and processes more efficiently and are subsequently capable of creating added value for member firms (Khanna & Palepu, 2000a). In addition, larger business groups are conceivably more able than smaller business groups to offer 'valuable, rare and inimitable resources' to their member firms, which will in turn enhance the outcomes of the firms' diversification efforts and subsequently improve their performance.
In short, group size and complexity could affect the way in which diversification is undertaken at the firm level. From the above discussion, even though larger business groups may bring some advantages that improve the firm's diversification outcomes, it is postulated that in Malaysia, a country with relatively weak enforcement of public and corporate governance systems coupled with a relatively small economy (where a large business group in Malaysia may not be 'large' in India); the influence of group size and group complexity on the performance outcomes of diversification is a negative one. Therefore, the following hypothesis is proposed:
H2a: The size of business groups moderates the effect of firm diversification on firm performance.
H2b: The complexity of group structure moderates the effect of firm
diversification on firm performance. SAMPLE SELECTION AND DATA COLLECTION The sample in this study is based on the 2008 data of 632 publicly listed firms on the Main Board of Bursa Malaysia.1 All publicly listed firms are classified by Bursa Malaysia into 'sectors' based on their core business. This sector classification enables sector effects to later be taken into account in the regression analysis. Companies from the Second Board were excluded from the selection

Group Affiliation and Diversification Performance
89
because the listing requirements of the Second Board are different from the Main Board, rendering them incomparable.
Of the 11 sectors that were identified by Bursa Malaysia, 4 sectors, namely 'Finance', 'Hotels', 'Mining' and Infrastructure Project Companies ('IPC') were excluded from the study. The finance sector is excluded from the study because firms in this sector are governed by a different set of rules and regulations, which makes them incomparable to firms in other sectors. The exclusion of the finance sector is also consistent with previous studies in this area (for instance in Claessens et al., 2006; Jiraporn, Kim, Davidson, & Singh, 2006; Zuaini & Napier, 2006; Andres, 2008; Estrin, Poukliakova, & Shapiro, 2009). The other three sectors were excluded because the number of firms in each sector is too small to provide any meaningful analysis. The remaining 565 firms were from the 7 core sectors, namely, the 'Consumer Products', 'Industrial Products', 'Technology', 'Properties', 'Trading', 'Plantations', and 'Construction' sectors.
This study uses Krejcie and Morgan's (1970) method as a starting point for determining a suitable sample size based on the total number of firms.2 The final sample of 314 firms in this study is derived based on the selection process, as shown in Table 1. The advantage of the above process of data sampling is that it ensures that all 7 core sectors in the stock exchange are included, with the number of observations in each sector as proportionate as possible to the actual number of firms in each sector of the stock exchange. It also ensures that firms of various sizes are satisfactorily covered in the sample.
Table 1 Selection process of sample
Description Number of firms
Total number of listed firms on Bursa Malaysia (Main Board) as of September2008
632
less Finance, IPC, Hotel and Mining sectors 67 Remaining firms in the main board 565 Firms stratified into sectors and two-thirds selected from each
sector using systematic sampling 379
less Firms whose largest ultimate owner is NOT family or
individual (state, foreign firms, widely held firms and firms without ultimate owners)
65
Final sample 314
Ng Sin Huei
90
VARIABLES Firm Diversification Variables Firm diversification data used in this study are based on information in the 'Segmental Disclosure' in 'Notes to the Financial Statements' of company annual reports. Ayoib, Ishak and Manaf (2003) and Zuaini and Napier (2006) also use segmental disclosures in annual reports to measure the diversification of firms in Malaysia. All publicly listed firms in Malaysia are required by the Malaysian Companies Act 1965 to disclose their revenues and profits before taxes for each segment of business in which they are involved. The disclosure of the business segment must abide by the FRS114 (Segment Reporting) issued by the Malaysian Accounting Standard Board (MASB).3 Specifically, following FRS114 (Segment Reporting), publicly listed firms are required to report information for business and geographical segments whose revenue, assets or net profit is at least 10% or more of the total consolidated amount.
Due to controversy surrounding the appropriateness of different measures of firm diversification as highlighted by Robins and Wiersema (2003), this study employs several types of diversification measures to improve the robustness of the findings. The use of several measures of diversification is also consistent with previous studies such as those by Lee, Peng and Lee (2008) and Denis, Denis and Sarin (1997). The following measures of diversification are used in this study:
(i) Dummy variable – firms are classified as 'diversified' or 'focused' based on the number of segments disclosed. Firms that fulfil the following conditions are classified as diversified: with more than a single segment and where the sales in the largest segment are less than 90% of total sales. Firms that do not fulfil the conditions are classified as focused (Claessens, Djankov, Fan, & Lang, 1999; Lins & Servaes, 2002; Fauver & Naranjo, 2003).
(ii) The number of business segments as disclosed in the annual reports. This
measure is used in Denis et al. (1997) and Zuaini and Napier (2006).
(iii) The Herfindahl (H) Index – constructed from sales and a common measure used in many previous studies examining diversification issues (such as Lang & Stulz, 1994; Denis et al., 1997; Chen & Ho, 2000).

Group Affiliation and Diversification Performance
91
(iv) The entropy measure – introduced by Jacquemin and Berry (1979) and Palepu (1985), also widely used by previous studies, for instance, by Singh et al. (2007), Chakrabarti et al. (2007) and Kim et al. (2004).
The H index is calculated as follows for each firm i:
H = Σ(sales per segment/total sales)2
The H Index ranges from 0 to 1. The closer an H Index is to 1, the more a firm's sales are concentrated within a few of its segments, and the closer it is to 0, the greater the firm diversification is. Entropy (E) is calculated as follows for each firm i:
1
ln(1 / )n
ii
E Pi P=
=∑
where Pi is the ith business segment's sales divided by the firm's total sales, and n is number of the firm's business segments. ln (1/Pi) is the logarithm of the inverse of a business segment's sales over the total sales. The higher the E, the greater the firm diversification.
Group Affiliation Variable Group-affiliated firms are defined in this study as firms that are under the control of the same/common controlling family. Control can be achieved by the controlling family by either the direct or indirect holding of shares through another firm(s) (which can be publicly listed or privately held).4 The criterion used to define a firm as family-controlled is based on the '10% cut-off level' definition used in two often-cited influential studies: La Porta, Lopez-De-Silanes and Shleifer (1999) and Claessens et al. (2000). A family or an individual5 is considered as the 'controlling family' when they collectively hold at least a 10% cut-off level of the total shares of the firm and serve as the largest shareholder of the firm.6 Listed firms that share the same ultimate controlling owner are considered as affiliated with the same business group.
Information on whether a firm is affiliated with a business group can be traced from the firm's annual reports under the sections 'Corporate Structure' and 'Directors' Profile' (for some business groups, some of their affiliated firms have the name of the group as part of their names and thus can be easily identified, for instance, Lion Diversified, Lion Industries, Lion Firm and Lion Forest Industries are firms affiliated with the Lion Group). Firms are required to disclose in their annual report (usually in the 'Directors' Profile' section) whether a board director

Ng Sin Huei
92
also holds a directorship in another firm(s), and the name of that firm must be disclosed if it is publicly listed. These disclosures enable the researcher to link firms that are affiliated with one director. Firms affiliated with the same business group can then be identified once it is confirmed that the director is a member of the controlling family. It is found that most members of controlling families with multiple directorships in more than one listed firm are directors occupying senior positions such as board chairman, vice chairman or managing director/CEO. Firm Performance Variables Due to the lack of consensus in the literature with regard to the choice of firm performance measures, it is thus difficult to identify a single indicator for firm performance. This study opts to use both accounting-based return on assets (ROA) and the stock-market-based simplified Tobin's Q as the proxies to measure firm performance. The use of alternate measures is intended to help verify the robustness of the results (Haniffa & Hudaib, 2006). Both measures are widely used as the only performance measures in previous studies (such as in Khanna & Palepu, 2000a; Anderson & Reeb, 2003; Haniffa & Hudaib, 2006; George & Kabir, 2008; Andres, 2008; Masulis, Pham, & Zein, 2011).
For the ROA data, due to the presence of extreme values at both extremes of the data (very high negative and positive ROA values), the data are winsorised at its 1st and 99th percentiles. In contrast, for the data of simplified Tobin's Q, due to the presence of extreme values only at one extreme of the data (very high positive Q values),7 winsorisation is applied only to the extreme positive values. Winsorisation has the advantage of correcting the skewness in the distribution of the data and improving their statistical properties (such as normality) (Salkind, 2010). It also "preserves the information that a case had among the highest (or lowest) values in a distribution but protects against some of the harmful effects of outliers" (Salkind, 2010, p. 1637). The method to winsorise data at their 1st and 99th percentiles is used, for instance, by Guest and Sutherland (2010) in their study of business group affiliation and firm performance in China. Chen and Chen (2012) winsorise their data at the 5th and 95th percentiles in their study of how various aspects of corporate governance structures affect the resource allocation efficiency of diversified firms. Other Control Variables This study includes several other control variables that are considered important in affecting firm performance. These variables are firm size, firm age, the gearing ratio and sector classification. They are frequently used as control variables in multiple regression analyses in the relevant literature. For instance, the control variables used by Khanna and Palepu (2000a), Douma, George and Kabir (2006)
Group Affiliation and Diversification Performance
93
and George and Kabir (2008) are very similar to those mentioned above. It should be noted that a broad range of sector classifications as per Bursa Malaysia's sector classification system are used due to the reliability issue of classifying Malaysian firms into more refined groupings using such coding systems as the SIC. This is also consistent with common practice in the literature involving Malaysian firms (for instance, by Tam & Tan, 2007 and Haniffa & Hudaib, 2006). Sectors are dummy-coded for the purpose of regression analysis where one of the sectors serves as the control. METHODS AND MODEL SPECIFICATIONS Multiple regressions based on the ordinary least square (OLS) estimation technique are used to test the hypotheses in this study. Masulis et al. (2011), Claessens et al. (2006), and Khanna and Palepu (2000a) also rely on OLS in their analyses. OLS is appropriate, as it is the most straightforward regression technique, and the estimation is reliable as long as common regression problems are accounted for. All issues commonly associated with regression, such as normality, multicollinearity and heteroscedasticity, are addressed in the study using appropriate steps or measures. Moderated regression analysis (MRA) is also used in this study whenever suitable to predict the moderating effects of an independent variable on firm performance.
The following regression specification is used separately to test the hypothesis of whether the negative influence of firm diversification on firm performance is more prevalent in group-affiliated firms than in non-group firms (Hypothesis 1):
PERMi = α + υ DVSFi + θ Xi + εi (Specification 1)
where: PERM refers to firm performance as measured by ROA and Tobin's Q; DVSF is firm diversification measured by the four diversification measures, respectively, as stated earlier: Diversification Dummy, Number of Business Segments, H Index, and Entropy. The focus is on the coefficient value, υ, in which a positive value for υ (for H index) or a negative value for υ (for the 'Diversification Dummy', 'Number of Segments' and 'Entropy' measures) is an indication of a negative association between the level of firm diversification and performance, and vice versa. X is a vector of control variables, as stated earlier. Alpha (α) is the constant term, ε is the error term and subscript i denotes individual firms. θ is the corresponding vector of the estimated coefficient for the control variables.

Ng Sin Huei
94
The next regression specification is used to test the hypothesis on the moderating effect of the size of the business group on the firm diversification-performance link:
PERMi = α + υ DVSFi + ζ GRSZ +β GRSZ*DVSFi + θ Xi + εi
(Specification 2) where: GRSZ is a dummy variable for group size, which consists of three categories of group sizes: GR_A for firms affiliated with small business groups that consist of only two publicly listed firms; GR_B for firms affiliated with medium business groups that consist of three to four publicly listed firms; and GR_C for firms affiliated with large business groups that consist of five or more publicly listed firms. ζ refers to the estimated coefficient for GRSZ. The categorisation of group size in this case is somewhat arbitrary, as in Khanna and Palepu (2000a). The moderating effects of different sizes of business groups on the diversification-performance link can be determined from the coefficients υ and β. Different regression models using different group sizes are employed in the specification.
The last regression specification is used to test the hypothesis on the moderating effect of the complexity of the group structure on the firm diversification-performance link:
PERMi = α + υ DVSFi + ζ GRSTRUC +β GRSTRUC*DVSFi + θ Xi + εi
(Specification 3)
where: GRSTRUC is a dummy variable for the complexity of the group ownership structure, which consists of three levels of complexity: BG_S for firms affiliated with simple business groups without a pyramidal structure; BG_PS for firms affiliated with business groups with a pyramidal structure; and BG_CS for firms affiliated with business groups with a somewhat more complicated pyramidal structure. In BG_S, the controlling family is the largest shareholder that owns an equity stake of the publicly listed firms directly or indirectly (through their privately held firms). There is no pyramidal structure involving publicly listed firms in the group. In BG_PS, there is at least one publicly listed firm in the group that is indirectly controlled by the family through another (one) publicly listed firm. In BG_CS, there is at least one publicly listed firm in the group that is simultaneously controlled by two or more other publicly listed firms belonging to the same group in which these firms are controlled by an ultimate controlling family.

Group Affiliation and Diversification Performance
95
DESCRIPTIVE STATISTICS For ease of reference, a list of abbreviations used in this study, together with a definition/explanation, is presented in Table 2. Table 2 List of abbreviations, variables and operationalisation
Abbreviation Variable Operationalisation
ROA Return on Assets EBITDA / Total assets Tobin's Q or Q Simplified Tobin's Q (Market value of equity + Book value of total liability)
/ Book value of assets GR_A Small-sized business
group Dummy is 1 if the firm is affiliated with a business group with only two publicly listed affiliates; 0 otherwise.
GR_B Intermediate-sized business group
Dummy is 1 if the firm is affiliated with a business group with three to four publicly listed affiliates; 0 otherwise.
GR_C Large-sized business group
Dummy is 1 if the firm is affiliated with a business group with five or more publicly listed affiliates; 0 otherwise.
BG_S Business Group with a Simple Structure
Dummy is 1 if the firm is affiliated with a business group without a pyramidal structure; 0 otherwise.
BG_PS Business Group with a Pyramidal Structure
Dummy is 1 if the firm is affiliated with a business group with a pyramidal structure (at least one publicly listed firm in the group that is indirectly controlled by the family through another publicly listed firm); 0 otherwise.
BG_CS Business Group with a Complicated Pyramidal Structure
Dummy is 1 if the firm is affiliated with a business group with a complicated pyramidal structure (at least one publicly listed firm in the group that is controlled by two or more other publicly listed firms belonging to the same group); 0 otherwise.
E ENTROPY or E value E = ∑Pi LN(1/Pi) where Pi is the i-th business segment's sales divided by the firm's total sales. The higher the E, the greater the firm diversification.
HERF Herfindahl or H Index H = Σ(Sales per segment/total sales)2. The lower the H, the greater the firm diversification.
NUM_SEG Number of Segments The number of business segments as reported in the company's annual reports.
DVSF_D Diversification Dummy Dummy is 1 if the firm has more than a single business segment and where the sales in the largest segment are less than 90% of total sales; 0 otherwise.
(continued on next page)
Ng Sin Huei
96
Table 2 (continued)
Abbreviation Variable Operationalisation
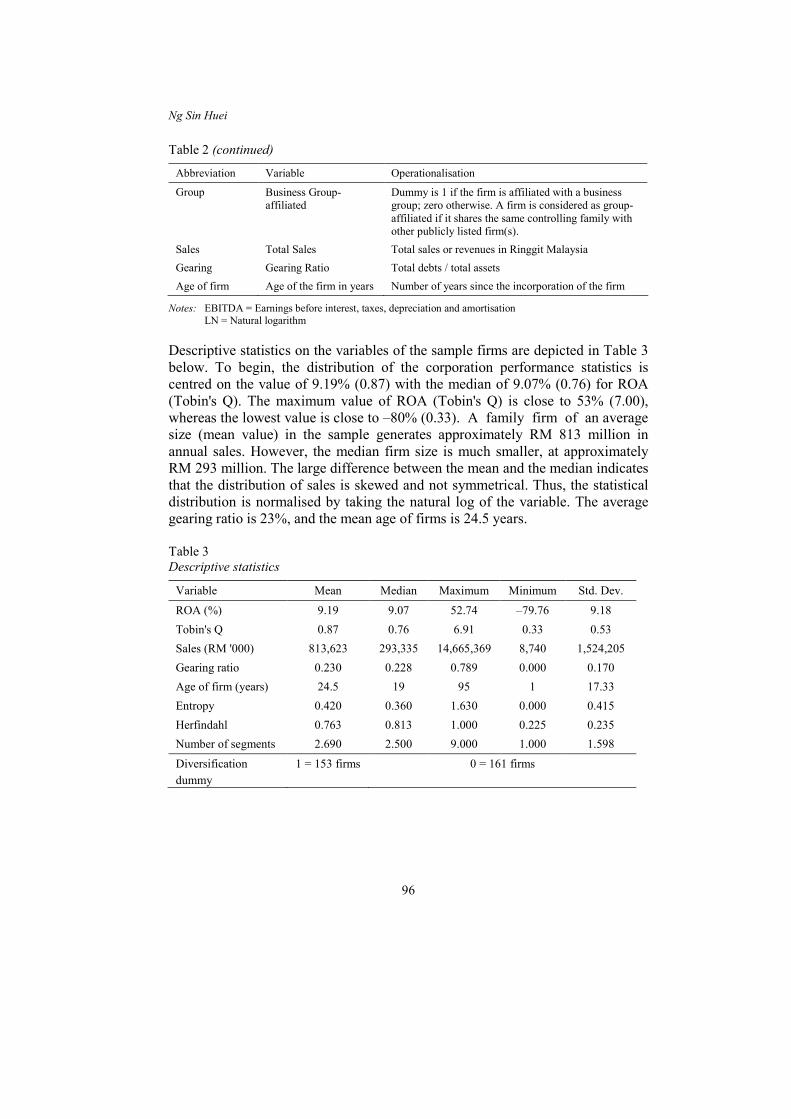
Group Business Group-affiliated
Dummy is 1 if the firm is affiliated with a business group; zero otherwise. A firm is considered as group-affiliated if it shares the same controlling family with other publicly listed firm(s).
Sales Total Sales Total sales or revenues in Ringgit Malaysia Gearing Gearing Ratio Total debts / total assets Age of firm Age of the firm in years Number of years since the incorporation of the firm
Notes: EBITDA = Earnings before interest, taxes, depreciation and amortisation LN = Natural logarithm Descriptive statistics on the variables of the sample firms are depicted in Table 3 below. To begin, the distribution of the corporation performance statistics is centred on the value of 9.19% (0.87) with the median of 9.07% (0.76) for ROA (Tobin's Q). The maximum value of ROA (Tobin's Q) is close to 53% (7.00), whereas the lowest value is close to –80% (0.33). A family firm of an average size (mean value) in the sample generates approximately RM 813 million in annual sales. However, the median firm size is much smaller, at approximately RM 293 million. The large difference between the mean and the median indicates that the distribution of sales is skewed and not symmetrical. Thus, the statistical distribution is normalised by taking the natural log of the variable. The average gearing ratio is 23%, and the mean age of firms is 24.5 years.
Table 3 Descriptive statistics
Variable Mean Median Maximum Minimum Std. Dev.
ROA (%) 9.19 9.07 52.74 –79.76 9.18 Tobin's Q 0.87 0.76 6.91 0.33 0.53 Sales (RM '000) 813,623 293,335 14,665,369 8,740 1,524,205 Gearing ratio 0.230 0.228 0.789 0.000 0.170 Age of firm (years) 24.5 19 95 1 17.33 Entropy 0.420 0.360 1.630 0.000 0.415 Herfindahl 0.763 0.813 1.000 0.225 0.235 Number of segments 2.690 2.500 9.000 1.000 1.598
Diversification dummy
1 = 153 firms 0 = 161 firms
Group Affiliation and Diversification Performance
97
The mean (median) values of the Entropy, H Index and Number of Segments are 0.420 (0.360), 0.763 (0.813) and 2.69 (2.5), respectively. As a comparison, Zuaini and Napier (2006) report a Herfindahl Index of 0.71 and an average number of 2.36 segments from their sample of 355 Malaysian firms in 2001, whereas Ayoib et al. (2003) report an average number of 2.30 segments from their sample of 219 Malaysian firms in 1995. This suggests that the firm diversification scenario has changed little since before the 1997 Asian Financial Crisis (AFC).
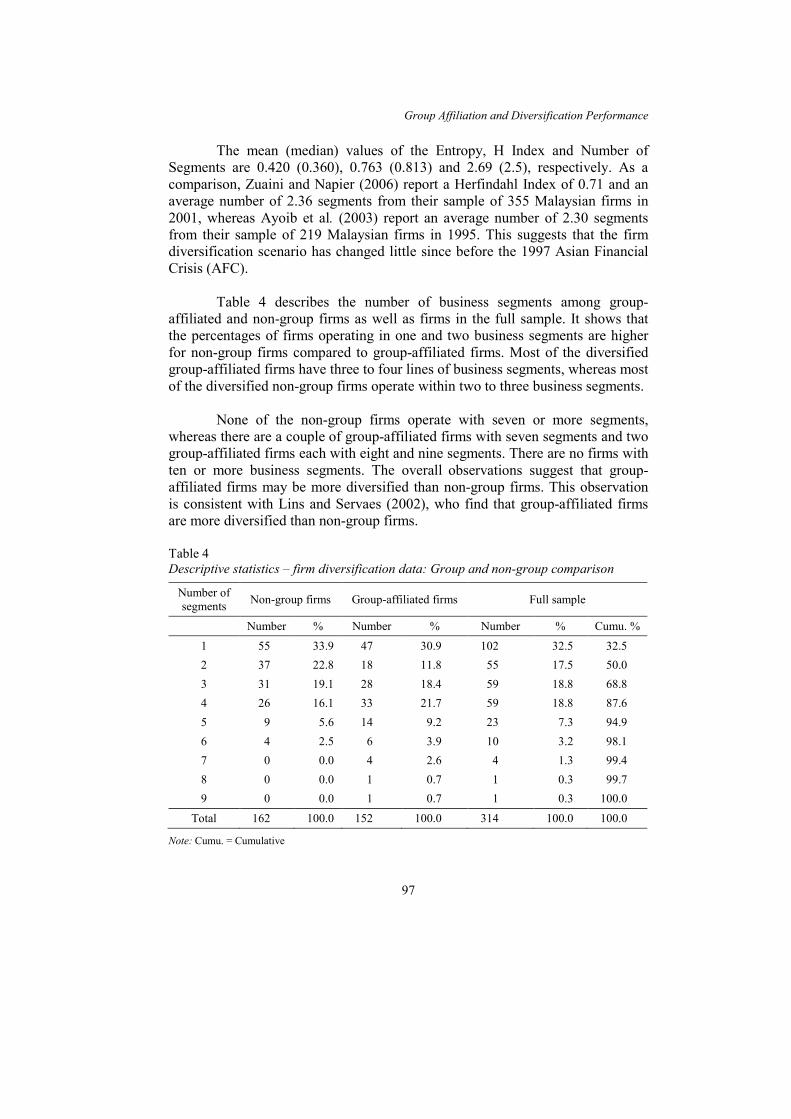
Table 4 describes the number of business segments among group-affiliated and non-group firms as well as firms in the full sample. It shows that the percentages of firms operating in one and two business segments are higher for non-group firms compared to group-affiliated firms. Most of the diversified group-affiliated firms have three to four lines of business segments, whereas most of the diversified non-group firms operate within two to three business segments.
None of the non-group firms operate with seven or more segments, whereas there are a couple of group-affiliated firms with seven segments and two group-affiliated firms each with eight and nine segments. There are no firms with ten or more business segments. The overall observations suggest that group-affiliated firms may be more diversified than non-group firms. This observation is consistent with Lins and Servaes (2002), who find that group-affiliated firms are more diversified than non-group firms. Table 4 Descriptive statistics – firm diversification data: Group and non-group comparison
Number of segments Non-group firms Group-affiliated firms Full sample
Number % Number % Number % Cumu. %
1 55 33.9 47 30.9 102 32.5 32.5 2 37 22.8 18 11.8 55 17.5 50.0 3 31 19.1 28 18.4 59 18.8 68.8 4 26 16.1 33 21.7 59 18.8 87.6 5 9 5.6 14 9.2 23 7.3 94.9 6 4 2.5 6 3.9 10 3.2 98.1 7 0 0.0 4 2.6 4 1.3 99.4 8 0 0.0 1 0.7 1 0.3 99.7 9 0 0.0 1 0.7 1 0.3 100.0
Total 162 100.0 152 100.0 314 100.0 100.0
Note: Cumu. = Cumulative
Ng Sin Huei
98
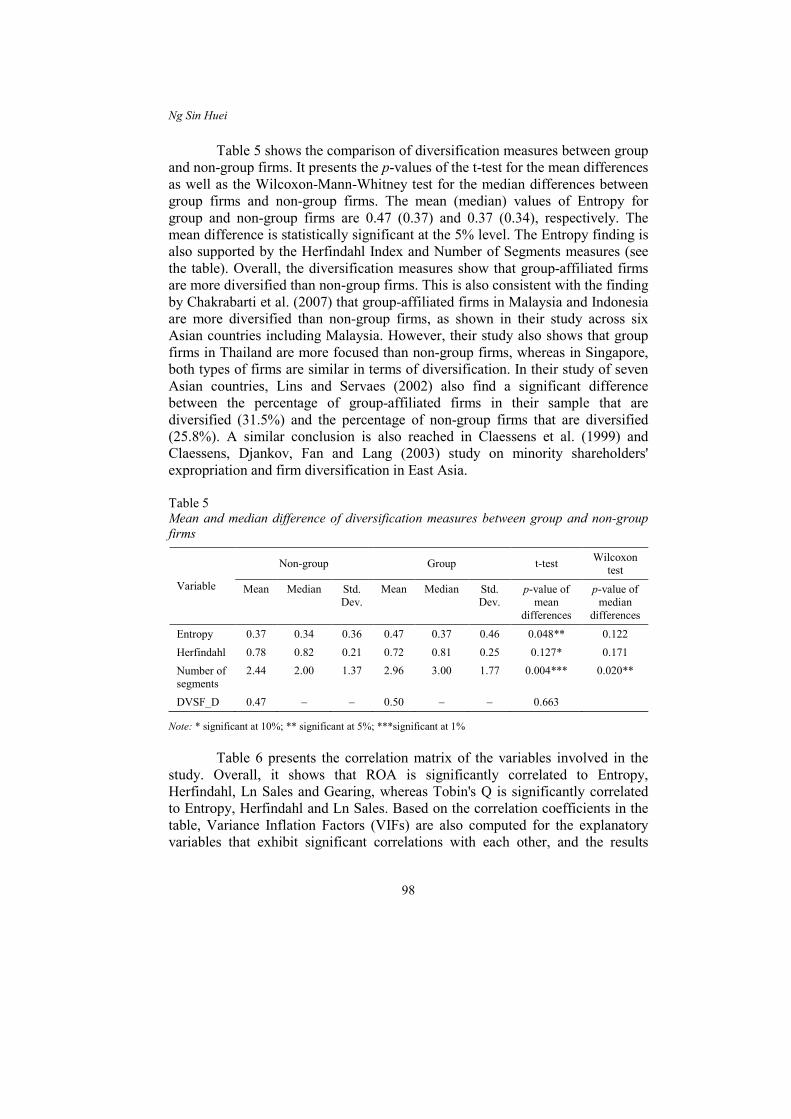
Table 5 shows the comparison of diversification measures between group and non-group firms. It presents the p-values of the t-test for the mean differences as well as the Wilcoxon-Mann-Whitney test for the median differences between group firms and non-group firms. The mean (median) values of Entropy for group and non-group firms are 0.47 (0.37) and 0.37 (0.34), respectively. The mean difference is statistically significant at the 5% level. The Entropy finding is also supported by the Herfindahl Index and Number of Segments measures (see the table). Overall, the diversification measures show that group-affiliated firms are more diversified than non-group firms. This is also consistent with the finding by Chakrabarti et al. (2007) that group-affiliated firms in Malaysia and Indonesia are more diversified than non-group firms, as shown in their study across six Asian countries including Malaysia. However, their study also shows that group firms in Thailand are more focused than non-group firms, whereas in Singapore, both types of firms are similar in terms of diversification. In their study of seven Asian countries, Lins and Servaes (2002) also find a significant difference between the percentage of group-affiliated firms in their sample that are diversified (31.5%) and the percentage of non-group firms that are diversified (25.8%). A similar conclusion is also reached in Claessens et al. (1999) and Claessens, Djankov, Fan and Lang (2003) study on minority shareholders' expropriation and firm diversification in East Asia.
Table 5 Mean and median difference of diversification measures between group and non-group firms
Variable
Non-group Group t-test Wilcoxon test
Mean Median Std. Dev.
Mean Median Std. Dev.
p-value of mean
differences
p-value of median
differences
Entropy 0.37 0.34 0.36 0.47 0.37 0.46 0.048** 0.122 Herfindahl 0.78 0.82 0.21 0.72 0.81 0.25 0.127* 0.171 Number of segments
2.44 2.00 1.37 2.96 3.00 1.77 0.004*** 0.020**
DVSF_D 0.47 – – 0.50 – – 0.663
Note: * significant at 10%; ** significant at 5%; ***significant at 1%
Table 6 presents the correlation matrix of the variables involved in the study. Overall, it shows that ROA is significantly correlated to Entropy, Herfindahl, Ln Sales and Gearing, whereas Tobin's Q is significantly correlated to Entropy, Herfindahl and Ln Sales. Based on the correlation coefficients in the table, Variance Inflation Factors (VIFs) are also computed for the explanatory variables that exhibit significant correlations with each other, and the results
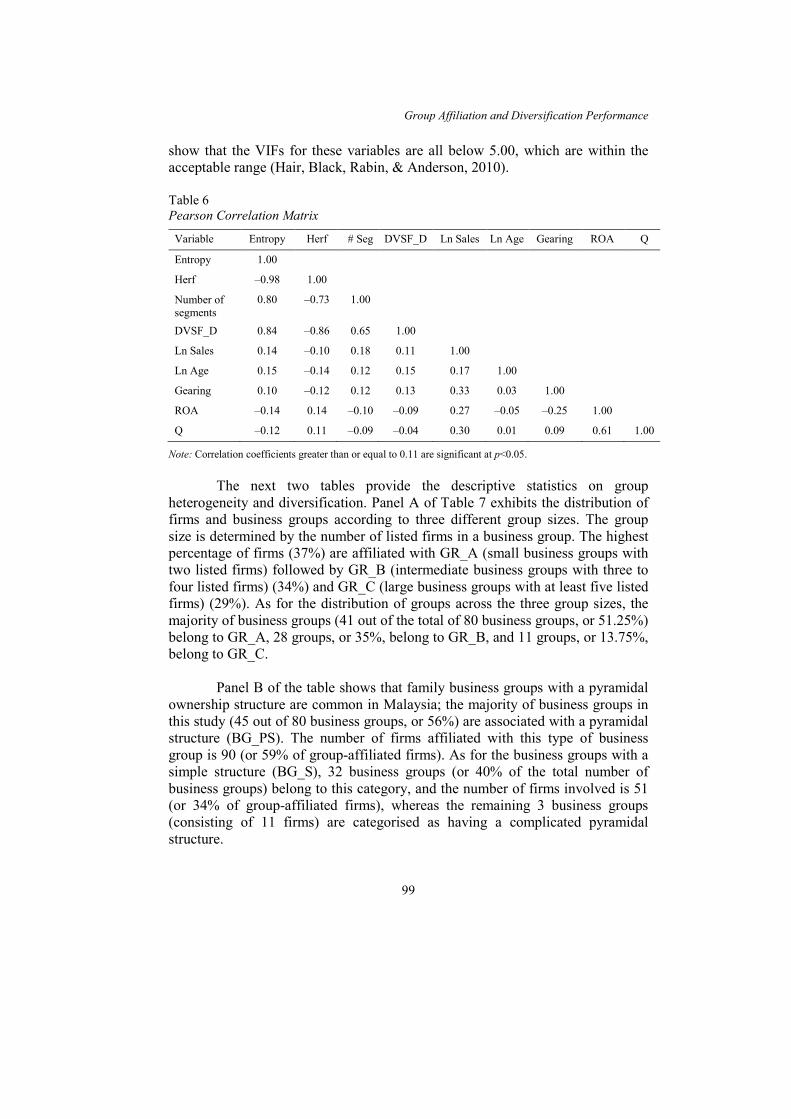
Group Affiliation and Diversification Performance
99
show that the VIFs for these variables are all below 5.00, which are within the acceptable range (Hair, Black, Rabin, & Anderson, 2010). Table 6 Pearson Correlation Matrix
Variable Entropy Herf # Seg DVSF_D Ln Sales Ln Age Gearing ROA Q
Entropy 1.00
Herf –0.98 1.00
Number of segments
0.80 –0.73 1.00
DVSF_D 0.84 –0.86 0.65 1.00
Ln Sales 0.14 –0.10 0.18 0.11 1.00
Ln Age 0.15 –0.14 0.12 0.15 0.17 1.00
Gearing 0.10 –0.12 0.12 0.13 0.33 0.03 1.00
ROA –0.14 0.14 –0.10 –0.09 0.27 –0.05 –0.25 1.00
Q –0.12 0.11 –0.09 –0.04 0.30 0.01 0.09 0.61 1.00
Note: Correlation coefficients greater than or equal to 0.11 are significant at p<0.05.
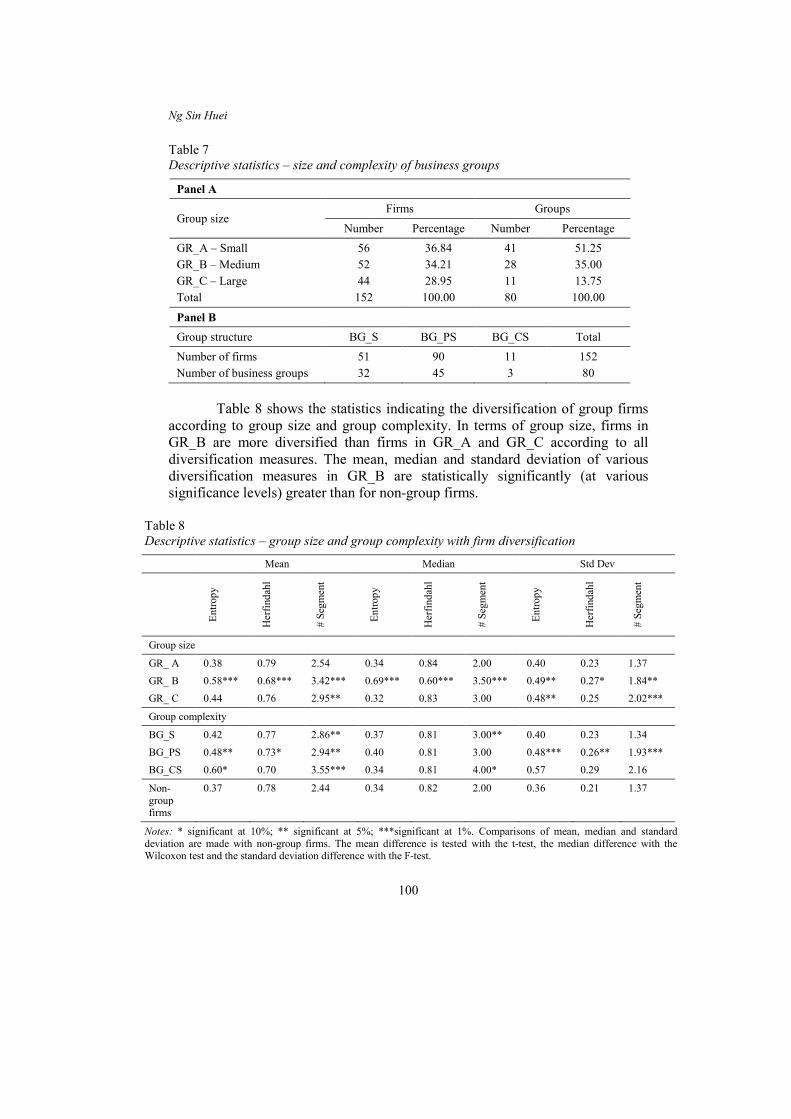
The next two tables provide the descriptive statistics on group heterogeneity and diversification. Panel A of Table 7 exhibits the distribution of firms and business groups according to three different group sizes. The group size is determined by the number of listed firms in a business group. The highest percentage of firms (37%) are affiliated with GR_A (small business groups with two listed firms) followed by GR_B (intermediate business groups with three to four listed firms) (34%) and GR_C (large business groups with at least five listed firms) (29%). As for the distribution of groups across the three group sizes, the majority of business groups (41 out of the total of 80 business groups, or 51.25%) belong to GR_A, 28 groups, or 35%, belong to GR_B, and 11 groups, or 13.75%, belong to GR_C.
Panel B of the table shows that family business groups with a pyramidal ownership structure are common in Malaysia; the majority of business groups in this study (45 out of 80 business groups, or 56%) are associated with a pyramidal structure (BG_PS). The number of firms affiliated with this type of business group is 90 (or 59% of group-affiliated firms). As for the business groups with a simple structure (BG_S), 32 business groups (or 40% of the total number of business groups) belong to this category, and the number of firms involved is 51 (or 34% of group-affiliated firms), whereas the remaining 3 business groups (consisting of 11 firms) are categorised as having a complicated pyramidal structure.
Ng Sin Huei
100
Table 7 Descriptive statistics – size and complexity of business groups
Panel A
Group size Firms Groups
Number Percentage Number Percentage GR_A – Small 56 36.84 41 51.25 GR_B – Medium 52 34.21 28 35.00 GR_C – Large 44 28.95 11 13.75 Total 152 100.00 80 100.00
Panel B Group structure BG_S BG_PS BG_CS Total Number of firms 51 90 11 152 Number of business groups 32 45 3 80
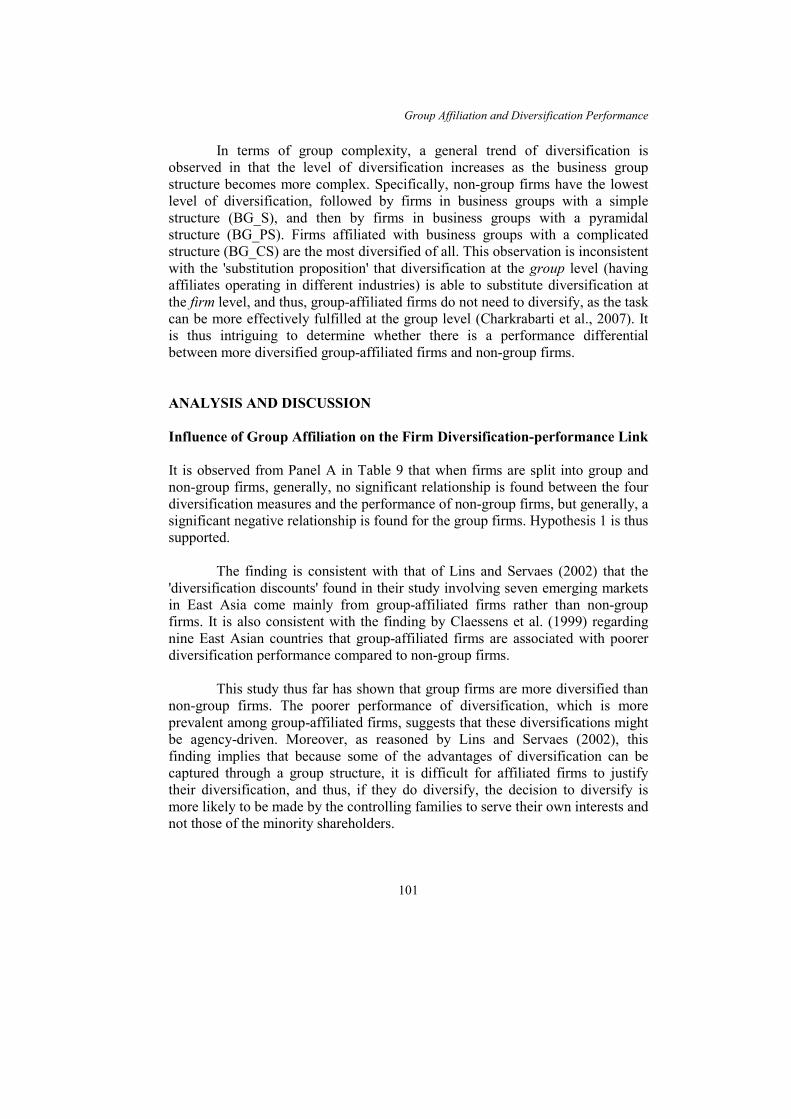
Table 8 shows the statistics indicating the diversification of group firms
according to group size and group complexity. In terms of group size, firms in GR_B are more diversified than firms in GR_A and GR_C according to all diversification measures. The mean, median and standard deviation of various diversification measures in GR_B are statistically significantly (at various significance levels) greater than for non-group firms.
Table 8 Descriptive statistics – group size and group complexity with firm diversification
Mean Median Std Dev
Entro
py
Her
finda
hl
# Se
gmen
t
Entro
py
Her
finda
hl
# Se
gmen
t
Entro
py
Her
finda
hl
# Se
gmen
t
Group size
GR_ A 0.38 0.79 2.54 0.34 0.84 2.00 0.40 0.23 1.37 GR_ B 0.58*** 0.68*** 3.42*** 0.69*** 0.60*** 3.50*** 0.49** 0.27* 1.84** GR_ C 0.44 0.76 2.95** 0.32 0.83 3.00 0.48** 0.25 2.02***
Group complexity
BG_S 0.42 0.77 2.86** 0.37 0.81 3.00** 0.40 0.23 1.34 BG_PS 0.48** 0.73* 2.94** 0.40 0.81 3.00 0.48*** 0.26** 1.93*** BG_CS 0.60* 0.70 3.55*** 0.34 0.81 4.00* 0.57 0.29 2.16
Non-group firms
0.37 0.78 2.44 0.34 0.82 2.00 0.36 0.21 1.37
Notes: * significant at 10%; ** significant at 5%; ***significant at 1%. Comparisons of mean, median and standard deviation are made with non-group firms. The mean difference is tested with the t-test, the median difference with the Wilcoxon test and the standard deviation difference with the F-test.
Group Affiliation and Diversification Performance
101
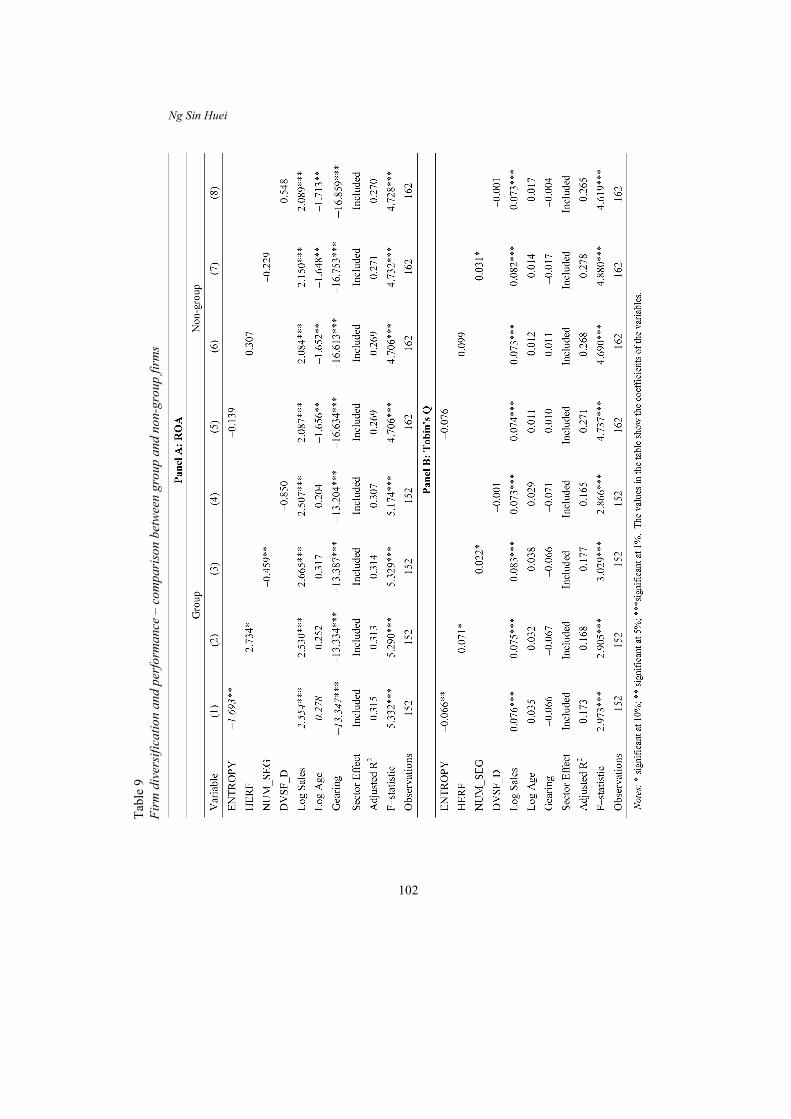
In terms of group complexity, a general trend of diversification is observed in that the level of diversification increases as the business group structure becomes more complex. Specifically, non-group firms have the lowest level of diversification, followed by firms in business groups with a simple structure (BG_S), and then by firms in business groups with a pyramidal structure (BG_PS). Firms affiliated with business groups with a complicated structure (BG_CS) are the most diversified of all. This observation is inconsistent with the 'substitution proposition' that diversification at the group level (having affiliates operating in different industries) is able to substitute diversification at the firm level, and thus, group-affiliated firms do not need to diversify, as the task can be more effectively fulfilled at the group level (Charkrabarti et al., 2007). It is thus intriguing to determine whether there is a performance differential between more diversified group-affiliated firms and non-group firms. ANALYSIS AND DISCUSSION Influence of Group Affiliation on the Firm Diversification-performance Link It is observed from Panel A in Table 9 that when firms are split into group and non-group firms, generally, no significant relationship is found between the four diversification measures and the performance of non-group firms, but generally, a significant negative relationship is found for the group firms. Hypothesis 1 is thus supported.
The finding is consistent with that of Lins and Servaes (2002) that the 'diversification discounts' found in their study involving seven emerging markets in East Asia come mainly from group-affiliated firms rather than non-group firms. It is also consistent with the finding by Claessens et al. (1999) regarding nine East Asian countries that group-affiliated firms are associated with poorer diversification performance compared to non-group firms.
This study thus far has shown that group firms are more diversified than non-group firms. The poorer performance of diversification, which is more prevalent among group-affiliated firms, suggests that these diversifications might be agency-driven. Moreover, as reasoned by Lins and Servaes (2002), this finding implies that because some of the advantages of diversification can be captured through a group structure, it is difficult for affiliated firms to justify their diversification, and thus, if they do diversify, the decision to diversify is more likely to be made by the controlling families to serve their own interests and not those of the minority shareholders.
Ng Sin Huei
102
Tabl
e 9
Firm
div
ersif
icat
ion
and
perfo
rman
ce –
com
paris
on b
etwe
en g
roup
and
non
-gro
up fi
rms

Group Affiliation and Diversification Performance
103
It should also be noted that the findings in this study do not support the 'spillover benefits of group affiliation to firm-level diversification' hypothesis (as explained in Charkrabarti et al., 2007) but are instead more consistent with the expropriation hypothesis. Claessens et al. (1999) find that the evidence of diversification discounts associated with group-affiliated firms in their study is consistent with their expropriation hypothesis. Moderating Effects of Group Size and Group Structure on the Performance Outcomes of Firm Diversification Further findings on the influence of group size on the performance outcomes of diversification are shown in Table 10. The key interest lies in the interaction terms involving the various group sizes in the table. Small Business Groups (GR_A) The findings regarding small business groups (GR_A) show that there is some weak evidence to suggest that GR_A may positively moderate the firm diversification-performance link (see the interaction terms in Model (1) and Model (4)).
The moderating influence of GR_A can be computed by adding the diversification measure variable and the interaction term variable. For instance, the moderating influence of GR_A on the diversification-ROA link in Model (1) of Panel A can be computed as (ENTROPY + ENTROPY*GR_A) = –3.237 + 4.225 = 0.988, which can be interpreted as follows: every 0.1 increase in the Entropy value8 of firms affiliated with small business groups will lead to an improvement of ROA of the firms by approximately 0.1% (0.1 × 0.988% = 0.0988% ≈ 0.1%). Similarly, the moderating influence of GR_A on Tobin's Q in Model (4) of Panel D is computed as –0.108 + 0.263 = 0.155, which is interpreted as follows: a diversified firm affiliated with a small business group has 0.155 greater Tobin's Q compared to a similarly diversified firm that is not in GR_A.
The findings on small-sized business groups thus do not support Khanna and Palepu's (2000a) observation that in India, the majority of small- and medium-sized business groups have issues such as incompetent management, serious agency problems and a lack of advantages of political connection that prevent their firms from generating benefits from diversification. This inconsistency in the findings could be due to the differences in the country-specific and institutional environment factors in both countries, as these lead to variations in the nature of business groups in each country.

Ng Sin Huei
104
Table 10 Firm diversification and performance – group size effect
Notes: * significant at 10%; ** significant at 5%; ***significant at 1%. The values in the table show the coefficients of the variables. All other control variables and sector effects are included in the regression (not shown above).

Group Affiliation and Diversification Performance
105
Intermediate and Large Business Groups (GR_B and GR_C) The findings on intermediate business groups (GR_B) show that GR_B has an insignificant influence on the performance outcomes of diversification (all of the interaction terms involving GR_B are statistically insignificant) (see Model [2] and Model [5]).
The findings on large business groups (GR_C) show that GR_C negatively moderates the diversification-performance link. The moderating influence of large group size can be quantified as follows: as an illustration, the influence of GR_C in Model (6) of Panel B is computed as –0.036 + 0.435 = 0.399, which can be interpreted as follows: for every 0.1 decrease in the Herfindahl9 of firms affiliated with GR_C, the Tobin's Q of the firms will decline by approximately 0.04 (0.1 × 0.399 = 0.0399 ≈ 0.04).
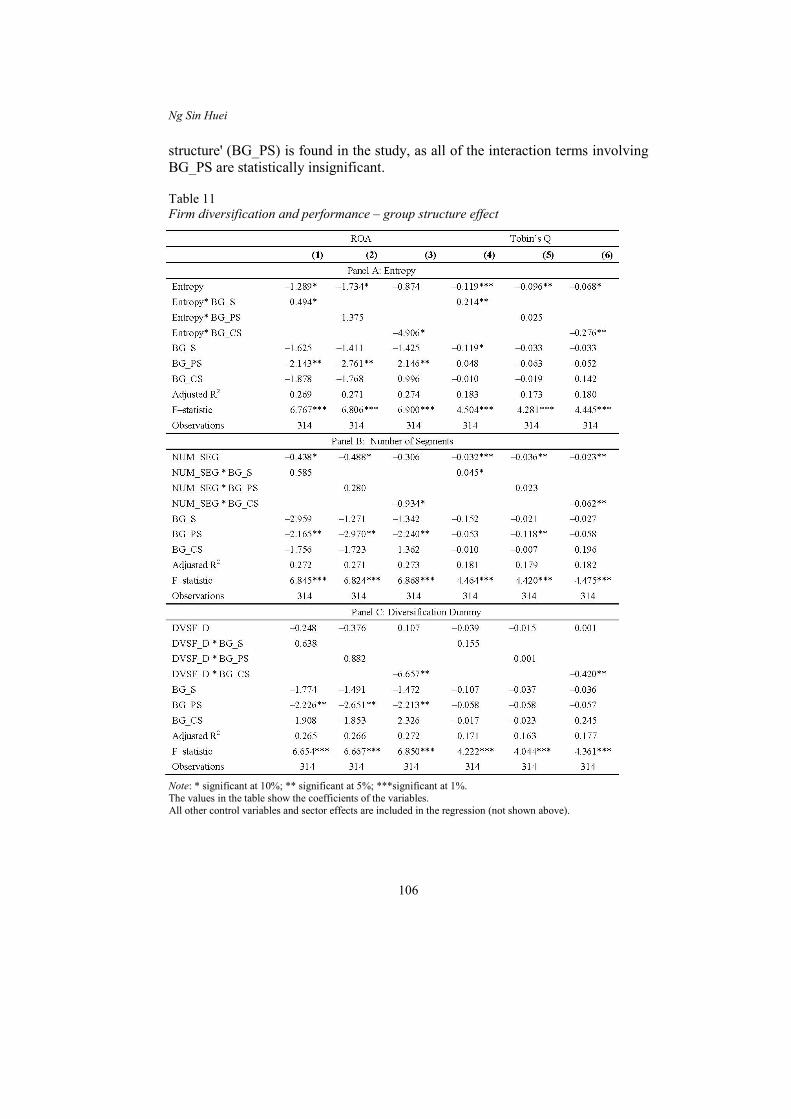
This observation implies that the performance of firms deteriorates as the diversification level increases for firms affiliated with large business groups. In other words, the higher the diversification level of firms affiliated with large business groups, the more their performance and value will diminish. The findings do not support and are opposite to Khanna and Palepu's (2000a) findings in India that large business groups have more advantages that enhance the performance outcomes of firm diversification compared to small and medium-sized business groups. The findings are consistent with those of Johnson and Mitton (2003), who state that there is a greater potential for the owner-managers of politically connected firms, which are likely to be found in large business groups, to misappropriate the firm's resources. A diversified structure undeniably facilitates such misappropriation. The Complexity of Business Group Structure The moderating influence of the three different levels of group complexity (BG_S, BG_PS, and BG_CS) on the diversification outcomes are shown in the interaction terms from Models (1) to (6) in Table 11.
Generally weak evidence of the positive moderating influence of 'business groups with a simple structure' (BG_S) is found in the study. Thus, the findings, albeit weak, might suggest that not only do small business groups (GR_A) have a potentially positive moderating effect on the diversification outcome; business groups with a simple structure (BG_S) may also contribute towards a better diversification-performance relationship. The absence of pyramidal and cross-holding structures in BG_S may imply a lower tendency towards expropriation and subsequently less value-destroying diversification. In comparison, no significant influence of 'business groups with a pyramidal
Ng Sin Huei
106
structure' (BG_PS) is found in the study, as all of the interaction terms involving BG_PS are statistically insignificant. Table 11 Firm diversification and performance – group structure effect
Note: * significant at 10%; ** significant at 5%; ***significant at 1%. The values in the table show the coefficients of the variables.
All other control variables and sector effects are included in the regression (not shown above).

Group Affiliation and Diversification Performance
107
On the contrary, the findings indicate that overall, 'business groups with a complicated pyramidal structure' (BG_CS) negatively moderate the diversification outcome. The coefficients for all of the interaction terms involving BG_CS in Table 11 are negative on a reasonably statistically significant level. Descriptive statistics in the earlier section have shown that firms affiliated with BG_CS have the highest level of diversification among all of the firms in the sample. The finding here therefore suggests that the high diversification observed in these firms is more value-destroying than value-adding and may thus be a reflection and manifestation of the substantial occurrence of agency problems in firms affiliated with BG_CS. The controlling families of business groups may create complicated ownership structures to reduce the threat to their control, and consequently, their tendency to expropriate may increase as the group structure becomes more complex and as such less transparent.
It should be highlighted that BG_CS, as defined in this study, is actually the smaller subset of GR_C (large business groups with at least five listed affiliates). Hence, examining the group structure serves as a robustness test to the earlier test on group size. The dummy variable BG_CS can be considered as not only business groups with complicated structures and complex networks that link the affiliates but also business groups with a large number of listed affiliates. This is particularly the type of business group that, according to Lins and Servaes (2002), should not have a high level of firm-level diversification because the diversification needed to create the benefits of internal markets has already been provided at the group level by the large number of listed member firms operating across various industries. Thus, the poor diversification outcomes of firms affiliated with BG_CS in this study are in line with the authors' observations that high diversification at the firm level in business groups is more likely to be agency-driven. The lack of transparency in firm activities including diversification-related activities due to complex group structures reinforces the observations concerning the agency-driven nature of diversification. Finally, the findings in this section provide further support to the earlier findings and explanations that the politically connected large family-controlled business groups do not help to improve the diversification outcomes of their affiliates. FURTHER DISCUSSION The Presence of Trends across the Moderating Influence of Various Group Sizes and Structures The findings in this study suggest the presence of an overall trend in the moderating effects of group size on the performance outcomes of firm diversification. Specifically, the moderating influence tends to be positive in

Ng Sin Huei
108
small business groups, neutral in intermediate business groups and negative in large business groups. A similar trend is also observed in terms of group structure, where the moderating influence tends to be positive for groups with a simple structure and negative for groups with a complicated pyramidal structure. Possible reasons for this trend could be proposed as follows: first, when the business group is small (for instance, with only two listed affiliates) or structurally simple, firm diversification is able to complement and contribute to the task of creating internal markets in the group, and the affiliates enjoy the benefits brought about by those internal markets. This implies that without firm-level diversification, there could be a capacity limit for a small or simply structured business group to create a sufficiently large internal market to benefit the group and the firms therein. In addition, small business groups as defined in this study have up to only two listed firms in the group. The group structure is therefore straightforward and, without any pyramidal structure, reduces the groups' exposure to expropriation through diversification compared to larger business groups. For instance, the move to diversify or to further increase the diversification level of a member firm in a small and simple business group cannot be as easily concealed and remains undiscovered as in large, complicated groups.
However, as business groups grow from small to intermediate (groups with three to four listed affiliates), the 'complementary' role of firm-level diversification on the formation of the internal market of the group begins to decrease. At the same time, group structure becomes more complicated, and the divergence of cash flow and control rights can now be found in some group affiliates. Thus, the benefits and costs of firm diversification for such business groups may well cancel each other out and result in neutral effects on the diversification outcomes.
Finally, as business groups progress from intermediate to large (with five
or more listed affiliates), the motive of controlling families to diversify or increase the diversification level of member firms becomes questionable. Thus, as opposed to small business groups, agency-led diversification in firms affiliated with large groups will be more pervasive, as a large, more complicated group structure network provides a suitable condition for controlling families to expropriate through diversification. The low transparency that is often associated with large business groups helps to conceal the groups' activities (Khanna & Palepu, 2000b). Moreover, large and agglomerated business groups often have more complicated pyramidal structures, and thus, agency costs through diversification are greater, as the costs that controlling families incur will be less than any personal gain or utility from expropriation.

Group Affiliation and Diversification Performance
109
The Corporate Environment in Malaysia The corporate environment in Malaysia may exacerbate this situation, as many large business groups are closely linked either formally or informally to the ruling party or senior government officials (Gomez & Jomo, 1999). The negative outcomes of diversification associated with firms belonging to large and structurally complicated business groups may suggest that they do not take advantage of the political connections they have to improve the outcomes of that diversification. One possible reason could be that close political connections are used by controlling families to advance diversification activities for personal or family interests more than the interests of other shareholders. Personal interest, wealth, or utility gained by controlling families from diversification activities in this case outweigh the wealth that controlling families need to forgo due to poor diversification results (i.e., reduced firm performance), as elaborated by Lins and Servaes (2002).
For instance, a firm affiliated with a large business group may choose to enter into a diversification deal involving a director or an affiliate (e.g., the firm may decide to acquire a director-owned private company operating in a different business sector10) who has close political contacts rather than an arm's length diversification deal even though the deal with the director or his crony is not the best deal. This is because the close relationship with the director may facilitate more rent-seeking activities for the controlling family and provide opportunities to secure future contracts, credit or other benefits from the ruling political party. Finally, it is reported by Claessens et al. (2000) that in Malaysia, the top 15 families control corporate assets worth 76.2% of the country's GDP compared to only 2.1% in Japan and 2.9% in the US. This percentage is one of the highest in Asia and implies that families with large business groups could be highly influential and 'lobby' the government into implementing policies that are in their favour and 'interfere' in policies that are 'unfriendly' to them, such as a stricter takeover policy that may hinder their self-interested takeover-and-diversify activities. CONCLUSION The evidence that diversification performance is worse in group-affiliated firms than in non-group firms is consistent with Lins and Servaes's (2002) and Chakrabarti's et al. (2007) proposal that there is a lack of valid reasons to diversify at the firm level when the task can be more efficiently fulfilled at the group level. In addition, the evidence in this study shows that the effect of firm diversification on the performance of group-affiliated firms is negatively
Ng Sin Huei
110
moderated by the size as well as the complexity of business groups. It infers that diversification is more detrimental to performance in firms affiliated with business groups that are larger and more structurally complex. These findings are in line with the viewpoints of La Porta et al. (1999), La Porta, Lopez-de-Silanes and Zamarripa (2003), Khanna and Palepu (2000b) and Young et al. (2008) that groups that are larger or that have more complex networks of affiliates are sometimes formed by the controlling shareholders to reduce the threat to their control and enable them to engage in unwarranted diversification.
Moreover, business groups, particularly those large in size or complex in structure, are also more likely to be linked to the "political apparatus in the country (that) also insulate them from external interference and monitoring" (Khanna & Palepu, 2000b, p. 265). The findings in this study support the idea that firm diversification in such business groups is more likely to be associated with personal, family or political agendas to the detriment of firm performance. Poor corporate transparency in these business groups, which may have led to severe expropriation, implies that the size and complexity of business group structures is worthy of regulators' attention. Various incentives could be created by the relevant authorities to encourage business groups to retain a certain size or level of group structure complexity as well as a certain level of firm diversification.
The knowledge from this study may help public investors improve their investment decision-making, particularly in the aspects of risk assessment. The findings suggest that firms affiliated with large and complicated family-controlled business groups could be bound to a higher expropriation of resources by the controlling shareholders. Investors should by no means totally rule out the possibility of investing in these firms, but rather, they should ensure that they are fully aware of and have taken into account the risks associated with investing in such firms.
One of the limitations in this study is that it does not separate firm diversification into related and unrelated diversification. Such separation allows the researcher to examine whether there is a difference between group-affiliated and non-group firms in terms of choosing between related or unrelated diversification. Such a finding may clarify why the diversification outcomes of group-affiliated firms are generally worse than that of non-group firms, as found in this study.
Finally, due to its peculiar affirmative economic policy (from 1970- present), political interference in Malaysian business is wide-ranging, regardless of the size of firms or business groups. The attention paid by this study to firms affiliated with large and complicated groups only serves to indicate that political

Group Affiliation and Diversification Performance
111
connections may be more pronounced in these firms compared to other firms. Future research may want to take into account the unique political-business circumstances brought about by the affirmative economic policy by comparing family-controlled business groups with other types of business groups, such as state-controlled ones. This comparison may be able to shed more light on the links between the types of business groups, their political connections and the outcomes of their firm diversification.
NOTES
1. The 2008 data used in this study indicate that the findings may be more reflective of the slower pace of Malaysian economic growth of 4.6% recorded for that year (due to the global financial turmoil) than the stable economic growth of around 6% for the country. Though the economic climate of 2008 for Malaysia is not considered 'poor', it was by no means a satisfactory growth for the country. Future research may investigate the finding differentials under different economic conditions.
2. Haniffa and Hudaib (2006), for instance, also make use of Krejcie and Morgan (1970) as a guideline for sample size selection.
3. The reporting and disclosure requirements of Financial Reporting Standards (FRS)114 are similar to the requirements of the revised International Accounting Standards (IAS) 14. The new standard International Financial Reporting Standards (IFRS) 8 (Operating Segments) is enforceable in Malaysia with effect from 2009.
4. Direct holding is often insufficient to determine who actually controls the firm. Thus, the 'ultimate owner' approach (Claessens, Djankov, Fan, & Lang, 2002) is employed in this study, which indicates that when the principal shareholders of a listed firm are themselves corporate entities, the major shareowners of these entities will be identified; then, the major shareowners of the major shareowners will be identified and so on until the identity of the ultimate owner is identified. This process can be cumbersome, but fortunately, as part of the disclosure requirements, family members who own the firm indirectly through their privately-held or publicly-listed firm(s) will be reported in the annual reports as having indirect holdings in the firm with the percentage of those holdings disclosed. This has eased the identification of family-controlled firms in this study.
5. The inclusion of firms that are controlled by individual entrepreneurs into
'family-controlled firms' in this study is consistent with previous studies, such as Anderson and Reeb (2003), Andres (2008), and Masulis et al. (2011).

Ng Sin Huei
112
6. Members of a family are seen as persons acting in concert. Thus the shareholdings of family members are aggregated and treated as shareholdings of the family to determine whether a firm is family-controlled or otherwise. Family relationships or kinship are disclosed in the company annual reports.
7. The fact that Tobin's Q cannot take a negative value leads to an extreme value only at one end of the Tobin's Q data.
8. Increases in Entropy equal increases in the diversification level. 9. Increases in the Herfindahl equals decreases in the diversification level.
10. The firm diversification level increases after acquiring the private company from
the director. REFERENCES Anderson, R. C. & Reeb, D. M. (2003). Founding family ownership and firm
performance: Evidence from the S&P 500. Journal of Finance, 58(3), 1301–1328. Andres, C. (2008). Large shareholders and firm performance-An empirical examination
of founding family ownership. Journal of Corporate Finance, 14(4), 431–445. Ayoib, C. A., Ishak, Z. & Manaf, N. A. (2003). Corporate governance, ownership
structure and corporate diversification: Evidence from the Malaysian listed companies. Asian Academy of Management Journal, 8(2), 67–89.
Backman, M. (1999). Asian eclipse: Exposing the dark side of business in Asia. Singapore: John Wiley and Sons (Asia).
Berkman, H., Cole, R. A. & Fu, L. J. (2010). Political connection and minority shareholder protection: Evidence from security-market regulation in China. Journal of Financial and Quantitative Analysis, 6(45), 1392–1427.
Chakrabarti, A., Singh, K. & Mahmood, I. (2007). Diversification and performance: Evidence from East Asian firms. Strategic Management Journal, 28(2), 101–120.
Chang, S. J. & Hong J. (2002). How much does the business group matter in Korea? Strategic Management Journal, 23(3), 265–274.
Chen, S. S. & Chen, I. J. (2012). Corporate governance and capital allocations of diversified firms. Journal of Banking and Finance, 36(2), 395–409.
Chen, S. S. & Ho, K. W. (2000). Corporate diversification, ownership structure, and firm value: The Singapore evidence. International Review of Financial Analysis, 9(2000), 315–326.
Claessens, S., Djankov, S. & Lang, L. H. P. (2000). The separation of ownership and control in East Asian corporations. Journal of Financial Economics, 58(1), 81–112.
Claessens, S., Djankov, S., Fan, J. & Lang, L. H. P. (1999). Corporate diversification in East Asia: The role of ultimate ownership and group affiliation, World Bank Policy Research Working Paper No. 2089. Washington DC: World Bank.

Group Affiliation and Diversification Performance
113
Claessens, S., Djankov, S., Fan, J. & Lang, L. H. P. (2002). Disentangling the incentive and entrenchment effects of large shareholdings. Journal of Finance, 57(5), 2741–2771.
Claessens, S., Djankov, S., Fan, J. & Lang, L. H. P. (2003). When does corporate diversification matter to productivity and performance? Evidence from East Asia. Pacific-Basin Finance Journal, 11(2003), 365–392.
Claessens, S. & Fan, J. (2002). Corporate governance in Asia: A survey. International Review of Finance, 3(2), 71–103.
Claessens, S., Fan, J. & Lang, L. H. P. (2006). The benefits and costs of group affiliation: Evidence from East Asia. Emerging Markets Review, 7(1), 1–26.
Denis, D. J., Denis, D. K. & Sarin, A. (1997). Agency problems, equity ownership, and corporate diversification. Journal of Finance, 52(1), 135–160.
Douma, S., George, R. & Kabir, R. (2006). Foreign and domestic ownership, business groups, and firm performance: Evidence from a large emerging market. Strategic Management Journal, 27(7), 637–657.
Estrin, S., Poukliakova, S. & Shapiro, D. (2009). The performance effects of business groups in Russia. Journal of Management Studies, 46(3), 393–420.
Fauver, J. H. & Naranjo, A. (2003). Capital market development, international integration, legal systems, and the value of corporate diversification: A cross-country analysis. Journal of Financial and Quantitative Analysis, 38(1), 135–157.
George, R. & Kabir, R. (2008). Business groups and profit redistribution: A boon or bane for firms? Journal of Business Research, 61(2008), 1004–1014.
Gomez, E. T. (2006). Malaysian business groups: The state and capital development in the post-currency crisis period. In S. Chang (Ed.), Business groups in East Asia: Financial crisis, restructuring, and new growth. Oxford: Oxford University Press.
Gomez, E. T. & Jomo, K. S. (1999). Malaysia's political economy: Politics, patronage, and profits (revised ed.). Cambridge: Cambridge University Press.
Guest, P. & Sutherland, D. (2010). The impact of business group affiliation on performance: Evidence from China's 'National Champions'. Cambridge Journal of Economics, 34(4), 617–631.
Gunasegaram, P. (2007). Taking miscreants to task, The Edge, 11th June. Petaling Jaya, Selangor, Malaysia: The Edge Communications.
Hair, J. F., Black, W. C., Rabin, B. J. & Anderson, R. E. (2010). Multivariate data analysis: A global perspective (7th ed.). New Jersey: Pearson.
Haniffa, R. M. & Hudaib, M. (2006). Corporate governance structure and performance of Malaysian listed companies. Journal of Business Finance and Accounting, 33(7–8), 1034–1062.
Haslindar, I. & Fazilah, A. S. (2009). Corporate governance and agency costs: Evidence from public listed family firms in Malaysia, SSRN Working Paper, Social Science Research Network. Retrieved 19 October 2010 from http://ssrn.com/abstract =1292182
Jacquemin, A. & Berry, C. (1979). Entropy measure of diversification and corporate growth. Journal of Industrial Economics, 27(4), 359–370.
Jiraporn, P., Kim, Y. S., Davidson, W. N. & Singh, M (2006). Corporate governance, shareholder rights, and firm diversification: An empirical analysis. Journal of Banking and Finance, 30(3), 947–963.

Ng Sin Huei
114
Joh, S. W. (2003). Corporate governance and firm profitability: Evidence from Korea before the economic crisis. Journal of Financial Economics, 68(2), 287–322.
Johnson, S. & Mitton, T. (2003). Cronyism and capital controls: Evidence from Malaysia. Journal of Financial Economics, 67(2), 351–382.
Khanna, T. & Palepu, K. (2000a). Is group affiliation profitable in emerging markets? An analysis of diversified Indian business groups. Journal of Finance, 55(2), 867–891.
Khanna, T. & Palepu, K. (2000b). Emerging market business groups, foreign intermediaries, and corporate governance, in concentrated corporate ownership. Chicago, IL: University of Chicago Publication.
Khanna, T. & Rivkin, J. (2001). Estimating the performance effects of business groups in emerging markets. Strategic Management Journal, 22(1), 45–74.
Khanna, T. & Yafeh, Y. (2007). Business groups in emerging markets: Paragons or parasites? Journal of Economic Literature, 45(2), 331–372.
Kim, H., Hoskisson, R. E. & Wan, W. P. (2004). Power dependence, diversification strategy, and performance in keiretsu member firms. Strategic Management Journal, 25(7), 613–636.
Krejcie, R. & Morgan, D. (1970). Determining sample size for research activities. Educational and Psychological Measurement, 30(3), 607–610.
La Porta, R., Lopez-De-Silanes, F. & Shleifer, A. (1999). Corporate ownership around the world. Journal of Finance, 54(2), 471–517.
La Porta, R., Lopez-de-Silanes, F. & Zamarripa, G., (2003). Related lending. Quarterly Journal of Economics, 118(1), 231–268.
Lang, L. & Stulz, R. (1994). Tobin's Q, corporate diversification, and firm performance. Journal of Political Economy, 102(6), 1248–1280.
Lee, K., Peng, M. & Lee, K. (2008). From diversification premium to diversification discount during institutional transitions. Journal of World Business, 43(1), 47–65.
Lins, K. V. & Servaes, H. (2002). Is corporate diversification beneficial in emerging markets? Financial Management, 31(2), 5–31.
Low, C. K. (2004). A road map for corporate governance in East Asia. Northwestern Journal of International Law & Business, 25(1), 165–203.
Masulis, R. W., Pham, P. K. & Zein, J. (2011). Family business group around the world: Financing advantages, control motivations, and organizational choices. The Review of Financial Studies, 24(11), 3556–3600.
Nazli, A. M. G & Weetman, P. (2006). Perpetuating traditional influences: Voluntary disclosure in Malaysia following the economic crisis. Journal of International Accounting, Auditing and Taxation, 15(2), 226–248.
Palepu, K. (1985). Diversification strategy, profit performance and the entropy measure. Strategic Management Journal, 6(3), 239–255.
Qian, M., Pan, H. & Yeung, B. Y. (2010). Expropriation of minority shareholders in politically connected firms. Finance and Corporate Governance Conference 2011 Paper, Social Science Research Network. Retrieved 8 March 2011 from http://ssrn.com/abstract=1719335,
Robins, J. & Wiersema, M. (2003). The measurement of corporate portfolio strategy: Analysis of the content validity of related diversification indexes. Strategic Management Journal, 24(1), 39–59.

Group Affiliation and Diversification Performance
115
Sahoo, N. (2010). Affirmative action in private sector in Malaysia: Lessons for India. Paper Presented at the 10th Annual Asia Fellows Conference on Pluralism in Asia: Asserting Traditional Identities, Politics and Perspectives, Bangkok, 9–10th July. Bangkok: Asian Scholarship Foundation.
Salkind, N. J. (2010). Encyclopedia of research design. London: SAGE Publications. Searle, P. (1999). The riddle of Malaysian capitalism: Rent-seekers or real capitalists?
ASAA Southeast Asia Publications Series. Sydney: Allen & Unwin. Shleifer, A. & Vishny, R. (1997). A survey of corporate governance. Journal of Finance,
52(2), 737–783. Singh, M., Nejadmalayeri, A. & Mathur, I. (2007). Performance impact of business group
affiliation: An analysis of the diversification-performance link in a developing economy. Journal of Business Research, 60(4), 339–347.
Tam, O. K. & Tan, Monica, G. S. (2007). Ownership, governance and firm performance in Malaysia. Corporate Governance, 15(2), 208–222.
Thillainathan, R. (1999). Corporate governance and restructuring in Malaysia-A review of markets, mechanisms, agents & the legal infrastructure. Paper prepared for the Joint World Bank/OECD Survey of Corporate Governance Arrangements in a Selected Number of Asian Countries. Retrieved 25 July 2010 from http://www.oecd.org/corporate/ca/corporategovernanceprinciples/1931380.pdf
World Bank. (2005). Report on the observance of standards and codes (ROSC): Corporate governance country assessment: Malaysia. Retrieved 17 November 2009 from http://www.worldbank.org/ifa/rosc_cg_malaysia.html
Yeoh, K. (2010). The behaviour of individual investors in Malaysia: A governance perspective. Unpublished PhD diss., University of Northumbria at Newcastle, UK.
Young, M. N., Peng, M. W., Ahlstrom, D., Bruton, G. D. & Yi, J. (2008). Corporate governance in emerging economics: A review of the principal-principal perspective. Journal of Management Studies, 45(1), 196–220.
Zuaini, I. & Napier, C. (2006). Expropriation of minority interests and corporate diversification in Malaysia. Asian Academy of Management Journal of Accounting and Finance, 2(1), 85–113.