Embed Size (px)
Citation preview
World Bank 2009 Energy WeekWorld Bank 2009 Energy WeekWashington DC,Washington DC, March 31March 31-- April 2 2009 April 2 2009
HOW DOES CHINA REDUCE COHOW DOES CHINA REDUCE CO22EMISSIONS FROM COAL FIRED POWER EMISSIONS FROM COAL FIRED POWER
GENERATION ?GENERATION ?Activities and Deployment of Clean CoalActivities and Deployment of Clean Coal
Power Generation and Carbon Capture in ChinaPower Generation and Carbon Capture in China
JianxiongJianxiong MaoMaoDepartment of Thermal EngineeringDepartment of Thermal EngineeringTsinghua University, Beijing, ChinaTsinghua University, Beijing, China

Comparison of Primary Energy Structure Comparison of Primary Energy Structure Between China And The World IN 2007Between China And The World IN 2007
World World ChinaChina
AmountAmountM toeM toe
RatioRatio%%
AmountAmountM toeM toe
RatioRatio%%
OilOil 3952.83952.8 35.635.6 368.0368.0 19.719.7
Natural gasNatural gas 2637.72637.7 23.823.8 60.660.6 3.33.3
CoalCoal 3177.53177.5 28.628.6 1311.41311.4 70.470.4
NuclearNuclear 622.0622.0 5.65.6 14.214.2 0.80.8
HydroHydro 709.2709.2 6.46.4 109.3109.3 5.85.8
TotalTotal 11099.311099.3 100100 1863.41863.4 100100
ItemItem
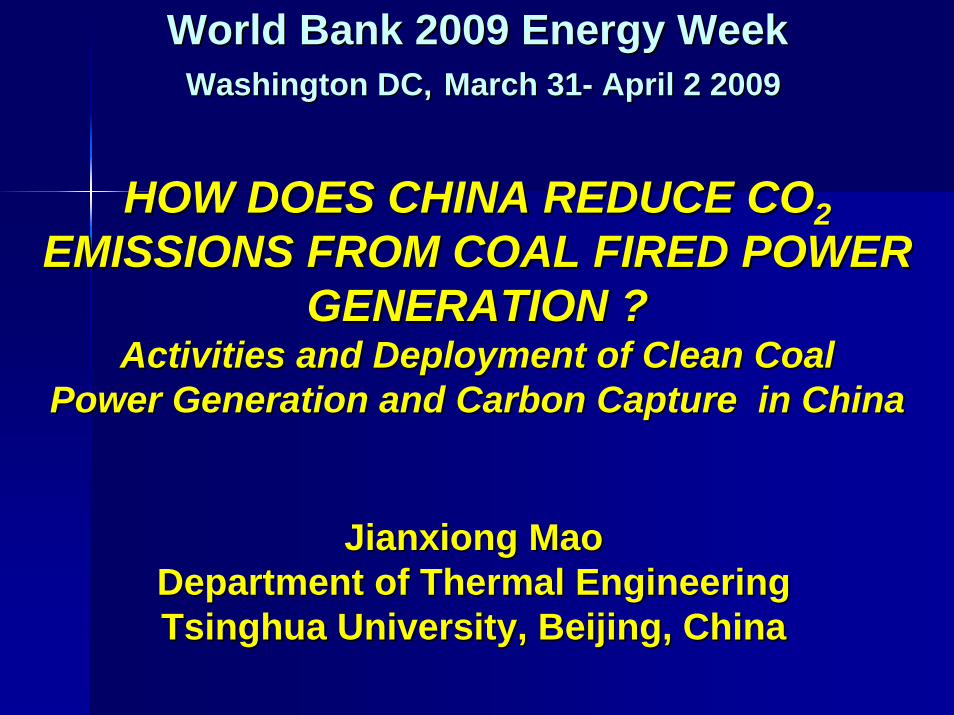
ChinaChina’’s Installed Capacity & s Installed Capacity & Generated Electricity Generated Electricity
20042004--20082008
YearYear Installed Installed capacitycapacity
MWeMWe
Annual Annual growth growth rate,rate,%%
Generated Generated electricityelectricity
TWhTWh
Annual Annual growth growth rate,rate,%%
Capacity of Capacity of thermal thermal
power, power, MWeMWe
RatioRatio%%
Generated Generated electricityelectricity
TWhTWh
RatioRatio%%
20042004 442,390442,390 13.0213.02 2194.42194.4 15.1815.18 329,480329,480 74.4874.48 1810.41810.4 82.5082.50
20052005 517,190517,190 16.9116.91 2474.72474.7 12.7712.77 384,130384,130 74.3074.30 2018.02018.0 81.5581.55
20062006 622,000622,000 20.2720.27 2834.42834.4 14.5414.54 484,050484,050 77.8277.82 2357.32357.3 81.1781.17
20072007 713,290713,290 14.6714.67 3255.93255.9 14.4014.40 554,420554,420 77.4277.42 2698.02698.0 82.8682.86
20082008 792,530792,530 11.1011.10 3433.43433.4 5.455.45 601,320601,320 75.8775.87 2779.32779.3 80.7580.75
Source: China Electric Statistics

Structure of ChinaStructure of China’’s Power s Power Capacity In 2007Capacity In 2007
Hydro 20.64%
Others 0,13%
Wind 0.58%
Nuclear 1.23%
Thermal 77.42%
Coal Power Will Be In Dominant Unchangeably For A Long Time.
Source: China Electricity Council (CEC), 2008

Fast growth Of ChinaFast growth Of China’’s Electric Powers Electric PowerCoal Power Will Be In Dominant UnchangeablyCoal Power Will Be In Dominant Unchangeably
1,850MWe in 1949 and 792,530 MWe in 2008, 428 times of growth in 60 years.
Total installed capacity for coal power accounted for 76% in 2008.
Coal power will be in dominant unchangeably for a long time.
Low efficiency and high emissions are big challenge for China’s power sector.
66138
319
508
840
1340
0
200
400
600
800
1000
1980 1990 2000 2005 2010 2020
Total installed capacity
Coal power capacity
GWe
Source:IEA Clean Coal Centre www.iea-coal.org.uk
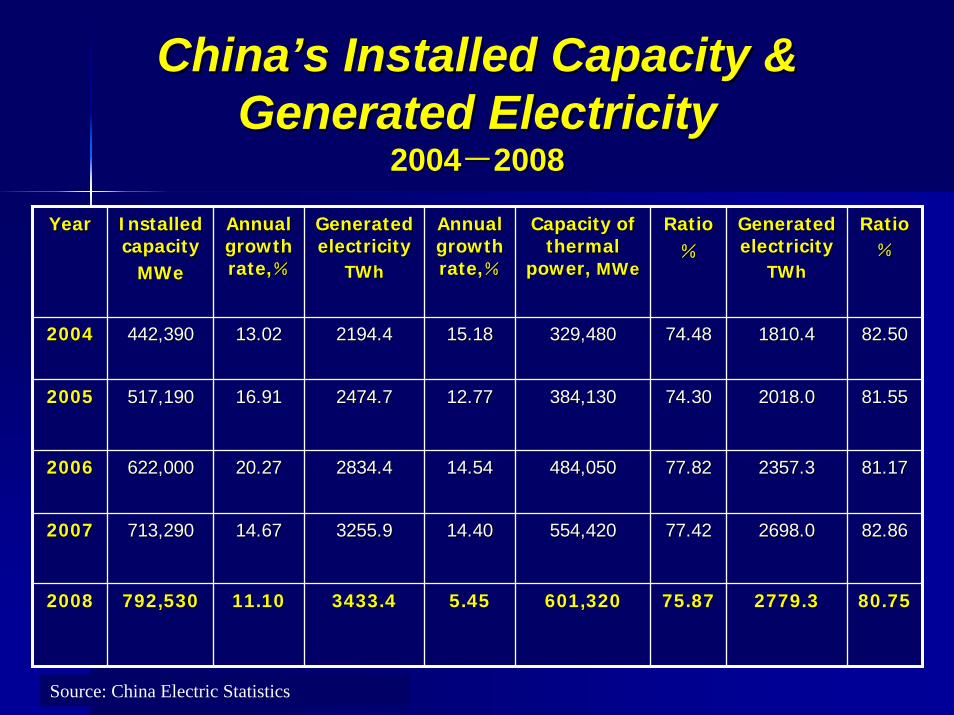
China Has Been The Largest CO China Has Been The Largest CO2 2 Emission Emission Country In The World Since 2007 Country In The World Since 2007
China6.2 Gt CO2
USA5.75 Gt CO2
Rest of the world16.25 Gt CO2
Source: Netherlands Environmental Agency
China Has Been The Largest CO2 Emission Country In The World Since 2007

Structure Of Thermal Power Capacity In ChinaStructure Of Thermal Power Capacity In China((By the end of 2006By the end of 2006))
Class of Class of capacitycapacity((MWeMWe))
Installed Installed capacitycapacity((MWeMWe))
Percent of total Percent of total thermal capacitythermal capacity((%%))
600600 125,790125,790 26.026.0300300 82,25082,250 17.017.0100100--300300 130,630130,630 27.027.0≤≤100100 114,000114,000 23.623.6≤≤5050 91,30091,300 18.918.9≤≤2525 51,60051,600 10.710.7≤≤66 21,30021,300 4.44.4
Source:NDRC,2007
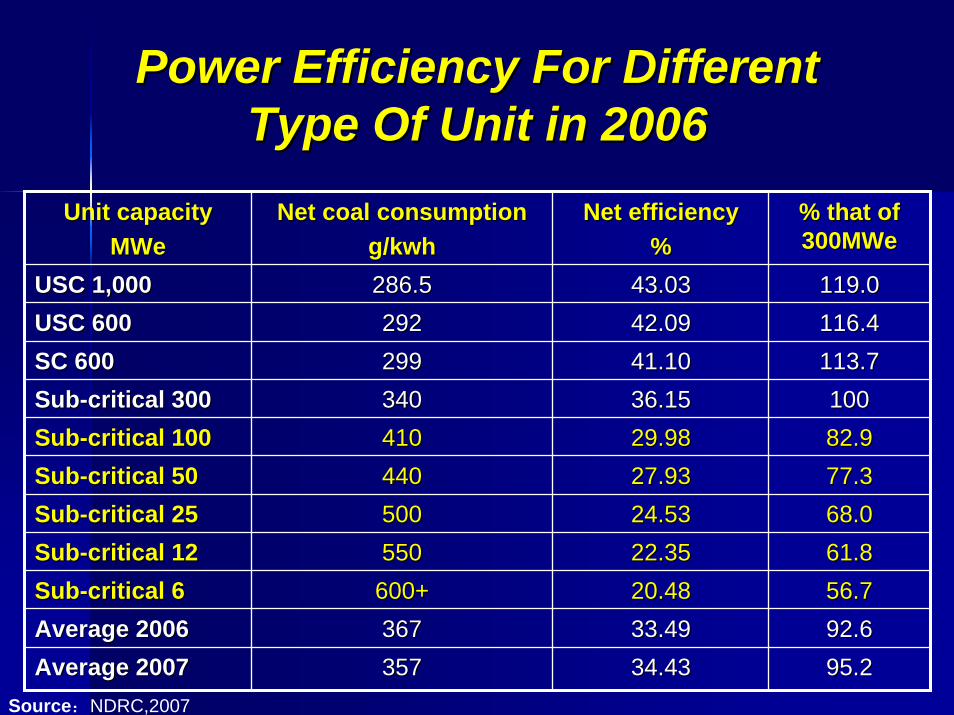
Power Efficiency For Different Power Efficiency For Different Type Of Unit in 2006Type Of Unit in 2006
Unit capacityUnit capacityMWeMWe
Net coal consumptionNet coal consumptiong/kwhg/kwh
Net efficiencyNet efficiency%%
% that of % that of 300MWe300MWe
USC 1,000USC 1,000 286.5286.5 43.0343.03 119.0119.0USC 600USC 600 292292 42.0942.09 116.4116.4SC 600SC 600 299299 41.1041.10 113.7113.7SubSub--critical 300critical 300 340340 36.1536.15 100100SubSub--critical 100critical 100 410410 29.9829.98 82.982.9SubSub--critical 50critical 50 440440 27.9327.93 77.377.3SubSub--critical 25critical 25 500500 24.5324.53 68.068.0SubSub--critical 12critical 12 550550 22.3522.35 61.861.8SubSub--critical 6critical 6 600+600+ 20.4820.48 56.756.7Average 2006Average 2006 367367 33.4933.49 92.692.6Average 2007Average 2007 357357 34.4334.43 95.295.2
Source:NDRC,2007

The Policy Of The Policy Of ““Large Substitutes For Small Large Substitutes For Small (LSS)(LSS)”” To Improve Power Efficiency In ChinaTo Improve Power Efficiency In China
Decommissioned capacity of inefficient small size units is the Decommissioned capacity of inefficient small size units is the key criteriakey criteria for a substituting new large size power project to be for a substituting new large size power project to be included in the national power development plan which is the included in the national power development plan which is the basis for central government approval of project. For example, basis for central government approval of project. For example, if 2if 2××600MWe large size units will be built, at lease 840MWe of 600MWe large size units will be built, at lease 840MWe of small capacity must be decommissioned;small capacity must be decommissioned;The target is to decommission The target is to decommission 114,000 114,000 MWeMWe of inefficient of inefficient small thermal capacity in steps;small thermal capacity in steps;At least At least 55,000MWe55,000MWe small capacity must be decommissioned small capacity must be decommissioned from 2007 to 2010;from 2007 to 2010;For new built thermal power capacity, unit capacity must be For new built thermal power capacity, unit capacity must be 600MWe and above600MWe and above (except CHP) with (except CHP) with SC/USC steam SC/USC steam parameters.parameters. So far, So far, 80% of new orders80% of new orders of thermal power of thermal power capacity are capacity are 600/1,000MWe SC/USC units.600/1,000MWe SC/USC units.
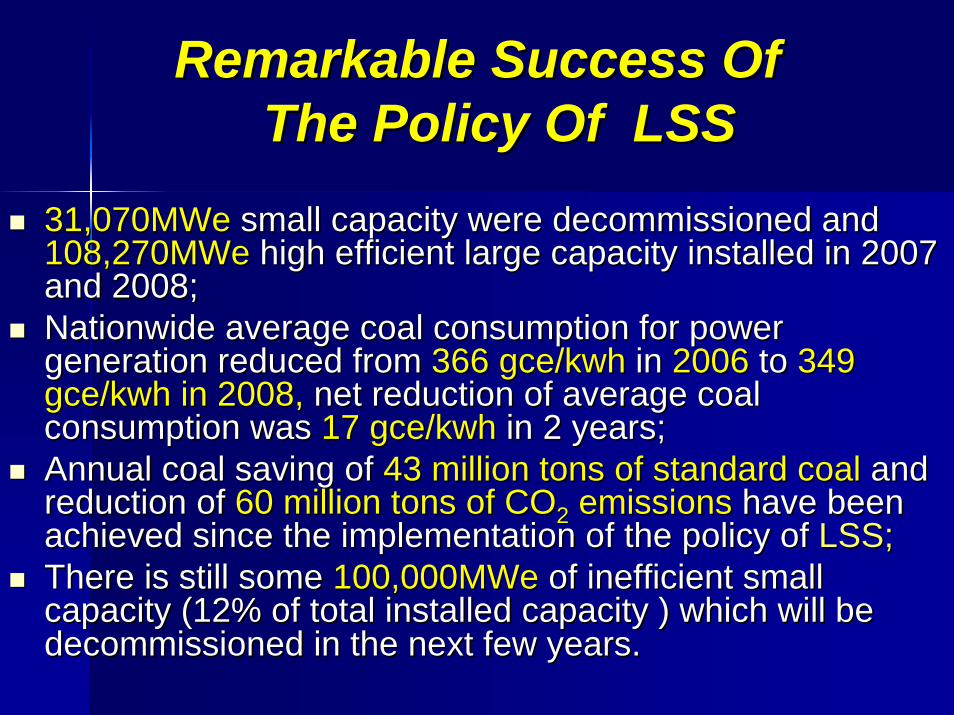
Remarkable Success Of Remarkable Success Of The Policy Of LSSThe Policy Of LSS
31,070MWe31,070MWe small capacity were decommissioned andsmall capacity were decommissioned and108,270MWe 108,270MWe high efficient large capacity installed in 2007 high efficient large capacity installed in 2007 and 2008;and 2008;Nationwide average coal consumption for power Nationwide average coal consumption for power generation reduced from generation reduced from 366 366 gce/kwhgce/kwh in in 2006 2006 to to 349 349 gce/kwhgce/kwh in 2008, in 2008, net reduction of average coal net reduction of average coal consumption was consumption was 17 17 gce/kwhgce/kwh in 2 years;in 2 years;Annual coal saving of Annual coal saving of 43 million tons of standard coal 43 million tons of standard coal and and reduction of reduction of 6060 million tons of COmillion tons of CO22 emissionsemissions have been have been achieved since the implementation of the policy of achieved since the implementation of the policy of LSS;LSS;There is still some There is still some 100,000MWe100,000MWe of inefficient small of inefficient small capacity (12% of total installed capacity ) which will be capacity (12% of total installed capacity ) which will be decommissioned in the next few yearsdecommissioned in the next few years..
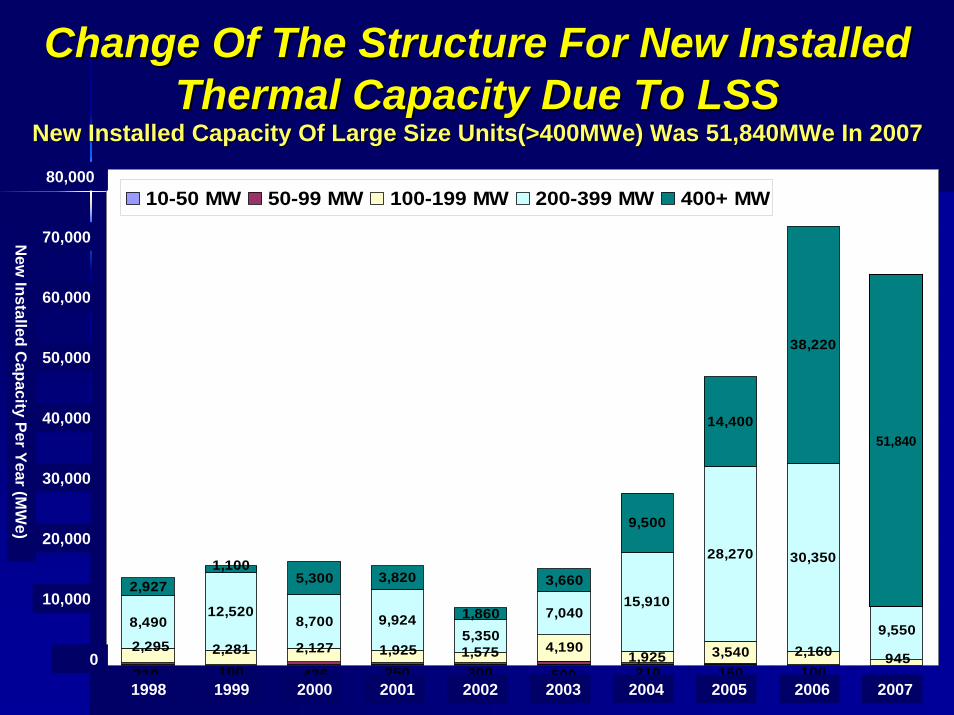
Change Of The Structure For New Installed Change Of The Structure For New Installed Thermal Capacity Due To LSSThermal Capacity Due To LSS
New Installed Capacity Of Large Size Units(>400MWe) Was 51,840MWNew Installed Capacity Of Large Size Units(>400MWe) Was 51,840MWe In 2007e In 2007
1,925 3,540
8,49012,520
8,700 9,9245,350
7,04015,910
28,270 30,350
9,550
2,927 5,300 3,820
1,860
3,660
9,500
14,400
38,220
47,790
100160210500300250436100310
2,127 1,575 9452,1601,9252,295 2,281 4,190
1,100
0
10,000
20,000
30,000
40,000
50,000
60,000
70,000
80,000
1998 1999 2000 2001 2002 2003 2004 2005 2006 2007
Uni
t Cap
acity
(MW
)
10-50 MW 50-99 MW 100-199 MW 200-399 MW 400+ MW80,000
70,000
60,000
50,000
40,000
30,000
20,000
10,000
1998
0
1999 2000 2001 2002 2003 2004 2005 2006 2007
New
Installed Capacity Per Year (M
We)
51,840

Large Size Units In Operation In 2007Large Size Units In Operation In 2007
Type of unitsType of units Number Number of unitsof units
Coal Coal consumptionconsumption
((g/kwhg/kwh))
Net Net efficiencyefficiency((%%))
USC 1000MWeUSC 1000MWe((7000MWe7000MWe)) 77 285.6285.6 43.0343.03
USC 600MWe (1200MWeUSC 600MWe (1200MWe)) 33 292292 42.0942.09
SC 600MWe classSC 600MWe class((90,680MWe90,680MWe)) 112112 299299 41.1041.10
SubSub--critical 300MWe classcritical 300MWe class((162,793MWe162,793MWe))
540540 340340 36.1536.15
SubSub--critical 600MWecritical 600MWe((71,000MWe71,000MWe MWeMWe))
118118 331331 37.1237.12
The Capacity Of Unites With Unit Capacity ≥300MWe Was332,673MWe, Accounting For~60%Of Total Thermal Capacity
Note: Total installed capacity for thermal power was 554,420MWe in 2007
Acc
umul
ativ
e ca
paci
ty o
f ord
er (
MW
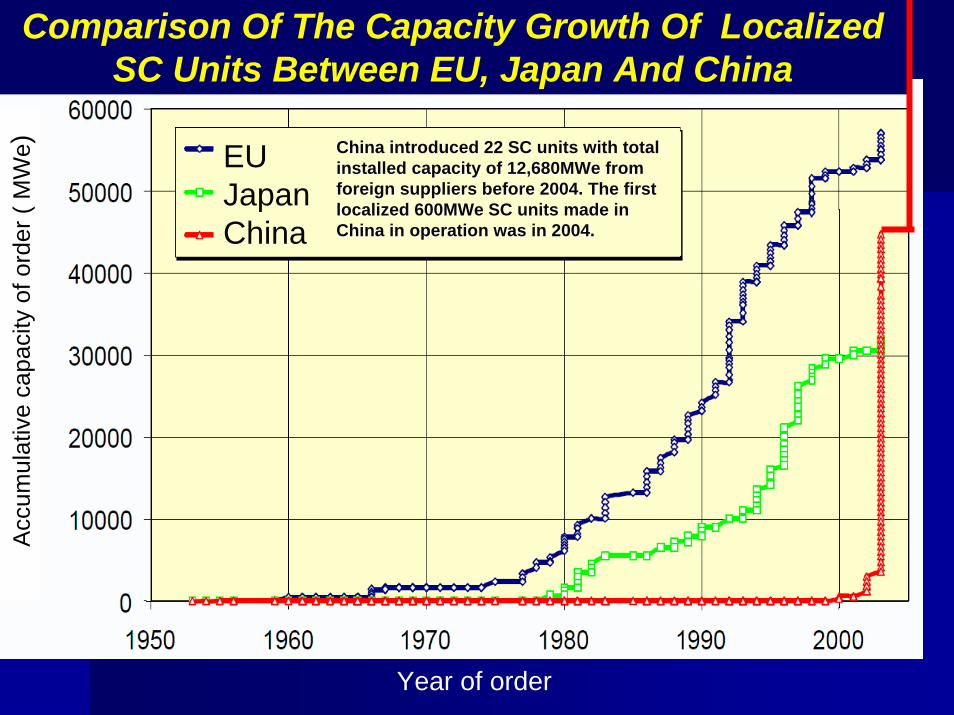
e)Comparison Of The Capacity Growth Of Localized
SC Units Between EU, Japan And China
Year of order
EUJapanChina
China introduced 22 SC units with total China introduced 22 SC units with total installed capacity of 12,680MWe from installed capacity of 12,680MWe from foreign suppliers before 2004. The first foreign suppliers before 2004. The first localized 600MWe SC units made in localized 600MWe SC units made in China in operation was in 2004.China in operation was in 2004.

Statistic Of SC/USC Units In China In 2007Statistic Of SC/USC Units In China In 2007
ItemItem In operationIn operation Under constructionUnder construction New OrderedNew Ordered
Total Total CapacityCapacity
Type of Type of unitsunits
CapacityCapacity((MWeMWe))
Number Number of unitsof units
99,480MWe99,480MWe >100,000MWe>100,000MWe 82,400MWe82,400MWe
SCSC USCUSC SC/USCSC/USC SCSC USCUSC
90,68090,680 8,8008,800 >100,000MWe>100,000MWe 25,40025,400 57,00057,000
112112 1010 > 167> 167(Equivalent to 600MWe)(Equivalent to 600MWe)
6666 6565
Source: CEC 2008

Statistics of Ordered USC Boilers Statistics of Ordered USC Boilers In China By May 2008In China By May 2008
1000MWe 1000MWe 660MWe 660MWe 600MWe 600MWe
No.No. CapacityCapacity((MWeMWe))
No.No. CapacityCapacity((MWeMWe ))
No.No. CapacityCapacity((MWeMWe))
HarbinHarbin 1616 16,00016,000 1818 11,880 11,880 1010 6,0006,000
ShanghaiShanghai 3636 36,000 36,000 1616 10,560 10,560
DongfangDongfang 2828 28,00028,000 1010 6,6006,600
Beijing B&WBeijing B&W 44 4,0004,000 22 1,3201,320 44 24,0024,00
SubSub--totaltotal 8484 84,00084,000 4646 30,36030,360 1414 8,4008,400
TotalTotal Total number of Total number of ordered USC units ordered USC units were 144 by May,2008were 144 by May,2008
Total capacity of ordered Total capacity of ordered USC units were 122,760 USC units were 122,760 MWeMWe by May,2008by May,2008
ItemItem
Source: CEC 2008
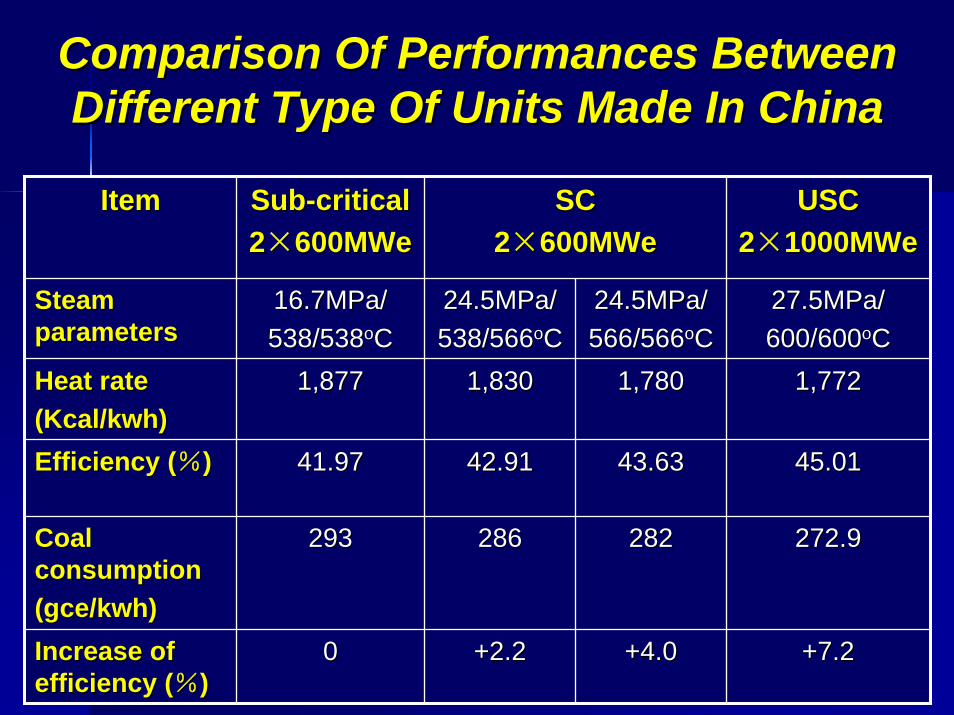
Comparison Of Performances Between Comparison Of Performances Between Different Type Of Units Made In ChinaDifferent Type Of Units Made In China
ItemItem SubSub--criticalcritical22××600MWe600MWe
SCSC22××600MWe600MWe
USCUSC22××1000MWe1000MWe
Steam Steam parametersparameters
16.7MPa/16.7MPa/538/538538/538ooCC
24.5MPa/24.5MPa/538/566538/566ooCC
24.5MPa/24.5MPa/566/566566/566ooCC
27.5MPa/27.5MPa/600/600600/600ooCC
Heat rateHeat rate(Kcal/(Kcal/kwhkwh))
1,8771,877 1,8301,830 1,7801,780 1,7721,772
Efficiency (Efficiency (%%)) 41.9741.97 42.9142.91 43.6343.63 45.0145.01
Coal Coal consumptionconsumption((gce/kwhgce/kwh))
293293 286286 282282 272.9272.9
Increase of Increase of efficiency (efficiency (%%))
00 +2.2+2.2 +4.0+4.0 +7.2+7.2
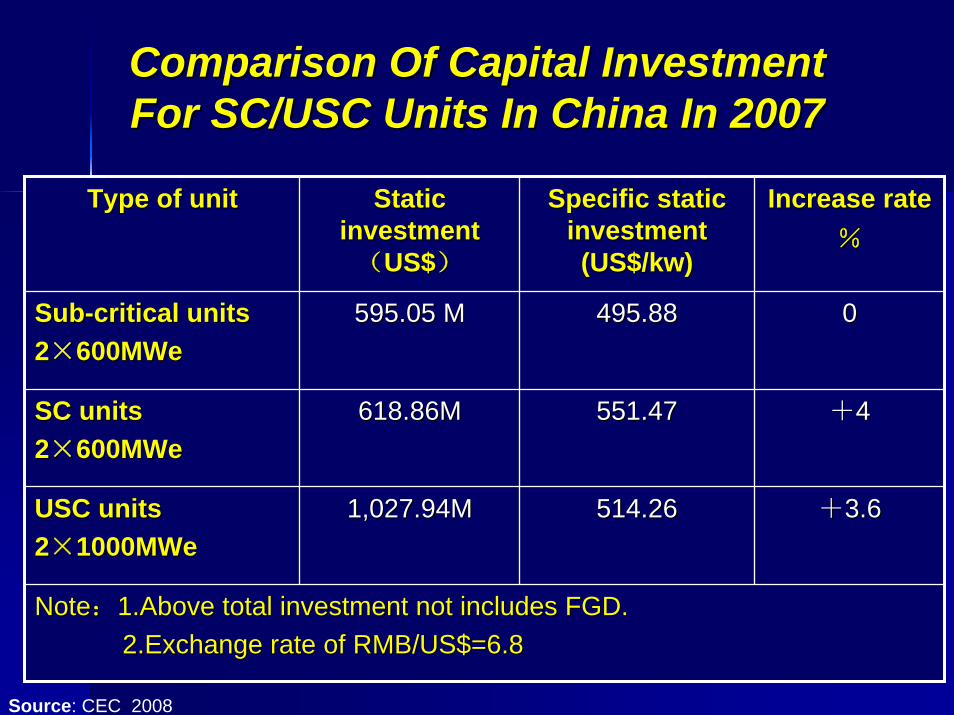
Comparison Of Capital Investment Comparison Of Capital Investment For SC/USC Units In China In 2007For SC/USC Units In China In 2007
Type of unitType of unit Static Static investmentinvestment((US$US$))
Specific static Specific static investment investment (US$/(US$/kwkw))
Increase rateIncrease rate%%
SubSub--critical unitscritical units22××600MWe600MWe
595.05 M595.05 M 495.88495.88 00
SC unitsSC units22××600MWe600MWe
618.86M618.86M 551.47551.47 ++44
USC unitsUSC units22××1000MWe1000MWe
1,027.94M1,027.94M 514.26514.26 ++3.63.6
NoteNote::1.Above total investment not includes FGD.1.Above total investment not includes FGD.2.Exchange rate of RMB/US$=6.82.Exchange rate of RMB/US$=6.8
Source: CEC 2008
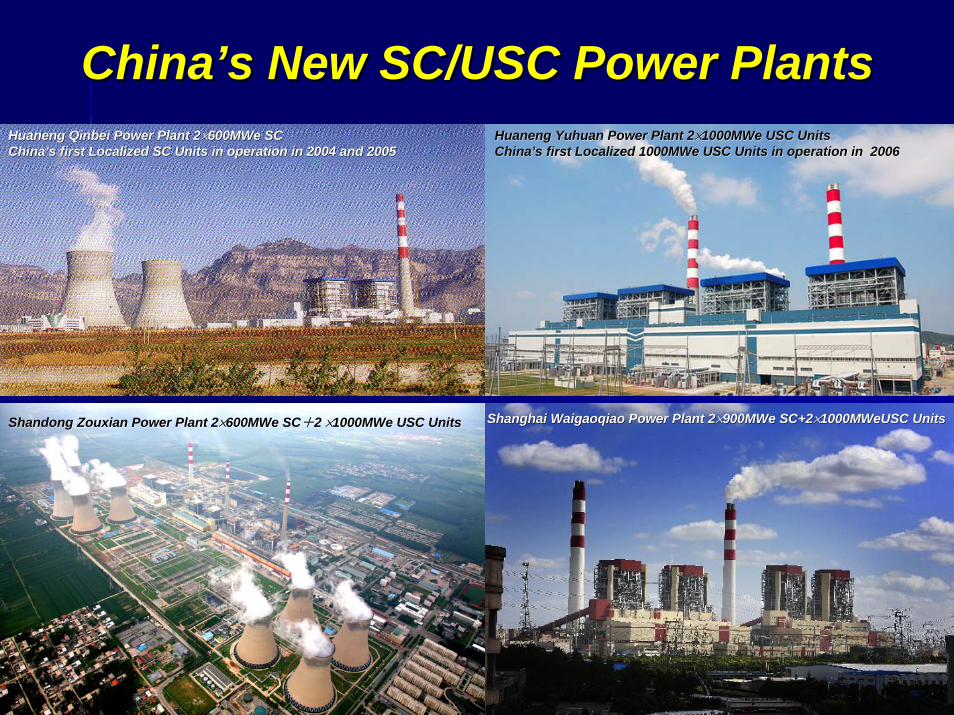
ChinaChina’’s New SC/USC Power Plantss New SC/USC Power Plants
Shandong Shandong ZouxianZouxian Power Plant 2Power Plant 2××600MWe SC600MWe SC++2 2 ××1000MWe USC Units1000MWe USC Units Shanghai Shanghai WaigaoqiaoWaigaoqiao Power Plant 2Power Plant 2××900MWe SC+2900MWe SC+2××1000MWeUSC Units1000MWeUSC Units
HuanengHuaneng QinbeiQinbei Power Plant 2Power Plant 2××600MWe SC600MWe SCChinaChina’’s first Localized SC Units in operation in 2004 and 2005s first Localized SC Units in operation in 2004 and 2005
HuanengHuaneng YuhuanYuhuan Power Plant 2Power Plant 2××1000MWe USC Units 1000MWe USC Units ChinaChina’’s first Localized 1000MWe USC Units in operation in 2006s first Localized 1000MWe USC Units in operation in 2006

0
200
400
600
800
1000
1200
1400
25 30 35 40 45 50 55 60Efficiency [%]
Spe
c. C
O2-
Emis
sion
s [g
/kW
h]
- 35% CO2- 35% CO2
USC today
Average Today
- 42%- 42%
USC future
The Role Of SC/USC Before CCS IsThe Role Of SC/USC Before CCS Is

China Is Moving Quickly Towards Developing China Is Moving Quickly Towards Developing And Demonstrating CCS TechnologiesAnd Demonstrating CCS Technologies
Activities Of Activities Of DomesticDomestic DevelopmentDevelopment
◇◇ R&D programs of CCS:R&D programs of CCS:R&D programs supported by ChinaR&D programs supported by China’’s High Tech Programs such as 863 s High Tech Programs such as 863 and 973: and 973: -- Tsinghua UniversityTsinghua University (Beijing(Beijing): ): Post combustion capture Post combustion capture OxyfuelOxyfuel for PC boiler; for PC boiler; eenhanced nhanced ooil il rrecovery ecovery ((EOREOR))Policy, system and economic analysis of CCSPolicy, system and economic analysis of CCS-- Huazhong University of Science and Technology (Wuhan)Huazhong University of Science and Technology (Wuhan): : Oxyfuel for PC boilerOxyfuel for PC boiler-- Southeast UniversitySoutheast University (Nanjing):(Nanjing): Oxyfuel for CFB boilerOxyfuel for CFB boiler-- GreenGen (HuanengGreenGen (Huaneng): ): PrePre-- combustion (IGCC)combustion (IGCC)
◇◇ Pilot plant/demonstration projects of PCC:Pilot plant/demonstration projects of PCC:-- HuanengHuaneng Power GroupPower Group’’ss postpost--combustion capture (PCC) pilot combustion capture (PCC) pilot project of project of 3,000 tons of CO3,000 tons of CO22 per year per year at at GaobeidianGaobeidian power plant in power plant in suburban Beijing (operation in 2008)suburban Beijing (operation in 2008)-- HuanengHuaneng Power GroupPower Group’’ss new PCC test project of new PCC test project of 150,000 tons /year 150,000 tons /year of COof CO22 will be built at Shanghai will be built at Shanghai ShidongkouShidongkou Power plant 2011Power plant 2011..

China Is Moving Quickly Towards Developing China Is Moving Quickly Towards Developing And Demonstrating CCS TechnologiesAnd Demonstrating CCS Technologies
Activities OfActivities Of International CooperationInternational Cooperation
ChinaChina--UK: UK: Near Zero Emissions Coal Project (NZEC)Near Zero Emissions Coal Project (NZEC)( ( www.nzec.info/en/www.nzec.info/en/) ) ChinaChina--EU:EU: Cooperation Action within CCS ChinaCooperation Action within CCS China--EU(COACH)EU(COACH)((www.CO2www.CO2--coach.com/coach.com/) ) ChinaChina--EU:EU: STRACO2 projectSTRACO2 project ((www.euchinawww.euchina--ccs.org/ccs.org/).).ChinaChina--USA:USA: Guidelines for Safe and Effective CCS in ChinaGuidelines for Safe and Effective CCS in ChinaTsinghua UniversityTsinghua University and and World Resources Institute (WRI)World Resources Institute (WRI) have have prepared a draft of Guidelines for Safe and Effective CCS in Chiprepared a draft of Guidelines for Safe and Effective CCS in China. na. This This effort is being funded with support from the U.S. Department of effort is being funded with support from the U.S. Department of State State under the Asia Pacific Partnershipunder the Asia Pacific Partnership ((www.asiapacificpartnership.orgwww.asiapacificpartnership.org//))ChinaChina--Japan :Japan : Enhanced Oil Recovery Enhanced Oil Recovery ((EOR)EOR) projectproject::DaqingDaqing Oil Field Oil Field andand RITE RITE will Jointly engineer to capture 3will Jointly engineer to capture 3--4 million 4 million tons of COtons of CO22 per annum from two 600per annum from two 600 MWeMWe coalcoal--fired power plants, fired power plants, retrofitted for postretrofitted for post--combustion CCS and linked by pipeline to a nearcombustion CCS and linked by pipeline to a near--by by mature oil field to enhance oil production by 30mature oil field to enhance oil production by 30--40,000 barrels per day40,000 barrels per day

China's First Carbon Capture Trial Is Being Rated China's First Carbon Capture Trial Is Being Rated A Success By China A Success By China HuanengHuaneng Power CompanyPower Company
Huaneng'sHuaneng's postpost--combustion capture (PCC) pilot project started in combustion capture (PCC) pilot project started in June 2008 at the company's June 2008 at the company's GaobeidianGaobeidian power plantpower plant in suburban in suburban Beijing,Beijing, removing COremoving CO22 after coal combustion. The investment of this after coal combustion. The investment of this project is 20 million RMB (2.95 million USD)project is 20 million RMB (2.95 million USD)
Huaneng'sHuaneng's postpost--combustion capture combustion capture (PCC) pilot plant(PCC) pilot plant
HuanengHuaneng Beijing Beijing GaobeidianGaobeidian Power PlantPower Plant

◇◇ The technology of The technology of HuanengHuaneng’’ss pilot plant uses amino alcohol solvents to capture COpilot plant uses amino alcohol solvents to capture CO22 from power from power plant flue gasesplant flue gases and has the potential to reduce COand has the potential to reduce CO22 emissions from existing and future coalemissions from existing and future coal--fired power plants by more than fired power plants by more than 85%.85%. The The HuanengHuaneng pilot plant is designed to capture pilot plant is designed to capture 3,000 3,000 tons of COtons of CO22 per year;per year;
◇◇ The design parameters of the pilot plant are:The design parameters of the pilot plant are:Flue gas flow to pilot unit: 2000Flue gas flow to pilot unit: 2000--3000 Nm3000 Nm33/h/hSteam consumption: 3GJ/tSteam consumption: 3GJ/t COCO22
Solvent consumption: < 1.35 kg/t Solvent consumption: < 1.35 kg/t COCO22

UC/USC Will Play Tremendous Role In COUC/USC Will Play Tremendous Role In CO2 2 Reduction For Coal Fired Power Plants In ChinaReduction For Coal Fired Power Plants In China
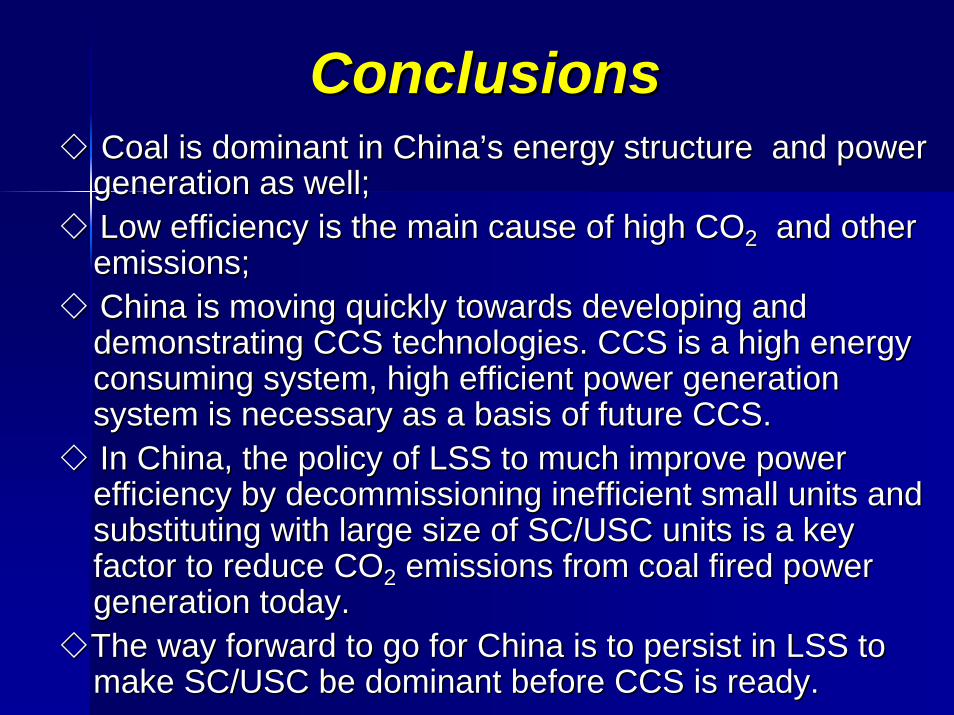
ConclusionsConclusions◇◇ Coal is dominant in ChinaCoal is dominant in China’’s energy structure and power s energy structure and power
generation as well;generation as well;◇◇ Low efficiency is the main cause of high COLow efficiency is the main cause of high CO22 and other and other
emissions;emissions;◇◇ China is moving quickly towards developing and China is moving quickly towards developing and
demonstrating CCS technologies. CCS is a high energy demonstrating CCS technologies. CCS is a high energy consuming system, high efficient power generation consuming system, high efficient power generation system is necessary as a basis of future CCS. system is necessary as a basis of future CCS.
◇◇ In China, the policy of LSS In China, the policy of LSS to much improve power to much improve power efficiency by decommissioning inefficient small units and efficiency by decommissioning inefficient small units and substituting with large size of SC/USC units is a key substituting with large size of SC/USC units is a key factor to reduce COfactor to reduce CO22 emissions from coal fired power emissions from coal fired power generation today.generation today.
◇◇The way forward to go for China is to persist in LSS to The way forward to go for China is to persist in LSS to make SC/USC be dominant before CCS is ready. make SC/USC be dominant before CCS is ready.

Thank you!Thank you!