Embed Size (px)
Citation preview

ECMWFSlide 1
How does 4D-Var handle Nonlinearity and non-Gaussianity?
Mike Fisher
Acknowledgements: Christina Tavolato, Elias Holm, Lars Isaksen, Tavolato, Yannick
Tremolet

ECMWFSlide 2
Outline of Talk
Non-Gaussian pdf’s in the 4d-Var cost function- Variational
quality control
- Non-Gaussian background errors for humidity
Can we use 4D-Var analysis windows that are longer than the timescale over which non-linear effects dominate?
- Long-window, weak constraint 4D-Var

ECMWFSlide 3
Non-Gaussian pdf’s in the 4D-Var cost function
The 3D/4D-Var cost function is simply the log of the pdf:
Non-Gaussian pdf’s of observation error and background error result in non-quadratic cost functions.In principle, this has the potential to produce multiple minima – and difficulties in minimization.In practice, there are many cases where the ability to specify non-Gaussian pdf’s is very useful, and does not give rise to significant minimization problems.
- Directionally-ambiguous scatterometer
winds- Variational
quality control- Bounded variables: humidity, trace gasses, rain rate, etc.
( ) ( ) ( ) ( ) K−−−∝−∝ )|(log)|(log,|(log xxpxypxyxpxJ bb

ECMWFSlide 4
Variational quality control and robust estimation
Variational quality control has been used in the ECMWF analysis for the past 10 years.Observation errors are modelled as a combination of a Gaussian and a flat (boxcar) distribution:
With this pdf, observations close to x are treated as if Gaussian, whereas those far from x are effectively ignored.
( )2
| (1 ) , where (gross error), and:
1 1 ( )exp22
1 if ( ) / 2, zero otherwise
G G G
oo
p y x P N P G P p
y H xN
G y H x DD
σσ π
= − + =
⎡ ⎤⎛ ⎞−⎢ ⎥= − ⎜ ⎟⎢ ⎥⎝ ⎠⎣ ⎦
= − <

ECMWFSlide 5
Variational quality control and robust estimation
An alternative treatment is the Huber metric:
Equivalent to L1 metric far from x, L2 metric close to x.With this pdf, observations far from x are given less weight than observations close to x, but can still influence the analysis.Many observations have errors that are well described by the Huber metric.
( )
2
2
2
1 exp if 22
1 1| exp 22
1 exp if 22
o
o
o
a a a
p y x a b
b b b
δ δσ π
δ δσ π
δ δσ π
⎧ ⎛ ⎞− <⎪ ⎜ ⎟
⎪ ⎝ ⎠⎪⎪ ⎡ ⎤= − ≤ ≤⎨ ⎢ ⎥⎣ ⎦⎪⎪ ⎛ ⎞⎪ − >⎜ ⎟⎪ ⎝ ⎠⎩
( )where o
y H xδσ−
=

ECMWFSlide 6
Variational quality control and robust estimation
18 months of conventional data-Feb 2006 –
Sep 2007
Normalised fit of PDF to data- Best Gaussian fit
- Best Huber norm fit

ECMWFSlide 7
Variational quality control and robust estimation
Gaussian
Huber
Gaussian + flat

ECMWFSlide 8
Comparing optimal observation weights Huber-norm (red) vs. Gaussian+flat (blue)
More weight in the middle of the distribution
-σo
was retuned
More weight on the edges of the distribution
More influence of data with large departures
-Weights: 0 –
25%
25%
Weight relative to gaussian
(no VarQC) case

ECMWFSlide 9
Test Configuration
Huber norm parameters for- SYNOP, METAR, DRIBU: surface pressure, 10m wind- TEMP, AIREP: temperature, wind- PILOT: wind
Relaxation of the fg-check- Relaxed first guess checks when Huber VarQC is done- First Guess rejection limit set to 20σ
Retuning of the observation error- Smaller observation errors for Huber VarQC

ECMWFSlide 10
French storm 27.12.1999
Surface pressure:-Model (ERA interim T255): 970hPa
-Observations: 963.5hPa
-Observation are supported by neighbouring stations!

ECMWFSlide 11
Data rejection and VarQC weights – Era interim 27.12.99 18UTC +60min
fg
–
rejected
used
VarQC weight = 50-75%
VarQC weight = 25-50%
VarQC weight = 0-25%

ECMWFSlide 12
Data rejection and VarQC weights – Huber exp.
VarQC weight = 50-75%
VarQC weight = 25-50%
VarQC weight = 0-25%
ECMWFSlide 13
MSL Analysis differences: Huber – Era
New min 968 hPa
Low shifted towards the lowest surface pressure observations
DiffAN = 5.6 hPa
ECMWFSlide 14
20 40 60 80 100
20
40
60
80
8.9E-063.0E-044.0E-033.2E-021.8E-016.9E-012.0E+004.0E+005.9E+00
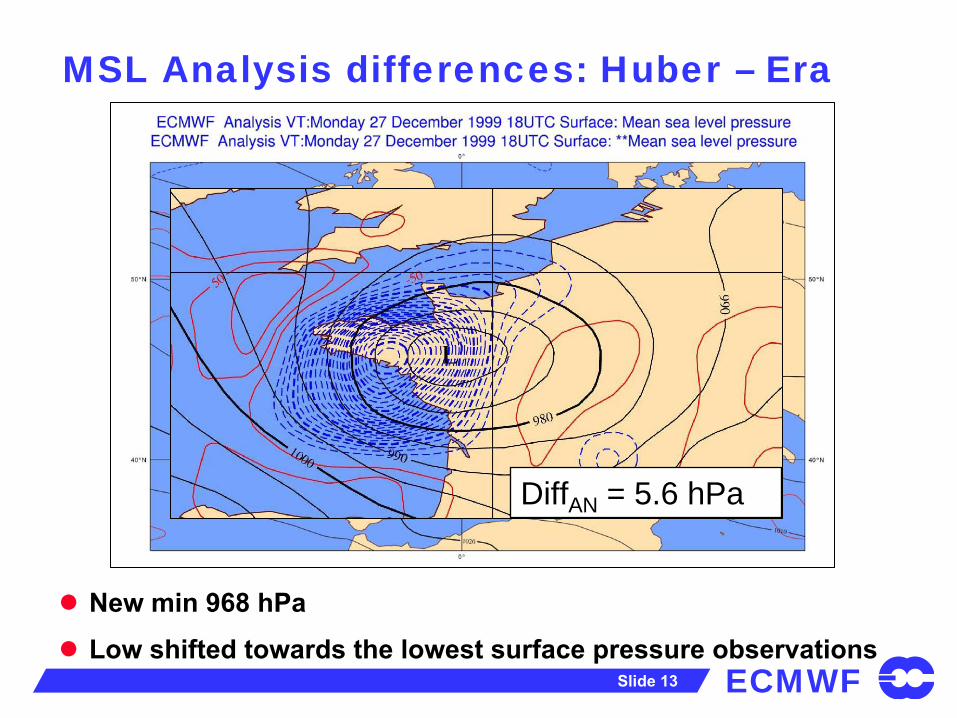
The pdf
of background error is asymmetric when stratified by brh12
brh rhδ+
Joint pdf: ( )1 2,b bP rh rh
Humidity control variable
( )( )
2 1
1 1
|
|
b b
b b
P rh rh
P rh rh rhδ= +
( )( )
2 1 1 2
1
|
| 2
b b b b
b
P rh rh rh rh
P rh rh rhδ δ
− +
= +
The pdf
of background error is symmetric when stratified by
for two members of an ensemble of 4D-Var analyses.
is representativeof background error
2 1b brh rh rhδ = −
rh2
(%)
rh1
(%)

ECMWFSlide 15
Humidity control variable
-5 -4 -3 -2 -1 0 1 2 3 4 5Standard deviation
0.10
1.00
Prob
abili
ty d
ensi
ty fu
nctio
n
Lowest RH+dRH/2Median RH+dRH/2Highest RH+dRH/2Gaussian
0.0 0.1 0.2 0.3 0.4 0.5 0.6 0.7 0.8 0.9 1.0 1.1RH + dRH/2
0.00
0.05
0.10
Standard deviationBias
The symmetric pdf
can be modelled by a normal distribution.
The variance changes with and the bias is zero.
A control variable with an approximately unit normal distribution is obtained by anonlinear normalization:
1|2
bP rh rh rhδ δ⎛ ⎞+⎜ ⎟⎝ ⎠
12
brh rhδ+
12
b
rhrhrh rh
δδσ δ
=⎛ ⎞+⎜ ⎟⎝ ⎠
rhδ

ECMWFSlide 16
Humidity control variable
The background error cost function Jb is now nonlinear.
Our implementation requires linear inner loops (so that we can use efficient, conjugate-gradient minimization).
- Inner loops: use
- Outer loops: solve for from the nonlinear equation:
( ) ( ) ( )1 where12
Tb
b
rhJ f rh B f rh f rhrh rh
δδ δ δσ δ
−= =⎡ ⎤⎣ ⎦ ⎛ ⎞+⎜ ⎟⎝ ⎠
( )brh rh rhδ δ σ=rhδ
12
b
rh rhrh rh
δ δσ δ
=⎛ ⎞+⎜ ⎟⎝ ⎠

ECMWFSlide 17
What about Multiple Minima?
Example: strong-constraint 4D-Var for the Lorenz three-variable model:
Figure 1: The MSE cost function in the Lorenz model as a function of error in the initial
value of the Y coordinate. The function becomes increasingly pathological as the assimilationperio d is increased.
from: Roulstone, 1999
ECMWFSlide 18
What about Multiple Minima?
In strong-constraint 4D-Var, the control variable is x0.
We rely on the model to propagate the state from initial time to observation time.For long windows, this results in a highly nonlinear Jo.In weak-constraint 4D-Var, the control variable is (x0,x1,…,xK), and (for linear observation operators) Jo is quadratic.
Jq is close to quadratic if the TL approximation is accurate over the sub-interval [tk-1, tk].
( ) ( )1 1
11 1
1k k k k
K T
q k t t k k t t kk
J x M x R x M x− −
−→ − → −
=
⎡ ⎤ ⎡ ⎤= − −⎣ ⎦ ⎣ ⎦∑
( )( ) ( )( )0 0
10 0
0k k
K T
o k k t t k k t tk
J y H M x R y H M x−→ →
=
⎡ ⎤ ⎡ ⎤= − −⎣ ⎦ ⎣ ⎦∑
( ) ( )1
0
K To k k k k k k
kJ y H x R y H x−
=
= − −⎡ ⎤ ⎡ ⎤⎣ ⎦ ⎣ ⎦∑

ECMWFSlide 19
-1 -0.5 0 0.5 1ε / σ
o
0
10000
20000
30000
40000
50000
60000
70000
Cost
Jo + J
q (weak constraint)
Jo (weak constraint)
Jo (strong constraint)
Cross-section of the cost function for a random perturbation to the control vector.
Lorenz 1995 model.20-day analysis window.

ECMWFSlide 20
0 2 4 6 8 10Length of Analysis Window (days)
0
0.1
0.2
0.3
0.4RM
S A
naly
sis E
rror
RMS error for EKF
Long-window, weak-constraint 4D-Var
RMS error for OI
RMS error for 4dVar
2 1 1 1
0 40
1 39
41 1
with 1, 2 40
8
ii i i i i
dx x x x x x Fdt
ix xx xx x
F
− − − +
−
= + − +
===
==
K
Lorenz ’95 model

ECMWFSlide 21
What about multiple minima?
From: Evensen (MWR 1997 pp1342-1354: Advanced Data Assimilation for Strongly Nonlinear Dynamics).
- Weak constraint 4dVar for the Lorenz 3-variable system.- ~50 orbits of the lobes of the attractor, and 15 lobe transitions.
-20
-15
-10
-5
0
5
10
15
20
0 5 10 15 20 25 30 35 40time t
GRD: Estimate
dotted=truthsolid=analysisdiamonds=obs

ECMWFSlide 22
The abstract from Evensen’s 1997 paper is interesting:- This paper examines the properties of three advanced data
assimilation methods when used with the highly nonlinear Lorenz equations. The ensemble Kalman filter is used for sequential data assimilation and the recently proposed ensemble smoother method and a gradient descent method are used to minimize two different weak constraint formulations.
- The problems associated with the use of an approximate tangent linear model when solving the Euler-Lagrange equations, or when the extended Kalman filter is used, are eliminated when using these methods. All three methods give reasonable consistent results with the data coverage and quality of measurements that are used here and overcome the traditional problems reported in many of the previous papers involving data assimilation with highly nonlinear dynamics.
What about multiple minima?
*
*i.e. weak-constraint 4D-Var

ECMWFSlide 23
Weak Constraint 4D-Var in a QG model
The model:- Two-level quasi-geosptrophic
model on a cyclic channel
- Solved on a 40×20 domain with Δx=Δy=300km- Layer depths D1
=6000m, D2
=4000m- Ro
= 0.1- Very simple numerics: first order semi-Lagrangian
advection with
cubic interpolation, and 5-point stencil for the Laplacian.
0 (for 1, 2)iDq iDt
= =
( )21 1 1 1 2
22 2 2 2 1( ) s
q F y
q F y R
ψ ψ ψ β
ψ ψ ψ β
= ∇ − − +
= ∇ − − + +
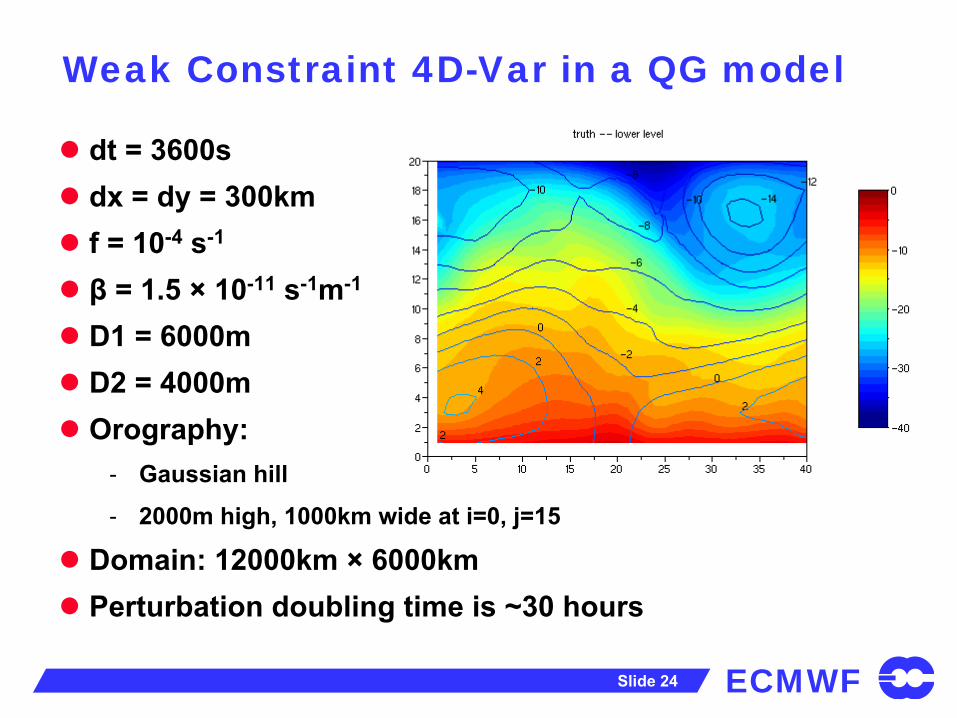
ECMWFSlide 24
Weak Constraint 4D-Var in a QG model
dt = 3600sdx = dy = 300kmf = 10-4 s-1
β = 1.5 × 10⁻¹¹ s-1m-1
D1 = 6000mD2 = 4000mOrography:
- Gaussian hill
- 2000m high, 1000km wide at i=0, j=15
Domain: 12000km × 6000kmPerturbation doubling time is ~30 hours

ECMWFSlide 25
Weak Constraint 4D-Var in a QG model
One analysis is produced every 6 hours, irrespective of window length:
Background
Analysis
Analysis
Forecast
Linearisation Trajectory
Analysis
Forecast
Linearisation Trajectory
Background
Analysis
Analysis
Forecast
Linearisation Trajectory
Analysis
Forecast
Linearisation Trajectory
Analysis
Forecast
Linearisation Trajectory
Analysis
Forecast
Linearisation Trajectory
The analysis is incremental, weak-constraint 4D-Var, with a linear inner-loop, and a single iteration of the outer loop.
Inner and outer loop resolutions are identical.

ECMWFSlide 26
Weak Constraint 4D-Var in a QG model
Observations:- 100 observing points, randomly distributed between levels, and at
randomly chosen gridpoints.
- For each observing point, an observation of streamfunction
is made every 3 hours.
- Observation error: σo
=1.0 (in units of non-dimensional streamfunction)
Obs
at level 1 Obs
at level 2

ECMWFSlide 27
Weak Constraint 4D-Var in a QG model
0 24 48 72 96 120 144 168 192 216 240Time (hours)
0
0.2
0.4
0.6
0.8
1
1.2
1.4
1.6
1.8
2N
onlin
eari
ty I
ndex
( )( ) ( )
( )( ) ( ) / 2
where:( ) difference from control of
integration with positive initial perturbation.( ) difference from control of
integration with negative initial perturbation
t tt
t t
t
t
δψ δψ
δψ δψ
δψ
δψ
+ −
+ −
+
−
+Θ =
+
=
=.
ECMWF model T159 L31 Nonlinearity dominates for
Θ>0.7 (Gilmour et al., 2001)
Initial perturbation drawn from N(0,Q)

ECMWFSlide 28
Weak Constraint 4D-Var in a QG model
0 24 48 72 96 120 144 168 192 216 240Time Within Analysis Window (hours)
0
0.2
0.4
0.6
0.8
1
1.2
RM
S Er
ror f
or N
on-d
imen
sion
al S
tream
func
tion
Long-Window 4D-Var in a Two-Level QG ModelMean Analysis and First-Guess Error for Different Window Lengths
Thin lines = first guessThick lines = analysis
According to Gilmour et al.’s criterion, nonlinearity dominates, for windows longer than 60 hours.
Weak constraint 4D-Var allows windows that are much longer than the timescale for nonlinearity.

ECMWFSlide 29
Summary
The relationship: J=-log(pdf) makes it straightforward to include a wide range of non-Gaussian effects.
- VarQC
- Non-gaussian
bakground
errors for humidity,etc.
- nonlinear balances
- nonlinear observation operators (e.g. scatterometer)
- etc.
In weak-constraint 4D-Var, the tangent-linear approximation applies over sub-windows, not over the full analysis window.
- The model appears in Jq
as
Window lengths >> nonlinearity time scale are possible.kk ttM →−1

ECMWFSlide 30
How does 4D-Var handle Nonlinearity and non-Gaussianity?
Surprisingly Well!
Acknowledgements: Christina Tavolato, Elias Holm, Lars Isaksen, Tavolato, Yannick
Tremolet
Thank you for your attention.