Embed Size (px)
Citation preview
1
How Do Smokers Respond to Cigarette Taxes?
Evidence from China’s Cigarette Industry*
Hong Liua John A. Rizzo
b Qi Sun
c Fang Wu
d
September 2013 (Preliminary, please do not cite)
Abstract
This paper examines how Chinese smokers respond to tax-driven cigarette price
increases by estimating a discrete choice model of demand for differentiated products,
using annual nationwide brand-level cigarette sales data in China from 2005 to 2010.
We allow for substitutions between different cigarette brands and also incorporate key
features of rational addiction theory into the model. Results show that the overall
own-price elasticity for cigarette at the brand level is 0.805 in China, and that high-
price brands have greater own-price elasticities than low-price brands. We find tax-
induced substitution towards low-price cigarettes as well as high-tar cigarettes, and
that tax hikes encourage within-class substitution more than across-class substitution.
These results have important policy implications for the potential impacts of cigarette
taxation.
Keywords: cigarette demand, discrete choice models, substitution, cigarette tax
* We would like to thank seminar participants at Shanghai University of Finance and Economics,
Central University of Finance and Economics, and Renmin University of China for helpful comments.
We acknowledge the financial support from the National Natural Science Foundation of China (Grant
No. 71203244 and No. 71303148), Humanities and Social Sciences Foundation of Ministry of
Education of China (Grant No. 13YJC790126), and Program for New Century Excellent Talents in
University (Grant No. NCET-12-0993).
a China Economics and Management Academy, Central University of Finance and Economics, Beijing,
10081, China. Email: [email protected]
b Department of Economics and Department of Preventive Medicine, Stony Brook University, Stony
Brook, 11794, USA. Email: [email protected]
c School of International Business Administration, Shanghai University of Finance and Economics,
Shanghai, 200433, China. Email: [email protected]
d School of International Business Administration, Shanghai University of Finance and Economics,
Shanghai, 200433, China. Email: [email protected]
2
1.Introduction
Cigarette smoking is widely regarded as a leading cause of preventable illness
and death in the world. Most countries have implemented various policies to reduce
smoking, such as price increases through higher taxes, advertising and promotion
bans, smoking restrictions, consumer education campaigns, and smoking cessation
therapies. Numerous studies have shown that cigarette taxation is one of the most
effective strategies (e.g. Keeler et al., 1993; Sung et al., 1994; Chaloupka and Warner,
2000), which can not only directly discourage the consumption of cigarette by price
increase, but may also be earmarked for other publicly-funded tobacco interventions
(Chaloupka et al., 2001; Tsai et al., 2003).
As the largest producer and consumer of cigarettes in the world, China had an
estimated 301 million adult smokers and the smoking prevalence among adult men
attained 52.9% in 2010 (Li et al., 2011). About two million people in China die from
smoking-related diseases each year (WHO, 2010). To address this critical public
health concern, China’s government has endeavored to control tobacco use through
various channels, but with limited success(Hu, 2006; Kenkel et al., 2009). Compared
to other countries, cigarette prices are very low in China (WHO, 2010); moreover, the
government has not implemented strong pricing and taxation measures to reduce
cigarette smoking. There is considerable uncertainty about the likely success of
cigarette taxation in China. First, there is limited evidence on Chinese consumers’
sensitivity to cigarette prices and other behavioral responses. Second, the Chinese
government has been cautious on major cigarette taxation overhaul since raising
tobacco taxes may have a negative impact on employment and tax revenues from the
tobacco industry, due to reduced cigarette consumption (Bishop et al., 2007; Hu et al.,
2010).
To shed light on this issue, the present study examines how Chinese smokers
respond to tax-driven cigarette price increases by estimating a discrete choice model
of demand, using annual nationwide cigarette sales data on more than 75 cigarette
3
brands during 2005 to 2010. Our approach makes several contributions to the
literature. First, unlike prior studies, we allow for product differentiation in this
market. Second, we employ brand-level data. These two features of our empirical
model allow for substitution across cigarette brands and help us to quantify smokers’
brand-switching behaviors. Third, we estimate not only own-price but cross-price
elasticities of cigarette consumption as well at the brand level. Using the estimate
parameters from the demand model, we then conduct numerical simulations to
investigate the potential impact of proposed tax increases on cigarette sales,
government revenue from cigarette taxes, and total tar and nicotine intakes.
There are several reasons to model the cigarette market, especially China’s
cigarette market, as one consisting of differentiated products. There are more than 100
cigarette brands in China which differ significantly in terms of quality and price.
Treating cigarettes as differentiated products allows us to better understand that, when
faced with price changes, consumers can not only choose the quantities of cigarette to
smoke (e.g. choose smoking or not smoking; or choose more or less cigarettes to
smoke), but may also choose different kinds of cigarettes to smoke (e.g. switch to less
expensive brands when cigarette prices increase). As a result, we are able to calculate
own-price as well as cross-price elasticities across cigarette brands. Therefore, given a
tax-induced increase in cigarette prices, our model is able to account for substitution
across different cigarette brands, and examine a richer set of smoker responses to
cigarette price increases.
What responses might one expect to observe with tax-induced cigarette prices
increases? First, smokers may try to maintain the number of cigarettes consumption
and control the tax-induced financial burden by switching to less expensive brands of
cigarettes (Wiltshire et al., 2001; Tsai et al., 2005). Second, since cigarette smoking is
addictive, there may be another important type of compensating behavior that is
biological. Cigarette taxes are levied per unit, independent of cigarette yields of
nicotine (which is the major psychoactive agent in tobacco) and tar (which is
associated with taste). A tax increase would lead to an increase in the price per unit of
4
tar and nicotine in low-yield brands, relative to high-yield brands. Thus, when faced
with the forced reductions in the number of cigarettes consumed, smokers may
compensate by switching to cigarettes higher in tar and nicotine content to maintain
their current levels of tar or nicotine intakes. As health risks of smoking are correlated
with average daily tar and nicotine intake (e.g. Stellman and Garfinkel, 1989), such
tax-induced compensating behavior may undermine the effectiveness of cigarette
taxation with regard to the health of smokers (Harris, 1980).
A number of recent studies have shown significant evidence of smokers’
compensatory behavior in response to tax changes using individual-level data from
the US or Taiwan (Evans and Farelly, 1998; Farelly et al., 2004; Tsai et al., 2005;
Adda and Cornaglia, 2006; Abrevaya and Puzzello, 2012; and Adda and Cornaglia,
2012). However, very few studies in the literature on cigarette demand have treated
cigarettes as differentiated products. Three notable exceptions are Tan (2006),
Cilliberto and Kuminoff (2011), and Qi (2013). They apply differentiated product
models to study the cigarette market in the US. However, these studies focus on the
effects of major policy changes on firms’ behaviors. In contrast, we focus on the
demand side, studying the effects of tax-induced increases in cigarette prices on
consumers’ smoking behaviors.
By studying cigarette demand in China, this paper is also related to a growing
empirical literature on the effects of price on cigarette demand in low- and middle-
income countries, a topic of considerable policy interests given the growth in cigarette
consumption in many of these countries. It is widely argued that smokers in
developing countries are likely to be more sensitive to the price of cigarettes than
those in developed countries (Warner, 1990), given their relatively low initial
smoking, low incomes (Warner, 1990) and education levels (Chaloupka et al., 2000).
Consistent with this argument, studies on Papua New Guinea (Chapman and
Richardson, 1990), and Bulgaria (Sayginsoy and De Beyer, 2002) report estimated
price elasticities that range from 0.8 to 1.42, considerably higher in magnitude
than the average estimates of about 0.4 (with a narrower range –0.3 to –0.5) for the
5
US and other industrialized countries (Warner, 1990; Lance et al., 2004; Wilkins et al.,
2004). The limited studies focusing on smokers in China find a wide range of price
elasticities of cigarette consumption. Lance et al. (2004) find that the price elasticity is
low, with a range of 0 to 0.15 in China, using longitudinal household and
community survey data in China. However, Bishop et al. (2007) obtain an elasticity
estimate of 0.5 using individual data in urban China in 1995. Chen and Xing (2011)
use another household survey data covering eight provinces in northern China from
1999 to 2001 and find an overall price elasticity ranging from 0.35 to 0.82,
depending on different model specifications.
Most of the above literature has treated cigarettes as a homogenous good so that
consumers can only choose to smoke fewer cigarettes when cigarette prices increase.
Therefore, they tend to overestimate the magnitude of own-price elasticity of cigarette
demand (i.e. underestimate the price sensitivity) because they do not allow for
smokers’ substitution behaviors. Chen and Xing (2011) is the first study to control for
smokers’ choice of cigarettes quality when estimating price elasticity of cigarette
demand in China. They measure a household’s choice of different cigarette quality by
calculating the unit costs of cigarettes that the household consumes (i.e. total expenses
on cigarettes divided by the total quantity of cigarette consumption). In our study, we
define differentiation in cigarettes at the brand level in terms of differentiation in
brand characteristics (e.g. price, nicotine, tar, and carbon-dioxide yields). Therefore,
we allow for more specific measures of differentiation in cigarette quality than the
unit-value measure, and are able to obtain more realistic substitution patterns of
cigarette demand, enhancing the accuracy of our policy simulations.
In addition, we incorporate key features of rational addiction theory (Becker and
Murphy, 1988; Ciliberto and Kuminoff, 2011) into our model. Thus in our model,
consumers’ smoking decisions are affected not only by the characteristics of cigarette
brands, but also by their past cigarette consumption as well as their expectations with
respect to future cigarette prices.
6
The remainder of the paper is organized as follows. Section 2 briefly describes
the institutional background of China’s tobacco industry and cigarette taxation
policies. Section 3 describes the data used in this paper. Section 4 introduces our
econometric model and estimation strategy. Section 5 presents our empirical findings,
and Section 6 concludes.
2. Industry Background
China is the largest producer and consumer of tobacco products in the world,
where thirty percent of the world’s cigarettes are consumed. China’s tobacco industry
is tightly regulated by the government, with farming, production, distribution, sales,
and marketing of all tobacco and tobacco products in China are under the control of
China National Tobacco Corporation (CNTC), a state-owned monopoly. The State
Tobacco Monopoly Administration (STMA) is the regulatory agency in charge of
enforcing related policies for tobacco and cigarette products in China. Although the
CNTC and the STMA were intended to be two separate entities in principle, in
practice they function as one organization with two name plates, performing both
functions of management and regulation.
CNTC has approximately 40 cigarette manufacturers with locations in every
province in China except Tibet. These manufacturers are responsible for cigarette
production, while the distribution sector of CNTC is in charge of cigarette sales.
STMA directly sets and controls the retail price of every cigarette brand in China
through its licensing system because only licensed retailer can legally sell cigarettes in
China.
There are over 100 domestic cigarette brands in the market (Li et al., 2010).
Foreign brands have been introduced into the market since China entered the World
Trade Organization in 2001, but they only account for about 3 percent of the Chinese
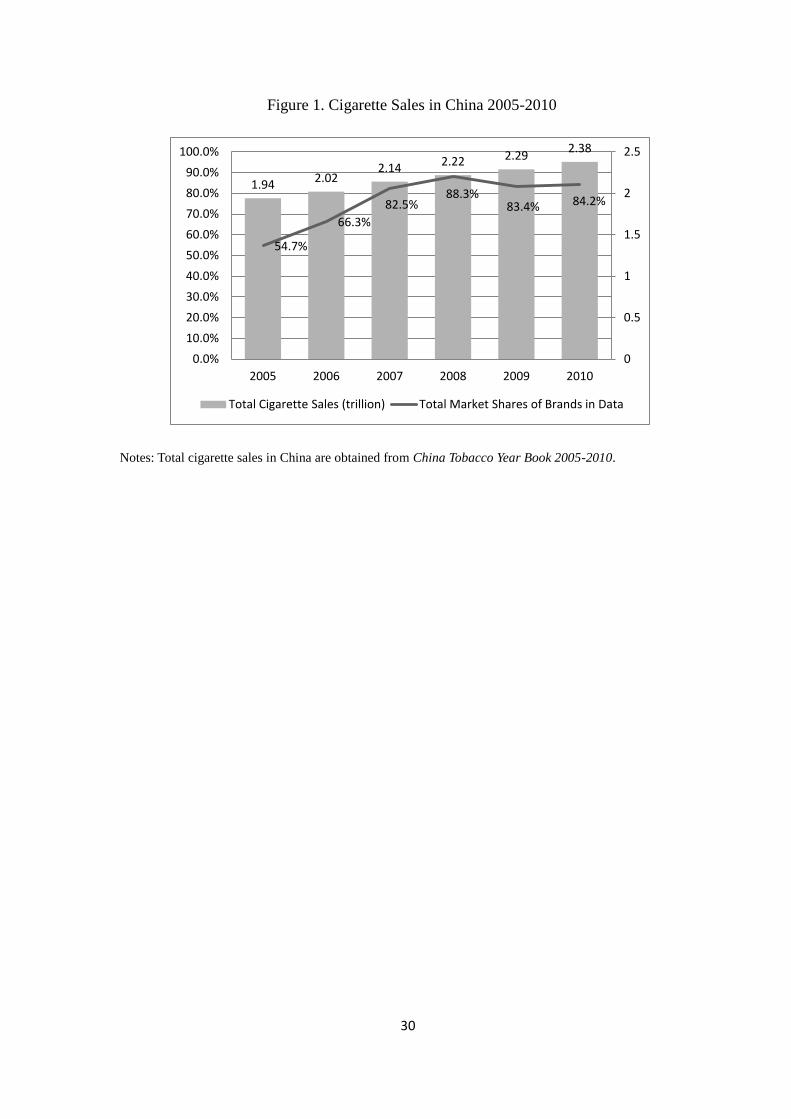
market. Figure 1 shows that the top 50 best-selling cigarette brands account for 54.7
to 88.3 percent of all cigarettes sales in China in a given year from 2005 to 2010.

7
[Insert Figure 1 here]
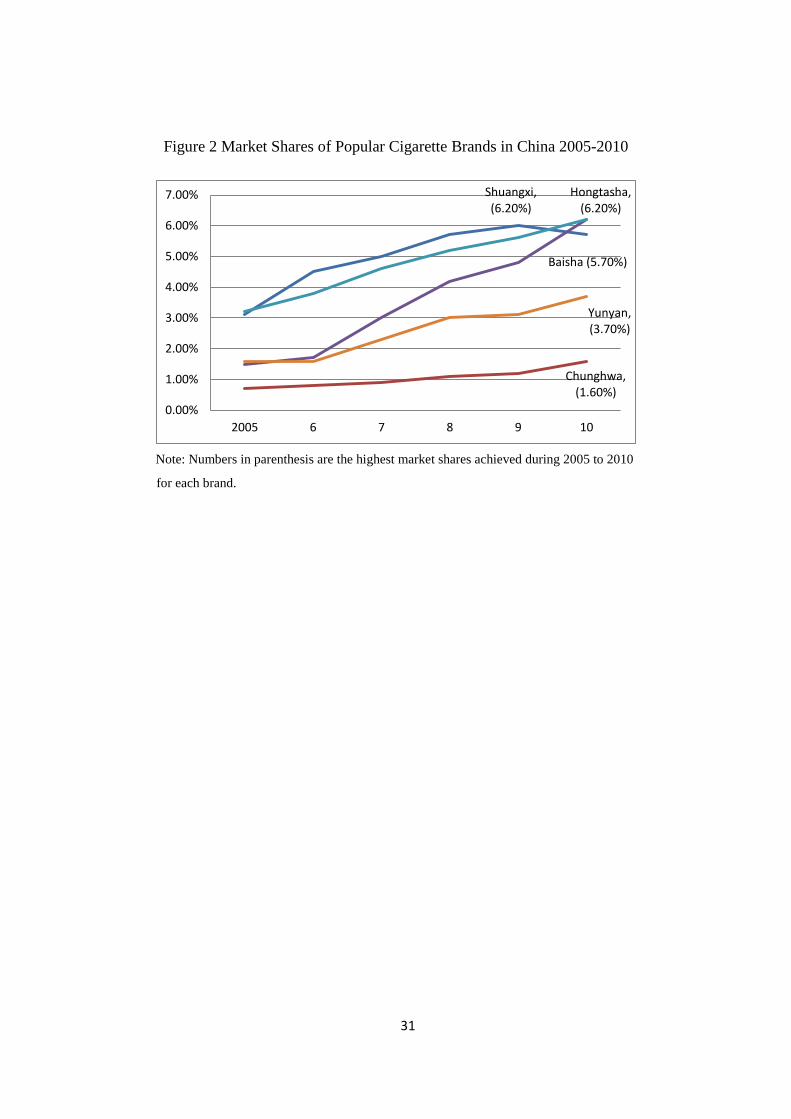
Figure 2 depicts the evolution of market shares of several best-selling cigarette
brands in China during the period 2005-2010. It reveals that the Chinese cigarette
market has two key features. First, it is much less concentrated than those in other
developed countries. For example, the best-selling brand of 2010 in China, Hongtasha,
comprise only 6.2% of the market, whereas the most popular cigarette in the US,
Marlboro, had a 42% share of the US retail market in the same year. Second, from
Figure 2 we can also see that the market shares of those popular brands have been
increasing steadily from 2005 to 2010. For example, the market share of Hongtasha
has increased four-fold, becoming the brand with the highest growth rate. It suggests
that although there are many brands competing in China’s cigarette market, the top
brands have indeed been gaining market share and market power during the period
2005-2010. Thus, this industry has become more concentrated during the period of
our study.
[Insert Figure 2 here]
Within each brand there are also multiple varieties differing in terms of price and
quality.. The price of a pack of 20 cigarettes is relatively low, with a median 6 RMB,
which is less than $1 US.1 According to the quality of tobacco leaves and the price of
cigarettes, Chinese cigarettes are classified into five grades (grade 1 to grade 5, and
higher is better) by the CNTC.
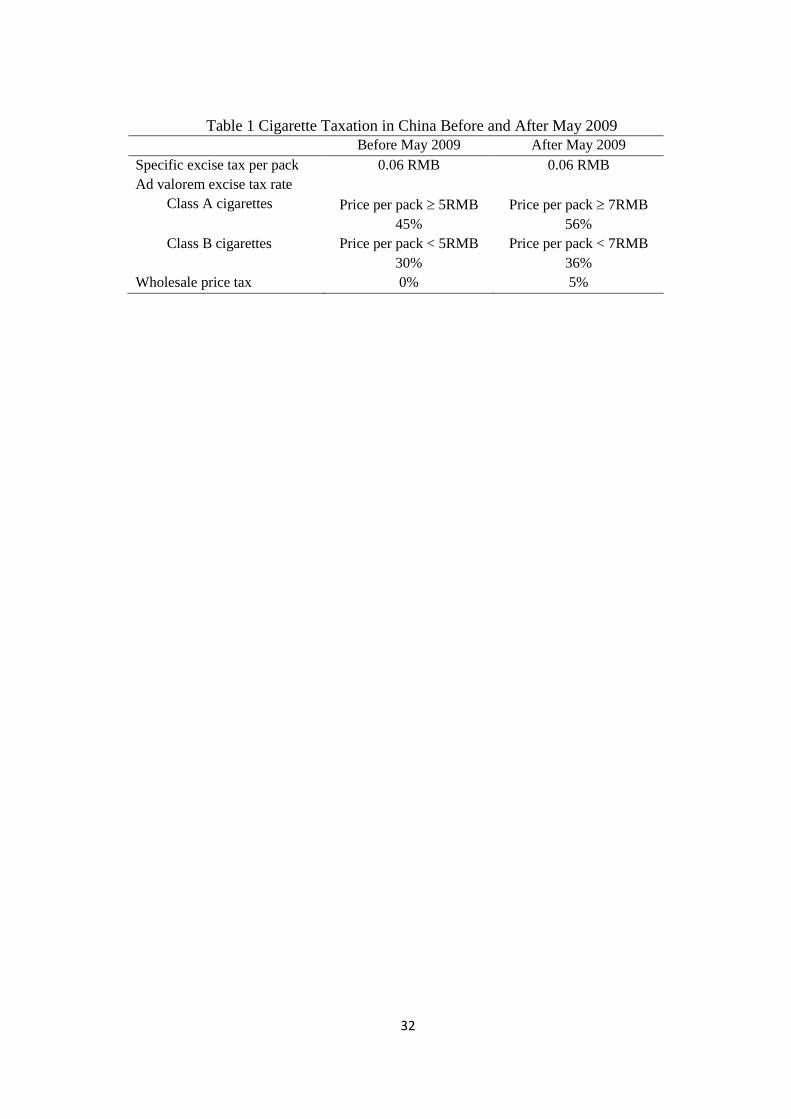
The cigarette tax in China consists of a specific excise tax and an ad valorem tax.
Before May 2009, the specific excise tax was 0.06 RMB per pack, the same for all
cigarettes. The ad valorem tax rate had two tiers: 30% for cigarettes with a producer
price2 less than 5 RMB per pack, called class B cigarettes which include cigarettes of
1 The yearly average exchange rate for 2010 is that 1 US dollar=6.78 Chinese Yuan RMB.
2 Producer price is the internal price the distribution sector of CNTC pays to its manufacturers.
8
grades 1 and 2, and 45% for cigarettes with the producer price higher than or equal to
5 RMB per pack, called class A cigarettes which include cigarettes of grades 3, 4 and
5.
[Insert Table 1 here]
In May 2009, there was an adjustment to the cigarette tax rate schedule,
announced by the Chinese government. As shown in Table 1, the specific excise tax
of 0.06 RMB per pack remained unchanged. But the ad valorem tax rates were raised
to 36% and 56% and the price band separating the two tiers was increased to 7 RMB
per pack from 5 RMB per pack. Most cigarettes sold are subject to the 36% ad
valorem excise. In addition, a new 5% excise was added at the wholesale level for all
cigarettes. At the same time, the government also required the CNTC to absorb all of
the tax increase from its profits and not pass it on to consumers. Thus, the 2009 tax
adjustment has not served as a tobacco control measure, but a transfer from CNTC to
the government, which has not increased the retail prices of cigarettes to consumers
(Gao et al., 2012).
Studies have shown that the total cigarette tax burden in China was about 35-40
percent of the retail price level under the tax schedule in effect before May 2009
(Sunley, 2008; Hu et al., 2008). Even if the 2009 tax increase were translated into
higher retail prices, Hu et al. (2010) suggest that the new tax rate at the retail price
level would be only 43.4%, which is still far below the world median level of 65-70%.
Relative to other developed countries, these studies imply that the Chinese
government has not implemented increased cigarette taxes as an aggressive tobacco
control policy, possibly reflecting concerns about smokers’ potential responses to tax-
induced increases in cigarette price as well as its potential impacts on government tax
revenue and the tobacco industry (Hu et al., 2010).
9
3. Data and Variables
In this study we use annual nationwide cigarette sales data at the brand level
from 2005 to 2010, which comes from multiple sources. This section describes the
data sources, and how study variables are defined and constructed.
3.1 Cigarette Brand Sales
We obtain cigarette sales data from two sources: Global Market Information
Database and China Tobacco Year Book 2005-2010. The former tracks the sales data
of various cigarette brands in China from 2005 to 2010, while the latter mainly
collects the sales data of the top 50 best-selling cigarette brands in China. We
combine these two sources of sales data and exclude brands having tiny market shares
(less than 0.1 percent). Thus, we obtain 49 to 65 brands each year and 348 brand-year
observations from 2005 to 2010.
Since not smoking, the outside good in our model, is also a choice same as each
cigarette brand for consumers, we need to redefine the market to incorporate the
option of not smoking, and adjust the market share for each cigarette brand (including
not smoking) with respect to the market size under this market definition. Our
definition of market is the potential cigarette market in China, and the size for this
market is the number of cigarette would be sold if all population aged 15 and above3
are smokers.
We use various sources to estimate the above potential market size for cigarette
consumption in China. We first collect information on smoking participation in China.
The major sources of such information are two waves of the Analysis Report of
National Health Services Survey in China conducted by the Ministry of Health of
China in 2003 and 2008, respectively, and the Global Adult Tobacco Survey China
(GATS China) conducted in 2010 by WHO. The first two surveys by the Ministry of
Health estimate that the prevalence of smoking in the Chinese population aged 15 and
above was approximately 26.0% in 2003 and 25.8% in 2008, and GATS China
3 China tracks smoking prevalence among adults aged 15 or older, and use it to calculate smoking
participation rate.
10
estimates indicate that smoking prevalence was 28.1% in 2010. We then infer
smoking prevalence rate in other years of our study period 2005-2010 by interpolating
the average growth rate in smoking prevalence from 2003 to 2010 using these three
available numbers. Therefore, assuming that the number of cigarettes consumed in
each year is the same for every smoker, we construct our measure of relative market
share for each brand by dividing its observed market share by the smoking prevalence
rate in each year, which is the market share of each cigarette band (including the
option of not smoking) relative to the size of the potential cigarette market we have
defined above.
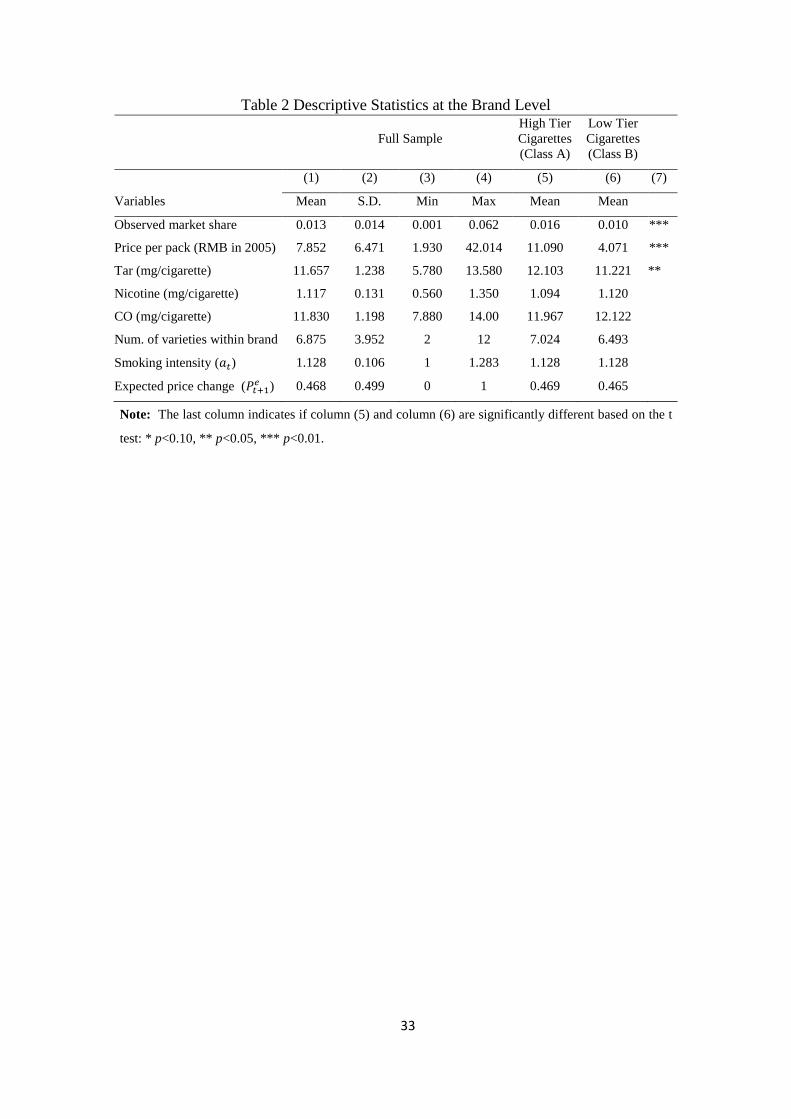
[Insert Table 2 here]
3.2 Brand Price and Characteristics
The data on cigarette prices and characteristics are obtained from STMA. For
cigarette price, this dataset contains the suggested retail price per pack for each
variety within each cigarette brand. However, since we only have cigarette sales data
at the brand level, we use the average price of all the varieties within each brand as
the brand price. All prices are deflated to RMB in 2005. As summarized in Table 2,
the descriptive statistics show that the average retail price for a pack of 20 cigarettes
is about 7.85 RMB in our sample, but varies substantially by brand, ranging from 1.9
RMB to 42 RMB.
For each cigarette brand in our sample, we have four variables for brand
characteristics.4 The first three variables measure tar, nicotine and carbon monoxide
(CO) yields of each cigarette brand, respectively, defined as milligrams per cigarette.
Both tar and nicotine are associated with the sensory experience of cigarette smoking.
More specifically, tar content influences the taste of cigarettes, while nicotine is the
major psychoactive agent in tobacco responsible for the addictive properties of
cigarettes. Again, although we have variety-specific data for these three measures, we
4 The values for all the four characteristics of not smoking are defined as zero.
11
use the average content across different varieties within each brand as the brand-level
yields to match our market share data at the brand level. Similar to the U.S. cigarette
market (Evans and Farrelly, 1998), we find little price difference between low- and
high-yield cigarettes.5 The last variable measuring brand characteristics is the number
of varieties within each brand, and on average, each brand includes 6 to 7 varieties as
shown in Table 2.
Compared to class B (lower-tier) cigarette brands, class A (higher-tier) brands
have slightly greater market shares and more varieties within the brand class.
Moreover, the tar yield of class A cigarette brands is higher than that of class B
brands.
3.3 Rational Addiction
The rational addiction literature suggests that there is a dependence of smokers’
current smoking behavior on their past cigarette consumption (Chaloupka, 1991;
Becker et al., 1994), and that smokers are forward-looking with respect to future
prices of cigarettes (Gruber and Köszegi, 2001; Coppejans et al., 2007). To capture
these features,, we construct two variables.
The first variable measures smoking addiction of an individual consumer. Ideally,
we should have an addiction measure that is brand-specific. However, we do not have
data on the number of smokers for each brand. Therefore, we construct an addiction
measure that is year-specific but the same for all cigarette brands in a given year as
follows. First, we obtain the estimated number of smokers in each year, according to
smoking prevalence rate and population data from the Chinese Population Census.
5 For example, the average price of cigarettes with nicotine greater than or equal to 1.1mg/cigarette
(high yield) is 7.72 RMB/pack with a standard deviation of 7.43 RMB/pack (224 observations), and the
average price of cigarettes with nicotine less than 1.1mg/cigarette (low yield) is 8.08 RMB/pack with a
standard deviation of 4.21 RMB/pack (124 observations). Statistical testing using the standard t tests
revealed no significant price differences between high- and low-yield cigarettes in China, which is
consistent with the findings in the US (Evans and Farrelly, 1998).
12
Then, we calculate the average smoking intensity per person in each year by dividing
the annual total cigarette sales by the estimated number of smokers. We use this
measure of smoking intensity at year as the measure for addiction at year t.
Furthermore, we normalize the addiction measure to 1 in 2005.
The second variable is constructed to measure consumers’ expectations about the
future cigarette prices. As cigarette prices are regulated by STMA in China, the prices
of most cigarette brands change little over time during our study period. Therefore,
we calculate the sales-weighted average price at the manufacturer level and use
changes in this measure to reflect consumers’ expectations about cigarette price trends.
Following Ciliberto and Kuminoff (2011), we construct a binary variable that is equal
to 1 if, for any particular manufacturer, the sales-weighted average price of all of its
cigarette brands in period t is higher than that in period , and equal to zero
otherwise. It is implicitly assumed here that smokers predict future cigarette prices
based on past price changes, i.e. current price increases could signal an increasing
price trend in the future, which is consistent with Gruber and Köszegi (2001) and
Sloan et al. (2003).
4. Empirical Methods
In this study, we follow Berry’s (1994) theoretical framework by modeling
cigarettes as differentiated products rather than a homogenous good, and estimating
the demand for cigarettes in China using brand-level sales data. In our model,
consumers not only choose between smoking and not smoking, but also make choices
among different brands when choosing cigarettes. We are able to obtain cross-brand
substitution patterns which could not be identified in previous studies based on
models treating cigarettes as homogenous goods.
4.1. Model
We use a nested logit model to model consumers’ demand for differentiated
cigarettes and obtain the demand parameters. The nested logit model has the
13
advantage over the simple logit model in that it is not subject to the traditional
problem of independence from irrelevant alternatives (IIA). The nested logit model
allows consumers’ tastes for cigarette brands to be correlated across different
alternatives while preserving the assumption that consumers’ tastes have an extreme
value distribution (McFadden, 1981; Berry, 1994).
We model a consumer’s cigarette purchase decision in a sequential fashion.
More specifically, at the top level of the decision process, a consumer has to decide to
smoke cigarettes or not. After deciding to smoke, the consumer’s second-level
decision is to choose from among cigarette brands with different quality/price tiers.
According to the official classification criteria of the CNTC, we group cigarettes into
two classes, , corresponding to higher-tier (class A) and lower-tier (class B)
cigarettes, respectively. At the lowest level, the smoker chooses the cigarette brand to
purchase given the cigarette class that has been chosen. To summarize, each consumer
chooses among alternatives (including not smoking) according to the above
decision process, where denotes the number of cigarette brands available in China’s
cigarette market in a given year.
We assume that the utility of consumer derived from purchasing the cigarette
brand at period is determined by the following equation
(1)
Where is a vector of the observed characteristics of cigarette brand at period ;
denotes the price of cigarette brand at period is our measure of smokers’
degree of smoking addiction, proxied by the number of cigarettes an average smoker
consumes in period ; and is a binary variable that measures smokers’
expectation about the price change at period . , , , and are structural
parameters to be estimated. As implied by rational addiction theory, we expect that
and .
14
In equation (1), represents the attributes of cigarette brand at period that
are observed by consumers and firms, but unobserved by the econometrician, such as
firms’ advertising efforts. represents consumers’ idiosyncratic tastes for brand at
period . We assume that is an identically and independently distributed extreme
value over each brand and period . denotes the nested
logit parameter which captures the correlation of consumers’ tastes between different
cigarette brands within the same group. Finally, is a random variable with a unique
distribution such that the additive term also follows extreme
value distribution.
The utility from the decision not to smoke cigarettes is given by
(2)
We let , which is the mean utility level of
brand at period ,. Consumer is assumed to choose the alternative among all
alternatives that yields the highest level of utility. As noted by Berry (1994), the
market share of brand at period , denoted by , is determined by the following
equation:
(3)
where
(4)
and is the set of brands in group at period . Note that there are three groups in
each period: higher-tier (class A) cigarette brands ( ), lower-tier (class B)
cigarette brands ( ) and the outside option (not smoking, ).
Following Berry (1994), the log transformation of relative brand share gives our
estimating equation as follows:
15
(5)
where is the market share of the outside alternative, and is the market share
of cigarette brand in the group at period .
(6)After obtaining estimates of the demand parameters, we are able to calculate
the own-price and cross-price elasticities of demand for each brand. The own-price
elasticity of demand for brand at period , is given by
(6)
The cross-price elasticity of demand between brands and at period t is given
by
(7),
When , we obtain the within-class-cross-price elasticity of demand from
equation (7). Otherwise, equation (7) becomes , which is the cross-class-
cross-price elasticity of demand.
4.2. Estimation and Identification
Inspecting equation (5), we are confronted with potential endogeneity of some of
the regressors, due to the brand-specific unobserved attributes . As captures
other important features of brand at period that are observed by the consumers and
firms but not by the econometrician, it may be correlated with the current and future
prices of brand . For example, if the high quality of a particular cigarette brand is
correctly perceived by consumers and the firm, it is able to induce higher willingness
to pay so that the firm can charge a higher price and also achieve a greater market
share. Therefore, may be correlated with . Since consumers form their
expectations about future price change based on current prices, expected future price
may also be correlated with . Furthermore, as a function of , brand ’s
16
within-market share is also correlated with . Thus, The three terms, ,
and , may be endogenous in equation (5).
Following the literature (e.g. Berry et al. 1995; Petrin, 2002), we can assume that
the observed brand characteristics (including cigarette yields of tar, nicotine and
CO, and number of varieties within brand ) are uncorrelated with the brand-specific
unobserved attributes in equation (5). As the addiction measure is determined at
period it can also be treated as exogenous.
To address these endogeneity concerns, we employ a generalized method of
moments (GMM) to estimate the parameters in equation (5). The moment condition is
(8)
where is the matrix of instrumental variables for the three endogenous variables, ,
and .
Let denote the vector of parameters to be estimated in equation (5), and
define . Hansen (1982) shows that the optimal GMM estimators are
defined by choosing
(9)
where is a symmetric positive definite weighting matrix that may be chosen
optimally to minimize the variance of . We start with using identity matrix as the
starting point of to obtain the consistent initial estimates of the parameters and the
optimal weighting matrix. Then, we continue to estimate the model using the new
weighting matrix.
For each brand at each period , we have two sets of instruments. The first set
of instruments includes the sum of cigarette characteristics (tar, nicotine and CO) of
other brands produced by the same manufacturer in the same year. The second set of
instruments includes the sum of cigarette characteristics (including tar, nicotine, and
CO) of all brands produced by other competing manufacturers in the same year. The

17
rationale for using these instruments follows from the optimal pricing in oligopoly
models: products facing good substitutes tend to have low markups and thus low
prices relative to cost, while products with fewer substitutes tend to enjoy high
markups and thus can charge relatively high prices relative to cost. In a differentiated
product model as in this study, the similarities between products are measured by the
similarity in product characteristics. Therefore, characteristics of other competing
brands serve as the valid instruments since they are correlated with product prices
(and therefore, with-in market share and expected future prices) , but uncorrelated
with product unobserved attributes , since product characteristics are assumed to be
exogenous. Furthermore, in oligopoly models, markups respond differently to own
and rival products. Therefore, to achieve optimality, we use two sets of instruments to
distinguish between the characteristics of products produced by the same multi-
product firm and characteristics of products produced by competing firms6.
We also use an additional instrumental variable for , which is a binary
indicator that is equal to 0 before 2009, and 1 after 2009, when there was an
adjustment to the cigarette tax in China. The underlying idea is that the cigarette tax
adjustment in 2009 was an exogenous event that imposed additional
producer/wholesale taxes on all cigarette brands, and should be uncorrelated with
unobserved brand-specific attributes . Although the additional tax increase was
required by the government to be absorbed from the firms’ profits and has not been
passed along to the retail price, it may have affected the way the smokers formed their
expectations on future cigarette prices, perhaps believing that price increases will
continue and that firms will be unable to absorb all of these increases. We test the
validity of our instruments in section 5.
6 These types of instruments have been widely used in the empirical industrial organization literature to
estimate the demand for differentiated products in many markets (Bresnahan, 1987; Berry et al. 1995.
1999; Petrin, 2002; Nevo, 2000, 2001).
18
5. Empirical Results
5.1 Estimates for Demand Parameters
Table 3 presents the estimation results from the cigarette demand equation (5)
with the log of relative market shares as the outcome variable.
[Insert Table 3 here]
Column (1) of Table 3 presents the OLS estimates for the logit specification of
equation (5), which assumes no correlation of consumers’ tastes over cigarette brands
( ), and includes brand prices, smoking intensity, expected price change, four
indicators for brand characteristics and a set of year and manufacturer dummies as the
regressors. The OLS estimate shows that the price coefficient, which measures the
semi-elasticity of demand7
, has a positive value of 0.012 but is statistically
insignificant. Column (2) presents the OLS estimates of the nested logit specification
of our demand model, which allows one constant correlation of unobserved consumer
tastes to overcome the IIA problem, and adds the log of within-group market share
as the covariate. This estimation result also gives a positive but statistically
insignificant estimate of coefficient on price. The positive OLS coefficients on price
in both the logit and nested logit estimations suggest upward-sloping demand curves,
which provide strong evidence for the endogeneity of cigarette price.
In columns (3) and (4), we adopt 2SLS and GMM estimations, respectively, to
control for possible endogeneity in equation (5). The reliability of the IV estimates
depends on the validity of the instruments. To test the instruments, we first examine
the explanatory power of the instruments, conditional on the included exogenous
variables in the first stage regressions for cigarette price , expected price change
, and within-group market share . As shown in the bottom of column (3),
the -statistics of the first stages suggest that the instruments are strong (significant at
7 The semi-elasticity of demand measures the percentage change in the quantity demanded of cigarettes
with regards to a unit change in its price.
19
the 1% level) for each of three endogenous variables. Second, since we have more
instruments than endogenous variables, we also perform tests for overidentification
restriction. The -statistics are 5.105 for the 2SLS estimation in column (3), and 5.196
for the GMM estimation in column (4), which suggests that the exogeneity of our
instruments cannot be rejected at the 10% level.
As shown in column (3), the 2SLS estimate of coefficient on price is 0.026,
and is statistically significant at the 5% level. However, the 2SLS estimation may be
subject to bias due to misspecification of functional forms of instrumental variables,
when the linear approximations of endogenous variables (e.g. price) on the instrument
variables are not precise (Berry, et al. 1995; Xiao, 2008). Therefore, in column (4), we
proceed with the GMM estimation as suggested in Berry et al. (1995) and Petrin
(2002). The GMM estimate of the price coefficient is -0.021, very similar in
magnitude to the 2SLS estimate, but has a higher level of statistical significance (at
the 1% level). Both the 2SLS and GMM estimates suggest that cigarette demand is a
downward-sloping demand curve.
In column (4), the GMM estimate for the constant correlation of unobserved
consumer tastes is 0.750, indicating that consumer tastes are positively correlated
over different cigarette brands within the same class. This implies that cigarettes
within the same class are better substitutes for each other than cigarettes across
classes; and when cigarette prices increase, smokers are more likely to switch brands
(within the group or ) than to quit smoking (across groups).
Consistent with the addictive nature of cigarette consumption, the smoking
intensity of an average person ( ) has a significant and positive impact on the
cigarette sales. The coefficient on expected price increase ( ) has the anticipated
negative sign and is statistically significant, suggesting that smokers may be forward
looking with respect to cigarette pricing (Gruber and Köszegi, 2001).
The estimates on brand characteristics show that the concentration of tar is
significantly positively correlated with the relative market share of each brand, after
controlling for the effect of price. This suggests that smokers are likely to prefer
20
cigarettes with higher tar concentration, which is associated with more intense
cigarette flavor. This finding provides some evidence for smokers’ compensating
behavior in terms of switching from low-tar to high-tar cigarettes when they are
forced to consume fewer cigarettes. The coefficient on the nicotine and CO
concentrations are statistically insignificant across all specifications in columns (1) to
(4). This may simply reflect that these two yields are highly correlated with tar
concentration. Finally, the estimate for the number of varieties within each brand is
also insignificant in each model specification.
5.2. Demand Elasticities
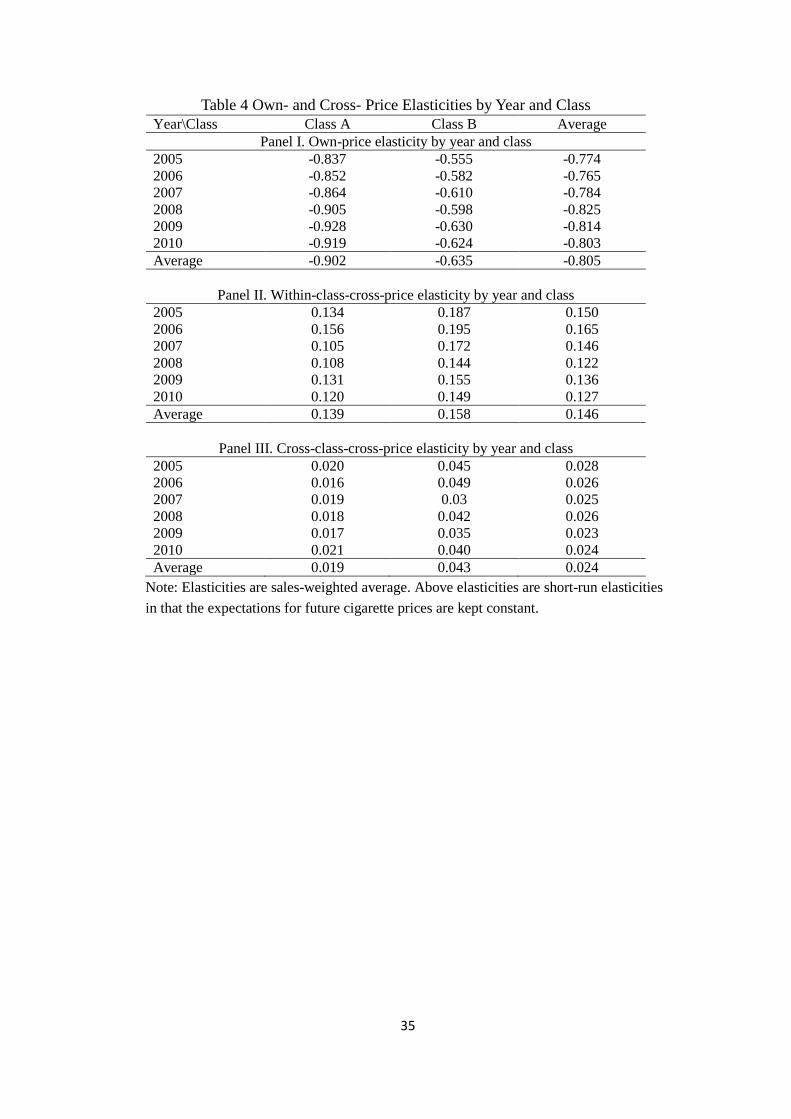
Table 4 summarizes the own- and cross-price elasticities of demand by year and
class based on the GMM parameter estimates in column (4) of Table 3.8 The sales-
weighted average own-price elasticity across all brands and years is 0.805, which is
larger in magnitude than the estimates of price elasticities (around 0.5) in other
studies of China’s cigarette market in the 1990s (e.g. Hu and Mao, 2002; Lance et al.,
2004; Bishop et al., 2007). This may reflect that those prior studies have treated
cigarettes as a single homogenou product and thus do not allow for substitution
between different brands of cigarettes (e.g. between expensive or cheap cigarettes, or
between high- and low-tar cigarettes). Our estimate is close to that in Chen and Xing
(2011) who attempt to estimate the price elasticities of cigarettes after netting out the
heterogeneous quality effect of cigarette demand, and find the price elasticity of
cigarette demand in the range of 0.81 to 0.35, based on urban household survey
data from 1999 to 2001.
[Insert Table 4 here]
8 The estimates are short-run elasticities in the sense that they are calculated holding the (expected)
future prices constant.

21
The own-price elasticities for class A cigarettes had an increasing trend in
magnitude during 2005 to 2010, while there was no clear pattern for class B cigarettes.
The results in Panel I also reveal that the own-price elasticities are greater in
magnitude for class A cigarettes than for class B cigarettes in each year as well as on
average. This implies that smokers using low-priced cigarettes are less responsive to
price changes than smokers using high-priced cigarettes, which is consistent with
findings by Cummings et al. (1997) in the US and Li et al., (2010) in China. The
intuitions behind these results are twofold. First, smoking is addictive, and therefore
smokers have a tendency to keep the level of cigarette consumption unchanged when
cigarette prices increase. Smokers of high-priced cigarettes can opt for low-priced
brands when cigarette prices increase, while smokers of low-priced cigarettes cannot.
As a result, high-priced cigarette brands may exhibit higher own-price elasticities.
Second, due to budget constraints, smokers that are more heavily addicted may tend
to consume cigarettes with lower prices, and at the same time, they are also less likely
to quit smoking. This may also lead to less price sensitivity among users of low-
priced cigarettes.
Panels II and III in Table 4 present the within- and cross-group cross-price
elasticities, respectively. The estimated within-group cross-price elasticities have an
overall average of 0.146 across all years and groups, and range from 0.105 to 0.195,
and they are higher for class B cigarettes than for class A cigarettes. These results
imply that the substitution effects between different brands are stronger among low-
priced (class B) cigarette brands than among high-priced (class A) brands.
As shown in Panel III, the estimated cross-group cross-price elasticities vary
from 0.016 to 0.049, with a sales-weighted average of 0.024 across years and groups,
which is much smaller in magnitude than the within-group cross-price elasticities.
This suggests that smokers are more likely to switch cigarette brands within each
group than across groups when cigarette prices change. Meanwhile, we also find that
the cross-group cross-price elasticities are larger in magnitude for class B brands than
for class A brands, which suggests that the price change of more expensive (class A)
22
brands has a larger positive impact on the sales of low-priced (class B) cigarettes than
the price change of class B brands on class A brands.
5.3. Simulated Effect of a Tobacco Tax Increase
Tobacco taxes have been widely adopted as one of the most effective tobacco
policies in many countries. In China, there has also been extensive discussion about
raising cigarette taxes to reduce smoking prevalence. Many studies suggest that the
ultimate goal of cigarette tax increase in China is to raise the specific excise tax to 4
RMB per pack, so that the total tax burden on cigarettes would meet the World Bank
yardstick of two-thirds of the retail price level. Meanwhile, a feasible way to achieve
this goal is first to raise the tax to 1 RMB per pack from the current level of less than
0.06 RMB per pack, and increase gradually to 4 RMB per pack, in order to alleviate
the impacts to the cigarette industry (Hu et al., 2008; Sunley, 2009; Chen and Xing,
2011). Therefore, in this subsection, we simulate a cigarette tax increase by 1, 2, 3,
and 4 RMB per pack, respectively, and calculate their impacts on cigarette
consumption, government tax revenues, and total tar and nicotine intake, based on our
estimated demand equations for cigarettes in China.
Our demand estimates imply that, on average, cigarette demand is inelastic with
sales-weighted own-price elasticity 0.805. While setting prices on the inelastic
portion of the market demand curve is inconsistent with profit maximization (i.e.
setting prices below the optimum level),9 this may reflect the tight government
regulation of China’s cigarette industry. Although the CNTC itself is a virtual
monopoly in the Chinese cigarette market, it cannot set prices freely in order to
maximize profits10
. Therefore, in the following simulations, we assume that the
CNTC directly sets the retail prices of cigarettes at levels as directed by the
9 Ciliberto and Kuminoff (2011) also find inelastic own-price elasticities at the variety-level in the US.
10 For example, when government increased the cigarettes tax, the CNTC was asked to absorb the tax
increase and keep the retail price of cigarette unchanged.
23
government after the cigarette tax increase. For example, after implementing the
proposed 1 RMB specific-tax hike, we assume that the CNTC would increase the
retail price per pack by 1 RMB for each brand11
.
We consider four scenarios where the specific excise tax increases by 1, 2, 3, and
4 RMB per pack, respectively. Cigarette sales were approximately 11.90 billion packs
in 2010 and 10.83 billion packs on average during the period 2005-2010. The
simulated results in Table 5 show that cigarette sales would be reduced by 8.8 percent,
a reduction of 7.37 billion packs when 1 RMB excise tax is levied. Our estimates are
smaller in magnitude than those in other studies of Chinese smokers (e.g. Hu et al.,
2010; Chen and Xing, 2011), which give no consideration for substitution effects due
to price increases and therefore tend to overestimate the potential effect of a cigarette
tax increase on cigarette consumption. Moreover, an excise tax of 2, 3 or 4 RMB per
pack would result in cigarette sales reductions of 12.8 percent, 22.8 percent and 32.7
percent, respectively.
[Insert Table 5 here]
As shown in rows (3) and (4), an increase in the tax level of 1, 2, or 3 RMB per
pack would increase total tax revenue from cigarettes by 3.5 percent (100.87 billion
RMB), 4.4 percent (116.80 billion RMB), and 5.1 percent (151.15 billion RMB)
respectively. However, a 4 RMB excise tax per pack would lead to a decrease in total
tax revenue of 1.5 percent, which is about 41.67 billion RMB.
In addition to the quantity of cigarette consumption, we are also interested in
simulating the potential effect of a cigarette tax increase on other risk factors
associated with smoking—the total intakes of tar and nicotine. Because taxes are
independent of tar and nicotine content, smokers may compensate by switching to
11
Ciliberto and Kuminoff (2011) use the cigarette minimum prices mandated by each State in the US
as the marginal costs cigarette brands with inelastic own-price elasticities. However, there are no
similar measures as minimum prices in China that can help us to identify marginal costs. Meanwhile,
the virtual monopoly of the CNTC makes our assumption of perfect retail price mandate very
reasonable.
24
cigarettes that are higher in tar and nicotine content. As expected, we find that,
although total tar intake would be reduced as cigarette consumption declined due to
tax-induced price increases, the decrease in the total intake of tar would be 2-3
percent less than the total reduction in cigarette sales, and such differences are all
statistically significant at the 95% level. Moreover, as excise taxes are raised, the
average tar levels per cigarette12
would rise by 2.76%, 2.60%, 3.92% and 5.23% for
the specific tax of 1, 2, 3, 4 RMB per pack, respectively. This tax-induced
compensating behavior is consistent with the findings of Evans and Farrelly (1998).
In contrast, we do not find such tax-induced compensating patterns for nicotine.
The simulation results show that tax increases would cause total nicotine intake to
decrease by about 8.7% to 35.6% for different tax hikes, similar to the percentage
change in cigarette consumption, while the average nicotine level per cigarette would
have little change.
6. Conclusion
When countries propose increasing cigarette taxes to reduce smoking prevalence,
it is vital to understand the behavioral changes of smokers as their responses to tax-
induced price increases. To our knowledge, this paper is the first attempt to apply the
discrete choice model of differentiated products to study China’s cigarette market, and
estimate own-price as well as cross-price elasticities of cigarette demand at the brand
level. Based on annual nationwide sales data from 2005 to 2010, our results suggest
that on average, cigarette demand is inelastic in China with a sales-weighted overall
own-price elasticity of 0.805, and high-priced (class A) cigarettes have higher own-
price elasticities than low-priced (class B) cigarettes.
This study confirms the importance of brand-switching behavior of smokers as
their responses to tax-induced price increases, and identifies the substitution patterns
12
To calculate the average tar/nicotine level per cigarette, we divide the total tar or nicotine intake by
the total number of cigarette sales in each scenario.
25
in China’s cigarette market. We find that substitution is more likely to occur among
brands in the same class than across classes when cigarette prices change. The
average within-class cross-price elasticity is 0.146, while the average across-class
cross-price elasticity is only 0.024. We also demonstrate that Chinese smokers have a
preference for cigarettes with higher concentration in tar, providing empirical
evidence for smokers’ compensatory behavior (Evans and Farelly, 1998; Farelly et al.,
2004; Tsai et al., 2005; Adda and Cornaglia, 2006). In other words, smokers may not
only switch to low-priced brands but also shift to high-tar cigarettes when cigarette
prices increase. However, must be noted that, because we only have brand-level data,
smokers’ substitution behavior may still be underestimated, as they can switch among
the varieties within the same brand.
Our results have important implications for the potential effects of cigarette
taxation. Given a tax-induced price hike, previous studies only consider the options of
reducing or quitting smoking and may thus overestimate the impact of excise tax
policies on cigarette consumption. Incorporating smokers’ brand-switching behavior,
our simulation results show that the proposed 1-RMB-per-pack increase in specific
tax will decrease on average 7.26 billion packs (about 8.69%) of cigarette
consumption, and increase annual tax revenue by 99.38 billion RMB (about 3.46%).
This suggests that raising taxes alone may not reduce smoking to the degree
previously believed13
, but it will still be an effective policy instrument for controlling
tobacco use and raising tax revenue in China.
The simulations also suggest that with an additional 1 RMB per pack excise tax
increase, the average tar level per cigarette would increase by 2.72%, and total tar
intake would be reduced 2-3 percentage point less than the reduction in cigarette
consumption. Studies have shown that tar intake is the primary cancer-causing agent
in cigarettes (Stellman and Garfinkel, 1989). Our findings indicate that smokers’ tax-
induced compensating behavior may undermine the effectiveness of increasing
13
For example, previous studies show that an additional 1 RMB excise tax will lead to the reduction of
cigarette consumption by 16.75% if the own-price elasticity is -0.80 (Chen and Xing, 2011), or by 9.25%
if the own-price elasticity is -0.50 (Hu et al., 2010).

26
cigarette taxes as a policy instrument to promote public health, as current cigarette
excise taxes are levied per pack, regardless of the tar content per cigarette. To
maximize the health benefits of a cigarette tax increase (Harris, 1980), it would be
more appropriate for the government to establish differential cigarette taxes based on
tar and nicotine content of cigarettes in China.
References
Abrevaya, J., Puzzello, L., 2012. Taxes, cigarette consumption, and smoking intensity:
comment. American Economic Review, 102(4), 1751-1763.
Adda, J., Cornaglia, F., 2006. Taxes, cigarette consumption, and smoking intensity.
American Economic Review, 96(4), 1013-1013.
Adda, J., Cornaglia, F., 2012. Taxes, cigarette consumption, and smoking intensity:
reply. IZA Discussion Paper No. 6688, 1-24.
Becker, G.S., Murphy, K.M., 1988. A theory of rational addiction. Journal of Political
Economy, 675-700.
Becker, G.S., Grossman, M., Murphy, K.M. 1994. An empirical analysis of cigarette
addiction. American Economic Review, 84(3), 396-418.
Berry, S., Levinsohn, J., Pakes, A., 1995. Automobile prices in market equilibrium.
Econometrica, 841-890.
Berry, S.T., 1994. Estimating discrete-choice models of product differentiation. The
RAND Journal of Economics, 242-262.
Bishop, J.A., Liu, H., Meng, Q., 2007. Are Chinese smokers sensitive to price? China
Economic Review, 18(2), 113-121.
Chaloupka, F.J. 1991. Rational addictive behavior and cigarette smoking. Journal of
Political Economy, 99(4), 722-42.
Chaloupka, F.J., Hu, T., Warner, K.E., Jacobs, R., Yurekli, A., 2000. The taxation of
tobacco products. Tobacco control in developing countries, 237-272.
Chaloupka, F.J., Warner, K.E., 2000. The economics of smoking. Handbook of health
economics, 1, 1539-1627.

27
Chapman, S., Richardson, J., 1990. Tobacco excise and declining tobacco
consumption: the case of Papua New Guinea. American Journal of Public
Health, 80(5), 537-540.
Chen, Y., Xing, W., 2011. Quantity, quality, and regional price variation of cigarettes:
Demand analysis based on a household survey in China. China Economic
Review, 22(2), 221-232.
Ciliberto, F., Kuminoff, N.V., 2010. Public policy and market competition: how the
master settlement agreement changed the cigarette industry. The BE Journal of
Economic Analysis & Policy, 10(1).
Coppejans, M., Gilleskie, D., Sieg, H., Strumpf, K.S. 2007. Consumer Demand under
price uncertainty: empirical evidence from the market for cigarettes. Review
of Economics and Statistics, 89(3), 37-65.
Evans, W.N., Farrelly, M.C., 1998. The compensating behavior of smokers: taxes, tar,
and nicotine. The RAND Journal of Economics, 578-595.
Farrelly, M.C., Nimsch, C.T., Hyland, A., Cummings, M., 2004. The effects of higher
cigarette prices on tar and nicotine consumption in a cohort of adult smokers.
Health Economics, 13(1), 49-58.
Gao, S., Zheng, R., Hu, T.-w., 2012. Can increases in the cigarette tax rate be linked
to cigarette retail prices? Solving mysteries related to the cigarette pricing
mechanism in China. Tobacco control, 21(6), 560-562.
Gruber, J., Köszegi, B., 2001. Is addiction “rational”? Theory and evidence. The
Quarterly Journal of Economics, 116(4), 1261-1303.
Harris, J.E., 1980. Taxing tar and nicotine. American Economic Review, 70, 300-311.
Hu, T., Mao, Z., 2002. Effects of cigarette tax on cigarette consumption and the
Chinese economy. Tobacco control, 11(2), 105-108.
Hu, T.-w., Mao, Z., Shi, J., Chen, W., 2010. The role of taxation in tobacco control
and its potential economic impact in China. Tobacco control, 19(1), 58-64.
Keeler, T.E., Hu, T.-W., Barnett, P.G., Manning, W.G., 1993. Taxation, regulation,
and addiction: a demand function for cigarettes based on time-series evidence.
28
Journal of Health Economics, 12(1), 1-18.
Kenkel, D., Lillard, D.R., Liu, F., 2009. An analysis of life‐course smoking behavior
in China. Health Economics, 18(S2), S147-S156.
Lance, P.M., Akin, J.S., Dow, W.H., Loh, C.-P., 2004. Is cigarette smoking in poorer
nations highly sensitive to price?: Evidence from Russia and China. Journal of
Health Economics, 23(1), 173-189.
Li, Q., Hsia, J., Yang, G., 2011. Prevalence of smoking in China in 2010. New
England Journal of Medicine, 364(25), 2469-2470.
Mao, Z., Hu, T.-w., Shi, J., Chen, W., 2008. Tobacco taxation and its potential impact
in China.
Nevo, A., 2000. Mergers with differentiated products: The case of the ready-to-eat
cereal industry. The RAND Journal of Economics, 395-421.
Nevo, A., 2001. Measuring market power in the ready‐to‐eat cereal industry.
Econometrica, 69(2), 307-342.
Petrin, A., 2002. Quantifying the Benefits of New Products: The Case of the Minivan.
Journal of Political Economy, 110(4), 705-729.
Qi, S., 2013. The impact of advertising regulation on industry: the cigarette
advertising ban of 1971. RAND Journal of Economics. 44(2), 215-248.
Sayginsoy, O., Yurekli, A. A., de Beyer, J., 2002. Cigarette Demand, Taxation, and
the Poor: A Case Study of Bulgaria, Center for Tobacco Control Research and
Education, UC San Francisco.
Sloan, F.A., Smith, V.K., Taylor, D.H. 2003. The Smoking Puzzle: Information, Risk
Perception, and Choice. Cambridge: Harvard University Press.
Stellman, S. D., Garfinkel, L., 1989. Lung cancer risk is proportional to cigarette tar
yield: evidence from a prospective study. Preventive Medicine, 18(4), 518-525.
Sung, H.-Y., Hu, T.-W., Keeler, T. E., 1994. Cigarette Taxation And Demand: An
Empirical Model. Contemporary Economic Policy, 12(3), 91-100.
Sunley, E.M., Taxation of cigarettes in the Bloomberg Initiative countries: Overview
of policy issues and proposals for reform.

29
Tan, W., 2006. The effects of taxes and advertising restrictions on the market
structure of the US cigarette market. Review of Industrial Organization, 28(3),
231-251.
Tsai, Y.W., Yang, C.L., Chen, C.S., Liu, T.C., Chen, P.F., 2005. The effect of
Taiwan's tax‐induced increases in cigarette prices on brand‐switching and the
consumption of cigarettes. Health Economics, 14(6), 627-641.
Wilkins, N., Yurekli, A., Hu, T., Economic analysis of tobacco demand.
Xiao, J., 2008. Technological advances in digital cameras: Welfare analysis on easy-
to-use characteristics. Marketing Letters, 19(2), 171-181.
30
Figure 1. Cigarette Sales in China 2005-2010
Notes: Total cigarette sales in China are obtained from China Tobacco Year Book 2005-2010.
1.94 2.02
2.14 2.22 2.29
2.38
54.7%
66.3%
82.5% 88.3%
83.4% 84.2%
0
0.5
1
1.5
2
2.5
0.0%
10.0%
20.0%
30.0%
40.0%
50.0%
60.0%
70.0%
80.0%
90.0%
100.0%
2005 2006 2007 2008 2009 2010
Total Cigarette Sales (trillion) Total Market Shares of Brands in Data
31
Figure 2 Market Shares of Popular Cigarette Brands in China 2005-2010
Note: Numbers in parenthesis are the highest market shares achieved during 2005 to 2010
for each brand.
Baisha (5.70%)
Chunghwa, (1.60%)
Hongtasha, (6.20%)
Shuangxi, (6.20%)
Yunyan, (3.70%)
0.00%
1.00%
2.00%
3.00%
4.00%
5.00%
6.00%
7.00%
2005 6 7 8 9 10
32
Table 1 Cigarette Taxation in China Before and After May 2009
Before May 2009 After May 2009
Specific excise tax per pack 0.06 RMB 0.06 RMB
Ad valorem excise tax rate
Class A cigarettes Price per pack 5RMB
45%
Price per pack 7RMB
56%
Class B cigarettes Price per pack < 5RMB
30%
Price per pack < 7RMB
36%
Wholesale price tax 0% 5%
33
Table 2 Descriptive Statistics at the Brand Level
Full Sample
High Tier
Cigarettes
(Class A)
Low Tier
Cigarettes
(Class B)
(1) (2) (3) (4) (5) (6) (7)
Variables Mean S.D. Min Max Mean Mean
Observed market share 0.013 0.014 0.001 0.062 0.016 0.010 ***
Price per pack (RMB in 2005) 7.852 6.471 1.930 42.014 11.090 4.071 ***
Tar (mg/cigarette) 11.657 1.238 5.780 13.580 12.103 11.221 **
Nicotine (mg/cigarette) 1.117 0.131 0.560 1.350 1.094 1.120
CO (mg/cigarette) 11.830 1.198 7.880 14.00 11.967 12.122
Num. of varieties within brand 6.875 3.952 2 12 7.024 6.493
Smoking intensity ( ) 1.128 0.106 1 1.283 1.128 1.128
Expected price change ( ) 0.468 0.499 0 1 0.469 0.465
Note: The last column indicates if column (5) and column (6) are significantly different based on the t
test: * p<0.10, ** p<0.05, *** p<0.01.

34
Table 3 Parameter Estimates
Logit Nested
Logit
Nested
Logit
Nested
Logit
OLS OLS 2SLS GMM
(1) (2) (3) (4)
Price 0.012 0.005 -0.026** -0.021***
(0.009) (0.004) (0.010) (0.005)
0.967*** 0.671*** 0.752***
(0.023) (0.101) (0.153)
Expected price change ( ) -0.015 -0.107*** -0.188*** -0.197***
(0.031) (0.013) (0.048) (0.065)
Smoking Intensity ( ) 1.470*** 1.683*** 1.083*** 1.152***
(0.618) (0.066) (0.302) (0.230)
Tar (mg/cigarette) 0.024 0.061** 0.040** 0.039***
(0.016) (0.015) (0.019) (0.009)
Nicotine (mg/nicotine) -0.268 0.062 -0.159 0.092
(0.684) (0.161) (0.382) (0.239)
CO (mg/nicotine) 0.074 -0.138 0.163 0.127
(0.076) (0.272) (0.471) (0.339)
ln(number of varieties) 0.263 0.182 0.257 0.240
(0.457) (0.173) (0.364) (0.381)
Constant -7.783*** -6.297*** -5.079*** -6.733***
(0.893) (1.128) (1.644) (1.013)
First-stage F statistics for Price 6.73
(P=0.000)
First-stage F statistics for 348.15
First-stage F statistics for 1267.91
Over-identification test (Hansen’s J) 5.105
(P=0.403)
5.196
(P=0.393)
R2
0.863 0.989 0.923 0.901
N 348 348 348 348
Note: The dependent variable is the log of relative market share . All specifications
include the full sets of manufacturer and year dummies. Robust standard errors are in parentheses. *
denotes statistical significance at 10% level, ** denotes statistical significance at 5% level, and ***
denotes statistical significance at 1% level.
35
Table 4 Own- and Cross- Price Elasticities by Year and Class
Year\Class Class A Class B Average
Panel I. Own-price elasticity by year and class
2005 -0.837 -0.555 -0.774
2006 -0.852 -0.582 -0.765
2007 -0.864 -0.610 -0.784
2008 -0.905 -0.598 -0.825
2009 -0.928 -0.630 -0.814
2010 -0.919 -0.624 -0.803
Average -0.902 -0.635 -0.805
Panel II. Within-class-cross-price elasticity by year and class
2005 0.134 0.187 0.150
2006 0.156 0.195 0.165
2007 0.105 0.172 0.146
2008 0.108 0.144 0.122
2009 0.131 0.155 0.136
2010 0.120 0.149 0.127
Average 0.139 0.158 0.146
Panel III. Cross-class-cross-price elasticity by year and class
2005 0.020 0.045 0.028
2006 0.016 0.049 0.026
2007 0.019 0.03 0.025
2008 0.018 0.042 0.026
2009 0.017 0.035 0.023
2010 0.021 0.040 0.024
Average 0.019 0.043 0.024
Note: Elasticities are sales-weighted average. Above elasticities are short-run elasticities
in that the expectations for future cigarette prices are kept constant.
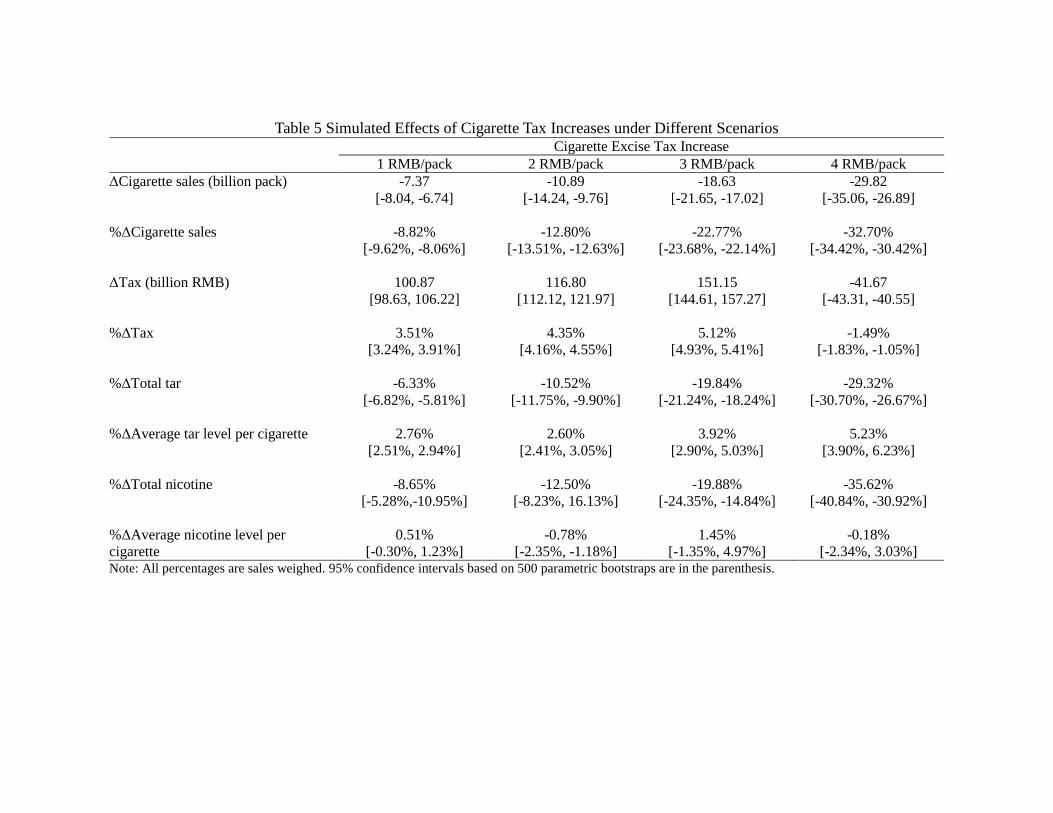
Table 5 Simulated Effects of Cigarette Tax Increases under Different Scenarios Cigarette Excise Tax Increase
1 RMB/pack 2 RMB/pack 3 RMB/pack 4 RMB/pack
ΔCigarette sales (billion pack) -7.37
[-8.04, -6.74]
-10.89
[-14.24, -9.76]
-18.63
[-21.65, -17.02]
-29.82
[-35.06, -26.89]
%ΔCigarette sales -8.82%
[-9.62%, -8.06%]
-12.80%
[-13.51%, -12.63%]
-22.77%
[-23.68%, -22.14%]
-32.70%
[-34.42%, -30.42%]
ΔTax (billion RMB) 100.87
[98.63, 106.22]
116.80
[112.12, 121.97]
151.15
[144.61, 157.27]
-41.67
[-43.31, -40.55]
%ΔTax 3.51%
[3.24%, 3.91%]
4.35%
[4.16%, 4.55%]
5.12%
[4.93%, 5.41%]
-1.49%
[-1.83%, -1.05%]
%ΔTotal tar -6.33%
[-6.82%, -5.81%]
-10.52%
[-11.75%, -9.90%]
-19.84%
[-21.24%, -18.24%]
-29.32%
[-30.70%, -26.67%]
%ΔAverage tar level per cigarette 2.76%
[2.51%, 2.94%]
2.60%
[2.41%, 3.05%]
3.92%
[2.90%, 5.03%]
5.23%
[3.90%, 6.23%]
%ΔTotal nicotine -8.65%
[-5.28%,-10.95%]
-12.50%
[-8.23%, 16.13%]
-19.88%
[-24.35%, -14.84%]
-35.62%
[-40.84%, -30.92%]
%ΔAverage nicotine level per
cigarette
0.51%
[-0.30%, 1.23%]
-0.78%
[-2.35%, -1.18%]
1.45%
[-1.35%, 4.97%]
-0.18%
[-2.34%, 3.03%] Note: All percentages are sales weighed. 95% confidence intervals based on 500 parametric bootstraps are in the parenthesis.


![[ Insert Title Here ] · Is JUUL an effective smoking cessation aid? It might be the best e-cigarette to promote cessation among current cigarette smokers. Efficacy for smoking cessation](https://img.dokumen.tips/doc/110x75/5f9630e4d628024e1a10b274/-insert-title-here-is-juul-an-effective-smoking-cessation-aid-it-might-be-the.jpg)