Embed Size (px)
Citation preview

Audiences-in-waiting?How do people with disabilities engage with culture?
09/10/2017

Contents
1. Executive Summary...............................................................................3
2. Introduction...........................................................................................6
Methodology..........................................................................................6
Responses..............................................................................................9
Profile of respondents............................................................................9
3. Frequency of going out........................................................................11
4. Trends..................................................................................................14
5. Arts attendance and participation.......................................................16
Attendance..........................................................................................16
Artforms...............................................................................................17
Participation.........................................................................................18
Trends in arts attendance....................................................................19
6. Most recent visit to an arts event........................................................21
Distance travelled................................................................................22
Group type...........................................................................................22
7. Motivations for going out.....................................................................23
Motivations to attend arts events........................................................23
8. Barriers................................................................................................25
Barriers to going out............................................................................25
Awareness of local arts venues...........................................................28
9. When do people prefer to go out?.......................................................29
10. Keeping informed.............................................................................29
Appendix One: the survey...................................................................32
2
1.Executive SummaryArts & Disability Ireland (ADI) commissioned this research to gain an in-depth understanding of how people with disabilities nationwide engage with culture in its broadest sense and with the arts in particular. The research consisted of a large scale quantitative survey administered via an online survey and interviews in late Spring 2017.
About the respondents
A total of 523 people completed the survey. Respondents came from across the disability spectrum. The percentages with particular conditions or difficulties are similar to those in the National Disability Authority’s 2013 Survey except that people with a difficulty with pain, breathing, or any other long lasting illness or condition are under-represented.
How often do people with disabilities go out?
97% of respondents said they had gone outside their own home and garden to do something enjoyable in the past month. Respondents who are severely limited in everyday activity go out less often (five times a month compared to nine times for all respondents).
What do people with disabilities do when they go out?
The most popular activities were social experiences. Almost nine out of ten respondents had eaten out in the past 12 months and seven out of ten had gone to a pub or bar or to a cinema.
Age was a bigger factor than the nature of respondents’ disability e.g. those aged 65+ are less likely to have been to a pub or bar in the past 12 months but more likely to have been to a garden or garden centre or to a museum or art gallery. Respondents aged 19 to 24 are less likely to have been to the cinema and more likely to have been to a night club.
3

Are people with disabilities arts attenders?
Just nine respondents said they had never been to a live performance or exhibition. Respondents are more likely to have attended an arts event than the population as a whole. 86% of respondents said they had attended at least one arts event including cinema in the past 12 months (79% excluding cinema) compared to 64% of the general population according to The Arts in Irish Life 2015.
Overall, 37% attended a live performance or exhibition in the past month. Fewer of those who were severely limited in everyday activity attended in the past month.
90% were able to describe where they could see live performances or exhibitions in their local area.
Do people with disabilities go out less nowadays?
94% of respondents said they did at least one of the listed activities more often five years ago. For some, this appears to be because their preferences have changed. At least a fifth of those attending a particular arts activity in the past 12 months used to go more often.
What would people with disabilities like to do more often?
Not only are our respondents arts attenders, almost two thirds want to attend more. At least a third of respondents would like to do the following more often: eat at a restaurant or café, go to a cinema, visit friends in their home, go to a music concert or gig, go to a play and go to a pub or bar. Between a fifth and a third of those who did not attend a particular artform in the past 12 months would like to do so in future. Overall, 64% of respondents would like to do at least one arts activity more often with 46% wanting to go to a cinema more often, 40% a music concert or gig and 37% a play.
4
Do people with disabilities participate in the arts?
Respondents are also more likely to participate in arts and crafts activities than the Irish population. 56% of respondents participated in an arts or crafts activity outside their home in the past 12 months compared to 35% of the general population according to The Arts in Irish Life 2015. Respondents were most likely to have created an artwork, danced, sung or played an instrument.
Why do people with disabilities go out?
Access is not at the forefront of respondents’ minds when they think about what motivates them with just 8% saying their ideal experience involved resolving some kind of access issue. 49% of respondents said they go out for social experiences. A key barrier for a fifth of respondents is that they do not have anyone to go with. 38% said their ideal day or night out included an arts event.
The majority of respondents (69%) go to live performances or exhibitions to be entertained or enjoy the atmosphere of a live event. They are not motivated simply because the event is accessible (1%).
What stops people with disabilities going out?
The key barriers to going out are access (mentioned by 33% of respondents), lack of support (22%), health (29%), cost (25%) and transport (15%).
Respondents were asked about their last visit to a live performance or exhibition. A third went to an event in their immediate area, travelling less than 5km. Half travelled between 10km and 50km. 17% travelled more than 50km. There was little difference between limitation groups.
5
How do people with disabilities find out what’s on?
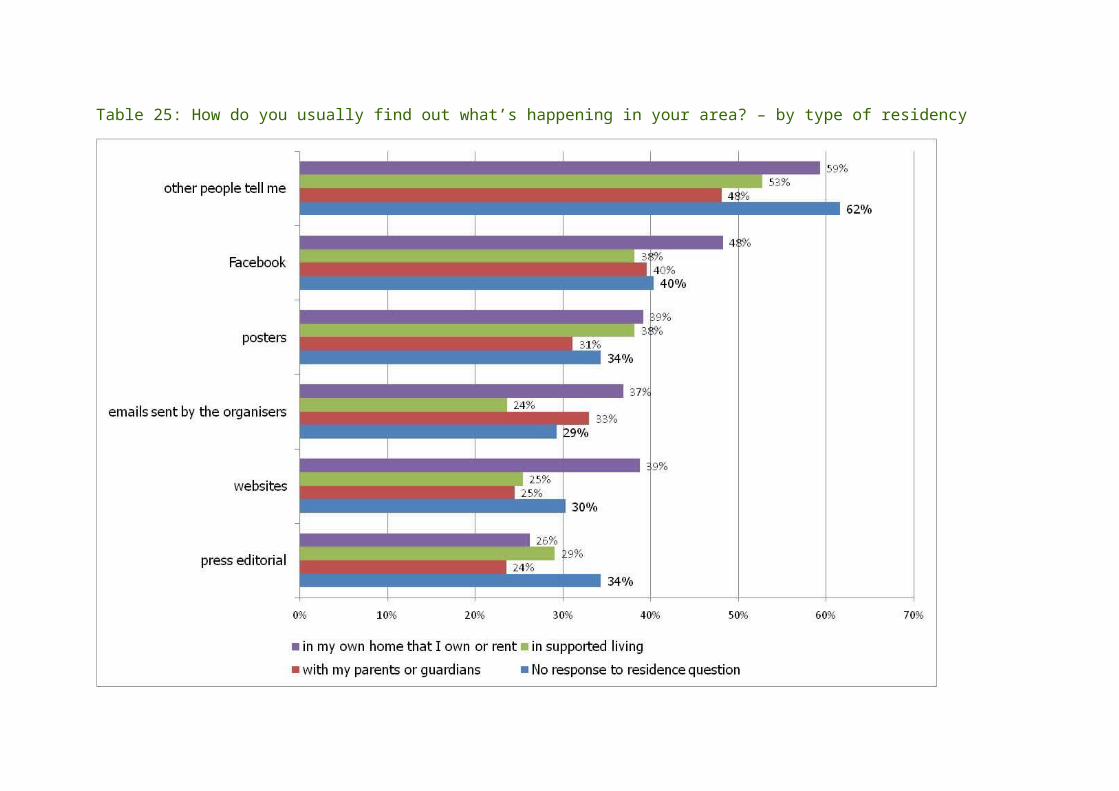
Two thirds of respondents find out what is happening in their area through personal contacts. This means that people who are socially isolated are likely to remain so as they are not part of these word of mouth networks. Respondents living with parents or guardians are less likely to have other people tell them about events.
Other important sources of information are Facebook (52% of respondents), posters (43%), emails sent by organisers (39%), websites (39%) and news items, reviews or listings in print media (33%).
6
2.IntroductionArts & Disability Ireland (ADI) commissioned Heather Maitland to build upon a programme of qualitative research carried out by Grogan Research Ltd in Dun Laoghaire Rathdown in 20151, identifying the extent to which these findings are replicated (or not) elsewhere in Ireland. The aim was to gain in-depth understanding of how people with disabilities nationwide engage with culture in its broadest sense and with the arts in particular.2,3
The research consisted of a large scale quantitative survey administered via an online survey and interviews in late Spring 2017.
The research focused on issues around going out to engage in leisure activities including:
frequency of going out type of leisure activity engaged in motivations and barriers to going out preferences and aspirations how people find out about opportunities to go out
See Appendix One for a copy of the survey.
Methodology
The survey was developed in collaboration with both disability organisations and arts organisations. They also promoted participation in the survey, sending it out to their members, service users and other contacts as well as publicising and linking to it in newsletters, social media and websites.
1 Funded by Dún Laoghaire Rathdown County Council /HSE Arts and Health Partnership, Arts & Disability Ireland, and dlr Social Inclusion Office, 20152The Healthy Ireland Survey 2015 research report emphasises the strong link between social connectedness and physical and mental health and wellbeing.3 A National Survey of Public Attitudes to Disability in Ireland, NDA, 2011 reported on social inclusion and barriers to participation in social activities for people with disabilities.
7

Partners also supported people with intellectual disabilities to take part. An assistant with a tablet read out the questions and possible answers and entered their responses online. Others were supported by friends and family. 11% of respondents said they had “a bit of help” to answer the survey and 10% said they had “a lot of help”.
The partner organisations were:
COPE Foundation Cork Deaf Association Deaf Hear Disability Federation Ireland Inclusion Ireland Irish Deaf Society Irish Deaf Youth Irish Guide Dogs Irish Wheelchair Association KCAT Mayfield Arts National Council for the Blind of Ireland National League for the Blind RehabCare Ridgepool Training Centre Scannan Technologies Soundadvice SoundOUT That’s Life – Brothers of Charity Western Care
Staff from the National Disability Authority and the Department of Health’s Healthy Ireland team also provided help and advice.
Arts & Disability Ireland bases its work on the social model of disability which understands that it is society that disables people rather than disadvantage being an inevitable consequence of their impairment. The medical model of disability focuses on the impairment or condition first.
8
Asking about people to give details of their impairment is contrary to the social model and many people with disabilities find such questions objectionable. It was important, however, that the results from this survey could be compared to other Irish research projects which analyse responses by degree of limitation and impairment type. Ensuring this survey was completed by a wide range of people with disabilities meant comparing the sample with other large scale research on the incidence of disability in the population. In addition, one of the research objectives was to identify if engagement with culture differed across people with different impairments. Information about respondents’ impairments was therefore essential.
Two questions were asked:
Do you have any of the following long-lasting conditions or difficulties?
For at least the past six months to what extent have you been limited in everyday activities because of health problems like an on-going physical or mental health problem, illness or disability?
The first question used the categories from the Central Statistics Office 2011 census and the National Disability Authority’s 2013 Survey on National Disability Strategy Indicators. The second question was used in the Department of Health’s Healthy Ireland survey after consultation with people with disabilities.
To ensure at least some acknowledgement of the social model of disability, these questions were optional. Respondents were encouraged to answer them by a preamble that stated “Your answers to these questions are important because they will tell us the number of people whose opportunities to go out are reduced because of a disability or long lasting condition. They will also help us ensure we have asked the opinions of people whose opportunities are limited for different reasons”.
9
The survey was made as accessible as possible by using Plain English4, distributing an Irish Sign Language (ISL) version and working with Inclusion Ireland to produce an Easy to Read guide which partners also distributed widely.
Responses
A total of 523 people responded to the online survey. As predicted, there was resistance to giving details of conditions, difficulties and limitations with 110 respondents (21% of the total) not answering these questions.
Profile of respondents
Conditions, difficulties and limitations
A fifth of respondents answering the question identified themselves as severely limited by their condition but a third said they were not limited at all.
Table 1: For at least the past six months to what extent have you been limited in everyday activities because of health problems like an on-going physical or mental health problem, illness or disability?
No. of responden
ts
% of responden
tsSeverely limited 77 19%Limited but not severely 166 40%Not limited at all 133 32%Don't know 37 9%Total 413 100%No response 110
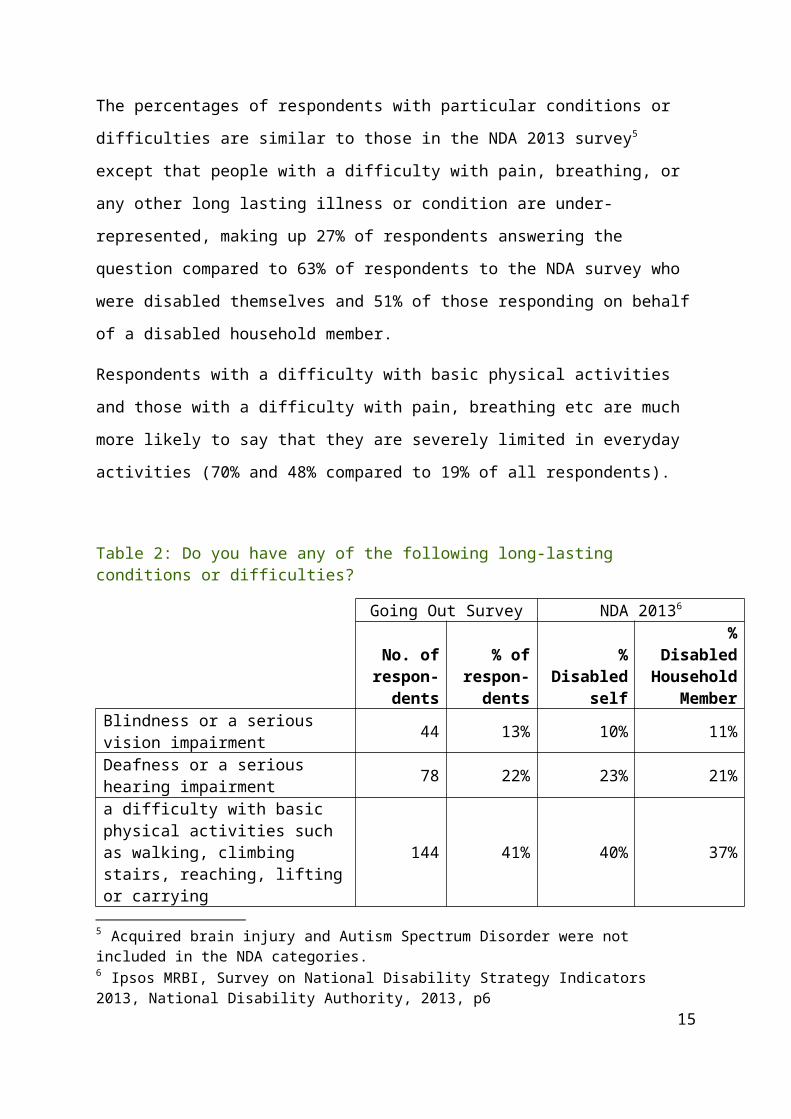
The percentages of respondents with particular conditions or difficulties are similar to those in the NDA 2013 survey5 except that people with a difficulty with pain, breathing, or any other long lasting illness or condition are under-represented, making up 27% of respondents answering the
4 The survey was approved by the National Adult Literacy Agency5 Acquired brain injury and Autism Spectrum Disorder were not included in the NDA categories.
10

question compared to 63% of respondents to the NDA survey who were disabled themselves and 51% of those responding on behalf of a disabled household member.
Respondents with a difficulty with basic physical activities and those with a difficulty with pain, breathing etc are much more likely to say that they are severely limited in everyday activities (70% and 48% compared to 19% of all respondents).
Table 2: Do you have any of the following long-lasting conditions or difficulties?
Going Out Survey NDA 20136
No. of respon-
dents
% of respon-
dents
% Disabled
self
% Disabled
Household Member
Blindness or a serious vision impairment 44 13% 10% 11%Deafness or a serious hearing impairment 78 22% 23% 21%a difficulty with basic physical activities such as walking, climbing stairs, reaching, lifting or carrying
144 41% 40% 37%
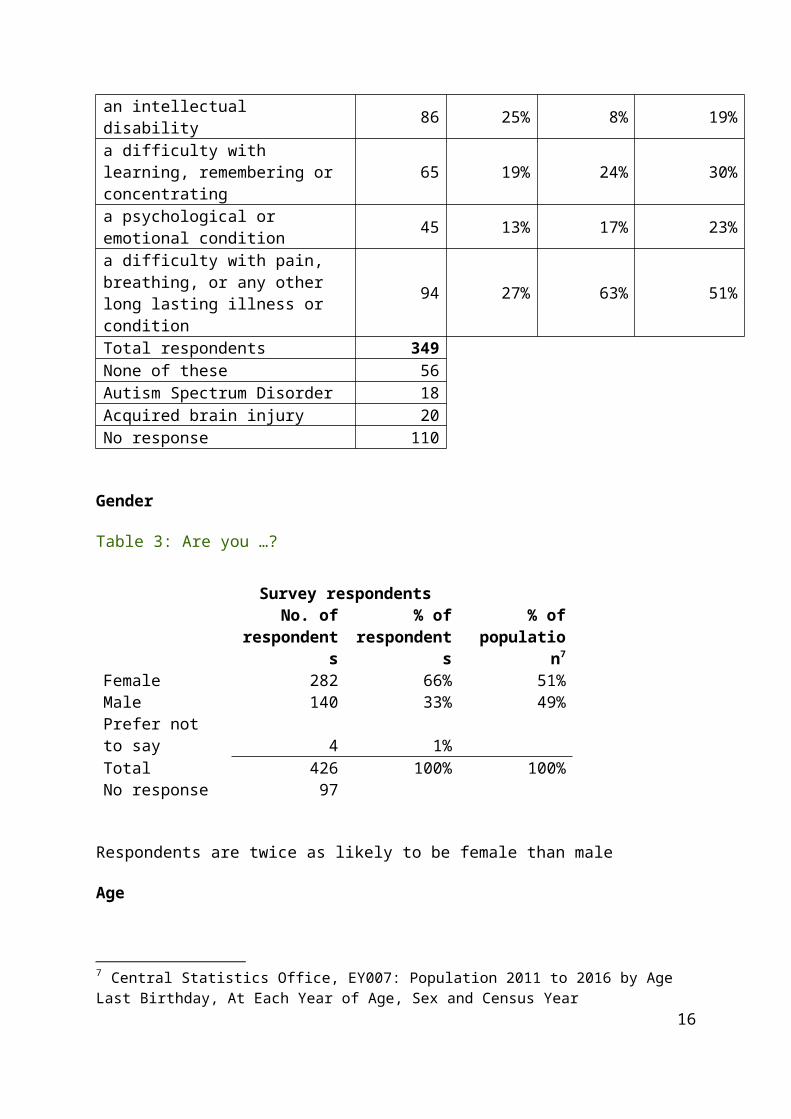
an intellectual disability 86 25% 8% 19%a difficulty with learning, remembering or concentrating
65 19% 24% 30%
a psychological or emotional condition 45 13% 17% 23%a difficulty with pain, breathing, or any other long lasting illness or condition
94 27% 63% 51%
Total respondents 349None of these 56Autism Spectrum Disorder 18Acquired brain injury 20No response 110
6 Ipsos MRBI, Survey on National Disability Strategy Indicators 2013, National Disability Authority, 2013, p6
11
Gender
Table 3: Are you …?
Survey respondentsNo. of
respondents
% of responden
ts
% of populatio
n7
Female 282 66% 51%Male 140 33% 49%Prefer not to say 4 1%Total 426 100% 100%No response 97
Respondents are twice as likely to be female than male
Age
The survey was aimed at adults aged over 18, so just two respondents are aged 16 to 18. The percentage of respondents aged 45 to 54 is higher than in the Irish population (23% compared to 17%) while the percentage of respondents aged 65+ is lower than in the population (9% compared to 17%).
Table 4: How old are you?
Age group
No. of responden
ts
% of responden
ts
% of populatio
n8
16 to 18 3 0% 5%19 to 24 46 11% 9%25 to 34 81 19% 18%35 to 44 96 23% 20%45 to 54 98 23% 17%55 to 64 60 14% 14%65+ 40 9% 17%Total 425 100%No response 98
7 Central Statistics Office, EY007: Population 2011 to 2016 by Age Last Birthday, At Each Year of Age, Sex and Census Year8 Central Statistics Office, EY007
12
3.Frequency of going outFour respondents (1%) said they had not done any of the listed activities in the past 12 months. 16 (3%) said they had not been outside their own home and garden to do something enjoyable in the past month. They are from all of the limitation groups (including those who said they were not limited at all) and all broad difficulty groups. Nine live in their own home, two with parents or guardians, two in supported living and two did not respond to the residency question.
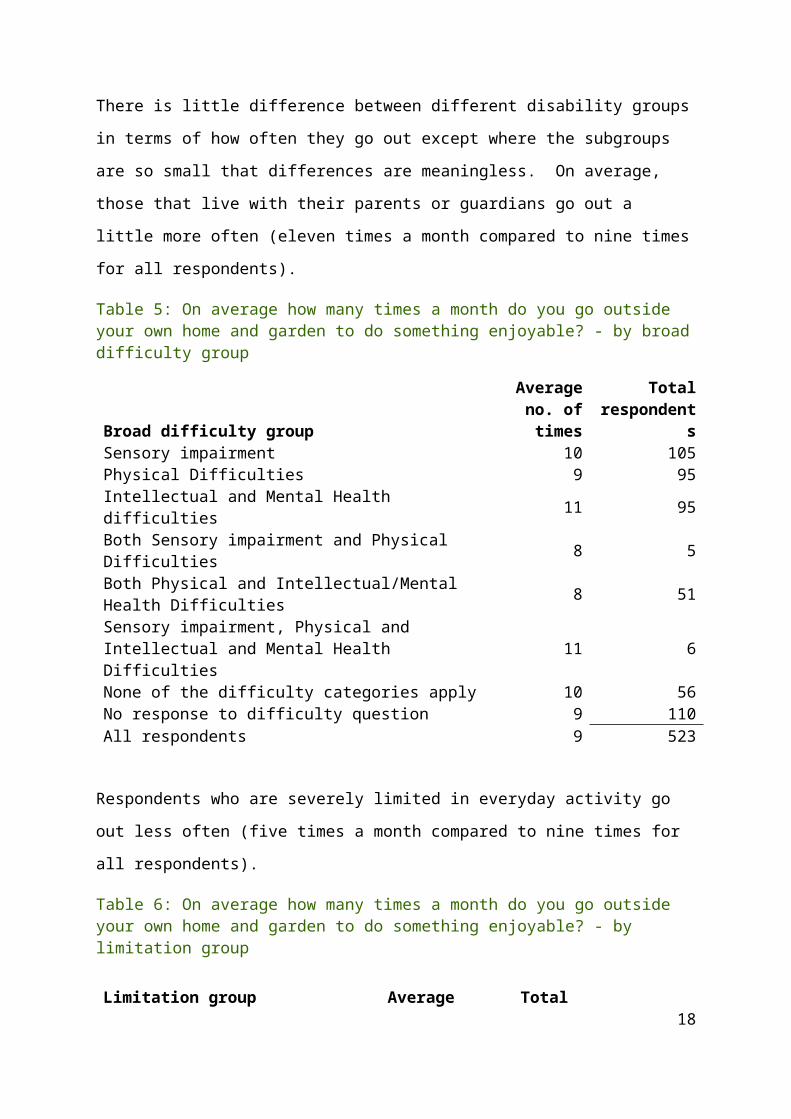
There is little difference between different disability groups in terms of how often they go out except where the subgroups are so small that differences are meaningless. On average, those that live with their parents or guardians go out a little more often (eleven times a month compared to nine times for all respondents).
Table 5: On average how many times a month do you go outside your own home and garden to do something enjoyable? - by broad difficulty group
Broad difficulty group
Average no. of times
Total responden
tsSensory impairment 10 105Physical Difficulties 9 95Intellectual and Mental Health difficulties 11 95Both Sensory impairment and Physical Difficulties 8 5Both Physical and Intellectual/Mental Health Difficulties 8 51Sensory impairment, Physical and Intellectual and Mental Health Difficulties 11 6None of the difficulty categories apply 10 56No response to difficulty question 9 110All respondents 9 523
Respondents who are severely limited in everyday activity go out less often (five times a month compared to nine times for all respondents).
Table 6: On average how many times a month do you go outside your own home and garden to do something enjoyable? - by limitation group
Limitation group Average Total 13

no. of times
respondents
severely limited 5 77limited but not severely 10 166not limited at all 11 133don't know 9 37no response to limitation question 9 110All respondents 9 523
On average, respondents did seven of the listed activities in the past 12 months, with little difference between broad difficulty, limitation and residency groups.
The most popular activities were social experiences. Almost nine out of ten respondents had eaten out in the past 12 months. Seven out of ten had gone to a pub or bar with a similar proportion going to a cinema.
There were differences by limitation group. Respondents saying they are severely limited in everyday activities are much less likely to have been to a music gig or concert (22% compared to 39% of all respondents), gone to a sports event (19% compared to 34%), participate in sport (9% compared to 26%), and gone to an arts festival (4% compared to 18%).
Respondents saying they are not limited at all are much more likely to have participated in sport (41% compared to 26%).
Table 7: Which of these have you done in the past 12 months? - top ten activities
Activity
No. of responden
ts
% of responden
tseaten at a restaurant or café 450 87%gone to a pub or bar 364 70%gone to a cinema 356 69%visited friends in their home 344 66%gone to a meeting of a group or society 275 53%gone to a garden or garden centre 246 47%gone to a museum or art gallery 233 45%visited a library 232 45%gone to a music concert or gig 202 39%
14
participated in an arts or craft activity 185 36%Total 519
There are big differences between some age groups.
Respondents aged 65+ are less likely to have been to a pub or bar (48% compared to 70% of all respondents) but more likely to have been to a garden or garden centre (63% compared to 47%) and more likely to have been to a museum or art gallery (60% compared to 45%). No-one from this age group had been to a night club compared to 18% of all respondents.
Respondents aged 19 to 24 are less likely to have been to the cinema (52% compared to 69%) and more likely to have been to a night club (33% compared to 18%).
Respondents aged 25 to 34 are less likely to have been to the cinema (54% compared to 69%) and more likely to have been to a night club (33% compared to 18%) and more likely to have been to a stand up comedy gig (27% compared to 13%).
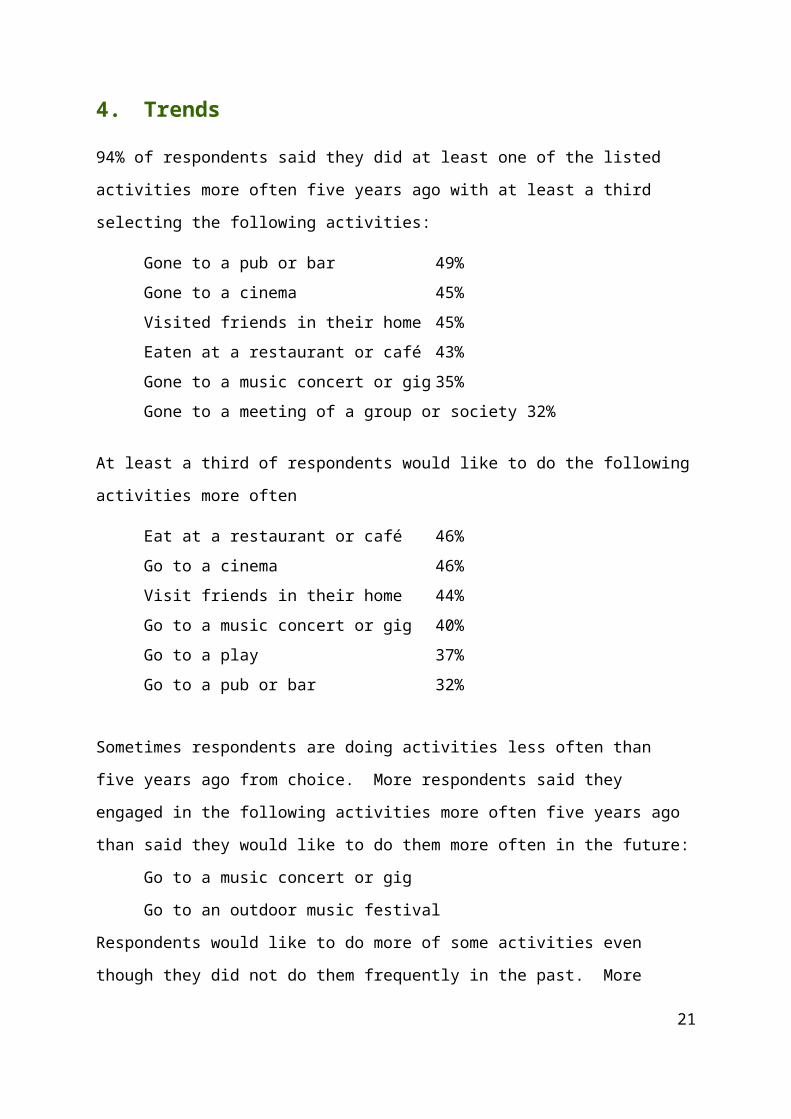
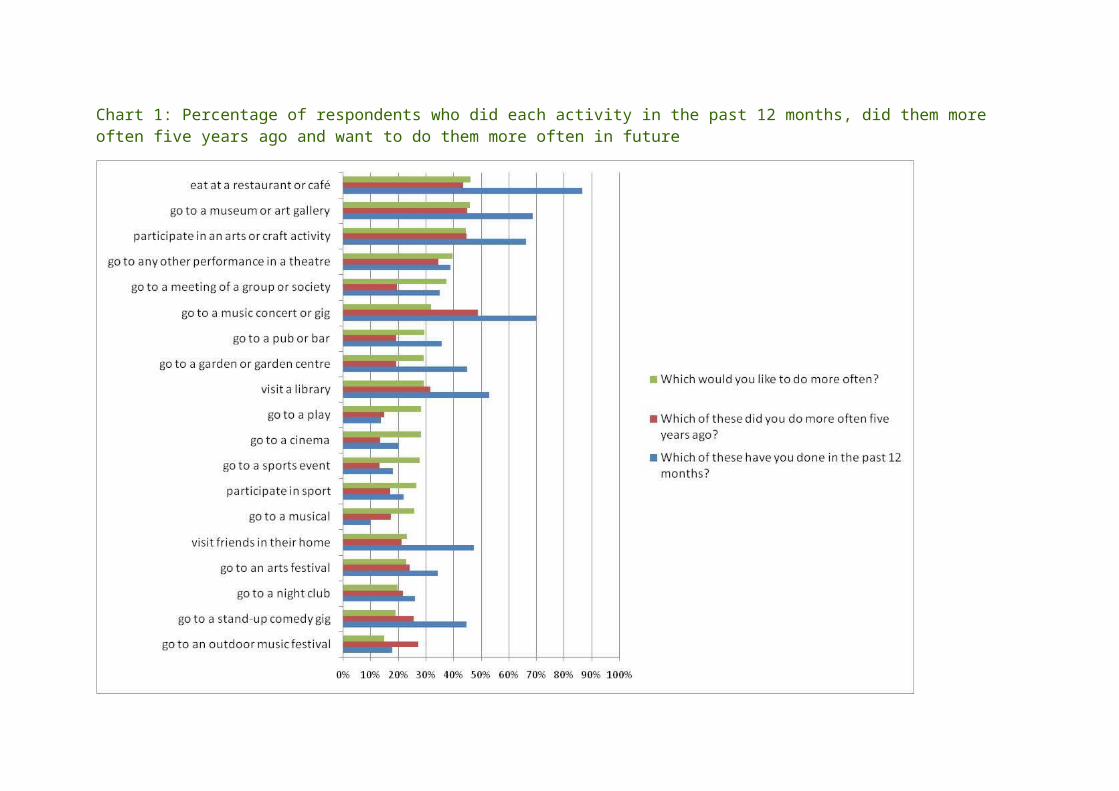
4.Trends94% of respondents said they did at least one of the listed activities more often five years ago with at least a third selecting the following activities:
Gone to a pub or bar 49%Gone to a cinema 45%Visited friends in their home 45%Eaten at a restaurant or café 43%Gone to a music concert or gig 35%Gone to a meeting of a group or society 32%
At least a third of respondents would like to do the following activities more often
Eat at a restaurant or café 46%Go to a cinema 46%
15
Visit friends in their home 44%Go to a music concert or gig 40%Go to a play 37%Go to a pub or bar 32%
Sometimes respondents are doing activities less often than five years ago from choice. More respondents said they engaged in the following activities more often five years ago than said they would like to do them more often in the future:
Go to a music concert or gigGo to an outdoor music festival
Respondents would like to do more of some activities even though they did not do them frequently in the past. More respondents said they would like to do these activities more often in the future than said they did them more often in the past:
Go to a meeting of a group or societyGo to a cinemaGo to a sports eventGo to a play
16

Chart 1: Percentage of respondents who did each activity in the past 12 months, did them more often five years ago and want to do them more often in future
5.Arts attendance and participation
Attendance
Respondents are more likely to have attended an arts event than the population as a whole. 86% of respondents said they attended at least one arts event including cinema in the past 12 months (79% excluding cinema) compared to 64% of the general population according to The Arts in Irish Life 2015.9
There are differences by age. Those aged under 25 and 35 to 44 are least likely to have attended a live performance or exhibition and those aged 65+ are most likely to have attended.
Table 8: Which of these have you done in the past 12 months? – aggregated arts activities by age group
All respondents
Respondents attending arts excl cinema
Age group No. No.
% in age group
attending65+ 40 35 88%25 to 34 81 69 85%55 to 64 60 50 83%45 to 54 98 80 82%35 to 44 96 74 77%16 to 18 3 3 75%19 to 24 46 34 74%Total respondents 425 345 81%No response 98 98
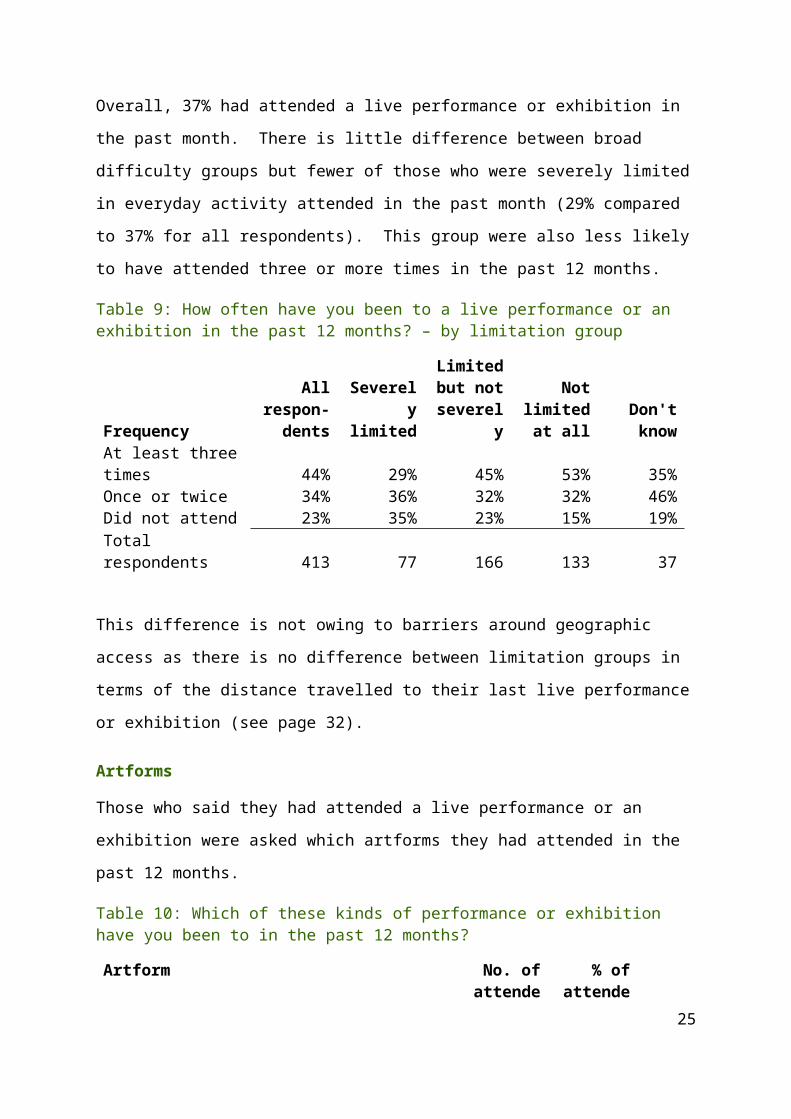
Overall, 37% had attended a live performance or exhibition in the past month. There is little difference between broad difficulty groups but fewer of those who were severely limited in everyday activity attended in the past month (29% compared to 37% for all respondents). This group were also less likely to have attended three or more times in the past 12 months.
9 Kantar Media, The Arts in Irish Life – 2015 Research Update, Arts Audiences / the Arts Council, 2016 - this survey included arthouse cinema but exclude mainstream cinema

Table 9: How often have you been to a live performance or an exhibition in the past 12 months? – by limitation group
Frequency
All respon-
dents
Severely
limited
Limited but not severel
y
Not limited
at allDon't know
At least three times 44% 29% 45% 53% 35%Once or twice 34% 36% 32% 32% 46%Did not attend 23% 35% 23% 15% 19%Total respondents 413 77 166 133 37
This difference is not owing to barriers around geographic access as there is no difference between limitation groups in terms of the distance travelled to their last live performance or exhibition (see page 24).
Artforms
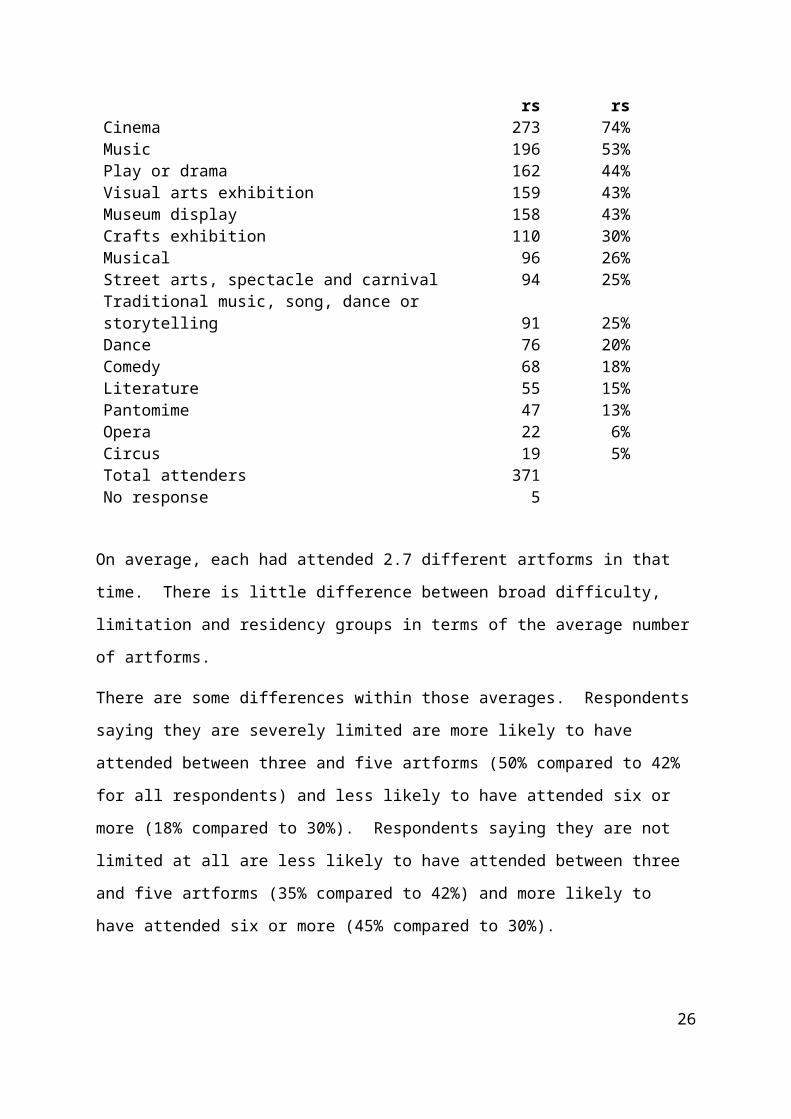
Those who said they had attended a live performance or an exhibition were asked which artforms they had attended in the past 12 months.
Table 10: Which of these kinds of performance or exhibition have you been to in the past 12 months?
Artform
No. of attende
rs
% of attende
rsCinema 273 74%Music 196 53%Play or drama 162 44%Visual arts exhibition 159 43%Museum display 158 43%Crafts exhibition 110 30%Musical 96 26%Street arts, spectacle and carnival 94 25%Traditional music, song, dance or storytelling 91 25%Dance 76 20%Comedy 68 18%Literature 55 15%Pantomime 47 13%Opera 22 6%Circus 19 5%Total attenders 371
19

No response 5
On average, each had attended 2.7 different artforms in that time. There is little difference between broad difficulty, limitation and residency groups in terms of the average number of artforms.
There are some differences within those averages. Respondents saying they are severely limited are more likely to have attended between three and five artforms (50% compared to 42% for all respondents) and less likely to have attended six or more (18% compared to 30%). Respondents saying they are not limited at all are less likely to have attended between three and five artforms (35% compared to 42%) and more likely to have attended six or more (45% compared to 30%).
Participation
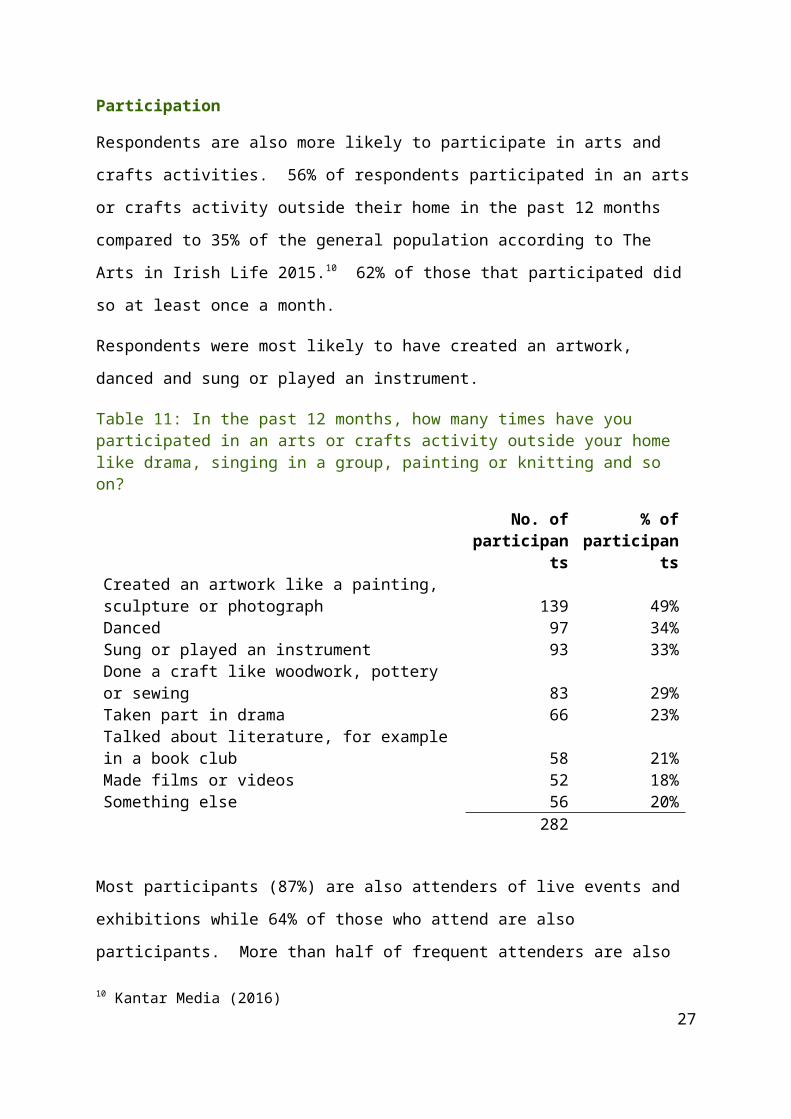
Respondents are also more likely to participate in arts and crafts activities. 56% of respondents participated in an arts or crafts activity outside their home in the past 12 months compared to 35% of the general population according to The Arts in Irish Life 2015.10 62% of those that participated did so at least once a month.
Respondents were most likely to have created an artwork, danced and sung or played an instrument.
Table 11: In the past 12 months, how many times have you participated in an arts or crafts activity outside your home like drama, singing in a group, painting or knitting and so on?
No. of participan
ts
% of participan
tsCreated an artwork like a painting, sculpture or photograph 139 49%Danced 97 34%Sung or played an instrument 93 33%Done a craft like woodwork, pottery or sewing 83 29%Taken part in drama 66 23%Talked about literature, for example in a 58 21%
10 Kantar Media (2016)20
book clubMade films or videos 52 18%Something else 56 20%
282
Most participants (87%) are also attenders of live events and exhibitions while 64% of those who attend are also participants. More than half of frequent attenders are also frequent participants. Those who don’t attend are unlikely to be participants with 71% of non-attenders not participating either.
Table 12: Crossover between attendance and participationThis table below shows the percentage of respondents who attended a live event or exhibition at the frequency in the top row who also participated in arts or crafts activity at the frequency in the first column. eg 58% respondents attended a live event or exhibition at least once a month and also participated in an arts or crafts activity at least once a month
Attendance at a live event or exhibition
Participation in arts or crafts activity
At least once a month
Less often than
once a month
Did not attend
Total respon-
dentsAt least once a month 58% 38% 14% 173Less often than once a month 17% 24% 15% 103Did not participate 25% 38% 71% 221Total respondents 71 305 121 497
Trends in arts attendanceAt least a fifth of those attending a particular arts activity in the past 12 months used to go more often.
Table 13: Attenders of arts activities who used to attend more often five years agoArtform % going
more often Total
attending in 21

five years ago
past 12 months
Cinema 44% 356Music concert or gig 43% 202Outdoor music festival 37% 52Arts festival 25% 93Museum or art gallery 24% 233Musical 23% 113Play 22% 181Any other performance in a theatre 21% 105Stand-up comedy gig 19% 70
Lapsed attendance
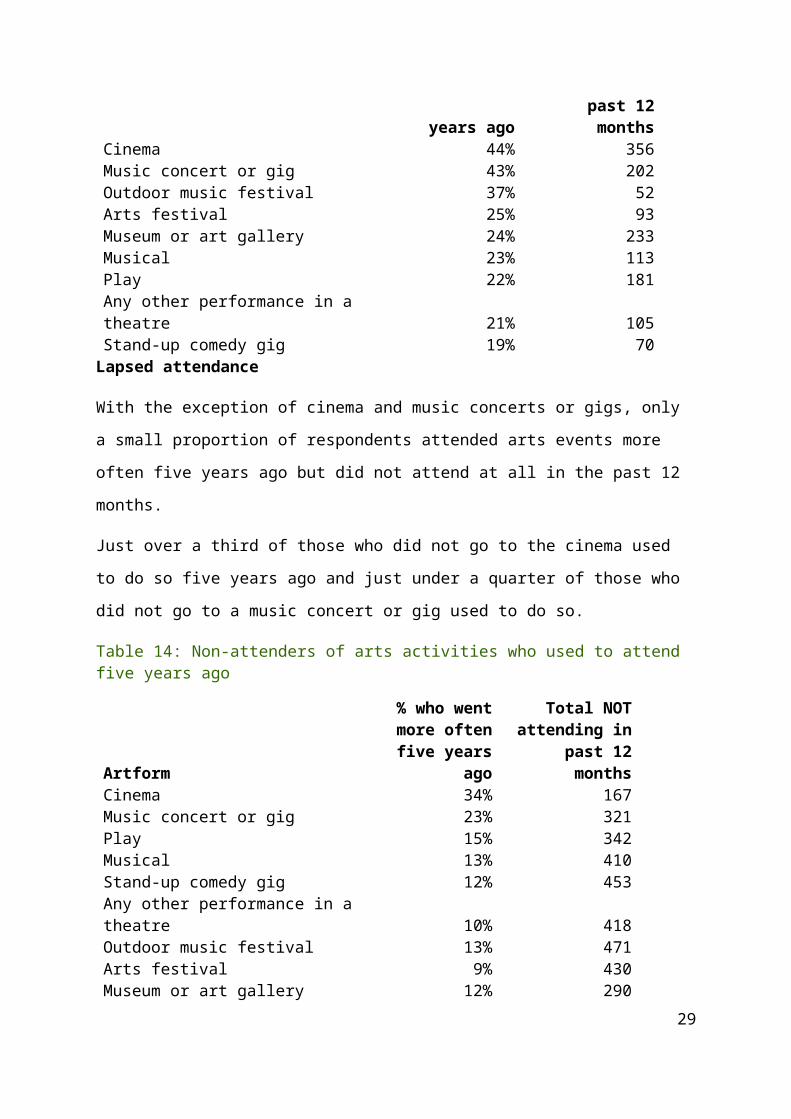
With the exception of cinema and music concerts or gigs, only a small proportion of respondents attended arts events more often five years ago but did not attend at all in the past 12 months.
Just over a third of those who did not go to the cinema used to do so five years ago and just under a quarter of those who did not go to a music concert or gig used to do so.
Table 14: Non-attenders of arts activities who used to attend five years ago
Artform
% who went more often
five years ago
Total NOT attending in
past 12 months
Cinema 34% 167Music concert or gig 23% 321Play 15% 342Musical 13% 410Stand-up comedy gig 12% 453Any other performance in a theatre 10% 418Outdoor music festival 13% 471Arts festival 9% 430Museum or art gallery 12% 290
Potential to increase frequency
In all, 64% would like to do at least one arts activity more often (55% excluding those who said they wanted to go to a cinema but no other arts
22
activity more often). More than a third of all respondents would like to do the following arts activities more often
go to a cinema 46%go to a music concert or gig 40%go to a play 37%
Importantly, between a fifth and a third of those who did not attend in the past 12 months would like to do so in future. The artforms with greatest potential among non attenders of those artforms are music concerts or gigs and plays. The artforms with greatest potential among those who did attend are outdoor music festivals, cinema, music concerts or gigs and plays with at least half of respondents attending saying they would like to go more often.
Table 15: Percentage of respondents who said they would like to attend specific arts activities more often
Artform
% of those who attended in the past 12
months
% of those who did NOT attend in the
past 12 months
Any other performance in a theatre 45% 24%Arts festival 45% 23%Cinema 54% 28%Museum or art gallery 39% 21%Music concert or gig 52% 31%Musical 43% 21%Outdoor music festival 56% 22%Play 51% 30%Stand-up comedy gig 50% 25%
6.Most recent visit to an arts eventOnly nine respondents (2%) said they had never been to a life performance or exhibition. Just over a third of respondents had been in the past month. There was little difference between broad difficulty groups. There were differences between limitation groups with 29% of
23

those saying that they are severely limited attending in the past month compared to 42% of those not limited at all.
19% of those in the severely limited group last went more than two years ago compared to 6% of those limited but not severely and 5% of those not limited at all.
Table 16: When did you last go to a live performance or exhibition?No. of
respondents
% of responden
tsIn the past month 163 37%Between two and six months ago 100 23%Between seven months and a year ago 49 11%Between one and two years ago 39 9%More than two years ago 41 9%Can’t remember 40 9%I’ve never been 9 2%Total respondents 441 100%
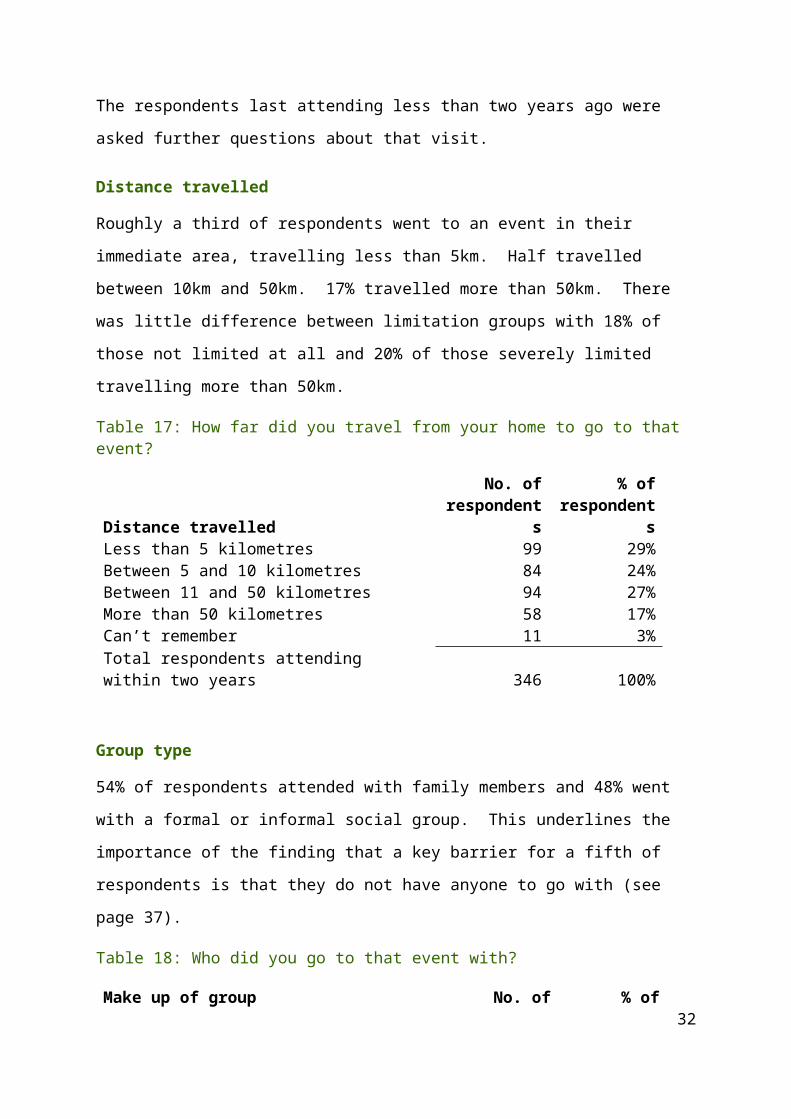
The respondents last attending less than two years ago were asked further questions about that visit.
Distance travelled
Roughly a third of respondents went to an event in their immediate area, travelling less than 5km. Half travelled between 10km and 50km. 17% travelled more than 50km. There was little difference between limitation groups with 18% of those not limited at all and 20% of those severely limited travelling more than 50km.
Table 17: How far did you travel from your home to go to that event?
Distance travelled
No. of responden
ts
% of responden
tsLess than 5 kilometres 99 29%Between 5 and 10 kilometres 84 24%Between 11 and 50 kilometres 94 27%More than 50 kilometres 58 17%Can’t remember 11 3%Total respondents attending within two years 346 100%
24
Group type
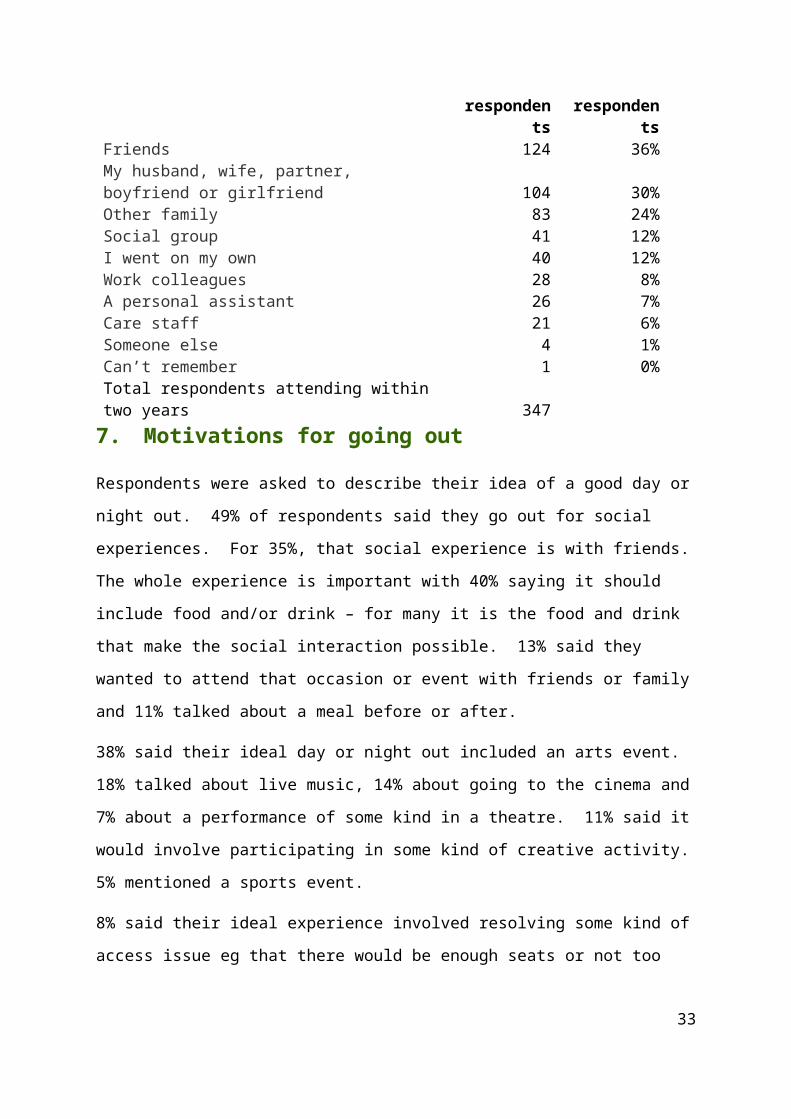
54% of respondents attended with family members and 48% went with a formal or informal social group. This underlines the importance of the finding that a key barrier for a fifth of respondents is that they do not have anyone to go with (see page 28).
Table 18: Who did you go to that event with?
Make up of group
No. of responde
nts
% of responde
ntsFriends 124 36%My husband, wife, partner, boyfriend or girlfriend 104 30%Other family 83 24%Social group 41 12%I went on my own 40 12%Work colleagues 28 8%A personal assistant 26 7%Care staff 21 6%Someone else 4 1%Can’t remember 1 0%Total respondents attending within two years 3477.Motivations for going outRespondents were asked to describe their idea of a good day or night out. 49% of respondents said they go out for social experiences. For 35%, that social experience is with friends. The whole experience is important with 40% saying it should include food and/or drink – for many it is the food and drink that make the social interaction possible. 13% said they wanted to attend that occasion or event with friends or family and 11% talked about a meal before or after.
38% said their ideal day or night out included an arts event. 18% talked about live music, 14% about going to the cinema and 7% about a performance of some kind in a theatre. 11% said it would involve participating in some kind of creative activity. 5% mentioned a sports event.
25
8% said their ideal experience involved resolving some kind of access issue eg that there would be enough seats or not too much background noise or simply that they could take equality of access for granted.
Motivations to attend arts events
Respondents who had been to an arts event in the past two years were asked to choose their motivations from a set developed and tested by Morris Hargreaves McIntyre which has been used widely in theatres and museums in the UK and some European countries.
The majority of respondents (69%) want to be entertained or enjoy the atmosphere of a live event. They are not motivated simply because the event is accessible (1%).
Table 19: Why did you go to that event?
Motivation
No. of responden
ts
% of responden
tsTo be entertained 205 60%To enjoy the atmosphere 138 40%To spend time with friends or family 104 30%Because the arts are an important part of who I am 97 28%To do something new or out of the ordinary 88 26%To escape from everyday life 86 25%To be inspired 65 19%To learn something 53 15%For reflection 35 10%For a special occasion 34 10%For professional reasons 34 10%It would make me think 28 8%For academic reasons 15 4%For peace and quiet 14 4%Someone I knew was performing/exhibiting 12 3%Not my choice/a gift 11 3%To entertain my children/grandchildren 10 3%To educate or stimulate my children/grandchildren 6 2%It was accessible 5 1%Another reason (edited) 4 1%I can’t remember 3 1%
26
344
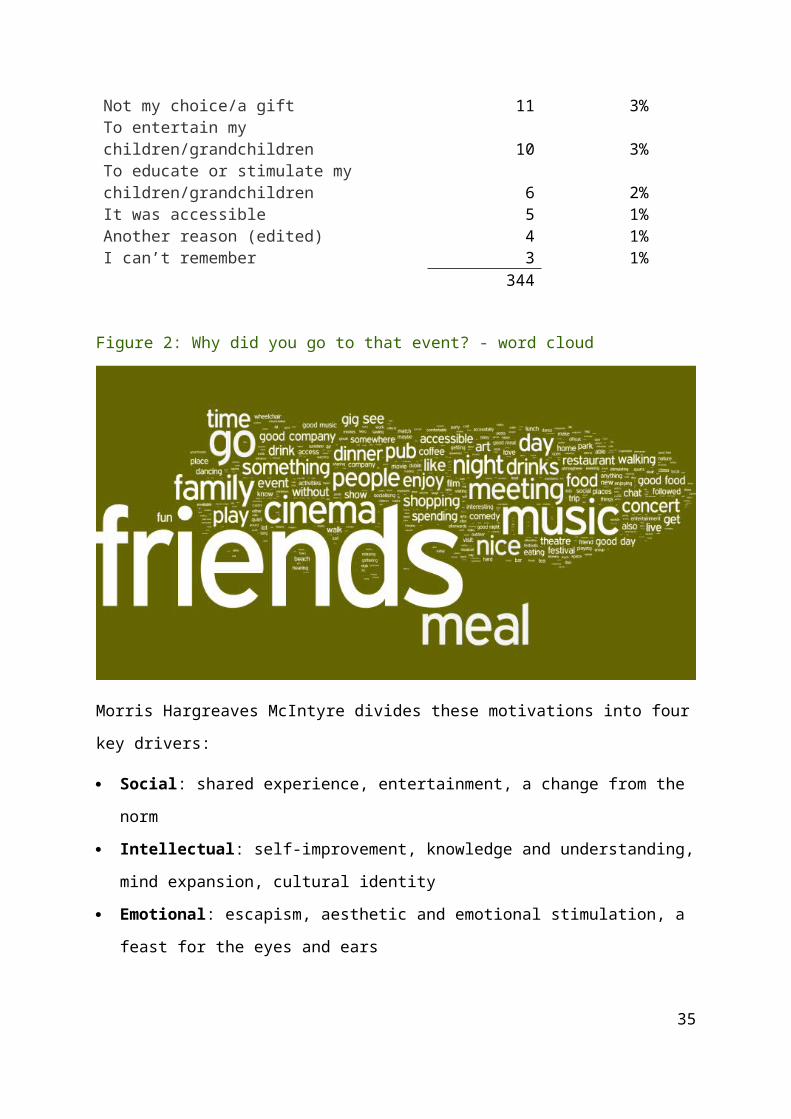
Figure 2: Why did you go to that event? - word cloud
Morris Hargreaves McIntyre divides these motivations into four key drivers:
Social: shared experience, entertainment, a change from the norm Intellectual: self-improvement, knowledge and understanding, mind
expansion, cultural identity Emotional: escapism, aesthetic and emotional stimulation, a feast for
the eyes and ears Spiritual: soul food, inspiration, transcendental experiences11
Eight out of ten respondents selected at least one motivation from the Social driver category.
Table 20: Why did you go to that event? - by key driver type
Driver
No. of responden
ts
% of responden
tsSocial 257 79%Emotional 185 57%
11 Gerri Morris, ‘It’s a Vision Thing’ p16 consulted at http://www.culturehive.co.uk/wp-content/uploads/2013/09/Its-a-vision-thing..Gerri-Morris..2004.pdf 09/10/2017
27

Intellectual 150 46%Spiritual 125 39%Total respondents 324
Respondents’ motivations are more complex than this implies, though, with only a third of respondents chose motivations from just one driver category.
Table 21: Why did you go to that event? - number of key driver types selectedNo. of driver categories
No. of respon
dents
% of respon
dentsOne 106 33%Two 92 28%Three 77 24%Four 49 15%Total respondents 324 100%
8.Barriers
Barriers to going out
Only 11 respondents (2%) said nothing stopped them going out.
The key barriers are:
Access: 33% mentioned an access issue
“Access to venues for wheelchair users can be hit and miss.... And where the seating area for wheelchair users is often not respected by people sitting in front.... They often stand, blocking our view of the performance!...”
Lack of support: 22% cited issues around social isolation and lack of adequate support, no-one to go with, availability of PA etc
28
“I am ill and without enough support eg PA and if I had this I would be enabled.”
“The people I was relying on to have a better social life are now married and have families of their own care for.”
Health: 29% mentioned poor health or their impairment as the barrier
“Can't drive, poor vision, exhaustion, lack of time”
Cost: 25% said they could not afford to go out
“A lack of time because of being busy with college stuff. Money is another reason I don't go out as often as everything these days is not cheap”
Getting there: 15% mentioned transport issues
“The logistical difficulties of my condition and feeling ill. Being much less able to get around by myself than I was (I can only use my scooter on the Luas; there isn't enough turning space on the bus to get off easily).”
Most respondents cited multiple reasons:
“Disability, chronic pain, health problems, live alone, friends deceased, no-one to go with, feel odd-one-out because of my health and mobility problems, people don’t want to know.”
29
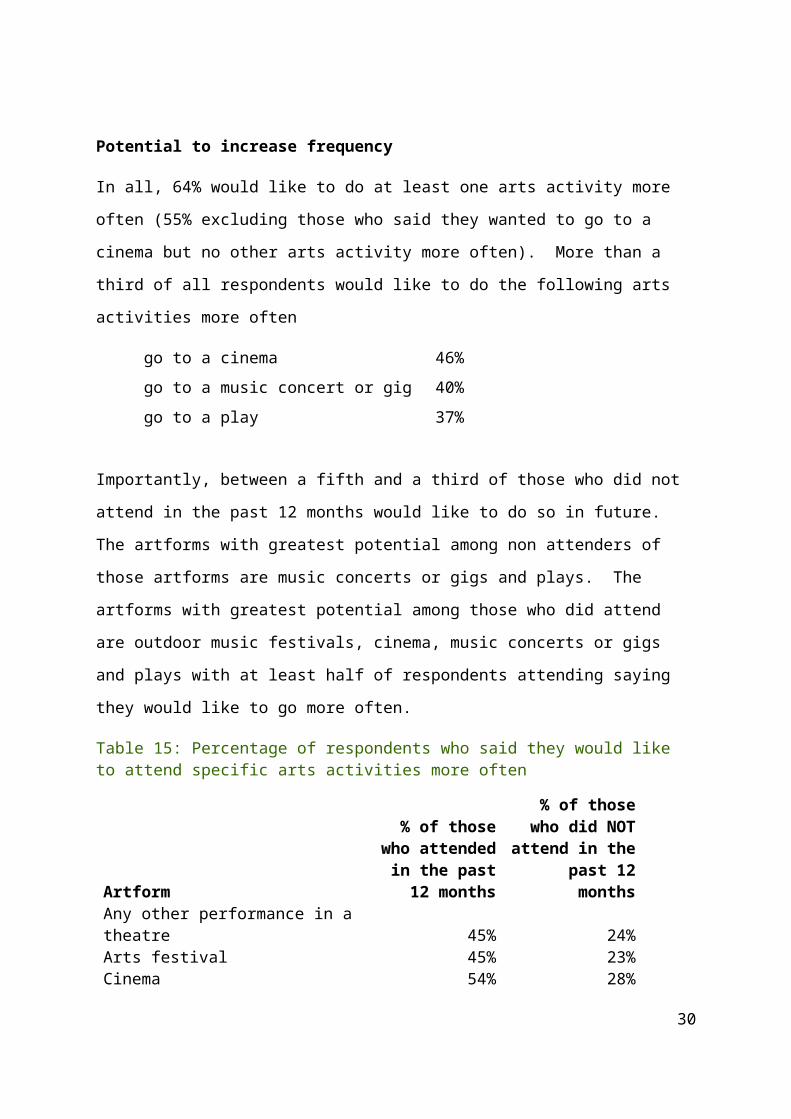
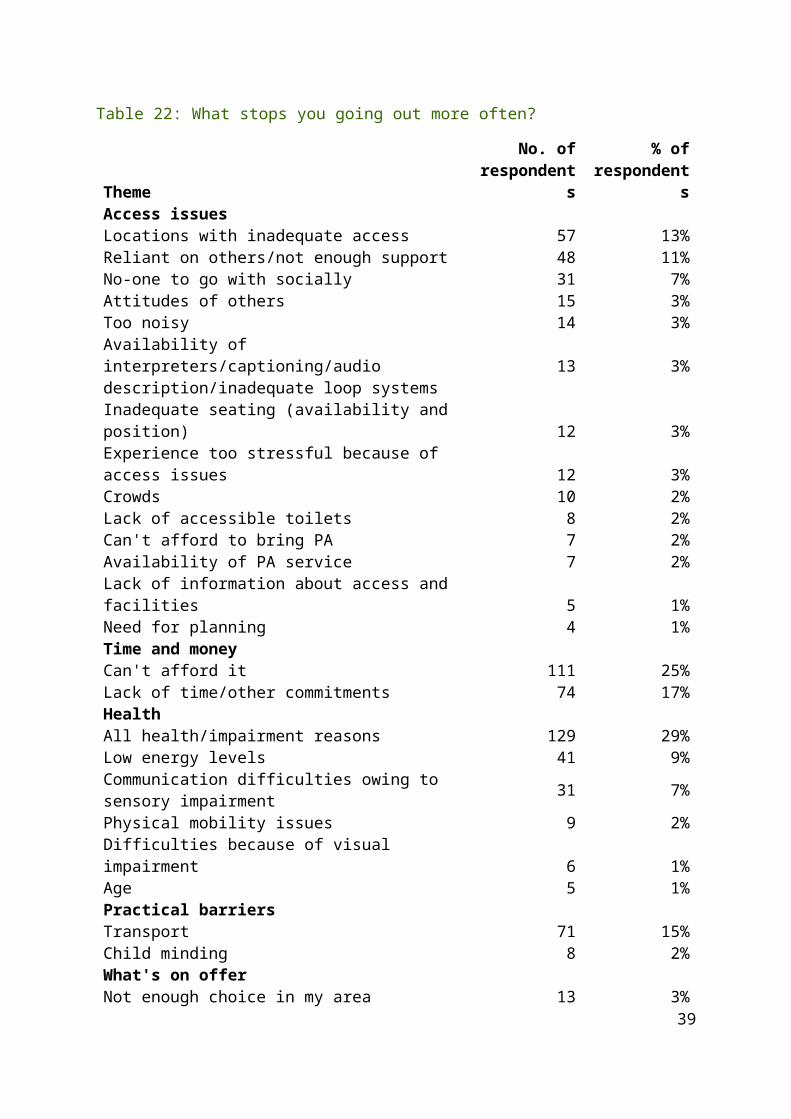
Table 22: What stops you going out more often?
Theme
No. of responden
ts
% of responden
tsAccess issuesLocations with inadequate access 57 13%Reliant on others/not enough support 48 11%No-one to go with socially 31 7%Attitudes of others 15 3%Too noisy 14 3%Availability of interpreters/captioning/audio description/inadequate loop systems 13 3%Inadequate seating (availability and position) 12 3%Experience too stressful because of access issues 12 3%Crowds 10 2%Lack of accessible toilets 8 2%Can't afford to bring PA 7 2%Availability of PA service 7 2%Lack of information about access and facilities 5 1%Need for planning 4 1%Time and moneyCan't afford it 111 25%Lack of time/other commitments 74 17%HealthAll health/impairment reasons 129 29%Low energy levels 41 9%Communication difficulties owing to sensory impairment 31 7%Physical mobility issues 9 2%Difficulties because of visual impairment 6 1%Age 5 1%Practical barriersTransport 71 15%Child minding 8 2%What's on offerNot enough choice in my area 13 3%Scheduling of events 4 1%Lack of information about suitable events 3 1%AttitudesLack of motivation 15 3%Lack of confidence 12 3%Concerns about safety at night 8 2%Prefer to stay at home 6 1%
30

Other 6 1%Total respondents 448
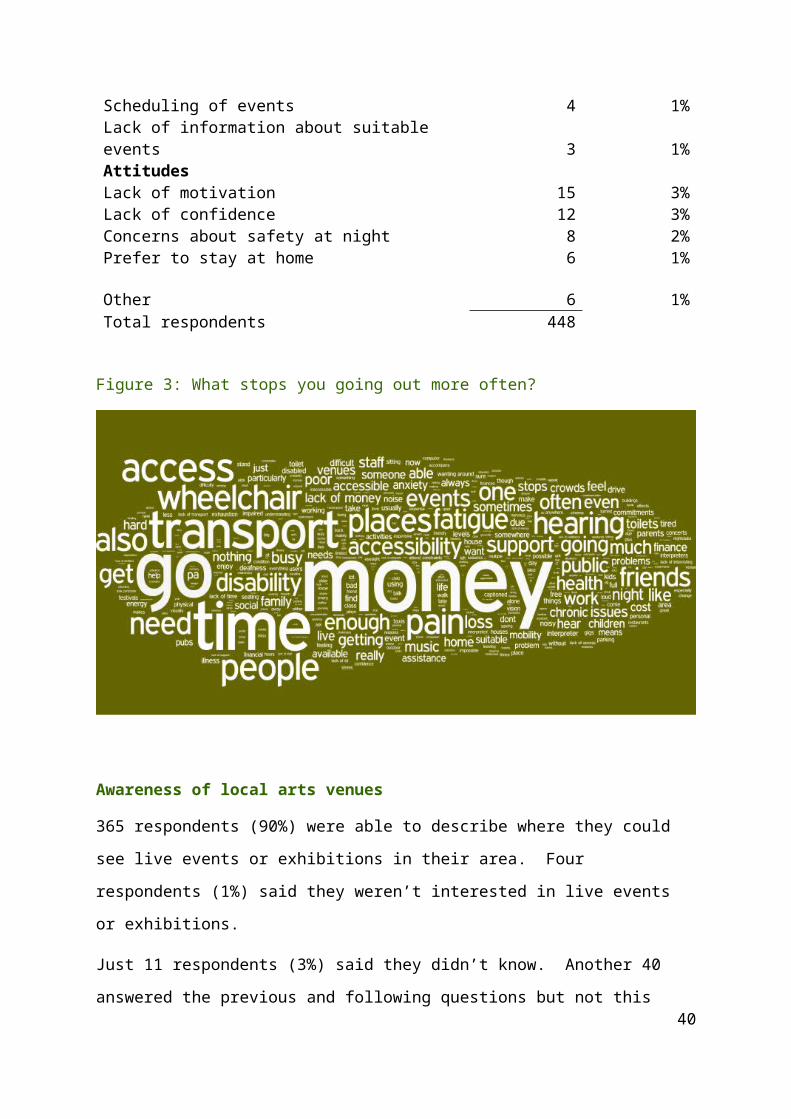
Figure 3: What stops you going out more often?
Awareness of local arts venues
365 respondents (90%) were able to describe where they could see live events or exhibitions in their area. Four respondents (1%) said they weren’t interested in live events or exhibitions.
Just 11 respondents (3%) said they didn’t know. Another 40 answered the previous and following questions but not this one, so it is possible they didn’t know either – this would mean 10% of 405 respondents did not know where they could see live events or exhibitions in their area.
15 respondents (4%) said that there were no venues in their area that were accessible to them. 12 (3%) said that local venues were too far away or too difficult to get to Overall, therefore, 20% were not aware of a local venue that was accessible to them..
69 respondents (17%) specifically mentioned community venues or informal venues such as pubs, hotels or libraries etc.
31
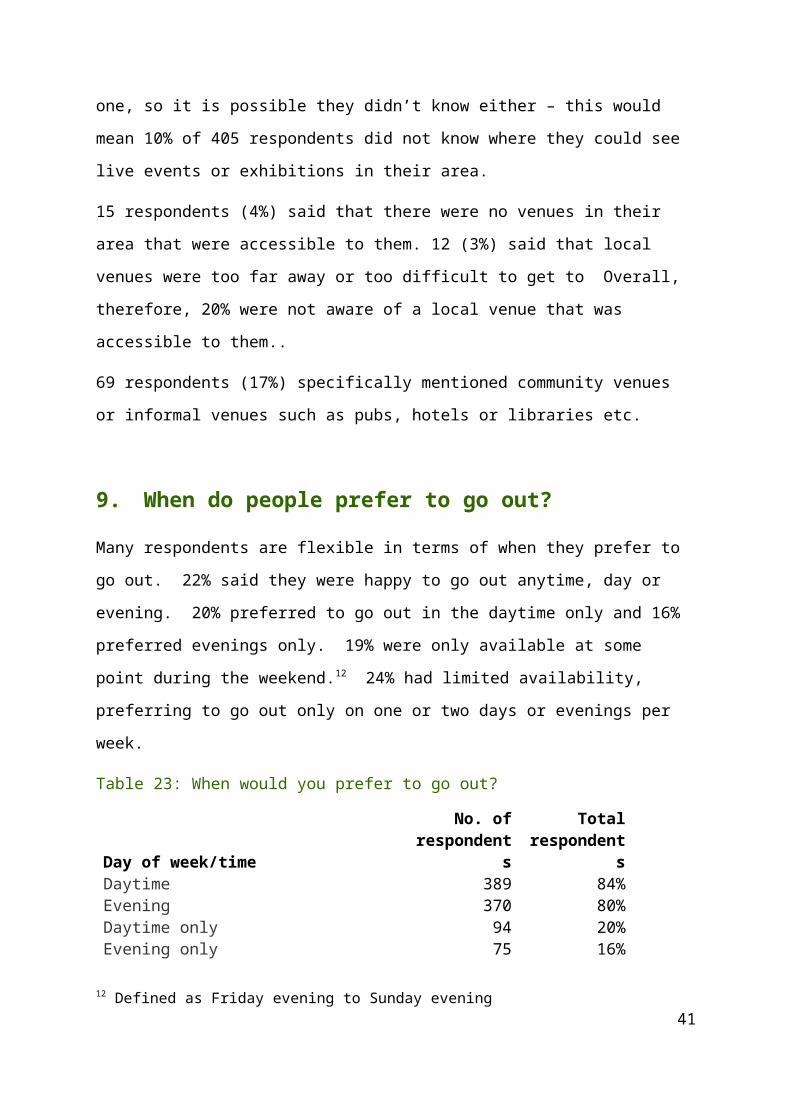
9.When do people prefer to go out?Many respondents are flexible in terms of when they prefer to go out. 22% said they were happy to go out anytime, day or evening. 20% preferred to go out in the daytime only and 16% preferred evenings only. 19% were only available at some point during the weekend.12 24% had limited availability, preferring to go out only on one or two days or evenings per week.
Table 23: When would you prefer to go out?
Day of week/time
No. of responden
ts
Total responden
tsDaytime 389 84%Evening 370 80%Daytime only 94 20%Evening only 75 16%Anytime - evening AND daytime 103 22%Weekends only (incl Fri eve) 90 19%One or two days/evenings per week only 113 24%Total respondents 464No response 59
10. Keeping informedTwo thirds of respondents find out what is happening in their area through personal contacts. This means that people who are socially isolated are likely to remain so as they are not part of these word of mouth networks. Respondents living with parents or guardians are less likely to use any of the information sources listed and in particular less likely to have other people tell them about events (48% compared to 6&% for all respondents).
Facebook is the social media platform used by the majority of respondents (52%) with just 15% saying they find out through Twitter, 6% through
12 Defined as Friday evening to Sunday evening32
Instagram and 4% through Snapchat. The respondents who use Snapchat are from all age bands under 55, although half are aged 19 to 24. Instagram users are from all age bands 25 or over and Twitter users are from all age bands.
It is notable that posters are an important source of information, used by 43% of respondents as usually less than a fifth of respondents to theatre surveys say they heard about a show from a poster.
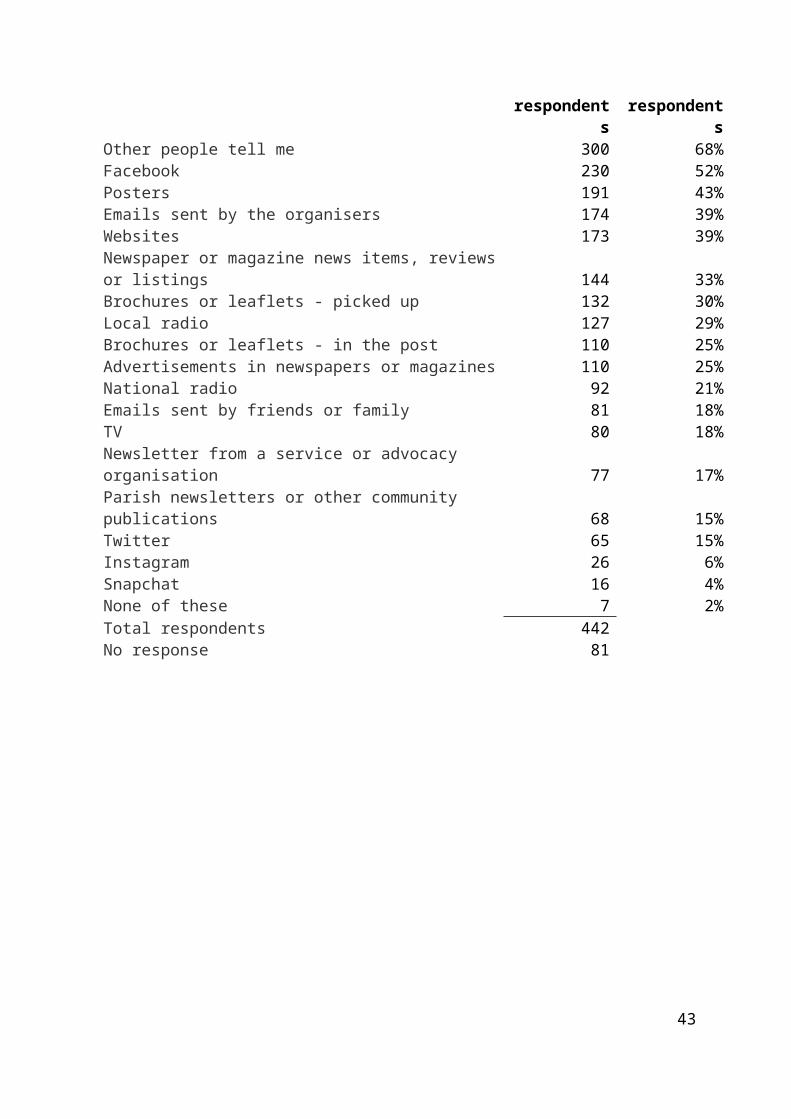
Table 24: How do you usually find out what’s happening in your area?
Information source
No. of responden
ts
% of responden
tsOther people tell me 300 68%Facebook 230 52%Posters 191 43%Emails sent by the organisers 174 39%Websites 173 39%Newspaper or magazine news items, reviews or listings 144 33%Brochures or leaflets - picked up 132 30%Local radio 127 29%Brochures or leaflets - in the post 110 25%Advertisements in newspapers or magazines 110 25%National radio 92 21%Emails sent by friends or family 81 18%TV 80 18%Newsletter from a service or advocacy organisation 77 17%Parish newsletters or other community publications 68 15%Twitter 65 15%Instagram 26 6%Snapchat 16 4%None of these 7 2%Total respondents 442No response 81
33
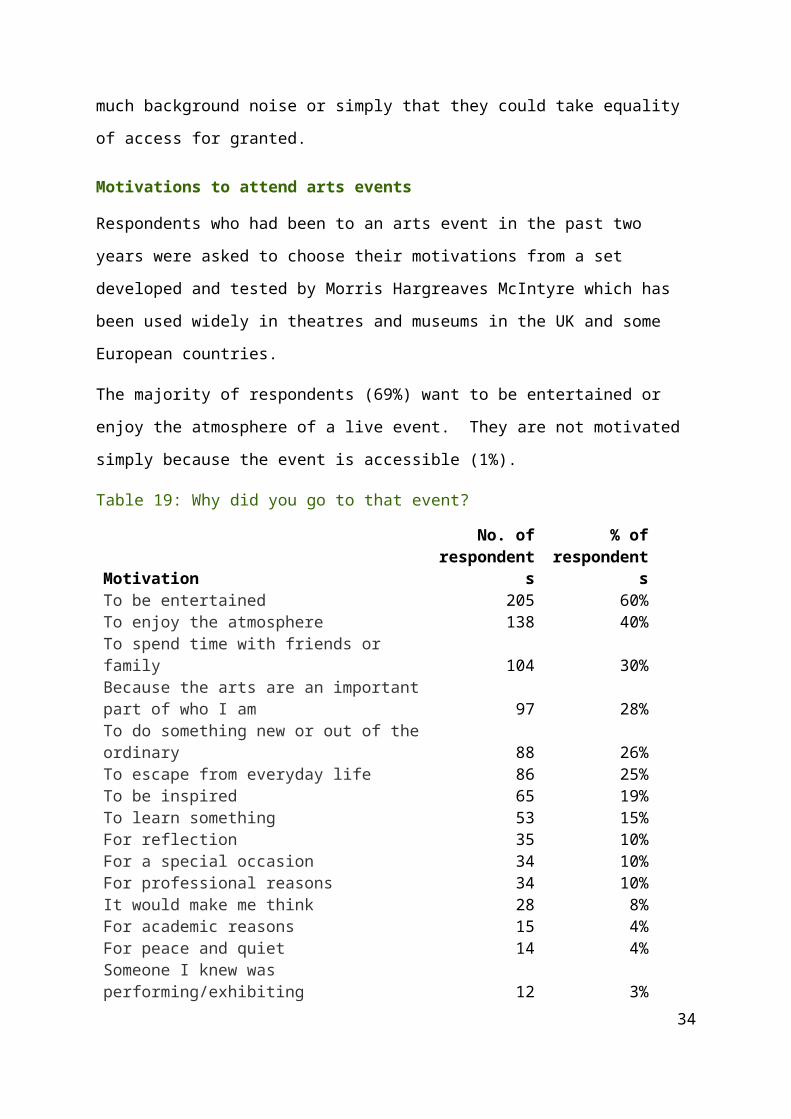
Table 25: How do you usually find out what’s happening in your area? – by type of residency
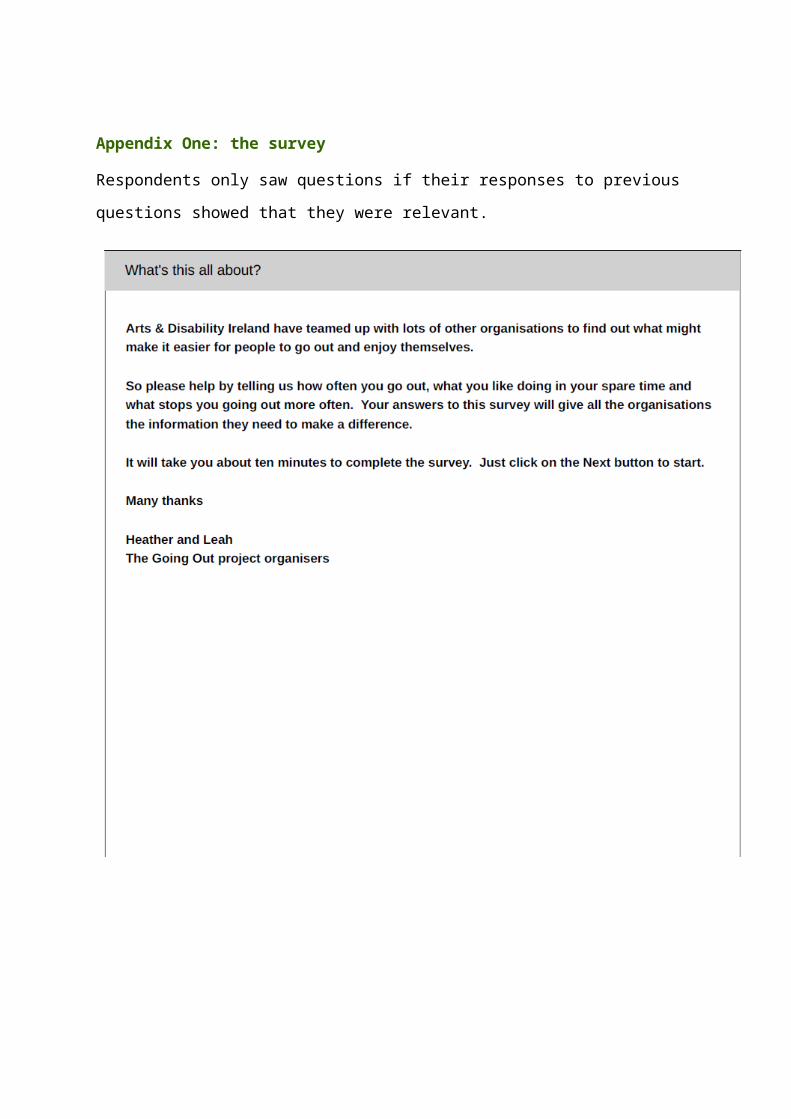
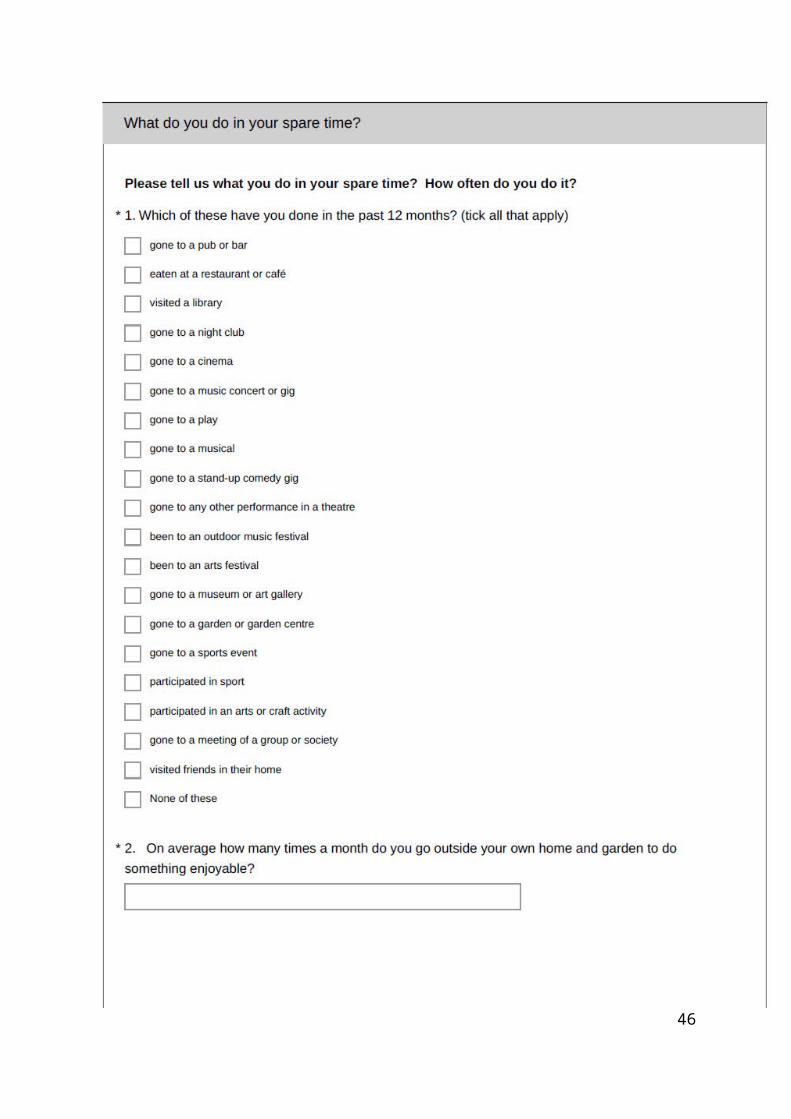
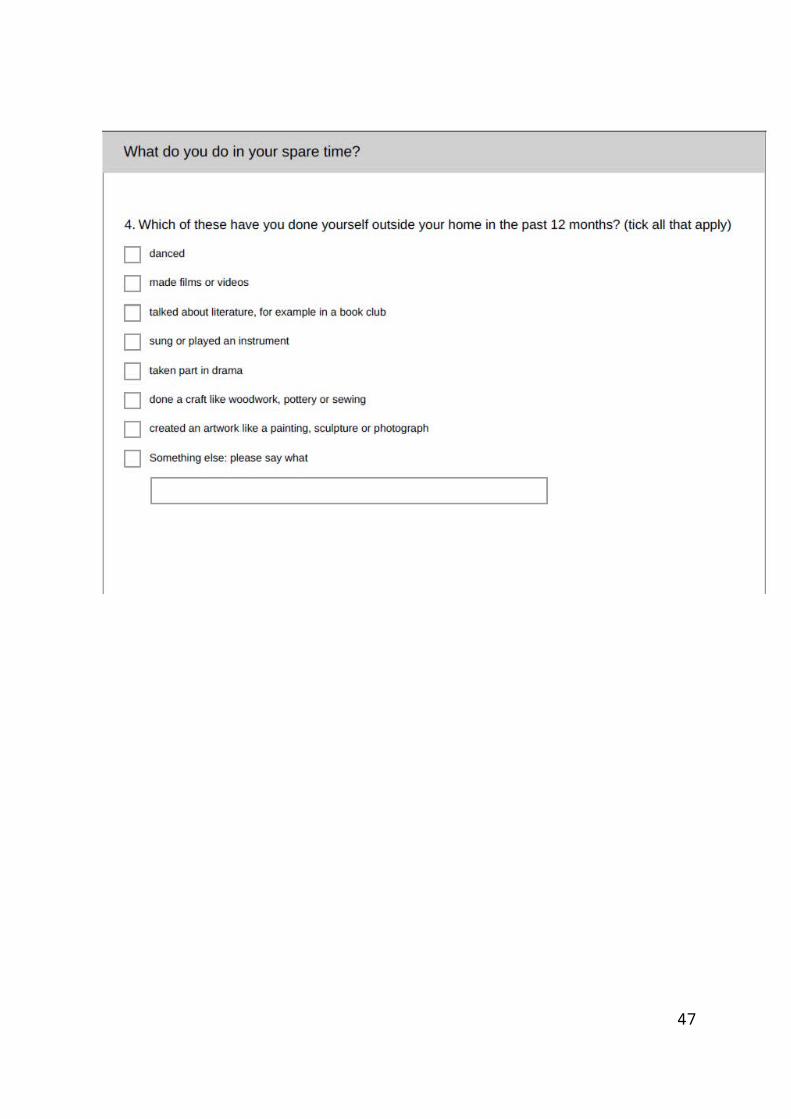
Appendix One: the survey
Respondents only saw questions if their responses to previous questions showed that they were relevant.

36
37
38
39
40
41

42
43
44
45
46
47
48