Embed Size (px)
Citation preview

HOW DO ALIEN PLANTS INVADE: AN ANALYSIS
OF THE HISTORICAL SPREAD AND POTENTIAL
DISTRIBUTION OF THE INVASIVE ALIEN PLANT
CHROMOLAENA ODORATA IN AND AROUND
HLUHLUWE GAME RESERVE
BY OWEN ERIK HOWISON
November 2009

iii
I dedicate this thesis to my parents, wife and children
for their support through the years.

ii
HOW DO ALIEN PLANTS INVADE: AN ANALYSIS OF THE HISTORICAL SPREAD AND POTENTIAL DISTRIBUTION OF THE INVASIVE ALIEN PLANT CHROMOLAENA ODORATA IN AND AROUND HLUHLUWE
GAME RESERVE
BY
OWEN ERIK HOWISON
Submitted in fulfillment of the academic requirements for the degree of Master of Science in the School of Biological & Conservation Sciences, University of KwaZulu-Natal Westville
November 2009
Front cover picture credit: Chromolaena odorata flower, O. Howison

iii
ABSTRACT Alien plant invasions and human-induced land transformations are the two most important factors contributing to loss of biodiversity, and Chromolaena odorata (C. odorata) is one of the world’s worst invader plants. It impacts negatively on biodiversity conservation, forestry and agriculture due to its rapid rate of spread, fast growth and hence an ability to transform habitats. It was introduced into KwaZulu-Natal, South Africa in the mid-1940s, and has spread north and southwards along the coastline and adjacent interior. In 1961 it was observed in Hluhluwe Game Reserve, and has invaded and transformed large parts. In this thesis I use C. odorata distribution maps from 1978 to 2001 to investigate invasion pathways, and whether these are related to species or habitat characteristics. Invasion in the twelve vegetation types identified in the Reserve showed two patterns. In some vegetation types invasion expanded linearly, while in others there were three phases of invasion, driven by interactions between habitat suitability, habitat fragmentation and propagule pressure. Expansion of existing invasions (phalanx or wave invasion) through short distance seed dispersal was the primary mode of spread, rather than the formation of new infestations (guerrilla or diffuse invasion). Known distribution of dense stands was used to develop a spectral signature and run a supervised classification of satellite images. I utilized the dense stands and other GIS data sets of climate, altitude, solar radiation, distance from roads, distance from rivers and normalized differential vegetation index from 1973 and 2001 to determine a probability model, and assess the impact of the invasion on biodiversity conservation. The supervised classification underestimated the extent of the invasion, as C. odorata is a cryptic understory species in some habitats. Supplementation by using multiple regression to develop a probability model, and combining these into one map provided a realistic result. I used this map and GIS data sets of vegetation types and protected areas to assess the impact of the invasion on biodiversity conservation. This showed that C. odorata was preferentially impacting sensitive areas, and the conservation of threatened vegetation types is not guaranteed by including them in protected areas.

iv
PREFACE The experimental work described in this dissertation was carried out within the School of Biological and Conservation Sciences, Westville Campus, University of KwaZulu-Natal, Durban, under the supervision of Professor R. Slotow and co-supervised by Professor H. Olff from the Community and Conservation Ecology Group, Centre for Ecological and Evolutionary Studies, Rijksuniversiteit Groningen, Haren, the Netherlands, and these supervisors are acknowledged for their guidance as co-authors of Chapters 2 and 3. These studies represent original work done by the author and have not otherwise been submitted in any form for any degree or diploma to any other tertiary institution. Where use has been made of the work of others it has been duly acknowledged in the text.
FACULTY OF SCIENCE AND AGRICULTURE
DECLARATION 1 - PLAGIARISM
I, Owen Howison, declare that
1. The research reported in this thesis, except where otherwise indicated, is my original research.
2. This thesis has not been submitted for any degree or examination at any other
university. 3. This thesis does not contain other persons’ data, pictures, graphs or other
information, unless specifically acknowledged as being sourced from other persons. 4. This thesis does not contain other persons' writing, unless specifically acknowledged
as being sourced from other researchers. Where other written sources have been quoted, then: a. Their words have been re-written but the general information attributed to them
has been referenced b. Where their exact words have been used, then their writing has been placed in
italics and inside quotation marks, and referenced. 5. This thesis does not contain text, graphics or tables copied and pasted from the
Internet, unless specifically acknowledged, and the source being detailed in the thesis and in the References sections.
Signed……………………………………… Date: …………………… Declaration Plagiarism 22/05/08 FHDR Approved

v
FACULTY OF SCIENCE AND AGRICULTURE
DECLARATION 2 - PUBLICATIONS
DETAILS OF CONTRIBUTION TO PUBLICATIONS that form part and/or include research presented in this thesis (include publications in preparation, submitted, in press and published and give details of the contributions of each author to the experimental work and writing of each publication) Publication 1: Howison, O., Slotow, R. and Olff, H. (submitted) Lessons from the invasion of a
diverse African savanna reserve by the alien plant Chromolaena odorata: The interaction of habitat suitability and dispersal.
The work was undertaken by the first author, under guidance and with reviews by the second and
third authors. The third author assisted with some statistical analyses. It has been submitted to Biological Invasions.
Publication 2: Howison, O., Slotow, R. and Olff, H. (to be submitted) Using remote sensing and
GIS to map invasive alien plants and assess impacts on biodiversity: a study on Chromolaena odorata in KwaZulu-Natal, South Africa.
The work was undertaken by the first author, under guidance and with reviews by the second and
third authors. The third author assisted with some statistical analyses. Signed……………………………………… Date: …………………… Declaration Publications FHDR 22/05/08 Approved

vi
ACKNOWLEDGEMENTS Firstly, I would like to thank my wife, Ruth, for her constant support for this work. Without you, it would never have been finished. I would also like to thank my supervisors: Professors Olff and Slotow, for their assistance and guidance for the duration of the project. To Ezemvelo KZN Wildlife, my previous employer, thank you for giving me access to data as required and for field visits to Hluhluwe Game Reserve to collect additional data. To my current employer, the KwaZulu-Natal Department of Agriculture and Environmental Affairs, I thank you for contributing towards the cost of my studies through a study bursary and the opportunity to present this work at three international conferences, namely the 9th Conference on the Ecology and Management of Alien Plants in Perth, Australia, 2007, the Map Africa 2008 conference in Cape Town in 2008 and the 10th Conference on Ecology and Management of Alien Plants in Stellenbosch, South Africa, 2009. I also thank Professor Olff for financial assistance through the Netherlands Organisation for Scientific Research’s PIONIER grant, which was used to fund visits to Groningen in the Netherlands for consultation.
vii
TABLE OF CONTENTS
ABSTRACT....................................................................................................................... iii PREFACE.......................................................................................................................... iv FACULTY OF SCIENCE AND AGRICULTURE DECLARATION 1 - PLAGIARISM ................................................................................ iv FACULTY OF SCIENCE AND AGRICULTURE DECLARATION 2 - PUBLICATIONS............................................................................. v ACKNOWLEDGEMENTS............................................................................................... vi CHAPTER 1: INTRODUCTION ................................................................................. 1
Species Description and Ecology.................................................................................... 4 Study site......................................................................................................................... 5 Overall aims and objectives ............................................................................................ 6
REFERENCES ................................................................................................................... 6 CHAPTER 2: LESSONS FROM THE INVASION OF A DIVERSE AFRICAN SAVANNA RESERVE BY THE ALIEN PLANT CHROMOLAENA ODORATA: THE INTERACTION OF HABITAT SUITABILITY AND DISPERSAL............................. 12
ABSTRACT.................................................................................................................. 12 KEYWORDS................................................................................................................ 12 INTRODUCTION ........................................................................................................ 13 METHODS ................................................................................................................... 14
Study site................................................................................................................... 14 Species description and impacts ............................................................................... 15 Regional invasion dynamics ..................................................................................... 16 Mapping the invasion................................................................................................ 16 Vegetation types........................................................................................................ 17 Data analysis ............................................................................................................. 17
RESULTS ..................................................................................................................... 19 Patch cohesion index................................................................................................. 19 Spatial invasion dynamics......................................................................................... 20 Continuous versus stepwise invasion dynamics ....................................................... 23
DISCUSSION............................................................................................................... 27 REFERENCES ............................................................................................................. 30
CHAPTER 3: USING REMOTE SENSING, LOGISTIC REGRESSION AND GEOGRAPHIC INFORMATION SYSTEMS TO MAP INVASIVE ALIEN PLANTS AND ASSESS IMPACTS ON BIODIVERSITY CONSERVATION: A STUDY ON CHROMOLAENA ODORATA IN KWAZULU-NATAL, SOUTH AFRICA.................. 37
ABSTRACT.................................................................................................................. 37 KEYWORDS................................................................................................................ 37 INTRODUCTION ........................................................................................................ 38 METHODS ................................................................................................................... 39
Supervised classification........................................................................................... 40 Multiple regression modeling ................................................................................... 42 Accuracy Assessment (ground-truthing) .................................................................. 45 Extent of Invasion on Vegetation Types................................................................... 47 Impact on Biodiversity Conservation ....................................................................... 47

viii
RESULTS ..................................................................................................................... 48 Supervised classification........................................................................................... 48 Multiple regression modeling ................................................................................... 48 Accuracy Assessment ............................................................................................... 50 Potential impact on Biodiversity............................................................................... 54
DISCUSSION............................................................................................................... 59 REFERENCES ............................................................................................................. 61 Appendix 3.1: Error matrices and Accuracy Assessments for the supervised classification, probability mapping and combination maps.......................................... 66
3.1.1 Error matrix and Accuracy Assessment for the Supervised Classification ..... 66 3.1.2 Error matrix and Accuracy Assessment for Probability > 0.5......................... 66 3.1.3 Error matrix and Accuracy Assessment for Probability > 0.6......................... 67 3.1.4 Error matrix and Accuracy Assessment for Probability > 0.7......................... 67 3.1.5 Error matrix and Accuracy Assessment for Probability > 0.8......................... 68 3.1.6 Error matrix and Accuracy Assessment for Probability > 0.9......................... 68 3.1.7 Error matrix and Accuracy Assessment for Probability > 0.6 combined with supervised classification ........................................................................................... 69 3.1.8 Error matrix and Accuracy Assessment for Probability > 0.8 combined with supervised classification ........................................................................................... 69 3.1.9 Error matrix and Accuracy Assessment for Probability > 0.9 combined with supervised classification ........................................................................................... 70
CHAPTER 4: GENERAL DISCUSSION........................................................................ 71 REFERENCES ............................................................................................................. 74

1
CHAPTER 1: INTRODUCTION
O. Howison The publication of the book “The ecology of invasions by plants and animals” by Charles S. Elton in 1958 started the systematic study of biological invasions (Richardson & Pyšek 2008), and invasion ecology is now a recognized branch of ecology (Davis et al. 2001). Research into biological invasions received further stimulation with the inception of the SCOPE program in the 1980s (Mooney & Drake 1989). This program identified three directions for research, namely which species invade, which habitats are invaded and what are the best management practices (Mooney & Drake 1989; Richardson & Pyšek 2006). Many studies have been undertaken to identify or predict which alien plants may become invasive. Pyšek (1998) categorized alien flora from 26 regions according to higher taxonomic classes and found that the most represented families in the world alien floras are Poaceae, Asteraceae, Fabaceae and Cruciferae. The first two were the only families represented among the alien floras in all 26 regions (Pyšek 1998). Species traits are also important determinants of invasion success. Bryson and Carter (2004) list 31 biological and ecological characteristics that promote invasiveness, although only a few of these may play a role in any particular invasion (Rejmanek & Richardson 1996). Characteristics common to successful colonists across taxa include r-selected life histories (use of pioneer habit, short generation time, high fecundity and high growth rates), the ability to shift between r- and K- selected strategies (Sakai et al. 2001), the ability to undertake and withstand long-distance dispersal (Richardson & Pyšek 2006), phenotypic plasticity (Richardson & Pyšek 2006; Zou et al. 2009), and a wide geographic latitude (Williamson & Fitter 1996). It has been difficult to predict which species become invasive based on these traits, as many alien plant species with these traits do not become invasive (Noble 1989). There is also often a time lag between the introduction of a species to a new area and when it starts spreading exponentially, which can exceed one hundred years (Caley et al. 2008; Mack et al. 2000; Pyšek et al. 2005). Some of the reasons for this time lag include the size of the introduced population, dynamics of reproduction, the need to acclimatize/adapt to the new environment, and the need to develop mutualistic relationships, for example pollination and seed dispersal (Bryson & Carter 2004; Richardson et al. 2000). Habitat characteristics can also determine the degree of susceptibility to invasion, although finding traits associated with invasiveness have been difficult (Alpert et al. 2000; Lonsdale 1999). One reason for this is that, to determine habitat susceptibility, the total number of exotic species introduced needs to be known, but this is rarely the case, as species may be introduced but fail to establish (Lonsdale 1999). Elton (1958) proposed that more diverse habitats should be resistant to invasion, as all niches in diverse habitats would be occupied and all resources monopolized, however subsequent studies have both supported and refuted this theory (Stohlgren et al. 2006). At small scales (plots from 0.01m2 to 1000m2) species rich communities are driven by competitive interactions and are less susceptible to invasion than species poor communities, which are predominantly driven by immigration processes (Brown & Peet 2003; Kennedy et al. 2002). With larger scale studies (landscape scale) environmental heterogeneity increases, thereby providing more niches for both indigenous and exotic species (Davies et al. 2005; Deutschewitz et al. 2003), and this is likely to positively influence the establishment and growth of alien species where propagules are available (Stohlgren et al. 2006). As a result, there is a positive relationship

2
between increasing spatial scale and both indigenous and alien species richness (Chabrerie et al. 2008; Stohlgren et al. 1999), but this relationship may also be complicated by the level of landscape and habitat fragmentation, which is another factor that can either facilitate (Le Maitre et al. 2004) or preclude (Brothers & Spingarn 1992; Janzen 1983; Lonsdale 1993) invasion. Apart from species and habitat traits there are a number of other factors that influence invasiveness. One of the most robust generalizations is that the probability of invasion increases with the time since introduction (Mullerova et al. 2005; Pyšek & Jarosik 2005; Richardson & Pyšek 2006; Wilson et al. 2007). Increased residence time improves the probability of naturalization, overcoming lag phases (Wilson et al. 2007), development of mutualistic relations (Richardson et al. 2000), increase the size of the propagule bank, thereby increasing the probability of dispersal and establishment of new populations (Richardson & Pyšek 2006) and increased impacts on the communities or habitats being invaded (Collier et al. 2002). Increased residence time also allows exotic species to make use of stochastic factors such as disturbance regimes (for example excavations, flooding and fire) and rainfall variability to trigger invasion (Davis et al. 2000; Liu et al. 2005; Pauchard et al. 2004; Richardson et al. 2007; Richardson et al. 2006), although these are not always required (Larson et al. 2001). Understanding the causes and mechanisms of a specific alien plant invasion hold the key to successfully managing the invasion (Sheley & Krueger-Mangold 2003). The most effective way to prevent alien plant invasions would be to prevent their introduction (Hobbs & Humphries 1995; Le Maitre et al. 2004), however this is difficult to achieve as it is not easy to predict which plants are most likely to become invasive (Radosevich et al. 2003). The next best option for controlling invasive alien plants is complete eradication, however this has rarely been achieved (Mack et al. 2000; Simberloff 2003), leaving density reduction to an acceptable level as the only available management option (Mack et al. 2000; Simberloff 2003). Chemical (herbicide), mechanical and biological control or combinations of these are the most widely used methods for controlling alien plants (Hobbs & Humphries 1995; Mack et al. 2000; Simberloff 2003), however, due to high cost and impacts of these methods on ecosystems (Hobbs & Humphries 1995), holistic ecosystem management has been proposed as the most effective form of management to reduce or eliminate some invasive species (Hobbs & Humphries 1995; Huston 2004; Sheley & Krueger-Mangold 2003). To implement this, the changes in ecosystem structure or process that allow the initiation or intensification of weed invasion have to be addressed before effective weed control can be achieved (Hobbs & Humphries 1995). If ecosystem structure and function have been altered sufficiently by invading species, controlling the invader will not necessarily restore the ecosystem to its pre-invasion state and there may be a need for active restoration (Hobbs & Humphries 1995). Investigations into the mechanisms of invasion by alien plants and the ecological impacts on habitats and ecosystems are required to identify the most effective control programme. Such investigations have used two fundamental approaches: manipulative experiments and natural experiments (Richardson et al. 2004). There is a growing trend to study plant invasions at larger spatial and temporal scales, where manipulative experiments are not feasible, leaving natural experiments as the preferred option to find generalities in invasion ecology (Brundu 2005). To investigate invasions at these larger spatial and temporal scales using natural experiments, methodologies using spatial tools such as Geographic Information Systems (GIS), remote sensing, mathematical modeling and associated decision support systems and databases are increasingly accepted (Dark 2004; Higgins et al. 1999; Joshi 2006; Thuiller et al. 2005). Since the 1970s there has been considerable development of remote sensing, GIS and modeling tools to map invasive alien plant distribution (Joshi 2006). Initially, remote sensing was used to map the

3
distribution of invasive alien species that were dominant in the upper canopy as these are easily detected (Joshi 2006). However, many of the most invasive alien plants are not dominant in the uppermost canopy, and mapping these species was not possible using supervised classification of remotely sensed images (Joshi 2006). This led to the development of a wide range of methods using GIS and modeling tools to map potential and actual invasive alien plant invasions, and these tools are useful in determining patterns of invasion as well as environmental and/or habitat factors allowing or hindering invasion (Dark 2004; Higgins et al. 1999). These models can be expanded to a wider spatial scale, to determine where the plant has the potential to invade (Dark 2004; Higgins et al. 1999). GIS and statistical tools are also available to determine the level of accuracy of distribution maps derived in this way (Congalton 1991). Research that has been undertaken using these methodologies include assessing distributions, (spatial and temporal), data transfer, sharing and comparison, landscape-scale studies, spatial, retrospective and geostatistical analyses, and early detection (Brundu 2005). This has become possible through reduced costs, increasing level of skills in the scientific community, public administration and stakeholders, and the need to exchange data (Brundu 2005; Richardson & Pyšek 2008). Natural experiments can be used to determine the variables that cause an alien plant to become invasive (Higgins et al. 1999), and these variables may be related to the environment being invaded and characteristics of the invading plant (Higgins & Richardson 1996). Environmental variables may include climatic suitability (Kriticos et al. 2005) and resource availability, for example nutrient, moisture and space availability (Higgins & Richardson 1996). Species variables, for example short juvenile period, short interval between large seed crops and small seed size, have been documented to facilitate invasion (Rejmanek & Richardson 1996). Given a certain environment and the introduction of an invasive alien species, the invasion can occur spatially in one of two ways. Doust (1981) defined the terms phalanx and guerilla invasion to describe two forms of clonal growth used by vegetative spreading plants to invade or colonise new areas. Phalanx invasion occurs when internode intervals are short, there is high intraspecific contact between ramets and the plant spreads relatively slowly along a continuous front, while guerilla invasion occurs when internode intervals are long, there is little contact between ramets and high interspecific contact (Doust 1981; Schmid & Harper 1985). This is made possible through plasticity of the invading plant (Barney et al. 2005; Pyšek et al. 2003), and allows the invader to spread through patches of unfavourable habitat relatively quickly, and then colonise patches of more suitable habitat once these are reached (Ye 2006). The terms have also been used to describe invasion by seed producing plants, with phalanx invasion occurring when most seeds fall below or within a short distance of the parent plant and the invasion spreads along a continuous front (Lonsdale 1993), while guerilla invasion occurs through the establishment of new individuals away from existing infestations through long distance dispersal of propagules (Cannas et al. 2003). Guerilla invasion may be a tactic to pass through habitats that are unsuitable or marginal for invasion (Amsbery et al. 2000; Doust 1981), or it may be a tactic to initiate new invasion foci for further phalanx invasion (Moody & Mack 1988). After the extent or potential extent of an invasion has been established, GIS is a useful tool to assess the impacts of invasion. Documented impacts include major land transformations and subsequent loss of species diversity (Mack et al. 2000), changes in species structure and composition within communities (Collier et al. 2002; Vitousek et al. 1997), habitat simplification, with a loss of biodiversity among plants, animals and birds (Pimental et al. 2001; Stohlgren 2002), changes in fire regimes (MacDonald 1983; Van Wilgen & Richardson 1985), and changes in the hydrology of ecosystems (Le Maitre et al. 1996). Alien plant invasions also

4
have indirect consequences, through loss of productivity of ecosystems and the cost of managing invasions (Le Maitre et al. 1996; Mack et al. 2000; Pimental et al. 2001). These potential impacts are important when planning biodiversity conservation strategies as management strategies need to be planned in accordance with the severity of the invasion and the impact on biodiversity conservation goals (Frazee et al. 2003; Richardson et al. 1996). In this thesis we use GIS, remote sensing tools and logistic regression to study an example of invasion by an invasive alien plant, and discuss the invasion in terms of current alien plant invasion ecological theory.
Species Description and Ecology
Chromolaena odorata (L.) R.M King & H. Robinson (=Eupatorium odoratum L, Asteraceae) (C. odorata) occurs naturally from Central America to the southern part of North America and the Caribbean islands (McFadyen & Skarrat 1996; Von Senger et al. 2002). World-wide, it is one of the worst invader plants (Anon 2004) and its invasion throughout many tropical and sub-tropical countries has been well documented (Azmi 2000; Bamba 2000; De Rouw 1991; Kriticos et al. 2005; McFadyen 2000; McFadyen & Skarrat 1996; Orapa et al. 2000; Von Senger et al. 2002; Waterhouse & Zeimer 2002; Zacharides & Goodall 2000). In South Africa it was introduced through Durban harbour in the 1940s, and since spread north and southwards along the coastline (Goodall & Erasmus 1996). The form found in KwaZulu-Natal is different from the forms invasive elsewhere in the world, and appears to be most similar to a form found in Jamaica (Von Senger et al. 2002).
Chromolaena. odorata has a considerable morphological variation over its wide natural range (Von Senger et al. 2002). In accordance with characteristics of successful alien plant invaders, C. odorata exhibits a short juvenile period, a short interval between large seed crops and small seed size (Rejmanek & Richardson 1996; Witkowski & Wilson 2001), and is able to produce seed apomictically, allowing invasion to be initiated by a single plant (Luwum 2002; Rambuda & Johnson 2004). In some parts of the world, for example Laos, it is used as a fallow crop in slash and burn agricultural systems (Roder et al. 1995), but in most places where it has invaded it shows most, if not all, of the previously mentioned negative effects of invasive alien plants. In our study area, C. odorata invades a number of different vegetation types (Goodall & Erasmus 1996), and its growth form varies depending on exposure to sunlight (Figure 1.1). In forest margins and gaps, where sunlight is lower and less intense, it grows as a creeper on adjacent trees and shrubs, leaves are larger and leaf nodes are further apart (Figure 1.1 (A) and (C)), while in full sunlight it grows as a multi-stemmed shrub up to 1.5 meters high, which is high enough to form a dominant canopy in grass dominated vegetation types (Figure 1.1 (B) and (D)). Similar plasticity has also been found by Barney et al. (2005), when studying Artemisia vulgaris.
The standard method for C. odorata seed dispersal is by wind, for which it is morphologically adapted (Erasmus 1985; MacDonald & Frame 1988). Blackmore (1998) reports that most C. odorata wind dispersed seeds falls within 80 m of the parent plant, indicating that the main invasion mode should be through phalanx invasion. However, work by Higgins et al. (2003) argue that long-distance dispersal by non-standard means (i.e. dispersal methods for which the seed or propagule is not morphologically adapted) cannot be discounted. In the case of C.

5
odorata, numerous non-standard means of dispersal, such as ectozoochory (Gautier 1992; McFadyen 2000; Witkowski 2001), hydrochory (Orapa et al. 2000) and vehicles (Blackmore 1998; McFadyen 2000; Orapa et al. 2000), have been documented and thus the potential of guerilla invasion cannot be discounted.
Figure 1.1: Comparison of stems, leaves and growth forms from invasions in different vegetation types: (A) Stem from a forest margin, showing long internodes and dark green leaves; (B) Stem growing in full sun, showing lighter green leaves and shorter internodes; (C) Creeper growth form with cryptic canopy as seen in forest margins and gaps; (D) Multi-stemmed shrub 1.5 m tall with dominant canopy in grass dominated vegetation types (Photographs: O. Howison)
Study site The study site is the Hluhluwe Game Reserve which is situated in the eastern seaboard of KwaZulu-Natal, South Africa (280 06’ 08”S and 320 04’ 04”E), and is the northern 260 km2 of the larger 900 km2 Hluhluwe-iMofolzi Park (Figure 2.1), internationally renowned for its conservation of black (Diceros bicornis minor) and white rhino (Ceratotherium simum) and, more recently, African wild dogs (Lycaon pictus) and other large mammals, birds and reptiles (Conway et al. 2001). We chose this study site because occupation and spread by C. odorata in Hluhluwe Game Reserve has been well documented through mapping exercises that were carried out at regular intervals (Howison 1998, 2001), which allows the use of Geographic Information Systems (GIS) to study the progress of the invasion and interactions with vegetation types. These distribution data were then used in the second part of our study to map the distribution of C. odorata both inside and outside Hluhluwe Game Reserve. We used the distribution data from the reserve to develop a spectral signature for C. odorata and mapped its distribution using a supervised classification of a LandSat image. We also used the distribution in Hluhluwe Game Reserve and other factors that may inhibit or facilitate invasion to develop a distribution model using multiple logistic regression, and then applying this model to surrounding areas, as covered by LandSat 7 Path 167 Row 80 (Figure 3.1). This extended study site is also important due to the presence of the Greater St. Lucia Wetland Park, an international RAMSAR site (Anon 2009). In addition to the proclaimed reserves, the study site is important for ecotourism and thriving

6
forestry and farming enterprises. The high demand for land has placed a high conservation value on untransformed land (Anon 2007).
Overall aims and objectives This study has two main chapters, both written as papers for publication. The aim of Chapter 2 was to use historical maps of C. odorata distribution and GIS data sets of vegetation types and precipitation, to determine whether invasion is driven primarily by species traits, environmental factors (for example habitat suitability, rainfall) or a combination of both. We also investigate whether the primary mode of dispersal was through phalanx (wave), or guerilla (diffuse) invasion. This work was presented by the first author at the 8th Conference of the Ecology and Management of Alien Plants (EMAPI9) in Perth, Australia, 17 – 21 September 2007, and has been submitted to Biological Invasions for publication. In Chapter 3 we investigated the potential of using supervised classification of a remotely sensed image and multiple logistic regression to map the distribution of C. odorata and tested the accuracy of the supervised classification and logistic regression map by calculating a kappa statistic, error matrices and accuracy assessments using distribution data collected from independent sampling points throughout the study area (Congalton 1991; Monserud & Leemans 1992) We then overlaid the distribution obtained through remote sensing on the distribution determined through statistical modeling to present one combined distribution map with two classes: C. odorata present or C. odorata not present, and tested the accuracy of this map against the distribution from the independently sampled points. Once the extent of C. odorata infestations was established, we used existing data sets identifying priority areas for conservation (Anon 2007), and vegetation types from Mucina et al (2006) to assess whether areas important for biodiversity conservation were being invaded. This enabled a discussion on whether conservation areas are providing adequate protection, whether invasion is equal across all vegetation types or whether some vegetation types are preferentially invaded. This work was presented by the first author at the 10th Conference of the Ecology and Management of Alien Plants (EMAPI10) in Stellenbosch, South Africa, 23 – 29 August 2009. In the final chapter we discuss the implications and broader relevance of the results in terms of current understanding of alien plant invasions, managing these invasions and opportunities for future research. The contribution of the first author to the chapters is detailed in the declaration on page iii. REFERENCES Alpert, P., E. Bone, and C. Holzapfel. 2000. Invasiveness invasibility and the role of
environmental stress in the spread of non-native plants. Perspectives in Plant Ecology, Evolution and Systematics 3:52 - 66.
Amsbery, L., M. A. Baker, P. J. Ewanchuk, and M. D. Bertness. 2000. Clonal integration and the expansion of Phragmites australis. Ecological Applications 10:1110 - 1118.
Anon. 2004. Global Invasive Species Database. Unpublished website, Auckland, New Zealand. Accessed 27 January 2004.
Anon. 2007. Ezemvelo KZN Wildlife Strategic Environmental Assessment. Unpublished report, Ezemvelo KZN Wildlife, Pietermaritzburg.

7
Anon. 2009. Ramsar sites in order of addition to the Ramsar List of Wetlands of International Importance in T. R. C. Secretariat, editor, Gland, Switzerland.
Azmi, M. 2000. Status and biological control of Chromolaena odorata in Malaysia. Pages 27 - 28 in C. Zacharides, R. Muniappen, and L. W. Strathie, editors. Fifth international workshop on biological control and management of Chromolaena odorata. ARC - Plant Protection Research Institute, Pretoria, South Africa.
Bamba, J. 2000. Chromolaena in Micronesia. Page 26 in C. Zacharides, R. Muniappen, and L. W. Strathie, editors. Fifth international workshop on biological control and management of Chromolaena odorata. ARC - Plant Protection Research Institute, Pretoria, South Africa.
Barney, J. N., A. D. Tommaso, and L. A. Weston. 2005. Differences in invasibility of two contrasting habitats and invasiveness of two mugwort Artemisia vulgaris populations. Journal of Applied Ecology 42:567 - 576.
Blackmore, A. C. 1998. Seed dispersal of Chromolaena odorata reconsidered in R. Muniappen, editor. Fourth international workshop on biological control and management of C. odorata, Bangalore, India.
Brothers, T. S., and A. Spingarn. 1992. Forest fragmentation and alien plant invasion of central Indiana old-growth forests. Conservation Biology 6:91 - 100.
Brown, R. L., and R. K. Peet. 2003. Diversity and invasibility of Southern Appalachian plant communities. Ecology 84:32 - 39.
Brundu, G. 2005. A review on geomatic tools for assessing, inventorying and mapping alien plant invasions in the Mediterranean basin in S. Brunel, editor. Invasive plants in the Mediterranean type regions of the world. Council of Europe Publishing.
Bryson, C. T., and R. Carter. 2004. Biology of Pathways for Invasive Weeds. Weed Technology 18:1216 - 1220.
Cannas, S. A., D. E. Marco, and S. A. Paez. 2003. Modelling biological invasions: species traits, species interactions and habitat heterogeneity. Mathematical Biosciences 183:93 - 110.
Chabrerie, O., K. Verheyen, R. Saguez, and G. Decocq. 2008. Disentangling relationships between habitat conditions, disturbance history , plant diversity, and American black cherry (Prunus serotina Ehrh.) invasion in a European temperate forest. Diversity and Distributions 14:204 - 212.
Collier, M. H., J. L. Vankat, and M. R. Hughes. 2002. Diminished plant richness and abundance below Lonicera maackii, an Invasive Shrub. The American Midland Naturalist 147:60 - 71.
Congalton, R. G. 1991. A review of assessing the accuracy of classifications of remotely sensed data. Remote Sensing of Environment 37:35 - 46.
Conway, A. J., P. Hartley, N. Galli, D. A. Balfour, and R. A. Howison 2001. Hluhluwe-iMfolozi Park Management Plan. Unpublished Ezemvelo KZN Wildlife Document, Pietermaritzburg.
Dark, S. J. 2004. The biogeography of invasive alien plants in California: an application of GIS and spatial regression analysis. Diversity and Distributions 10:1 - 9.
Davies, K. F., P. Chesson, S. Harrison, B. D. Inouye, B. A. Melbourne, and K. J. Rice. 2005. Spatial heterogeneity explains the scale dependence of the native-exotic diversity relationship. Ecology 86:1602 - 1610.
Davis, M. A., K. Thompson, and J. P. Grime. 2001. Charles S. Elton and the dissociation of invasion ecology from the rest of ecology. Diversity and Distributions 7:97 - 102.
De Rouw, A. 1991. The invasion of Chromolaena odorata (L.) King & Robinson (ex Eupatorium odoratum), and competition with the native flora, in a rain forest zone, south-west Cote d'Ivoire. Journal of Biogeography 18:13 - 23.
Deutschewitz, K., A. Lausch, I. Kuhn, and S. Klotz. 2003. Native and alien plant species richness in relation to spatial heterogeneity on a regional scale in Germany. Global Ecology and Biogeography 12:299 - 311.

8
Doust, L. L. 1981. Population dynamics and local specialization in a clonal perennial (Ranunculus repens) i) The dynamics of ramets in contrasting habitats. Journal of Ecology 69:743 - 755.
Elton, C. S. 1958. The ecology of invasions by plants and animals. Methuen, London, UK. Erasmus, D. J. 1985. Achene biology and the chemical control of Chromolaena odorata. Ph. D
thesis, University of Natal, Pietermaritzburg, Pietermaritzburg. Frazee, S. R., R. M. Cowling, R. L. Pressey, J. K. Turpie, and N. Lindenburg. 2003. Estimating
the costs of conserving a biodiversity hotspot: a case study of the Cape Floristic Region, South Africa. Biological Conservation 112:275 - 290.
Gautier, L. 1992. Taxonomy and distribution of a tropical weed: Chromolaena odorata (L.) R. King & H. Robinson. Candollea 47:645 - 662.
Goodall, J. M., and D. J. Erasmus. 1996. Review of the status and integrated control of the invasive alien weed, Chromolaena odorata, in South Africa. Agriculture, Ecosystem and Environment 56:151 - 164.
Higgins, S., and D. M. Richardson. 1996. A review of models of alien plant spread. Ecological Modelling 87:249 - 265.
Higgins, S. I., R. Nathan, and M. L. Cain. 2003. Are long-distance dispersal events in plants usually caused by nonstandard means of dispersal? Ecology 84:1945 - 1956.
Higgins, S. I., D. M. Richardson, R. M. Cowling, and T. H. Trinder-Smith. 1999. Predicting the Landscape-Scale distribution of alien plants and their threat to plant diversity. Conservation Biology 13:303 - 313.
Hobbs, R. J., and S. E. Humphries. 1995. An integrated approach to the ecology and management of plant invasions. Conservation Biology 9:761 - 770.
Howison, O. E. 1998. The distribution of Chromolaena odorata in Hluhluwe Game Reserve. Unpublished report, Ezemvelo KZN Wildife, Pietermaritzburg.
Howison, O. E. 2001. The distribution of Chromolaena odorata in Hluhluwe Game Reserve. Unpublished report, Ezemvelo KZN Wildlife, Pietermaritzburg.
Huston, M. A. 2004. Management strategies for plant invasions: manipulating productivity, disturbance, and competition. Diversity & Distributions 10:167 - 178.
Janzen, D. H. 1983. No park is an island: increase in interference from outside as park size decreases. Oikos 41:402 - 410.
Joshi, C. 2006. Mapping cryptic invaders and invisibility of tropical forest ecosystems: Chromolaena odorata in Nepal. Ph.D thesis, Wageningen University, Wageningen.
Kennedy, T. A., S. Naeem, K. M. Howe, J. M. H. Knops, D. Tilman, and P. Reich. 2002. Biodiversity as a barrier to ecological invasion. Nature 417:636 - 638.
Kriticos, D. J., T. Yonow, and R. E. McFadyen. 2005. The potential distribution of Chromolaena odorata (Siam weed) in relation to climate. Weed Research 45:246 - 254.
Larson, D. L., P. J. Anderson, and W. Newton. 2001. Alien plant invasion in mixed-grass prairie: Effects of vegetation type and anthropogenic disturbance. Ecological Applications 11:128 - 141.
Le Maitre, D. C., D. M. Richardson, and R. A. Chapman. 2004. Alien plant invasions in South Africa: driving forces and the human dimension. South African Journal of Science 100.
Le Maitre, D. C., B. W. Van Wilgen, R. A. Chapman, and D. H. McKelly. 1996. Invasive plants and water resources in the Western Cape Province, South Africa: modeling the consequences of a lack of management. Journal of Applied Ecology 33:61 - 172.
Lonsdale, W. M. 1993. Rates of spread of an invading species - Mimosa pigra in northern Australia. Journal of Ecology 81:513 - 521.
Lonsdale, W. M. 1999. Global patterns of plant invasions and the concept of invasibility. Ecology 80:1522 - 1536.

9
Luwum, P. 2002. Control of invasive Chromolaena odorata : An evaluation in some land use types in KwaZulu-Natal, South Africa. M.Sc thesis, International Institute for Geo-information and Earth Observation, Enschede, the Netherlands.
MacDonald, I. A. W. 1983. Alien trees, shrubs and creepers invading indigenous vegetation in the Hluhluwe-Umfolozi Game Reserve Complex in Natal. Bothalia 14:949 - 959.
MacDonald, I. A. W., and G. W. Frame. 1988. The invasion of introduced species into nature reserves in tropical savannas and dry woodlands. Biological Conservation 44:67 - 93.
Mack, R. N., D. Simberloff, W. M. Lonsdale, H. Evans, M. Clout, and F. A. Bazzaz. 2000. Biotic Invasions: Causes, Epidemiology, Global Consequences, and Control. Issues in Ecology 10:689 - 710.
McFadyen, R. E. 2000. Chromolaena in Asia and the Pacific: spread continues but control prospects improve. Pages 13 - 18 in C. Zacharides, R. Muniappen, and L. W. Strathie, editors. Fifth international workshop on biological control and management of Chromolaena odorata. ARC - Plant Protection Research Institute, Pretoria, South Africa.
McFadyen, R. E., and B. Skarrat. 1996. Potential distribution of Chromolaena odorata (Siam weed) in Australia, Africa and Oceania. Agriculture, Ecosystems and Environment 59:89 - 96.
Monserud, R. A., and R. Leemans. 1992. Comparing global vegetation maps with the Kappa statistic. Ecological Modelling 62:275 - 293.
Moody, M. E., and R. N. Mack. 1988. Controlling the spread of plant invasions: The importance of nascent foci. Journal of Applied Ecology 25:1009 - 1021.
Mooney, H. A., and J. A. Drake. 1989. Biological invasions: a SCOPE program overview. Pages 491 – 508 in J. A. Drake, H. A. Mooney, F. di Castri, R. H. Groves, F. J. Kruger, M. Rejmanek, and M. Williamson, editors. Biological invasions: a global perspective. John Wiley and Sons Ltd.
Mucina, L., and M. C. Rutherford 2006. The Vegetation of South Africa, Lesotho and Swaziland. South African National Biodiversity Institute, Pretoria.
Mullerova, J., P. Pyšek, V. Jarosik, and J. Pergl. 2005. Aerial photographs as a tool for assessing the regional dynamics of the invasive plant species Heracleum mantegazzianum. Journal of Applied Ecology 42:1042 - 1053.
Noble, I. R. 1989. Attributes of invaders and the invading process: Terrestrial and vascular plants. in J. A. Drake, H. A. Mooney, F. di Castri, R. H. Groves, F. J. Kruger, M. Rejmanek, and M. Williamson, editors. Biological Invasions: A global perspective. John Wiley and Sons Ltd.
Orapa, W., G. Donnelly, and I. Bofeng. 2000. The Distribution of Siam weed, Chromolaena odorata, in Papua New Guinea. Pages 19 - 25 in C. Zacharides, R. Muniappen, and L. W. Strathie, editors. Fifth international workshop on biological control and management of Chromolaena odorata. ARC - Plant Protection Research Institute, Pretoria.
Pimental, D., S. McNair, J. Janecka, J. Wightman, C. Simmonds, C. O'Connell, E. Wong, L. Russell, J. Zern, T. Aquino, and T. Tsomondo. 2001. Economic and environmental threats of alien plant, animal and microbe invasions. Agriculture, Ecosystems and Environment 84:1 - 20.
Pyšek, P. 1998. Is there a taxonomic pattern to plant invasions? Oikos 82:282 - 294. Pyšek, P., J. H. Brock, K. Bimova, B. Mandak, V. Jarosik, I. Koukolikova, J. Pergl, and J.
Stephanek. 2003. Vegetative regeneration in invasive Reynoutria (Polygonaceae) taxa: The determinant of invasibiltiy at the genotype level. American Journal of Botany 90:1487 - 1495.
Pyšek, P., and V. Jarosik. 2005. Residence time determines the distribution of alien plants. Pages 77 - 96 in Inderit, editor. Invasive Plants: Ecological and Agricultural Aspects. Birkháuser Verlag, Switzerland.

10
Radosevich, S. R., M. M. Stubbs, and C. M. Ghersa. 2003. Plant invasions: Process and patterns. Weed Science 51:254-259.
Rambuda, T. D., and S. D. Johnson. 2004. Breeding systems of invasive alien plants in South Africa: does Baker's rule apply? Diversity and Distributions 10:409 - 416.
Rejmanek, M., and D. M. Richardson. 1996. What attributes make some plant species more invasive? Ecology 77:1655 - 1661.
Richardson, D. M., N. Allsop, C. M. D'Antonio, S. J. Milton, and M. Rejmakek. 2000. Plant invasions – the role of mutualisms. Biological Review 75:65 - 93.
Richardson, D. M., and P. Pyšek. 2006. Plant invasions: merging the concepts of species invasiveness and community invasibility. Progress in Physical Geography 30:409 - 431.
Richardson, D. M., and P. Pyšek. 2008. Fifty years of invasion ecology – the legacy of Charles Elton. Diversity and Distributions 14:161 - 168.
Richardson, D. M., M. Rouget, and M. Rejmanek. 2004. Using natural experiments in the study of alien tree invasions. Pages 607 - 647 in M. S. Gordon, and S. M. Bartol, editors. Experimental approaches to conservation biology. University of California Press, Berkeley.
Richardson, D. M., B. W. Van Wilgen, S. I. Higgins, T. H. Trinder-Smith, R. M. Cowling, and D. H. McKelly. 1996. Current and future threats to plant diversity on the Cape Peninsula, South Africa. Biodiversity and Conservation 5:607 - 647.
Roder, W., S. Phengchanh, B. Keoboualapha, and S. Maniphone. 1995. Chromolaena odorata in slash-and-burn rice systems of Northern Laos. Agroforestry Systems 31:79 - 92.
Sakai, A. K., F. W. Allendorf, J. S. Holt, D. M. Lodge, J. Molofsky, K. A. With, S. Baughman, R. J. Cabin, J. E. Cohen, N. C. Ellstrand, D. E. McCauley, P. O'Neil, I. M. Parker, J. N. Thompson, and S. G. Weller. 2001. The population biology of invasive species. Annual Review of Ecology and Systematics 32:305 - 332.
Schmid, B., and J. L. Harper. 1985. Clonal growth in grassland perennials. i) Density and pattern-dependent competition between plants with different growth forms. Journal of Ecology 73:793 - 808.
Sheley, R. L., and J. Krueger-Mangold. 2003. Principles for restoring invasive plant-infested rangeland. Weed Science 51:260 - 265.
Simberloff, D. 2003. Eradication: Preventing iInvasions at the outset. Weed Science 51:247 - 253. Stohlgren, T. J. 2002. Theories of plant invasions: Lessons from natural landscapes. Comments
on Theoretical Biology 7:355 - 379. Stohlgren, T. J., D. Binkley, G. W. Chong, M. A. Kalkhan, L. D. Schell, K. A. Bull, Y. Otsuki, G.
Newman, and M. S. Bashkin, Y. 1999. Exotic plant species invade hotspots of native plant diversity. Ecological Monographs 69:25 - 46.
Stohlgren, T. J., C. Jarnevich, G. W. Chong, and P. H. Evangelista. 2006. Scale and plant invasions: a theory of biotic acceptance. Preslia 78:405 - 426.
Thuiller, W., D. M. Richardson, P. Pyšek, G. F. Midgeley, G. O. Hughes, and M. Rouget. 2005. Niche-based modeling as a tool for predicting the risk of alien plant invasions at a global scale. Global Change Biology 11:2234 - 2250.
Van Wilgen, B. W., and D. M. Richardson. 1985. The effects of alien shrub invasions on vegetation structure and fire behaviour in South African fynbos shrublands: A simulation study. Journal of Applied Ecology 22:955 - 966.
Vitousek, P. M., C. M. D'Antonio, L. L. Loope, M. Rejmanek, and R. Westerbrooks. 1997. Introduced species: A significant component of human-caused global change. New Zealand Journal of Ecology 21:1 - 16.
Von Senger, I., N. P. Barker, and C. Zacharides. 2002. Preliminary phylogeography of Chromolaena odorata: finding the origin of the South African weed. Pages 90 - 99 in C. Zacharides, R. Muniappen, and L. W. Strathie, editors. Fifith international workshop on

11
biological control and management of Chromolaena odorata. ARC-Plant Protection Research Institute, Pretoria, South Africa, Durban, South Africa.
Waterhouse, B. M., and O. Zeimer. 2002. ‘On the brink’: the status of Chromolaena odorata in northern Australia. Pages 29 - 33 in C. Zacharides, R. Muniappen, and L. W. Strathie, editors. Fifith International Workshop on Biological Control and Management of Chromolaena odorata. ARC-Plant Protection Research Institute, Pretoria, South Africa. , Durban, South Africa.
Williamson, M. H., and A. Fitter. 1996. The characters of successful invaders. Biological Conservation 78:163 - 170.
Wilson, J. R. U., D. M. Richardson, M. Rouget, S. Proches, M. A. Amis, L. Henderson, and W. Thuiller. 2007. Residence time and potential range: crucial considerations in modelling plant invasions. Diversity and Distributions 13:11 - 22.
Witkowski, E. T. F. 2001. Invasion intensity and regeneration potential of the non-native invasive plant Chromolaena odorata at St Lucia, South Africa in C. Zacharides, R. Muniappen, and L. W. Strathie, editors. Fifth International Workshop on biological control and management of Chromolaena odorata, Durban, South Africa, 23 - 25 October 2000.
Witkowski, E. T. F., and M. Wilson. 2001. Changes in density, biomass, seed production and soil seed banks of the non-native invasive plant Chromolaena odorata, along a 15 year chronosequence. Plant Ecology 152:13 - 27.
Ye, X.-H. 2006. A trade-off between guerilla and phalanx growth forms in Leymus secalinus under different nutrient supplies. Annals of Botany 98:187 - 191.
Zacharides, C., and J. M. Goodall. 2000. Distribution , impact and management of Chromolaena odorata in southern Africa. Pages 34 - 39 in C. Zacharides, R. Muniappen, and L. W. Strathie, editors. Fifth international workshop on the biological control and management of Chromolaena odorata. ARC - Plant Protection Research Institute, Pretoria, South Africa.
Zou, J., W. E. Rogers, and E. Siemann. 2009. Plasticity of Sapium sebiferum seedling growth to light and water resources: Inter- and intraspecific comparisons. Basic and Applied Ecology 10:79 - 88.

12
CHAPTER 2: LESSONS FROM THE INVASION OF A DIVERSE AFRICAN SAVANNA RESERVE BY THE ALIEN PLANT CHROMOLAENA ODORATA: THE INTERACTION OF HABITAT SUITABILITY AND DISPERSAL
O. Howison, R. Slotow, H. Olff
ABSTRACT Chromolaena odorata is a highly invasive alien plant, threatening biodiversity in many tropical and sub-tropical regions of the world, including African savannas. This fast-growing, easily dispersed species with high production of small seeds is currently the target of one of the largest alien plant control programmes in the world. In South Africa, the Hluhluwe-iMfolozi Park is a key savanna conservation area with high biodiversity and a number of endangered plant and animal species. This Park is currently threatened by this invasion, and effective long-term control strategies will require a deeper understanding of the invasion process. Periodic mapping between 1978 and 2001 of the progress of the invasion allowed us to relate the invasion to the spatial arrangement of vegetation types, which are highly fragmented due to the natural interaction of topography and fire. Initially C. odorata invaded certain vegetation types that were more susceptible to invasion, but, with time, invasion rate diminished in these vegetation types and kept spreading in vegetation types that were initially less susceptible to invasion. Invasion into these latter vegetation types was facilitated through propagule pressure, which increased as the invasion spread in the adjacent susceptible vegetation types. It spread through these comparatively resistant vegetation types and reached remaining patches of susceptible vegetation types that were protected through fragmentation by a matrix of vegetation types that were initially resistant to invasion. Understanding these interactions between susceptible vegetation types, propagule pressure and habitat fragmentation that drive invasions provide improved knowledge for managing this invasion.
KEYWORDS Hluhluwe Game Reserve; invasion dynamics; invasion theories; patch cohesion; propagule pressure.

13
INTRODUCTION Invasive alien species, together with global warming and land-use change, are the most important causes of human induced global change (Mack et al. 2000). These invasions can effect the species structure and composition within communities (Collier et al. 2002; Vitousek et al. 1997), simplify habitats leading to concomitant loss of biodiversity among plants, animals and birds (Pimental et al. 2001; Stohlgren 2002), change fire regimes (MacDonald 1983; Van Wilgen & Richardson 1985), and negatively impact upon the hydrology of ecosystems (Le Maitre et al. 1996). These effects have both direct and indirect financial impacts, both through the loss of productivity and through the cost of clearing invasive alien plants (Le Maitre et al. 1996; Mack et al. 2000; Pimental et al. 2001). Theories on alien plant invasions can be divided into two broad categories. Rejmanek and Richardson (1996) propose that the characteristics of invasive alien plants allow them to become invasive, for example high seed production, short interval between episodes of high seed production and short juvenile period, while Stohlgren (2002) proposed that it is the characteristics of habitats that make them susceptible to invasion, for example the inverse relationship between diversity and invasion. These explanations and their interactions have been reviewed by Richardson and Pyšek (2006), who conclude that both habitat characteristics and invasive species characteristics can play a role in the invasion process. Research on the mechanisms whereby invasive alien plants spread, and what determines both the rate and magnitude of spread is required to effectively manage these invasions (Ewel et al. 1999; Sakai et al. 2001). The mode of invasion may also vary, depending on species characteristics. The terms phalanx and guerilla invasion were defined by Doust (1981) to describe two invasion patterns observed in vegetatively spreading plants. Phalanx invasion occurs when internode intervals are short, there is high intraspecific contact between ramets and the plant spreads relatively slowly along a continuous front, while guerilla invasion occurs when internode intervals are long, there is little contact between ramets and high interspecific contact (Doust 1981; Schmid & Harper 1985). This is made possible through plasticity of the invading plant (Barney et al. 2005; Pyšek et al. 2003), and allows the invader to spread through patches of unfavourable habitat relatively quickly, and then colonise patches of more suitable habitat once these are reached (Ye 2006) . For invasive plants that spread through high seed production, if most of the seeds fall below or very close to the parent plant, a population will spread into new territory as an advancing front (Lonsdale 1993) in a similar manner to the phalanx invasion through vegetative growth. On the other hand, rare long-distance dispersal of propagules (e.g. through animal dispersal) may lead to the establishment of new patches far away from existing invaded patches, resembling a guerilla invasion process (Higgins et al. 1999). To study the factors contributing to invasion and the interplay between the factors, it is important that these invasion processes are documented from a very early stage (Pyšek & Jarosik 2005). In most field studies of alien plant invasions such documentation is not readily available, and this complicates studying the invasion processes and understanding interactions. Whatever species or community properties facilitate or hinder invasion, the relatively long lag period from introduction to when a species starts expanding exponentially, coupled to the lack of historical distribution data for most alien plant invasions, is one of the key obstructions in the better understanding of invasions (Pyšek & Hulme 2005). In many cases it may take more than 100 years between the dates of first introduction in an ecosystem to when a species is identified as

14
being a problematic invader, and the key ecological processes that initially limited the invasion may be in the past (Kowarik 1995; Pyšek & Jarosik 2005; Pyšek & Prach 1993). An exceptionally well-documented invasion is the spread of the alien plant Chromolaena odorata (L.) R.M King & H. Robinson (=Eupatorium odoratum L, Asteraceae) in the northern section of Hluhluwe-iMfolozi Park (formerly Hluhluwe Game Reserve) in KwaZulu-Natal, South Africa. Chromolaena odorata is listed on the global invasive species database as one of the world’s 100 most invasive plants (Anon 2004; Matthews & Brand 2004). Originally from South America and the Caribbean islands, it has been introduced to West Africa (Ghana, Ivory Coast and Nigeria), South Africa, India and other Asian countries, and the islands of the East Pacific (Phillipines, Timor) and the east coast of Australia (McFadyen & Skarrat 1996). Within the African continent, realized and potential climatic niche studies have shown that the invasion in West Africa could spread extensively eastwards and southwards, while the South African invasion could spread to East Africa, until the two invasion fronts finally meet up, thereby threatening the biodiversity of the entire African savanna biome (Kriticos et al. 2005; McFadyen & Skarrat 1996). These savannas are not only of high biodiversity importance, they also support subsistence and commercial agriculture, and ecotourism opportunities which are an important source of revenue (Milton et al. 2003; Turpie 2004). Analysing the invasion in Hluhluwe Game Reserve should lead to improved understanding of the invasion process by C. odorata in African savannas, which may enable the invasion to be managed more effectively on a wider geographical scale. The invasion of Hluhluwe Game Reserve is the focus of our study as it has been well documented, with periodic distribution mapped from the first identification of the species in the study area in 1961. Few invasions have been mapped with the level of spatial and temporal resolution from an early stage of invasion in tropical habitats. We used these spatially explicit temporal progression maps to reconstruct the invasion, to improve understanding of the invasion process. In particular we investigated the interactions between habitat properties (rainfall and habitat structure), propagule pressure of the invading species and the spatial dynamics of the invasion process (proximity to nearest infestation, phalanx invasion, guerilla invasion).
METHODS
Study site The study area (280 06’ 08”S and 320 04’ 04”E) is the northern section (260 km2) of Hluhluwe-iMfolozi Park, a 900 km2 game reserve situated in northern KwaZulu-Natal, South Africa (Figure 2.1). It is situated along a coastal escarpment, with a rugged terrain ranging from 80 – 600 metres above sea level (Conway et al. 2001; Whately & Porter 1983). It is managed by the provincial conservation authority, Ezemvelo KwaZulu-Natal Wildlife (EKZNW). Precipitation, mostly received as thunderstorms between October and March, ranges from 650 mm.yr-1 in the southern Umfolozi river basin and increases with altitude to 980 mm.yr-1 in the northern upland forests (Balfour & Howison 2001; Brooks & MacDonald 1983). Mean minimum temperature is 130 C and mean maximum temperature is 350 C, and temperature declines with increasing altitude (Greyling & Huntley 1984). The long-term average rainfall of the study area was extracted from a spatial interpolation of rainfall for South Africa (Figure 2.1 (B)) (Schulze et al. 1997) and used to determine whether there was any relationship between average rainfall of the various vegetation types and the progress of invasion for different vegetation types.

15
The geology is varied, and dominated by sandstones, mudstones and shale’s, over which basalt was locally deposited, but has been eroded away, leaving rich, fine textured black clay soils in some areas (Downing 1980; King 1970). The varied climate, geology and topography have resulted in a wide variety of soil types developing according to position in the landscape (Barrow 1986; Downing 1980). This in turn has lead to the development of a highly heterogeneous assemblage of vegetation types (Whately & Porter 1983) with a high level of fragmentation (Figure 2.1 (A), Figure 2.2 and Table 2.1).
Figure 2.1: The study site is a reserve with rugged topography and steep rainfall gradient. (A) Location of South Africa and relief of the study site; (B) Location and rainfall of the study site, rainfall gradient from 600.1 – 900 mm.yr-1.
Species description and impacts C. odorata is a shrub with an extensive fibrous root system and leaves with aromatic compounds (Ramakrishnan 1992), a prolific seed bearing ability and efficient seed dispersal mechanisms (Witkowski & Wilson 2001). It occurs naturally over a wide area of the tropical and sub-tropical Americas, from southern Florida to Northwest Argentina, as well as several Caribbean islands, and is most common in cleared or secondary forest below 1 500 – 1 000 metres and receiving over 1 500 mm rain.yr -1 (McFadyen 1991). It is often associated with disturbances such as construction sites, road and railway servitudes and abandoned fields and pastures (McFadyen 1991).

16
Blackmore (1998) found 99% of seed is wind dispersed and falls directly below the plant, and that the maximum wind dispersal distance was 80m. With its fast growth rate and lack of natural enemies outside its native range (Keane & Crawley 2002), C. odorata is able to form dense, impenetrable thickets very quickly in a wide variety of habitats. In addition, sufficient seeds remain viable in the seed bank for over 10 months to ensure rapid re-invasion if control work is not followed up (Witkowski & Wilson 2001). Germination of seeds is prompted by soil disturbances such as clearing activities, fire or other natural disturbances such as flooding of rivers and watercourses (O. Howison, pers. obs.). It also has a fast rate of growth, up to 20 mm.day-1 have been recorded (Luwum 2002) and varied growth form ranging from individual shrubs, through dense stands to a vine-like architecture that climbs other shrubs and trees (O. Howison, pers. obs.). Invasion by C. odorata alters the composition, structure and diversity of the natural vegetation (Goodall & Erasmus 1995). It also impairs grazing and browsing opportunities for large herbivores in nature reserves and rangelands (O. Howison, pers. obs.), is a problem for forestry during establishment of plantations and adversely affects crops (Goodall & Erasmus 1995). It also has a detrimental effect on crocodile nesting sites through shading, which reduces incubation temperatures and subsequent failure of eggs to hatch or skewing the ratio of male : female hatchlings, as crocodile sex is determined by incubation temperature (Leslie & Spotila 2001).
Regional invasion dynamics C. odorata was introduced after World War II through Durban Harbour on the eastern seaboard of KwaZulu-Natal, South Africa, and spread rapidly north and south along the coastal region (Erasmus 1988) (Figure 2.1). It was first identified in the study area in 1961, after which it became well established by 1970 (Goodall & Erasmus 1996). Since then it is known to have spread into Swaziland, Mpumalanga and Limpopo Province, and is also known to occur along the northern KwaZulu-Natal border with Mozambique (Zacharides & Goodall 2002).
Mapping the invasion Records from Hluhluwe Game Reserve indicate that C. odorata was identified and controlled at four sites between 1961 and 1978 (Howison 1998, 2001; MacDonald 1978), thus indicating some known locations from this time period. The first systematic mapping of C. odorata in Hluhluwe Game Reserve was in 1978, where the distribution of C. odorata was mapped as the known presence within a 0.25 km2 grid. There was no estimate of density within each grid cell. Mapping was done by personnel surveying on foot and from vehicles, and recording the presence of C. odorata per grid cell. Mapping of the spatial distribution using this method was undertaken in 1978, 1980, 1981, 1982, 1983, 1987, 1998 and 2001. There were gaps in the mapping sequence, from 1983 to 1987 and 1987 and 1998. However, there were no sustained clearing operations undertaken that could have had any impact on the spread of the infestation and it is unlikely to have retreated from any area that it invaded during these periods (Ezemvelo KZN Wildlife unpublished data), and therefore increased in extent from one mapping exercise to the next. Due to the broken nature of the terrain in the study area and fragmented vegetation, not every grid cell was searched exhaustively to such an extent that it could be declared free of C. odorata. Therefore these distribution maps indicate known presence. We used these data to calculate the rate of invasion in the study area from 1978 – 2001. The relatively fast rate of the invasion (< 50

17
years) and the good documentation of its spatio-temporal dynamics allow the study of the invasion process from an early stage.
Vegetation types We used the classification and mapping of woody plant communities present at the onset of the invasion as our basic description of the habitats occurring in the study area. These were mapped by Whately and Porter (1983) (Figure 2.2 and Table 2.1). They identified two forests, two riverine forests, ten woodlands, one thicket and one induced thicket communities in Hluhluwe-iMfolozi Park. Of these 16 communities, 12 occur in the study area (Hluhluwe Game Reserve). In addition, two grassland communities and a 10 ha Acacia davyii thicket community were mapped, but not described (Whately & Porter 1983). The forests are distributed in the northern and south western parts of the study area, riverine forests along the major rivers and watercourses and the rest of the study area is a complex matrix of broadleaved and fine leaved woodlands and thickets. The forests occur in two main regions within the study area that have a higher average rainfall (Figure 2.1 (B) and Figure 2.2), while the remaining vegetation types may be found across a wide rainfall gradient. To test the hypothesis that these vegetation types are highly fragmented, we calculated a relative patch cohesion index for each vegetation type, according to the method described by Schumaker (1996). This index ranges from 0 to 1, with higher values indicating greater cohesion, i.e. less fragmentation (Schumaker 1996), and was done to determine whether fragmentation of vegetation types is important in determining invasion patterns.
Data analysis To study the progression and mechanisms of the invasion, we identified the year in which each 0.25 km2 cell was invaded. From this we calculated, for each mapping exercise (1978, 1980, 1981, 1982, 1983, 1987, 1998 and 2001) the number of cells that were newly invaded, the cumulative number of cells invaded and, by subtraction, the number of cells clear of C. odorata. The clear cells that were adjacent to invaded cells were identified, and, of these, the cells that became invaded by the next mapping exercise were identified as expansion of existing infestations through phalanx invasion. The number of cells not adjacent to existing infestations was calculated through subtraction, and the number of these that were invaded by the next mapping exercise was identified as expansion through guerilla invasion. We used the proportion of adjacent cells to the total number of uninvaded cells in the previous mapping event multiplied by the number of newly invaded cells in the current mapping event to generate expected values for phalanx invasion. Similarly, we used the proportion of discrete cells to the total number of uninvaded cells in the previous mapping event multiplied by the number of newly invaded cells in the current mapping event to generate expected values for guerilla

18
Figure 2.2: Vegetation types of Hluhluwe Game Reserve invasion. We used a chi-square test to determine whether C. odorata invaded through phalanx or guerilla invasion (see Figure 2.3 and Appendix 2.1). We used ArcGIS 8.x to intersect the year in which each cell was known to be invaded with the vegetation map, and used this to calculate the cumulative area (in ha) of each vegetation type that was invaded over time, from 1978 to 2001. We assumed that all vegetation types present in the cell were invaded. This allowed us to determine whether invasion occurred at a similar rate in all vegetation types or whether progression of the invasion differed between vegetation types, and whether the rate of invasion was constant within each vegetation type.

19
O P P O O O X X XP O O O G X X O X X X O X X X X X X O O O X XP X O G O O O X X X O O O G O O O O
Number of cells invaded in year x (3) X Cells adjacent to existing infestations in year x (20)
XP Cells adjacent to existing infestations in year x that were invaded through phalanx invasion in year x + 1 (2) P Cells invaded in year x + 1 through phalanx invasion (2) G Cells invaded in year x + 1 through guerilla invasion (3) O Cells adjacent to existing infestations in year x + 1 (23)
Zonal statistics in ArcGIS 8.3 (overlay of polygons on rasters) were performed to calculate the average altitude, aspect and rainfall of each vegetation type (Figure 2.2), to test if any of these factors influenced the invasion, using regression statistics. The average altitude was calculated
Figure 2.3: Calculating the data matrix (Appendix 2.1). In this illustration, three cells were invaded in year x, and there were 20 cells adjacent to the existing infestation. In year x + 1 a further 7 cells became invaded, four through phalanx invasion and three through guerilla invasion, and there are now 23 cells adjacent to existing infestations and 13 discrete cells that are not yet invaded. from a digital elevation model (DEM) of KwaZulu-Natal that was developed by KZN Department of Agriculture and Environment Natural Resources Section using 20m contours from the South African 1: 50 000 topo-cadastral map series and spot heights. This DEM was used to calculate an aspect map of the study area, which was used to calculate the average aspect of each vegetation type. The average rainfall for each vegetation type was calculated from Schulze et al. (1997).
RESULTS
Patch cohesion index Only two vegetation types have a patch cohesion (PC) greater than 0.5, namely the Ficus sycamorus / Schotia brachypetala Riverine Forests (0.92) and the Celtis africana/Harpephyllum caffrum Forests (0.56), an indication of the high level of fragmentation of most vegetation types. The patch cohesion index for each vegetation type is presented in Table 2.1.

20
Spatial invasion dynamics The percentage area invaded by C. odorata across all vegetation types in the study area increased from 5% in 1978 to 73% in 2001, an average increase of 5% per year (Figure 2.4). This continuous progression of the invasion took place despite the relatively high fragmentation of most vegetation types (Figures 2.1 (A), Figure 2.2 and Table 2.1). The largest infestation in 1978 occurred in an area of high rainfall in the study area (Figure 2.1 and Figure 2.5).
Figure 2.4: Rate of invasion over time within the study site, showing a linear regression, Multiple Regression, r2 = 0.9784, p < 0.001, y = -5531.91 + 2.7979x. The solid line indicates the regression, the dotted lines indicate the 95% confidence interval. Despite this continuous expansion, the invasion proceeded in one of two ways, depending on vegetation community (Figure 2.6). For the Celtis/Harpephyllum and Celtis/Euclea forests, Acacia caffra thickets, Combretum woodlands, the Themeda triandra and Sporobolus/Cyperus grasslands and the Acacia karroo woodlands, the invasion took place in a stepwise fashion (S invasion curve in Table 2.1), characterized by a rapid invasion from 1978 to 1983, followed by a much slower rate of invasion between 1983 to 1998, and another rapid expansion from 1998 to 2001. We used this pattern to define three phases of invasion: 1978 to 1983 as Phase 1, 1983 – 1998 as Phase 2 and 1998 – 2001 as Phase 3 (Figure 2.6). The vegetation types with the stepwise invasion pattern are mostly in the northern parts of the study area, with isolated patches in the south-west and south (Figure 2.7). In contrast, the remaining communities showed a simpler nvasion expansion, similar to the linear pattern in Figure 2.4. The results of fitting equations to these data are presented in Tables 2.1 and 2.2, and for the vegetation types with the stepwise invasion pattern, the best fit was a 3rd order polynomial equation. With the exception of the Spirostachys africana woodlands, the best regression fit was a 1st or 2nd order polynomial equation for the remaining vegetation types. The Spirostachys africana woodlands are an exception to these patterns. The best fit for them was a 3rd order polynomial equation, but the

21
Table 2.1: Structural form, vegetation code, dominant species and observed shape of invasion curve (see Figure 2.6) of the vegetation communities of the study area
Vegetation community Dominant Species Sp.
Code
Average rate of invasion 1978 - 1983
(Percentage)
Patch Cohesion
Index
Curve Type
Polynomial order
Forest Celtis africana /Euclea racemosa
C/E 7.72 0.123 S 3
Forest Celtis africana / Harpephyllum caffrum
C/H 7.43 0.560 S 3
Riverine forest Ficus sycamorus / Schotia brachypetala
F/S 4.44 0.920 L 2
Riverine forest Spirostachys africana / Euclea racemosa
S/E 0.92 0.219 L 2
Broadleaf woodlands
Euclea divinorum ED 2.64 0.126 L 2
Broadleaf woodlands
Combretum molle CM 7.47 0.166 S 3
Broadleaf woodlands
Spirostachys africana SA 2.19 0.038 L 3
Fine leaf thicket
Acacia caffra Ac 7.24 0.129 S 3
Fine leaf thicket
Acacia karroo / Dichrostachys cinerea
Ak/Dc 2.10 0.124 L 2
Fine leaf woodlands
Acacia burkeii Ab 1.77 0.053 L 2
Fine leaf woodlands
Acacia karroo Ak 3.77 0.134 S 3
Fine leaf woodlands
Acacia nilotica An 2.40 0.168 L 2
Grasslands Sporobolus africana / Cyperus textiles
S/C 7.72 0.259 S 3
Grasslands Themeda triandra Tt 3.76 0.102 S 3 Note: The Sp. Code column is an abbreviation for the dominant species in Column 2 as identified by Whately and Porter (1983), and is used in Figure 2.6 to relate items in the Figure back to the relevant vegetation types. The average rate of invasion is an indication of the rate of invasion in the first phase in each vegetation type. The Patch Cohesion Index (PC) is an index of relative fragmentation (Schumaker 1996) ranging from 0 to 1, with higher values indicating lower relative fragmentation (higher cohesion). For Curve type, S denotes vegetation communities where there is a stepwise invasion curve, and L indicates a more linear invasion curve, while the polynomial order indicates the order of polynomial that best fits the invasion (Figure 2.6). signs of the constants in the equation are opposite to the other vegetation types with the stepwise invasion, indicating a very different pattern of invasion (Figure 2.6). The Spirostachys africana woodlands were therefore not included as a vegetation type with a stepwise invasion curve. We used the average percentage rate of invasion of the vegetation types in the first time period to identify which vegetation types initially may have been more susceptible to invasion, and

22
compared this to the curve type (shape of invasion progress) and the patch cohesion index (Figure 2.6). The average rate of invasion in the first time period was significantly higher for the vegetation types with the stepwise curve than those with the linear curve (T test, t12 = 6.179, p < 0.001), but there was no significant difference between the patch cohesion index means for the two curve types (T test, t12 = 0.07, p < 0.95).
Figure 2.5: Invasion over time. The red shades indicate expansion in phase 1, the yellow shades indicates expansion in phase 2 and the green shades indicate expansion in phase 3. By comparing this figure with Figure 2.1 (B) it can be seen that the infestations started in areas with comparatively high rainfall.
Phase 1 ... ..... , . • 9tO • • v. • • v. •. • ~ . \11,2 • • IIU
Phase 2: 'IIU· .V.1
HIIII1· ,* Phase 3 _ .\l19li . 2OQ.
D~."'~
N
A

23
Table 2.2: Formulae for the best regression for the relationships presented in Figure 2.6
Vegetation code b0 b1x b 2x
2 b3x3 r 2
C/H -198657828 299725 -150.700 0.03 0.99 C/E -198657828 299725 -150.700 0.03 0.99 S/E 382472. -387 0.098 0.99 F/S 146257 -151 0.039 0.99
Ak/Dc -4755 2.4 0.97 Ac -176660683 266472 -133.980 0.02 0.97 Tt -105644551 159468 -80.240 0.01 0.99
S/C -190064990 286502 -143.960 0.02 0.98 SA 58624924 -88218 44.250 -0.01 0.99 ED 365856 -371 0.094 0.99 CM -229099360 345607 -173.790 0.03 1 Ak -186858563 282033 -141.890 0.02 0.99 An 294064 -298 0.080 0.99 Ab 429888 -435 0.110 1
.
Continuous versus stepwise invasion dynamics The type of dynamics (continuous vs. stepwise) was not significantly associated with vegetation structure (grassland, thicket, woodland, forest) across communities (Table 2.1, Chi Square = 2.95, df = 4, p = 0.57)). We then investigated whether the differential rate of expansion, leading to stepwise invasion in some communities, was related to temporal variation in rainfall (wet vs dry periods), using annual rainfall records from a weather station located in the north of the study area (Hluhluwe Research Station). The three time periods (1978 – 1983, 1984 – 1998, 1999 – 2001) were not significantly different in their average annual rainfall (ANOVA: F2,21 = 0.80, p = 0.46). Next, we explored whether spatial differences in invasion dynamics could be explained by spatial variation in rainfall. The vegetation communities with the stepwise invasion are located in the northern and south-western parts of the study area (Figure 2.7).

24
Figure 2.6: Differential rate of invasion as a percentage of each vegetation type over time, showing two types of invasion curves, linear and stepwise. The title of each graph is a code indicating the vegetation type as listed in Table 2.1. Points indicate the percentage of total invasion for each mapping event, while the lines represent the best polynomial fit. Formulae for each curve and r2 values for each graph are presented in Table 2.3.
L Forests . -, ,.
/ ,. ,. '00
" -I • " •
00 " " / " I " " " " • / " / " " 0 0 0 0
" 70 "" ,., '''(] ." ". ". " OJ "" ." "N ,., ' . 0 "" ." " 70 ". "" '"'' ", , Fine-leaved thickets Ie Grasslands , . -- -
'00 ,
'" , ,. '" // 00 " " 00
I " / • 00 " I " " " " / " -< " / " " 0 , 0 0
"7" ". ,m 0:," ." " 70 ,., ". ,co, ." " 10 "" ,. , "" ." "" '"' "" ,- ." L Broad-leaved Woodlands J
'" '" '" "
/ " " I 00 • 00
" " " " " " / , 0 , " N ,., "" " '" . " '070 ,., ". "" ." '070 "., ,., " CO "''' - - -r Ftne· leaved Woodlands 1
,. , '"
, '" 00
• 00 "
/ • • " " " ! 00 00 00
• " " 0 0 0
'''' "" ". •• "" 1m "oo '.0 "" ." '''' ,m ". "" ."

25
Figure 2.7: Distribution of different invasion dynamics in individual vegetation types The rate of invasion of C. odorata during phase 1 (1978 - 1983) increased significantly with increasing average rainfall for each vegetation community (Figure 2.8 (A)) (Multiple Regression, F1, 12 = 9.93, r = 0.67, p = 0.0084). This relationship changed during the second phase of invasion (1984 - 1998), with a significant negative relationship between the average rainfall of the vegetation type and the area invaded during this period (Figure 2.8 (B)) (Multiple Regression, F1,12= 9.1, r = -0.66, p = 0.01). This indicated that the invasion expansion rate slowed down in those communities where it was initially high, and remained the same or increased in those communities where it was previously low. In the third phase of invasion (1998-2003) the pattern switched again, and vegetation types which were initially susceptible to invasion were once again preferentially invaded (Figure 2.8 (C), Multiple Regression, F1,12 = 5.48, r = 0.56, p = 0.04).

26
Figure 2.8: The influence of rainfall on invasion rate during different periods. Invasion rate vs. average rainfall per vegetation type (A) 1998 – 2001 (Multiple Regression, F1, 12
= 9.93, p = 0.008); (B) 1983 – 1998 (Multiple Regression, F1,12 = 9.06, p = 0.01); (C) 1978 – 1983 (Multiple Regression, F1, 12 = 5.48, p = 0.037). The solid lines indicate the best regression fit, and the dotted lines the 95% confidence interval By graphing the number of cells adjacent to existing infestations that were invaded each year as a percentage of the number of cells adjacent to existing infestations in the previous year, and doing the same for the discrete cells, we observed that there was always a higher probability for cells adjacent to existing infestations to become invaded than discrete cells, i.e. cells not adjacent to existing infestations (Figure 2.9 (A), Appendix 2.1). Cells that were adjacent to existing infestation were significantly more at risk from invasion (Chi Square = 313,4, df = 6, p < 0.0001) than cells that were discrete (not adjacent) from existing infestations (Chi Square = 215.1, df = 6, p < 0.0001), through all phases. Further analysis by graphing the chi-square values shows that, in a temporal context, the probability of cells adjacent to an existing invaded cell being invaded increased dramatically during the second phase up to 1998, regardless of the vegetation type within the area (Figure 2.9 (B)). This context-dependency was much lower in the first and third phases.
0
10
20
30
40
50
60
% in
cre
ase
in in
vasi
on
19
83
- 1
99
8
0
10
20
30
40
50
60
% in
cre
ase
in in
vasi
on1
998
- 20
01
0
10
20
30
40
50
60
% in
cre
ase
in in
vasi
on
tow
ard
s 1
98
3
750 800 850 900
Rainfall (mm/pa)
A
B
C

27
=
Figure 2.9: Assessment of the spatial dependence of the invasion process. (A) percentage of cells of the study area invaded adjacent to existing invasions (phalanx, circles) vs. percentage discrete cells (not adjacent to existing patches) that are invaded (guerilla, squares). (B): the change over time of the chi square value of observed versus expected invasion (based on number of potential adjacent cells), the increasing chi square values indicating that proximity to existing infestations became relatively more important between 1983 and 1998.
DISCUSSION Invasion of a habitat by an invasive alien plant is the result of complex interactions between the habitat and the invasive species, and both are important in determining whether invasion will occur (Richardson & Pyšek 2006) and the pattern of the invasion (Doust 1981; Lonsdale 1993, 1999). Most studies of alien plant invasions at a landscape level have few time series maps showing the temporal expansion of the invasion ; there is generally a lack of high-resolution spatio-temporal data (Rouget et al. 2004b) . Some authors have tried to reveal the temporal component of an invasion by measuring tree rings (Hutchinson & Vankat 1997; Wangen & Webster 2006), through literature searches (McKinney 2002) or herbarium records (Mihulka &
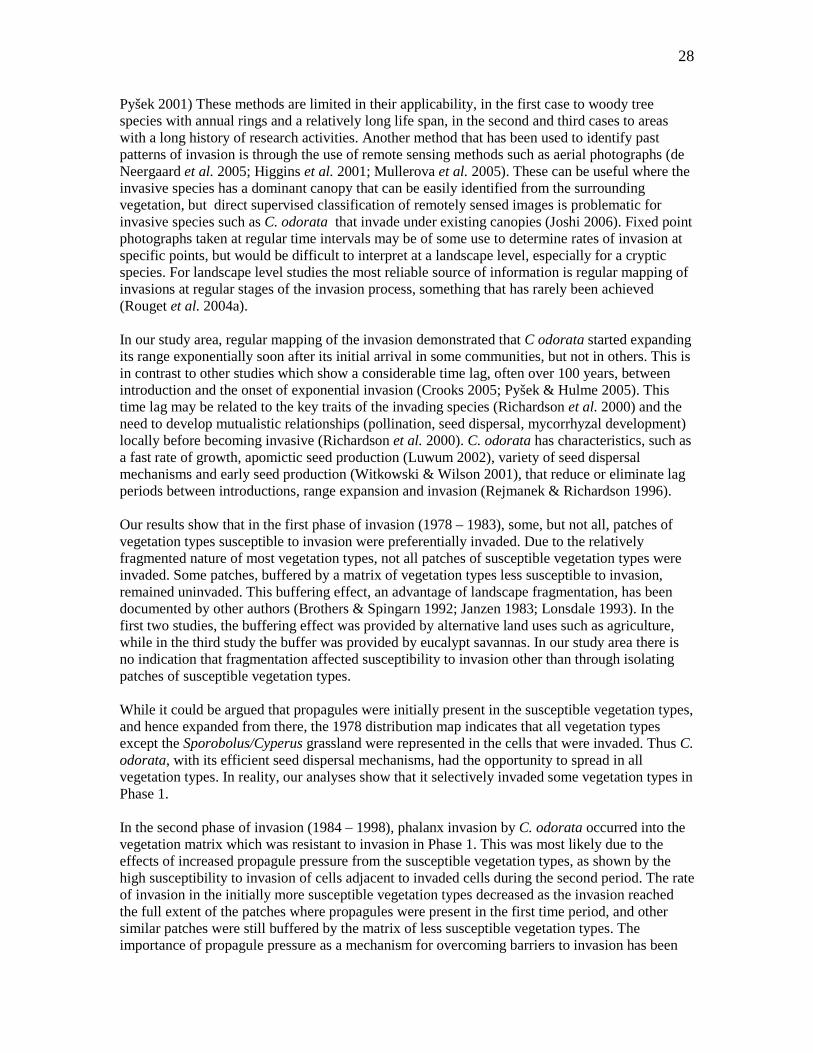
28
Pyšek 2001) These methods are limited in their applicability, in the first case to woody tree species with annual rings and a relatively long life span, in the second and third cases to areas with a long history of research activities. Another method that has been used to identify past patterns of invasion is through the use of remote sensing methods such as aerial photographs (de Neergaard et al. 2005; Higgins et al. 2001; Mullerova et al. 2005). These can be useful where the invasive species has a dominant canopy that can be easily identified from the surrounding vegetation, but direct supervised classification of remotely sensed images is problematic for invasive species such as C. odorata that invade under existing canopies (Joshi 2006). Fixed point photographs taken at regular time intervals may be of some use to determine rates of invasion at specific points, but would be difficult to interpret at a landscape level, especially for a cryptic species. For landscape level studies the most reliable source of information is regular mapping of invasions at regular stages of the invasion process, something that has rarely been achieved (Rouget et al. 2004a). In our study area, regular mapping of the invasion demonstrated that C odorata started expanding its range exponentially soon after its initial arrival in some communities, but not in others. This is in contrast to other studies which show a considerable time lag, often over 100 years, between introduction and the onset of exponential invasion (Crooks 2005; Pyšek & Hulme 2005). This time lag may be related to the key traits of the invading species (Richardson et al. 2000) and the need to develop mutualistic relationships (pollination, seed dispersal, mycorrhyzal development) locally before becoming invasive (Richardson et al. 2000). C. odorata has characteristics, such as a fast rate of growth, apomictic seed production (Luwum 2002), variety of seed dispersal mechanisms and early seed production (Witkowski & Wilson 2001), that reduce or eliminate lag periods between introductions, range expansion and invasion (Rejmanek & Richardson 1996). Our results show that in the first phase of invasion (1978 – 1983), some, but not all, patches of vegetation types susceptible to invasion were preferentially invaded. Due to the relatively fragmented nature of most vegetation types, not all patches of susceptible vegetation types were invaded. Some patches, buffered by a matrix of vegetation types less susceptible to invasion, remained uninvaded. This buffering effect, an advantage of landscape fragmentation, has been documented by other authors (Brothers & Spingarn 1992; Janzen 1983; Lonsdale 1993). In the first two studies, the buffering effect was provided by alternative land uses such as agriculture, while in the third study the buffer was provided by eucalypt savannas. In our study area there is no indication that fragmentation affected susceptibility to invasion other than through isolating patches of susceptible vegetation types. While it could be argued that propagules were initially present in the susceptible vegetation types, and hence expanded from there, the 1978 distribution map indicates that all vegetation types except the Sporobolus/Cyperus grassland were represented in the cells that were invaded. Thus C. odorata, with its efficient seed dispersal mechanisms, had the opportunity to spread in all vegetation types. In reality, our analyses show that it selectively invaded some vegetation types in Phase 1. In the second phase of invasion (1984 – 1998), phalanx invasion by C. odorata occurred into the vegetation matrix which was resistant to invasion in Phase 1. This was most likely due to the effects of increased propagule pressure from the susceptible vegetation types, as shown by the high susceptibility to invasion of cells adjacent to invaded cells during the second period. The rate of invasion in the initially more susceptible vegetation types decreased as the invasion reached the full extent of the patches where propagules were present in the first time period, and other similar patches were still buffered by the matrix of less susceptible vegetation types. The importance of propagule pressure as a mechanism for overcoming barriers to invasion has been

29
Phase 1: Invasion of some patches of susceptible vegetation types isolated from similar vegetation types by a matrix of vegetation types less susceptible to invasion
Phase 2: Propagule pressure from the patches of vegetation types invaded in Phase 1 drives invasion into the matrix of less susceptible vegetation types. Some patches of susceptible vegetation still isolated from invasions
Phase 3: Invasion reaches through the matrix and invasion of patches of susceptible communities that were previously isolated commences. Propagule pressure continues to drive invasion in the matrix of less susceptible vegetation types.
highlighted by a number of authors (Alpert et al. 2000; Brown & Peet 2003; D'Antonio et al. 2001; Foster 2001; Foxcroft et al. 2004; Frenot et al. 2001; Hutchinson & Vankat 1997; Lonsdale 1999; Rouget & Richardson 2003; Williamson 1999; Williamson & Fitter 1996). In the third phase (1998 – 2001), invasion in the less susceptible matrix of vegetation types progressed to such an extent that they no longer acted as a buffer for the remaining patches of favourable habitat. Propagule pressure was such that C. odorata was able to invade communities irrespective of rainfall. Patches of susceptible vegetation types that were previously buffered now experienced an exponential increase in invasion. Multiple lag phases of invasion in a single vegetation type have been documented by Wangen and Webster (2006), who identified range expansion and population growth as separate phases of invasion. Our study shows that time lags can vary in different vegetation types within one management area.
Figure 2.10: Proposed schematic diagram of the mechanism of the invasion, indicating invasion of some susceptible habitats in Phase1, followed by propagule driven invasion into less susceptible communities in Phase 2, and then invasion of additional patches of susceptible vegetation types in Phase 3. We propose that the invasion dynamics of C. odorata is explained by the interplay between habitat suitability, habitat fragmentation and isolation, and propagule dispersal and pressure (Figure 2.10). During the first invasion phase vegetation types with a higher average rainfall

30
provided a more suitable habitat for invasion. As the invasion in these vegetation types progressed, propagule pressure on the surrounding matrix increased, to the extent that this propagule pressure was able to overcome inhibiting factors, for example low rainfall (Phase two). When Phase two commenced, the invasion was able to disperse through the matrix of vegetation types that were initially more resistant to invasion, and, in so doing, reached previously isolated patches of vegetation types with a higher rainfall, whereupon the invasion in these vegetation types increased exponentially (Phase 3). This is in accordance with the results of Rouget and Richardson (2003), who found that distance to sites of initial invasion by four alien Pinus species in the Western Cape, South Africa, as a surrogate of propagule pressure, was a more important determinant of invasion than other environmental variables considered in their study. Foster (2001) and Foster and Tilman (2003) studied the impact of propagules on community structure through sowing experiments, and came to the conclusion that community structure and species composition may be strongly limited by propagule availability. Conversely, if propagules of a single species are abundantly available, that species should have a competitive advantage (DiVittorio et al. 2007). In the case of C. odorata, that advantage is enhanced by the fast rate of growth and lack of natural enemies, resulting in a strong competitive ability (Keane & Crawley 2002; Luwum 2002; Wolfe 2002). Similarly, we also show that uninvaded areas close to existing invasions have a much higher probability of being invaded at any stage of the invasion process. Our study raises fundamental and applied questions with regard to invasive species. We found that invasion in susceptible vegetation types increases propagule pressure which in turn pushes invasion into adjacent vegetation types that are initially resistant to invasion. New modeling studies on invasion dynamics may need to take such context-dependencies of the susceptibility of communities into account.
REFERENCES
Alpert, P., E. Bone, and C. Holzapfel. 2000. Invasiveness invasibility and the role of environmental stress in the spread of non-native plants. Perspectives in Plant Ecology, Evolution and Systematics 3:52 - 66.
Anon. 2004. Global Invasive Species Database. Unpublished website, Auckland, New Zealand. Accessed 27 January 2004
Balfour, D. A., and O. E. Howison. 2001. Spatial and temporal variation in a mesic savanna fire regime: responses to variation in annual rainfall. African Journal of Range and Forage Science 19:43 - 51.
Barney, J. N., A. D. Tommaso, and L. A. Weston. 2005. Differences in invasibility of two contrasting habitats and invasiveness of two mugwort Artemisia vulgaris populations. Journal of Applied Ecology 42:567 - 576.
Barrow, S. N. 1986. A soil survey of Hluhluwe Game Reserve. Lammergeyer 37:22-32. Blackmore, A. C. 1998. Seed dispersal of Chromolaena odorata reconsidered. In R.
Muniappen, editor. Fourth international workshop on biological control and management of C. odorata, Bangalore, India.
Brooks, P. M., and I. A. W. MacDonald. 1983. The Hluhluwe-Umfolozi Reserve: An ecological case history. Pages 51-77 in N. Owen-Smith, editor. Management of large mammals in African conservation areas. Proceedings of a symposium held in Pretoria, South Africa 29-30 April 1982. HAUM Educational Publishers, Pretoria.

31
Brothers, T. S., and A. Spingarn. 1992. Forest fragmentation and alien plant invasion of central Indiana old-growth forests. Conservation Biology 6:91 - 100.
Brown, R. L., and R. K. Peet. 2003. Diversity and invasibility of southern Appalachian plant communities. Ecology 84:32 - 39.
Collier, M. H., J. L. Vankat, and M. R. Hughes. 2002. Diminished plant richness and abundance below Lonicera maackii, an Invasive Shrub. The American Midland Naturalist 147:60 - 71.
Conway, A. J., P. Hartley, N. Galli, D. A. Balfour, and R. A. Howison 2001. Hluhluwe-iMfolozi Park Management Plan. Unpublished Ezemvelo KZN Wildlife Document, Pietermaritzburg.
Crooks, J. A. 2005. Lag times and exotic species: The ecology and management of biological invasions in slow motion. Ecoscience 12:316 - 329.
D'Antonio, C. M., J. Levine, and M. Thomsen. 2001. Ecosystem resistance to invasion and the role of propagule supply: a California perspective. Journal of Mediterranean Ecology 2:233 - 245.
de Neergaard, A., C. Saarnak, T. Hill, M. Khanyile, A. M. Berzosa, and T. Birch-Thomsen. 2005. Australian wattle species in the Drakensberg region of South Africa - An invasive alien or a natural resource? Agricultural Systems 85:216 - 233.
DiVittorio, C. T., J. D. Corbin, and C. M. D'Antonio. 2007. Spatial and temporal patterns of seed dispersal: an important determinant of grassland invasion. Ecological Applications 17:311 - 316.
Doust, L. L. 1981. Population dynamics and local specialization in a clonal perennial (Ranunculus repens) i) The dynamics of ramets in contrasting habitats. Journal of Ecology 69:743 - 755.
Downing, B. H. 1980. Relationships between rock substrate, landform and soil in Umfolozi Game Reserve, as explained for conservation purposes. Lammergeyer 30:32-48.
Erasmus, D. J. 1988. A review of mechanical and chemical control of Chromolaena odorata in South Africa. First International Workshop of Biological Control and Management of Chromolaena odorata, Bangkok, Thailand.
Ewel, J. J., D. J. O'Dowd, J. Bergelson, C. C. Daehler, C. M. D'Antonio, G. L. Diego, D. R. Gordon, R. J. Hobbs, A. Holt, K. R. Hooper, C. E. Hughes, M. LaHart, R. R. B. Leakey, W. G. Lee, L. L. Loope, D. H. Lorence, S. M. Louda, A. E. Lugo, P. B. McEvoy, D. M. Richardson, and P. M. Vitousek. 1999. Deliberate introductions of species: Research needs. Bioscience 49:619 - 630.
Foster, B. L. 2001. Constraints on colonization and species richness along a grassland productivity gradient: the role of propagule availability. Ecology Letters 4:530 - 535.
Foster, B. L., and D. Tilman. 2003. Seed limitation and the regulation of community structure in Oak Savanna grassland. Journal of Ecology 91:999 - 1007.
Foxcroft, L. C., M. Rouget, D. M. Richardson, and S. MacFadyen. 2004. Reconstructing 50 years of Opuntia stricta invasion in the Kruger National Park, South Africa: environmental determinants and propagule pressure. Diversity and Distributions 10:427 - 437.

32
Frenot, Y., L. Gloaguen, L. Masse, and M. Lebouvier. 2001. Human activities, ecosystem disturbance and plant invasions in sub Antarctic Crozet, Kerguelen and Amsterdam Islands. Biological Conservation 101:35 - 50.
Goodall, J. M., and D. J. Erasmus. 1995. Review of the status and integrated control of the invasive alien weed, Chromolaena odorata, in South Africa. Agriculture, Ecosystem and Environment 56:151 - 164.
Goodall, J. M., and D. J. Erasmus. 1996. Review of the status and integrated control of the invasive alien weed, Chromolaena odorata, in South Africa. Agriculture, Ecosystem and Environment 56:151 - 164.
Greyling, T., and B. J. Huntley. 1984. Directory of South African conservation areas. South African National Scientific Programmes Report 98, Foundation for Research Development, Council for Scientific and Industrial Research, Pretoria
Higgins, S., D. M. Richardson, and R. M. Cowling. 2001. Validation of a spatial simulation model of a spreading alien plant population. Journal of Applied Ecology 38:571 - 584.
Higgins, S. I., D. M. Richardson, R. M. Cowling, and T. H. Trinder-Smith. 1999. Predicting the Landscape-Scale distribution of alien plants and their threat to plant diversity. Conservation Biology 13:303 - 313.
Howison, O. E. 1998. The distribution of Chromolaena odorata in Hluhluwe Game Reserve. Unpublished report, Ezemvelo KZN Wildife, Pietermaritzburg.
Howison, O. E. 2001. The distribution of Chromolaena odorata in Hluhluwe Game Reserve. Unpublished report, Ezemvelo KZN Wildlife, Pietermaritzburg.
Hutchinson, T. F., and J. L. Vankat. 1997. Invasibility and Effects of Amur Honeysuckle in Southwestern Ohio Forests. Conservation Biology 11:1117 - 1124.
Janzen, D. H. 1983. No park is an island: increase in interference from outside as park size decreases. Oikos 41:402 - 410.
Joshi, C. 2006. Mapping cryptic invaders and invisibility of tropical forest ecosystems: Chromolaena odorata in Nepal. Ph. D thesis, Wageningen University, Wageningen.
Keane, R. M., and M. J. Crawley. 2002. Exotic plant invasions and the enemy release hypothesis. Trends in Ecology and Evolution 17:164 - 170.
King, L. 1970. The geology of the Hluhluwe Game Reserve. Petros 2:16-19. Kowarik, I. 1995. Time lags in biological invasions with regard to the success and failure
of alien species. Pages 15 - 38 in P. Pyšek, K. Prach, M. Rejmanek, and M. Wade, editors. Plant Invasions: General Aspects and Special Problems. SPB Academic Publishing, Amsterdam.
Kriticos, D. J., T. Yonow, and R. E. McFadyen. 2005. The potential distribution of Chromolaena odorata (Siam weed) in relation to climate. Weed Research 45:246 - 254.
Le Maitre, D. C., B. W. Van Wilgen, R. A. Chapman, and D. H. McKelly. 1996. Invasive plants and water resources in the Western Cape Province, South Africa: modeling the consequences of a lack of management. Journal of Applied Ecology 33:61 - 172.
Leslie, A. J., and J. R. Spotila. 2001. Alien plant threatens Nile crocodile (Crocodylus niloticus) breeding in Lake St. Lucia, South Africa. Biological Conservation 98:347 - 355.

33
Lonsdale, W. M. 1993. Rates of spread of an invading species - Mimosa pigra in northern Australia. Journal of Ecology 81:513 - 521.
Lonsdale, W. M. 1999. Global patterns of plant invasions and the concept of invasibility. Ecology 80:1522 - 1536.
Luwum, P. 2002. Control of invasive Chromolaena odorata : An evaluation in some land use types in KwaZulu-Natal, South Africa. M.Sc thesis, International Institute for Geo-information and Earth Observation, Enschede, the Netherlands.
MacDonald, I. A. W. 1978. A survey of the extent and nature of alien plant infestations in the Central Complex (Feb. – May 1978) with recommendations for their removal. Ezemvelo KZN Wildlife unpublished document.
MacDonald, I. A. W. 1983. Alien trees, shrubs and creepers invading indigenous vegetation in the Hluhluwe-Umfolozi Game Reserve Complex in Natal. Bothalia 14:949 - 959.
Mack, R. N., D. Simberloff, W. M. Lonsdale, H. Evans, M. Clout, and F. A. Bazzaz. 2000. Biotic Invasions: Causes, Epidemiology, Global Consequences, and Control. Issues in Ecology 10:689 - 710.
Matthews, S., and K. Brand. 2004. Africa invaded: The growing danger of invasive alien species. The Global Invasive Species Programme (GISP).
McFadyen, R. E. 1991. The ecology of Chromolaena odorata in the Neotropics. In R. Muniappen, editor. 2nd International Workshop on the biological control and management of Chromolaena odorata, Bogor, Indonesia.
McFadyen, R. E., and B. Skarrat. 1996. Potential distribution of Chromolaena odorata (Siam weed) in Australia, Africa and Oceania. Agriculture, Ecosystems and Environment 59:89 - 96.
McKinney, M. L. 2002. Influence of settlement time, human population, park shape and age, visitation and roads on the number of alien plant species in protected areas in the USA. Diversity and Distributions 8:311 - 318.
Mihulka, S., and P. Pyšek. 2001. Invaion history of Oenothera congeners in Europe: A comparative study of spreading rates in the last 200 years. Journal of Biogeography 28:597 - 609.
Milton, S. J., W. R. Dean, and D. M. Richardson. 2003. Economic incentives for restoring natural capital in southern African rangelands. Front Ecological Environment 1:247 - 254.
Mullerova, J., P. Pyšek, V. Jarosik, and J. Pergl. 2005. Aerial photographs as a tool for assessing the regional dynamics of the invasive plant species Heracleum mantegazzianum. Journal of Applied Ecology 42:1042 - 1053.
Pimental, D., S. McNair, J. Janecka, J. Wightman, C. Simmonds, C. O'Connell, E. Wong, L. Russell, J. Zern, T. Aquino, and T. Tsomondo. 2001. Economic and environmental threats of alien plant, animal and microbe invasions. Agriculture, Ecosystems and Environment 84:1 - 20.
Pyšek, P., J. H. Brock, K. Bimova, B. Mandak, V. Jarosik, I. Koukolikova, J. Pergl, and J. Stephanek. 2003. Vegetative regeneration in invasive Reynoutria (Polygonaceae) taxa: The determinant of invasibiltiy at the genotype level. American Journal of Botany 90:1487 - 1495.
Pyšek, P., and P. E. Hulme. 2005. Spatio-temporal dynamics of plant invasions: Linking pattern to process. Ecoscience 12:302 - 315.

34
Pyšek, P., and V. Jarosik. 2005. Residence time determines the distribution of alien plants. Pages 77 - 96 in Inderit, editor. Invasive Plants: Ecological and Agricultural Aspects. Birkháuser Verlag, Switzerland.
Pyšek, P., and K. Prach. 1993. Plant invasions ands the role of riparian habitats: A comparison of four species alien to central Europe. Journal of Biogeography 20:413 - 420.
Ramakrishnan, P. S. 1992. Shifting agriculture and sustainable development – an interdisciplinary study from North-Eastern India. Man and the Biosphere Series Paris.
Rejmanek, M., and D. M. Richardson. 1996. What attributes make some plant species more invasive? Ecology 77:1655 - 1661.
Richardson, D. M., N. Allsop, C. M. D'Antonio, S. J. Milton, and M. Rejmakek. 2000. Plant invasions – the role of mutualisms. Biological Review 75:65 - 93.
Richardson, D. M., and P. Pyšek. 2006. Plant invasions: merging the concepts of species invasiveness and community invasibility. Progress in Physical Geography 30:409 - 431.
Rouget, M., and D. M. Richardson. 2003. Inferring process from pattern in plant invasions: a semimechanistic model incorporating propagule pressure and environmental factors. The American Naturalist 162:713 - 724.
Rouget, M., D. M. Richardson, S. J. Milton, and D. Polakow. 2004a. Predicting invasion dynamics of four alien Pinus species in a highly fragmented semi-arid shrubland in South Africa. Plant Ecology 152:79 - 92.
Rouget, M., D. M. Richardson, J. L. Nel, D. C. Le Maitre, B. Egoh, and T. Mgidi. 2004b. Mapping the potential ranges of major plants invaders in South Africa, Lesotho and Swaziland using climatic suitability. Diversity and Distributions 10:475 - 484.
Sakai, A. K., F. W. Allendorf, J. S. Holt, D. M. Lodge, J. Molofsky, K. A. With, S. Baughman, R. J. Cabin, J. E. Cohen, N. C. Ellstrand, D. E. McCauley, P. O'Neil, I. M. Parker, J. N. Thompson, and S. G. Weller. 2001. The population biology of invasive species. Annual Review of Ecology and Systematics 32:305 - 332.
Schmid, B., and J. L. Harper. 1985. Clonal growth in grassland perennials. i) Density and pattern-dependent competition between plants with different growth forms. Journal of Ecology 73:793 - 808.
Schulze, R. E., M. Maharaj, B. J. Howe, and B. Melvil-Thomson. 1997. South African Atlas of Agrohydrology and –Climatology. Report TT82/96, Water Research Commission, Pretoria.
Schumaker, N. H. 1996. Using landscape indices to predict habitat connectivity. Ecology 77:1210 - 1225.
Stohlgren, T. J. 2002. Theories of plant invasions: Lessons from natural landscapes. Comments on Theoretical Biology 7:355 - 379.
Turpie, J. K. 2004. The role of resource economics in the control of invasive alien plants in South Africa. South African Journal of Science 100:87 - 93.
Van Wilgen, B. W., and D. M. Richardson. 1985. The effects of alien shrub invasions on vegetation structure and fire behaviour in South African fynbos shrublands: A simulation study. Journal of Applied Ecology 22:955 - 966.

35
Vitousek, P. M., C. M. D'Antonio, L. L. Loope, M. Rejmanek, and R. Westerbrooks. 1997. Introduced species: A significant component of human-caused global change. New Zealand Journal of Ecology 21:1 - 16.
Wangen, R. S., and C. R. Webster. 2006. Potential for multiple lag phases during biotic invasions: reconstructing an invasion of the exotic tree Acer platanoides. Journal of Applied Ecology 43:258 - 268.
Whately, A. J., and R. N. Porter. 1983. The woody vegetation communities of the Hluhluwe-Corridor-Umfolozi Game Reserve. Bothalia 14:745 - 758.
Williamson, M. 1999. Invasions. Ecography 22:5 - 12. Williamson, M. H., and A. Fitter. 1996. The characters of successful invaders. Biological
Conservation 78:163 - 170. Witkowski, E. T. F., and M. Wilson. 2001. Changes in density, biomass, seed production
and soil seed banks of the non-native invasive plant Chromolaena odorata, along a 15 year chronosequence. Plant Ecology 152:13 - 27.
Wolfe, L. M. 2002. Why Alien Invaders Succeed: Support for the Escape-from-Enemy Hypothesis. The American Naturalist 160:705 - 711.
Ye, X.-H. 2006. A trade-off between guerilla and phalanx growth forms in Leymus secalinus under different nutrient supplies. Annals of Botany 98:187 - 191.
Zacharides, C., and J. M. Goodall. 2002. Distribution , impact and management of Chromolaena odorata in southern Africa. Pages 34 - 39 in C. Zacharides, R. Muniappen, and L. W. Strathie, editors. Fifth international workshop on the biological control and management of Chromolaena odorata. Plant Protection Research Institute, Agricultural Research Council, Pretoria, South Africa.

36
Not
e: C
olum
n 1
is th
e ye
ar, c
olum
n 2
indi
cate
s th
e nu
mbe
r of
cel
ls n
ewly
inva
ded
each
yea
r, c
olum
n 3
is th
e cu
mul
ativ
e nu
mbe
r of
cel
ls in
vade
d,
colu
mn
4 is
the
num
ber
of u
ninv
aded
cel
ls in
vade
d th
roug
h ph
alan
x in
vasi
on, c
olum
n 5
is th
e nu
mbe
r of
cel
ls in
vade
d th
roug
h gu
erill
a in
vasi
on,
colu
mn
6 is
the
tota
l num
ber
of u
ninv
aded
cel
ls, c
olum
n 7
is th
e nu
mbe
r of
cel
ls a
djac
ent t
o an
exi
stin
g in
fest
atio
n th
at a
re s
till c
lear
, co
lum
n 8
is
the
num
ber
of c
ells
not
adj
acen
t to
exis
ting
inva
ded
cells
that
bec
ome
are
still
cle
ar, c
olum
n 9
is th
e nu
mbe
r of
cel
ls e
xpec
ted
to b
e in
vade
d by
ph
alan
x in
vasi
on, c
olum
n 10
is th
e nu
mbe
r of
cel
ls e
xpec
ted
to b
e by
gue
rilla
inva
sion
, col
umn
11 a
nd 1
2 gi
ve th
e ch
i-squ
are
valu
e fo
r th
e ad
jace
nt
and
disc
rete
ly in
vade
d ce
lls r
espe
ctiv
ely,
and
col
umns
13
and
14 in
dica
te th
e pe
rcen
tage
of a
djac
ent a
nd d
iscr
ete
cells
that
wer
e in
vade
d, a
s a
perc
enta
ge o
f the
num
ber
cells
that
wer
e cl
ear
in th
e pr
evio
us m
appi
ng e
vent
.
App
endi
x 2.
1:
Ana
lysi
s of
inva
sion
of c
ells
adj
acen
t to
exis
ting
infe
stat
ions
and
cel
ls d
iscr
ete
(not
adj
acen
t) to
exi
stin
g in
fest
atio
ns

37
CHAPTER 3: USING REMOTE SENSING, LOGISTIC REGRESSION AND GEOGRAPHIC INFORMATION SYSTEMS TO MAP INVASIVE ALIEN PLANTS AND ASSESS IMPACTS ON BIODIVERSITY CONSERVATION: A STUDY ON CHROMOLAENA ODORATA IN KWAZULU-NATAL, SOUTH AFRICA
O. Howison, R. Slotow, H. Olff
ABSTRACT Since the advent of satellite imagery in 1972, there has been an increasing use of Geographic Information Systems (GIS) and remote sensing to map the distribution of, and to assess the effects of, invasive alien species. In KwaZulu-Natal, South Africa, the alien plant Chromolaena odorata is the worst threat to biodiversity in protected areas at this moment, but remote sensing methods to map its distribution are not available yet for this region. In this paper we use a supervised classification of a 2001 LandSat 7 image to detect Chromolaena odorata in northeastern KwaZulu-Natal, South Africa, and validated the method using ground-truthing. In addition, we used data from Hluhluwe Game Reserve, where both the distribution of the species was mapped on the ground and GIS layers of key environmental factors such as climatic variables, distances from roads and rivers and normalized differential vegetation indices were collected, to predict C. odorata occurrence from these variables using a multiple regression model. This model was applied to regional maps of the predictive factors to obtain a map of the expected distribution, which was ground-truthed. We then combined the supervised classification and multiple regression model to produce one expected distribution map, and tested its accuracy using ground-truthing. Once the likely distribution was established, we used a regional vegetation map to assess the extent of C. odorata invasion in the twenty three vegetation types found in the study area. Ten vegetation types were found to be preferentially invaded, of which seven were of important conservation concern. Some of the most endangered vegetation types are being conserved in formally protected areas, but this is no guarantee of successfully conserving biodiversity, as our results illustrate that formally protected areas are prone to invasion. To fully assess the extent and progression of the invasion, the distribution of C. odorata needs to be assessed at the larger scale of southern Africa.
KEYWORDS Climate matching, predictive modeling, invasive alien plants, Hluhluwe Game Reserve

38
INTRODUCTION Invasive alien plants have numerous impacts on natural and human-modified ecosystems, including habitat simplification and loss of biodiversity (McKinney & Lockwood 1999), changes in fuel loads and fire regimes (MacDonald 1983; Van Wilgen & Richardson 1985), and hydrological changes (Le Maitre et al. 1996; Le Maitre et al. 2000). To prevent the arrival of invasive alien plants would be the most effective way to preclude their negative impacts but, where they have already been introduced, control actions (biological, chemical, mechanical) are required (Higgins et al. 1999). Many authors describe the importance of disturbance, land use changes and fragmentation to promote alien plant invasion (Alston & Richardson 2006; Brothers & Spingarn 1992; Chabrerie et al. 2008; Didham et al. 2007). However, protecting areas through inclusion in reserves does not prevent invasion, as many factors that drive invasion outside reserves are present in reserves through management practices or natural processes (Vila & Pujadas 2001). It is also recognized that many forms of disturbance are required by plant communities and species for their regeneration, and moderate frequencies or intensities of disturbance are required to maintain maximum diversity, but these same disturbances may provide opportunities for alien plant invasion (Hobbs & Huenneke 1992). This is a cause for concern, as the preservation of natural areas are important for conserving biodiversity (Higgins et al. 1999). To assess and prioritise areas where control actions are needed, assessments of current and potential distributions, as well as assessments of possible impacts are required (Joshi 2006). Prior to 2000, few studies were undertaken at the landscape scale to assess current and future risks to biodiversity (White et al. 1997). More recently a number of studies have been undertaken using remote sensing (Asner et al. 2008; Joshi et al. 2006; Tsai & Chou 2006), and spatial modeling (Dark 2004; Gillham et al. 2004; Higgins et al. 1999; Robertson et al. 2004; Underwood et al. 2004) to assess current and potential distribution of alien plants. Once the current and potential distribution of invasive alien plants has been assessed, studies of impacts at a landscape scale can also be undertaken (Dark 2004; Higgins et al. 1999; Underwood et al. 2004). Various methods have been developed to enable remote sensing and spatial modeling to determine or predict alien plant distributions. When the target species is dominant in the canopy, it is possible to map using standard remote sensing techniques (Bradley & Mustard 2005), or hyperspectral imagery (Asner et al. 2008), however when the target species is not dominant in the canopy, it becomes more difficult to identify (Joshi 2006). In such situations, spatial modeling has been used to determine where an invasive alien plant is likely to occur. One of the first spatial modeling techniques was CLIMEX, which has been used to perform climatic matching for both animals and plants (Kriticos et al. 2005; McFadyen & Skarrat 1996; Sutherst & Maywald 1985). The development of new fine-scale climatic data sets and refined modeling tools has improved the predictive power of this approach, but it has limitations that can appear as false positives and false negatives (Guisan & Thuiller 2005). The former occurs when environmental variables other than climate exclude the species, while false negatives occur if a species potential distribution has not been fully realized (Thuiller et al. 2005). Since the development of CLIMEX, other methods of spatial modeling have been developed, including multiple logistic regression (Higgins et al. 1999), Genetic Algorithm for Rule-set Production (GARP) (Underwood et al. 2004), Fuzzy Envelope Model (FEM) (Robertson et al. 2004), Weed Susceptibility Prediction (WISP) (Gillham et al. 2004) and spatial regression analysis (Dark 2004). These models may be poor in predicting the presence of invasive alien plants outside natural vegetation as the predictor variables may not

39
adequately model invasive alien plant distributions where there are changes in land use and human-induced disturbances (Rouget et al. 2004). Some authors have explored the possibility of integrating remote sensing and spatial modeling (Bradley & Mustard 2005; Rouget et al. 2003). For example, Bradley and Mustard (2005) used remote sensing to identify existing cheatgrass (Bromus tectorum) infestations in northern Nevada, and seven Geographic Information System (GIS) data sets (elevation, aspect, slope, distance to hydrographic channel, cultivated areas, distance from roads, distance from power lines) and previously invaded areas to run a multi-criteria evaluation (MCE) to identify areas that were at risk of invasion. In this study we mapped the distribution of the invasive alien plant Chromolaena odorata (L.) R.M King & H. Robinson (= Eupatorium odoratum L, Asteraceae). It is a particularly difficult plant to map, as it is a very adaptable plant and occurs in a variety of natural and altered habitats, often in very remote or inhospitable terrain (Erasmus 1985, 1988; Goodall & Erasmus 1996; Liggitt 1983). Distribution is affected by land use and land-cover. Luwum (2002) and Feleke (2003) found that land that is being cropped intensively, mainly for sugarcane (Saccharum spp.) has very little C. odorata, possibly due to land preparation before crop establishment, weed control operations and competition from the crop, while land under commercial forestry is managed to reduce C. odorata competition during the early stages before canopy closure. High levels of C. odorata invasion were observed in old plantations and areas recently clearfelled (Feleke 2003). In both sugarcane and plantations, little control is undertaken in areas such as road verges and watercourses that are not being commercially managed which may facilitate the invasion of natural vegetation and protected areas (Feleke 2003). Chromolaena odorata may be dominant, co-dominant, sub-dominant or cryptic in the uppermost vegetation canopy, depending on the type of vegetation being invaded (Joshi et al. 2006). To rely solely on supervised classification of passive remotely sensed images to map C. odorata will underestimate distribution and density, as sub-dominant or cryptic infestations will not be detected (Joshi et al. 2006). To map the extent of the invasion we used supervised classification of a remotely sensed Landsat image and multiple logistic regression (Higgins et al. 1999), and a combination of these two methods. We used separately collected reference points to test which method produced the most accurate result. Once the distribution of C. odorata was established, we used existing GIS data sets of biodiversity conservation status (Anon 2007a) and vegetation types in the study area (Mucina & Rutherford 2006) to determine the levels of invasion according to biodiversity conservation status and vegetation type, and determine whether invasion is random or selective.
METHODS Chromolaena odorata was first identified in Hluhluwe Game Reserve in 1961 (MacDonald 1983) and general invasion into our study area occurred in the 1970s, after being introduced into South Africa through Durban harbour in the mid-1940s and spreading rapidly along the KwaZulu-Natal coastline (Goodall & Erasmus 1996). C. odorata distribution data from Hluhluwe Game Reserve (27059’55” – 3200’30”S and 31053’09” – 3200’56”E), 260 km2 in extent, (Howison 1998, 2001)were used to develop our distribution model (Figure 3.1 (C)). The C. odorata distribution in these studies was determined by walking preplanned routes to provide visual cover of the entire study area. C. odorata distribution was mapped onto field maps with a second x second grid. A

40
GPS was used to ensure accurate spatial location in the field. The C. odorata distribution was then digitized and incorporated into the Hluhluwe-iMfolozi Park GIS. Field mapping was done in mid-winter, at a time when many plants were dormant, but C. odorata was still green (Howison, 1998; Howison, 2001). These distribution data were then used to map the extent of C. odorata across LandSat 7 Path 167 Row 80 (20th March 2001) (27054’44.5” – 29032’07” S and 31013’04” – 32033’50”), within the province of KwaZulu-Natal, South Africa (10 241 km2) (Figure 3.1).
Supervised classification Image preparation consisted of acquiring a LandSat image from 20 March 2001, which is the same year for which we had C. odorata distribution data. This image was ortho-rectified using Leica Photogrammetry Suite, using high resolution black and white images from the South Africa Chief Directorate: Survey and Mapping and a 25 x 25 metre Digital Elevation Model (DEM) developed by the KwaZulu-Natal Department of Agriculture’s Natural Resources Section to define Ground Control Points and elevation. The raw digital numbers of the ortho-rectified image were then converted to radiance at the satellite, using the following formula:
satsatsat
sat LMINDNDNDNDN
LMINLMAXL +−×
−−= )(
)()(
minminmax
,
where LMAXsat is band-specific spectral radiance scaled to DNMax (Wm−2 sr−1 µm−1), LMin sat is band-specific spectral radiance scaled to DNMIN (Wm−2 sr−1 µm−1), DNmax is maximum quantized calibrated digital number (255), and DNmin is minimum-quantized calibrated digital number (0 for LPGS data, 1 for NLAPS data) (Anon 2007b). The image was then processed with the Erdas Image module ATCOR Workstation 3 to remove haze and to perform an atmospheric correction to convert the image to land surface reflectance. Some of the dense stands mapped in 1998 and 2001 (Howison 1998, 2001), where C. odorata was dominant in the upper canopy, were used to develop a spectral signature. Stands chosen were in different vegetation types and had no shading due to relief. We used areas of Hluhluwe Game Reserve with no dense stands to develop a spectral signature for vegetation types without C. odorata, giving a supervised classification training set consisting of two classes, C. odorata vs. No C. odorata. We then used Erdas 9.x to perform a supervised classification of our LandSat image to identify other areas where C. odorata was dominant. We encountered a problem when we found that the spectral signature for C. odorata developed from the training set was very similar to that for sugar cane (Saccharum spp.), a common agricultural crop. We used a land cover study that used SPOT images from 2005 (Thompson 2008) to mask land cover where C. odorata distribution is influenced positively or negatively by land use practices, including intensive cultivation (sugar cane and other crops), areas of plantation forestry and urban and rural developments, rather than natural processes (Feleke 2003; Luwum 2002).

41
Figure 3.1: Location of the study site showing (A) The location of South Africa on the African Continent with the potential distribution of C. odorata at a Continental scale (Kriticos et al. 2005), (B) The location of KwaZulu-Natal within South Africa, with the potential distribution of C. odorata at a national scale, (Kriticos et al. 2005) and (C) The location of the study site (LandSat Path 167 Row 80) within KwaZulu-Natal, with the location of Hluhluwe Game Reserve, and the invasion history (Goodall & Erasmus 1996). We then performed a supervised classification and fuzzy convolution consisting of two classes (C. odorata vs. no C. odorata) on the remaining area, using Erdas 9.x. The supervised classification was done using a parallel-pipe non-parametric rule, while Maximum Likelihood was specified for the parametric rule, and a distance file was generated. The output generated was a fuzzy classification consisting of the two best classes per pixel. Erdas 9.x was then used to refine the fuzzy classification, using a fuzzy convolution operation that creates a single classification band by calculating the total weighted inverse distance of all the classes in a 3 X 3 window of pixels and assigning the centre pixel the class with the largest total inverse distance summed over the entire set of fuzzy classification bands. Classes with a very small distance value remain unchanged, while classes with higher distance values may be changed to a neighbouring value if there are sufficient number of neighbouring pixels with class values and small corresponding distance values (Anon 2009).

42
Figure 3.2: Diagrammatic representation of the workflow. The blue boxes represent raster images, while the green boxes represent calculations or operations performed. In most cases, each operation results in a temporary or intermediate raster image.
Multiple regression modeling As C. odorata was first identified in Hluhluwe Game Reserve in 1961 (MacDonald 1983), and was widespread in the region in the 1970s (Goodall & Erasmus 1996), there is a high probability that, given its efficient seed dispersal mechanisms, it has penetrated all the suitable habitat available for invasion in the study area. Known C. odorata distribution was mapped in Hluhluwe Game Reserve in 1998 and 2001 (Howison 1998, 2001). In these mapping exercises, “dense stands” were classified as those where a visual estimate of above ground cover of C. odorata was 75% or more. Although the strength of predictive models may be improved by including known absence data, in Hluhluwe Game Reserve only the known presence of C. odorata was mapped, precluding the use of absence data, as models may be misled by false absences (Brotons et al. 2004; Hirzel et al. 2001). We used these known distribution of dense stands to determine the factors that contribute towards C. odorata invasion, as follows:- We used Hawth’s Analysis Tools for ArcGIS (Beyer 2004) to create a grid of points at regular intervals 500 m apart to sample the environment within Hluhluwe Game Reserve (Figure 3.4).
2001 LandSat Image
Ortho-rectification
Atmospheric correction
Conversion to radiance at satellite
Supervised classification on remaining area of interest
Signal Development: C. odorata vs. No C. odorata Signal similarity with sugar
Remove land cover where management limits C. odorata invasion
Fuzzy convolution
Distribution map from supervised classification
Accuracy assessment

43
We identified the following GIS data sets that potentially influence C. odorata distribution over the study area: (1) annual precipitation (Schulze et al. 1997); (2) water stress in January (Schulze et al. 1997); (3) water stress in July (Schulze et al. 1997); (4) heat units from April to September (Schulze et al. 1997); (5) heat units from October to March (Schulze et al. 1997); (6) daily mean temperature (Schulze et al. 1997); (7) mean annual temperature (Schulze et al. 1997); (8) altitude (from a Digital Elevation Model (DEM) with a 30 X 30 m raster resolution of KZN generated by the KZN Department of Agriculture and Environmental Affairs’ Natural Resource Section, using 20 m contour intervals from Chief Director: Survey and Mapping, Mowbray, Cape Town; (9) solar radiation for 21 December (mid summer), calculated using ArcMap 9.x Spatial Analyst Area Solar Radiation tool and the DEM listed above, which yielded a 30 X 30 m raster with the potential solar radiation for each pixel; (10) public and tourist roads were digitized from 1 : 50 000 topo-cadastral maps and the distance from the nearest road was calculated using ArcMap 9.x Spatial Analyst extension; (11) perennial rivers were digitized from 1 : 50 000 topo-cadastral maps and the distance from the nearest river was calculated using ArcMap 9.x Spatial Analyst extension; (12) seasonal streams and watercourses were digitized from the 1 : 50 000 topo-cadastral maps and the distance from the nearest seasonal stream or watercourse calculated using ArcMap 9.x Spatial Analyst Extension; and (13) Normalized Differential Vegetation Index (NDVI) for March 20th 2001, calculated from the previously mentioned LandSat image; (14) NDVI for 1973, calculated from a LandSat image taken on 29th January 1973 and ortho-rectified using Leica Photogrammetry Suite. For these variables, including C. odorata presence, we used principal components analysis (PCA) (Statistica v. 7.x) to investigate the relationships between the variables. The first seven climatic variables are determinants that affect plant species’ germination, growth and performance, as most plants have a range of climatic conditions beyond which they are unable to grow, an association that is well known (Woodward 1987), as cited by Kriticos et al. (2005). Frost occurrence was also initially included, but frost rarely if ever occurs in Hluhluwe Game Reserve (MacDonald 1983; Schulze et al. 1997), and so was excluded. These variables were derived by extrapolation from national weather stations, to a resolution of 1 minute by 1 minute (Schulze et al. 1997), which in the study area is approximately 1.7 km2. Altitude is a variable that has no direct effect on plant distribution, i.e. there is no physiological effect, but has an indirect effect through location-dependent correlation with other climatic variables, such as temperature and rainfall (Austin 2002). Potential solar radiation (determined mainly by aspect) also has an impact on plant communities (Wiser et al. 1996), and was included instead of aspect, as aspect is a circular measurement and difficult to incorporate in a model where all other variables are continuous. Rivers and roads have been cited as routes of seed dispersal as well as disturbance, which can facilitate invasion through removal or disturbance of potentially competitive indigenous vegetation (Holmes et al. 2005; Van Gils et al. 2006). The NDVI’s for 2001 and 1973 were calculated from LandSat 7 and LandSat 1 images respectively. The NDVI is the standardized difference in reflection between the near infra red (NIR) and red (R) bands of a satellite image, and is a measure of the amount of photosynthetic activity of an area (NDVI = (NIR-R)/(NIR+R)) (Anon 2007b) . Where there is greater photosynthesis, light in the red band is absorbed, so the reflectance value is lower, while reflectance in the near infra-red band remains the same. As a result, with increasing photosynthetic activity, the NDVI increases (Anon 2007b). There is a strong relationship between NDVI and vegetation structure. Gamon et al. (1995) found that the NDVI for evergreen trees and shrubs in California ranged between 0.5 – 0.9, semi-deciduous shrubs 0.3 – 0.6 and for annual grasslands 0.2 – 0.5 over a 16 month period, with consistent differences from one month to the next. Vegetation structure is also an indication of the amount of shading at ground level at a specific location, a variable that is not measured through solar radiation, and light intensity is important for C. odorata germination, growth and seed production (Feleke 2003; Joshi 2006; Joshi et al. 2006; Norbu 2004). The January 1973 NDVI

44
Precipitation Water stress: January
Altitude Solar radiation Road distance
Pem. river distance
NDVI 1973
NDVI 2001
Stepwise Logistic Regression on
point data Significant factors: Precipitation, Temperature, Heat Units Oct. – Mar, Heat Units Apr. – Sep, 2001 NDVI, 1973 NDVI
Precipitation 2001 NDVI
Calculate probability of C. odorata
Probability of occurrence map Supervised
Overlay probability map with Supervised classification map
C. odorata Distribution Map
Accuracy Assessment
Create grid of points at 500 m intervals
C. odorata distribution map
Extract values of data sets to the
points
Water stress: July
Heat units: April – Sep.
Heat units: Oct. - Mar.
Temperature Temp. River distance
1973 NDVI
Temperature Heat units: April – Sep.
Heat units: O.ct. - Mar.
was included as a measure of vegetation structure when C. odorata started invading the study area (Goodall & Erasmus 1996), noting that some vegetation types are more susceptible than others, particularly in the early stages of invasion (Chapter 2). Fire is a factor that can facilitate or control invasion. In grasslands of KwaZulu-Natal, South Africa, Goodall and Erasmus (1996) found that, in a dense stand of C. odorata, felling mature shrubs, leaving them to dry and then applying repeated annual fires reduced invasion to such an extent that, at the end of the study, C. odorata was absent in the transects. This was confirmed by an experiment with differing fire treatments in invaded C. odorata stands in Hluhluwe-iMfolozi park (M. te Beest, H. Olff et al., in prep). Further, Mbalo and Witkowski (1997) found that seeds in the soil had little tolerance to high sub-surface temperatures induced by intense fire. In contrast, Honu and Dang (2002) reported that a single severe fire in a deciduous woodland allowed C. odorata to invade. Within Hluhluwe Game Reserve there are data sets on annual fires from 1955 - 2001 (Balfour & Howison 2001), but such data are not available for the entire study site, and so were not included in our analysis.
Figure 3.3: Diagrammatic representation of the workflow. The boxes in blue represent spatial datasets (raster or vector), while the green boxes represent calculations or operations performed.

45
We overlaid the grid of points on all of the above data sets as well as the distribution of C. odorata, and for each point used ArcGIS 9.x to assign all of the above attribute data to each point, and imported the resultant DBF file into SPSS 15.0 for further analysis. With any time series analysis or change detection using raster data, it is important that common features in all images overlay exactly (for example, pixels denoting a rocky outcrop in image 1 must have exactly the same geographic co-ordinates as in image 2), as failure to ensure that this is the case may lead to the false identification of change (Jensen et al. 1995).We used Leica Photogrammetry Suite 9.x to perform an ortho-rectification on a LandSat 7 image from 20 March 2001 and on a LandSat 1 image from 29 January 1973. Points where dense C. odorata were present were assigned a presence of 1, while points where there was no C. odorata were assigned a value of 0. We analyzed the data set with backward stepwise logistic regression in SPSS 15.0, to determine which of the factors listed above contributed to the formation of dense stands of C. odorata. We masked the areas where the landcover is no longer in a natural or near-natural state (Feleke 2003; Luwum 2002), using data from Thomson (2008). The application of the relevant variables to the appropriate data sets resulted in a C. odorata occurrence probability map with values ranging between 0 and 1, with values close to 0 indicating very low probability and values close to 1 indicating very high probability of C. odorata presence. Selecting a probability at which to accept a species presence can influence model outcome, as decreasing the probability determining occurrence increases positive prediction error (Manel et al. 1999). We reclassed the probability map five times, to produce five separate C. odorata distribution maps, Map 1: C. odorata probability > 0.5; Map 2: C. odorata probability > 0.6; Map 3: C. odorata probability > 0.7; Map 4: C. odorata probability > 0.8 and Map 5: C. odorata probability > 0.9, and to determine which level of probability best fitted the actual distribution of C. odorata, we calculated a Kappa statistic for each map. Each of these maps was then overlaid with the results of the supervised classification, to test whether a combination of the two methods could produce a better C. odorata distribution map than the supervised classification and each of the probability maps on their own.
Accuracy Assessment (ground-truthing) We used independent data collected throughout the study area to perform an accuracy assessment and calculate a Kappa statistic for checking the supervised classification, the five probability maps and the five combinations. These independent data were collected in one of two ways. We performed road transects through the study area, covering the national road (N2) as well as some regional and district roads. We stopped every 10 km and recorded the GPS location, took photographs of the vegetation/land use on both sides of the road and recorded whether any C. odorata was visible from the road, and, if so, an estimate of density. Density was estimated as light (only a few isolated plants present), medium (either isolated but well developed individuals or small clumps of young plants < 5 m in diameter) or dense (large numbers/area with a closed canopy and mature individuals). In his project on land cover of KwaZulu-Natal, Thompson (2008) collected a large number of points to verify the accuracy of his classification. For each point he recorded a GPS position and took a photograph. We were able to use these data to generate additional points on C. odorata distribution in the study area. These data were used to

46
generate 256 points for assessing classification accuracy as described by Thompson (2008). Points which fell in areas with altered landcover (crops, plantations, etc.) were removed, leaving a total of 162 points.
Figure 3.4: Location of points for extracting data for Stepwise Linear Regression, with points generated to perform logistic regression analyses. C. odorata distribution maps (1998 and 2001) were obtained from Howison (1998) and Howison (2001).
· . · . · . · . N · . '-00
A ROU' .. ..,., """,10
~.-- D Hluhluwe GaIM Re_ O ,., ,
" _ CI!romoI_ """"US

47
For each of these points, the expected presence of C. odorata from the supervised classification, the five probability maps and the five combination maps was extracted using ArcMap 9.x and a Kappa statistic generated for the eleven maps according to the formula (Congalton 1991):
∑
∑ ∑=
=++
= =+
×−
×−
r
iii
r
i
r
iiiij
xxN
xxxN
K
1
2
1 1
)(
)(
Where N is the product of marginal totals r is the number of rows and columns in the error matrix xij is the number of observations in row I and column I xi+ is the marginal total of row I
x+i is the marginal total of column I The following threshold values have been proposed by Monserud and Leemans (1992) to differentiate degrees of agreement: < 0.05 – No agreement; 0.05 to 0.20 – Very poor agreement; 0.20 to 0.40 – Poor agreement; 0.40 to 0.55 – Fair agreement; 0.55 to 0.70 – Good agreement; 0.70 to 0.85 – Very good agreement; 0.85 to 0.99 – Excellent agreement; 0.99 to 1 – Perfect agreement. We also calculated Error Matrices and Accuracy Assessment tables for each of the maps produced (Congalton 1991), which provides an indication of how well a classification has been done.
Extent of Invasion on Vegetation Types We intersected the area invaded by C. odorata identified from our study, (i.e. overlaying the supervised classification with the probability map of C. odorata > 0.7) with the vegetation types from Mucina and Rutherford (2006), and used a Chi-square test to determine which of these vegetation types were more susceptible to invasion, and used information from the same reference to determine whether vegetation types that are poorly protected were more at risk of invasion.
Impact on Biodiversity Conservation In the biodiversity conservation data set (Anon 2007a), the entire study site has been divided into land units, and the conservation value of each land unit has been determined to be one of the following: (1) Transformed (for example intensive agricultural cropping, timber, urbanization): low value for biodiversity conservation; (2) Low value – land units that have not been transformed but no known rare species or plant communities are known or expected to occur; (3) Irreplaceable – land units within which one or more rare or endangered species or plant communities occur, and, if lost or transformed, would seriously diminish that species or communities’ chance of survival; (4) Reserve – land units that have been proclaimed as nature or game reserves in terms of national or provincial legislation. We used ArcMap to intersect the areas that were identified as being invaded using the methods described above with the biodiversity conservation dataset (Anon 2007a). We then tested whether invasion is spread evenly across all conservation priorities, or whether areas with some

48
conservation values are more at risk than others, using chi-square tests for each conservation value (Proclaimed reserve, irreplaceable, low value, transformed vs. area of C. odorata).
RESULTS
Supervised classification The results of the supervised classification identified 223.7 km2 of infestations within the study area (Figure 3.5), out of a total of 6 808.31 km2.
Figure 3.5: Results of image preparation and supervised classification. (A) Ortho-rectified image converted to at satellite radiance, in W.m-2.ster-1.m-1. (B) Image with atmospherically corrected, haze and shade removed. (C) Results of supervised classification, indicating that there is 223.7 km2 of C. odorata.
Multiple regression modeling Three PCA axes (PCA I, PCA II and PCA III) explained 62% of the total variation between the variables chosen to explain C. odorata presence and C. odorata itself (Figure 3.6). Comparing PC I and PC II (Figure 3.6 A) indicates that, apart from Heat Units, most variables are not highly correlated with each other. C. odorata is best predicted using PC II and PC III, (Figure 3.6 B),

49
which indicates that C. odorata presence is correlated to high NDVI values, elevation and water stress, and lack of presence is explained by other climatic variables. Distance from roads and small rivers do not appear to have any influence on C. odorata presence, despite the importance of these for propagule dispersal (Blackmore 1998). The Omnibus Tests of Model Co-efficients from the SPSS multiple regression statistics to predict C. odorata occurrence from environmental factors took seven steps, the final step indicating that any further removal of factors would not decrease the Chi square value, and the final Wald Chi Square value is 217.3, df = 9, p > 0.001. From this model, the following variables that contributed to C. odorata presence were established, and the following equation was applied to the appropriate data sets to calculate a probability map for C. odorata: Y = EXP(15.295 – 0.006 * Precipitation – 0.594 * daily mean temperature – 0.308 * water stress in January + 0.01 winter heat units + 0.007 * summer heat units – 0.98 * mean annual temperature + 8,565 1973 NDVI + 8.219 2001 NDVI) / 1 + EXP(15.295 – 0.006 *Annual precipitation – 0.594 * daily mean temperature – 0.308 * water stress in January + 0.01 winter heat units + 0.007 * summer heat units – 0.98 * mean annual temperature + 8,565 1973 NDVI + 8.219 2001 NDVI to obtain a probability map of C. odorata occurrence. This probability map was then reclassed five times to produce five potential distribution maps, and each of these was then overlaid with the supervised classification. Distance from roads was not included as the B-value had less than three significant digits (<0.0005).
Figure 3.6: Results of PCA, indicating that most variables other than heat units are not highly correlated to each other (A) and that C. odorata presence is best explained by water stress and NDVI, and absence is mostly explained by other climatic variables (B)

50
Accuracy Assessment The error matrix, confusion tables and calculation of the Kappa co-efficient for the supervised classification, five probability maps and the combinations of supervised classification and probability maps are presented in Tables 3.2 and 3.3. These assessment indicates that combining the supervised classification with a C. odorata probability of > 0.7 gave the highest correlation between the ground truth data and the classification with a Kappa co-efficient of 0.44, although the probability of C. odorata > 0.5 and > 0.6 combined with the supervised classification both yielded a Kappa co-efficient of 0.43 (Table 3.3). The difference in the estimate of the invaded area between the two estimates is 681 km2. This indicates that between 1 588 km2 (Probability > 0.7 Union Supervised Classification) and 2 268 km2 are invaded by C. odorata in the study area (Table 3.1 and Figure 3.7). The Producer’s Accuracy, also called Omission Error, is an indication of how well the image was classified, while the User’s Accuracy, also called Commission Error, is an indication of the probability that, if a person were to visit a classified area, that it will be what the classification indicates (Congalton 1991). In our particular case, using Table 3.4 as an example, if a person were to visit 100 points that were mapped as having C. odorata, C. odorata would be there in 72.2 cases (User’s Accuracy). However, it is likely that there are a number of areas that should be mapped as having C. odorata, which are in fact mapped as clear, as the Producer’s Accuracy is 52.3%, an indication that the extent of invasion may be worse than what has been identified.

51
Table 3.1: Classification Table indicating level of accuracy of prediction. Zero indicates points with no C. odorata, 1 indicates points with C. odorata.
Observed Predicted Infested
Percentage Correct
0 1 Step
1 0 874 26 97.1
Infested
1 147 30 16.9 Overall Percentage 83.9
Step 2
0 874 26 97.1
Infested
1 148 29 16.4 Overall Percentage 83.8
Step 3
0 872 28 96.9
Infested
1 144 33 18.6 Overall Percentage 84.0
Step 4
0 871 29 96.8
Infested
1 143 34 19.2 Overall Percentage 84.0
Step 5
0 872 28 96.9
Infested
1 146 31 17.5 Overall Percentage 83.8
Step 6
0 873 27 97.0
Infested
1 145 32 18.1 Overall Percentage 84.0
Step 7
0 872 28 96.9
Infested
1 145 32 18.1 Overall Percentage 83.9
Table 3.1 indicates that the final model is able to correctly predict 83.9 % of the points. The greater majority of this percentage is comprises of correctly identifying points where C. odorata is unlikely to be found, which in itself is important information. Of the 145 points observed to have C. odorata, the model was able to correctly predict 32, or 18.1%.

52
Table 3.2: Variables in the equation for Step 7
B S.E. Wald df Sig. Exp(B) 95.0% C.I. for Exp(B) Lower Upper Lower Upper Lower Upper Lower Upper
Annual precipitation -.006 .002 11.17 1 .001 .994 .990 .997 Daily mean temperature -.594 .273 4.730 1 .030 .552 .323 .943 Water stress in January -.308 .089 11.890 1 .001 .735 .617 .876 Heat Units April to September
.010 .005 4.670 1 .031 1.010 1.001 1.020
Heat Units October to March .007 .003 6.340 1 .012 1.007 1.002 1.010 Mean annual temperature -.980 .470 4.360 1 .037 .375 .149 .942 1973 NDVI 8.570 1.220 49.340 1 .000 5247.100 480.780 57266.100 Distance from roads <0.0005 .000 2.690 1 .101 1.000 .999 1.000 2001 NDVI 8.220 2.030 16.360 1 .000 3710.600 69.120 199197.600
Step 7(a)
Constant 15.30 9.880 2.400 1 .122 4389320.800
Table 3.3: Summary of the Kappa statistics for the various combinations of C. odorata distribution
Model Kappa co-efficient
Area invaded (km 2)
Supervised classification 0.14 224 Probability > 0.5 0.39 2268. Probability > 0.6 0.34 1909 Probability > 0.7 0.33 1544 Probability > 0.8 0.26 1145 Probability > 0.9 0.20 669
Probability > 0.5 /Supervised classification 0.43 2268 Probability > 0.6 / Supervised classification 0.43 1928 Probability > 0.7 Supervised classification 0.44 1588 Probability > 0.8 Supervised classification 0.38 1224 Probability > 0.9 Supervised classification 0.33 801

53
Table 3.4: Level of accuracy of the areas that are predicted to be invaded, as verified by groundtruthing: Error matrix for Probability > 0.7 map combined with the supervised classification versus the ground truthed locations
Ground-truthed Reference Data
Classified data No C.
odorata C. odorata present Total No C. odorata 87 31 118
C. odorata present 10 34 44
Total 97 65 162
Class Name Reference
Totals Classified
Totals Number Correct
Producer's Accuracy
(Percentage)
User's Accuracy
(Percentage) No C. odorata 97 118 87 89.7 73.7
C. odorata present 65 44 34 52.3 72.2 Total 162 162 121
Overall classification accuracy = 74.7 % Note: Column 1 provides the Class Name of each supervised classification class; Column 2 is the field data from the accuracy assessment points; Column 3 is the result from the supervised classification at each accuracy assessment point; Column 4 is the number of points that were correctly classified; Column 5, the Producer’s accuracy, is the number of points correctly classified as a percentage of Column 2; Column 6, the User’s accuracy, is the number of points correctly identified as a percentage of Column 3; The Overall Classification Accuracy is the total number of correct points as a percentage of the total number of points. Table 3.5: Level of accuracy of the areas that are predicted to be invaded, as verified by groundtruthing: Error matrix for Probability > 0.5 map combined with the supervised classification versus the ground-truthed locations
Reference data
Classified data No C.
odorata C. odorata
Total No C. odorata 80 26 106
C. odorata 17 39 56 Total 97 65 162
Class Name Reference
Totals Classified
Totals Number Correct
Producer's Accuracy
(Percentage) User's Accuracy
(Percentage) No C. odorata 97 106 80 82.5 75.5
C. odorata 65 56 39 60.0 69.6 Total 162 162 108
Overall accuracy assessment = 66.7%

54
Figure 3.7: Results of mapping: (A) C. odorata probability map from logistic regression, reclassed into two classes: Probability 0 to 0.5 = 0, Probability 0.5 to 1 = 1; (B) C. odorata probability map from logistic regression, reclassed into two classes: Probability 0 to 0.7 = 0, Probability 0.7 to 1 = 1; (C) Combination of (A), (B) and Figure 3.5 (C), showing the distribution of C. odorata from the supervised classification and where the probability of C. odorata is greater than 0.5.
Potential impact on Biodiversity Land that has a high biodiversity conservation value, and proclaimed reserves, were preferentially invaded, while land with a low conservation status was not preferentially invaded, at both levels of probability (Table 3.4, C. odorata probability > 0.5 + Supervised classification Chi Square = 37.2, df = 3, p < 0.001), C. odorata probability > 0.7 + Supervised classification Chi Square = 70.5, df = 3, p < 0.001).

55
Figure 3.8: Invasion of land by importance for biodiversity conservation (Anon 2007a). (A) Indicates the invasion according to the probability of C. odorata > 0.5 and the supervised classification; (B) indicates the invasion according to the probability of C. odorata > 0.7 and the supervised classification;

56
Table 3.6: Results of comparing invasion of land units with the conservation status
Probability C. odorata > 0.5 + Supervised Classification
Probability C. odorata > 0.7 + Supervised Classification
Conservation value
Total km 2 Clear
km 2 Inv. km 2
Exp Inv. km 2 χχχχ2
Clear km 2
Inv. km 2
Exp Inv. km 2
χχχχ2 Corr.
Low value 3 284 2 264 1 021 1 157 16.0 2 639 646 811 33.6 - Transformed 554 354 200 195 0.1 402 151 137 1.6 Irreplaceable 1 157 669 488 408 16.0 804 353 286 16.0 + Proclaimed
reserve 1 437 881 557 506 5.0 1000 438 355 19.4 +
Total 6 432 4 166 2 266 2 266 37.2 4 845 1 588 1 588 70.5 Note: Total area: Total area of each vegetation type, in km2, that has not been transformed; Clear: Area of the vegetation type in km2 that is not invaded, per invasion class; Invaded: Area of the vegetation type in km2 that is invaded, per invasion class; Total area: Total area of the vegetation type in km2 that has not been transformed (other than by C. odorata invasion); Exp. Inv.: The area of invasion (km2) if all vegetation types were invaded equally, calculated as the total invasion multiplied by the proportion of the vegetation type to the total area, in km2, per invasion class; Chi-square: The observed value minus the expected value squared divided by the expected value, per invasion class; Corr.: An indication of whether the vegetation type is being preferentially invaded, avoided or neutral. There was a significant deviation from the expected pattern of invasion across vegetation types (Table 3.8, C. odorata probability > 0.5 + Supervised classification Chi Square = 882, df = 15, p < 0.001) ; C. odorata probability > 0.7 + Supervised classification Chi Square = 1173, df = 15, p < 0.001). The vegetation types that were preferentially invaded, along with some measure of their conservation status, is given in Table 3.7. Seven of the ten vegetation types being preferentially invaded are threatened in some way (Mucina & Rutherford 2006), an indication that land important for biodiversity conservation is being invaded. Including threatened vegetation types in proclaimed reserves is also no guarantee of their protection, as protected areas are being preferentially invaded (Table 3.8).

57
Table 3.7 : Analysis of invasion by vegetation types – Probability of C. odorata > 0.5 and > 0.7 combined with the supervised classification.
Probability C. odorata > 0.5 + Supervised Classification
Probability C. odorata > 0.7 + Supervised Classification Vegetation
Type
Total Area km 2 Clear
km 2 Invaded
km 2
Exp. Inv. km 2
χχχχ2 Clear
km 2 Invaded
km 2
Exp Inv. km 2
χχχχ2
Corr.
Eastern Valley Bushveld 132 62 70 47 11 88 44 33 3.8 + KZN Coastal Belt 446 157 289 159 106 243 203 111 76.9 + Mangrove Forests 21 4 18 8 14 4 17 5 26.4 +
Maputaland Coastal Belt 398 60 338 142 271 109 289 99 365.7 + Maputaland Wooded
Grassland 89 18 72 32 49 30 60 22 62.8 +
Ngongoni Veld 309 251 58 110 25 275 34 77 23.5 - Northern Coastal Forest 126 3 123 45 137 5 121 31 257.6 +
Northern Zululand Sourveld 1 364 1 074 291 486 78 1 206 158 339 96.8 -
Scarp Forest 76 8 68 27 61 13 63 19 103.6 + Subtropical Freshwater
Wetland 70 20 49 25 24 32 37 17 22.6 +
Swamp Forest 5 0 5 2 6 0 5 1 10.1 + Tembe Sandy Bushveld 11 1 10 4 10 2 9 3 14.9 +
Western Maputaland Clay Bushveld
20 12 9 7 0 16 4 5 0.2
Zululand Coastal Thornveld 429 324 105 153 15 367 61 107 19.4 -
Zululand Lowveld 2 542 1 895 647 905 74 2 147 395 632 88.6 -
Total 6 039 3 888 2 151 882 4 538 1 501 1 173
Note: Vegetation type: Name of vegetation type from Mucina and Rutherford (2006) Total area: Total area of each vegetation type, in km2, that has not been transformed; Clear: Area of the vegetation type in km2 that is not invaded, per invasion class; Invaded: Area of the vegetation type in km2 that is invaded, per invasion class; Total area: Total area of the vegetation type in km2 that has not been transformed; Exp. Inv.: The area of invasion that should be invaded if all vegetation types were invaded equally, calculated as the total invasion multiplied by the proportion of the vegetation type to the total area, in km2, per invasion class; Chi- Square: The observed value minus the expected value squared divided by the expected value, per invasion class; Corr.: An indication of whether the vegetation type is being preferentially invaded, avoided or neutral.

58
Figure 3.9: Vegetation types in the study area, from Mucina and Rutherford (2006)
l .. ... N
A 100 Km
Legend
Eastern Valley Bushvekl - Scarp Forest - Freshwater Lakes - Subtropical Coastal Lagoons - KwaZulu-Natal Coastal Be~ Subtropica l Dune Thicket
KZN Hinterland Thornvekl - Subtropical Freshwater Wetiands
Makatini Clay Thicket - Subtropical Sa~ Pans
Mangrove Forest - Subtropical Seashore Vegetat ion
Maputaland Coastal Be~ - Swamp Forest - Maputaland Wooded Grassland _ Tembe Sandy Bushveld
Ngongoni Veld _ ~stern Maputaland Clay Bushveld - Northern Coasta l Forest Zululand Coastal Thornveld - Northern Zululand Sourveld Zululand Lowveld - Sand Forest D Hluhluwe Game Reserve

59
Table 3.8: Conservation status of vegetation types that are being preferentially invaded (Mucina & Rutherford 2006)
Vegetation type Percentage Protected
Percentage Remaining
Conservation Situation
Eastern Valley Bushveld 0.8 85 Least threatened KwaZulu-Natal Coastal Belt 0.6 49.7 Endangered
Mangrove Forest 72 72 Critically endangered Maputaland Coastal Belt 14.9 69.6 Vulnerable
Maputaland Wooded Grassland 16.8 54.3 Endangered Northern Coastal Forest 67.3 97.8 Under threat from
development Scarp Forest 21.3 95.8 Endangered outside reserves
through over-exploitation Subtropical Freshwater
Wetlands 45 96.4 Least threatened
Swamp Forest 65.9 95.8 Critically endangered Tembe Sandy Bushveld 16.8 92 Least threatened
DISCUSSION By performing a supervised classification, we were able to identify 223.7 km2 of infestations, out of a total of 6 808 km2 (3.3 % of the study area, see Figure 3.1). The Kappa statistic (0.14) indicated a very poor agreement with the reference data (Monserud & Leemans 1992), mainly due to the number of points where C. odorata was present but not detected using supervised classification. This was expected, given the cryptic nature of C. odorata in many vegetation types that it invades and the spatial resolution of the satellite image (Joshi 2006). However, the Error Matrix and Accuracy Assessment (Appendix 3.1), show a User’s Accuracy > 81 %, an indication of few false positives, and an indication that there is a high probability that, where the classification shows it as being present, it will be present (Congalton 1991). To estimate the total extent of the invasion we used multiple logistic regressions (Higgins et al. 1999) as it is a method that would be applicable both inside Hluhluwe Game Reserve, where we used C. odorata distribution data to develop our model, and outside Hluhluwe Game Reserve, where we applied the model. Also, this method is less dependent on the characteristics of the specific Landsat image and the season in which it was collected. We needed to have the same data sets available for the entire study area that we used to develop the model. Of the 14 variables tested by the model, eight were important in determining the potential C. odorata distribution. C. odorata does not tolerate water stress in the growing season very well (Goodall & Erasmus 1996; Kriticos et al. 2005) and, despite the relatively small geographical area we used to develop our model, temperature and water stress were indeed identified as variables with a negative coefficient. C. odorata is also sensitive to frost (Goodall & Erasmus 1996; Kriticos et al. 2005), and, despite sensitivity to hot, dry conditions, does require a certain level of heat units in both the summer and winter months, possibly to complete seed production (Kriticos et al. 2005), and hence the positive correlation with heat units. Water stress in July was not significant, possibly due to C. odorata going dormant after setting seed in the dry winter months and resprouting when favourable conditions return (Zachariades et al. 2009).

60
The best Kappa statistic was achieved with a probability of 0.5 – 1, but, at 0.39, indicated a poor fit (Monserud & Leemans 1992), mainly due to the high number of both false positives and false negatives in the error matrix (Appendix 3.2). This is an indication that, in our study, using probability on its own with the data sets available, was not a very reliable method to determine distribution. Overlaying the results of the supervised classification with the C. odorata probability map in all cases increased the Kappa statistic, with the highest Kappa statistic (0.44) and the highest overall classification accuracy (74.7%) being achieved with combining the C. odorata probability of 0.7 – 1 and the supervised classification. Overlaying the supervised classification with the C. odorata probability of > 0.5 and > 0.6 gave marginally lower Kappa statistics (0.43) and lower overall classification accuracies (66.7 % and 73.5 % respectively). This is an indication that each method on its own was inadequate to determine distribution, but, by combining the supervised classification, with its high level of user accuracy, incorporated C. odorata distribution information that was not being adequately modeled. This could be due to model development not adequately covering the full range of C. odorata distribution or that C. odorata has not yet spread into all possible habitats (Kriticos et al. 2005) and the varying spatial resolution of the data sets used (climatic variables mapped at 1 X 1 min vs. 30 X 30 m for altitude, solar radiation and 2001 NDVI and 60 X 60 m for 1973 NDVI). Combining the supervised classification with the C. odorata probability of > 0.5, > 0.6 and > 0.7 provided acceptable Kappa statistics and overall classification accuracies (Congalton 1991; Monserud & Leemans 1992), but the area identified as invaded differs quite dramatically, from a maximum of 2 268 km2 using a C. odorata probability of > 0.5 to a minimum of 1 5 88 km2 using a C. odorata probability of > 0.7. Given that the Kappa statistic and the overall classification accuracy is highest for the latter, this is the best estimate statistically, but, given the closeness of the statistics of the three C. odorata distribution maps and the relatively low Producer’s Accuracy (52%) of the C. odorata > 0.7, there are likely to be some areas where C. odorata is present but not mapped, and the 1 588 km2 is most likely a minimum estimate. We conclude that C. odorata infestations potentially covered more than 1 588 km2 of the study area. Further analysis of invasion patterns across conservation status (based on Anon 2007a) and vegetation types (based on Mucina & Rutherford 2006) showed that invasion was not a random process. Areas important for biodiversity conservation and proclaimed reserves were preferentially invaded, a similar result to that found by Luwum (2002) and Feleke (2003). This is possibly due to areas with a higher biodiversity at a landscape level having a wider variety of niches available for occupation by both indigenous and exotic invasive plants (Brown & Peet 2003; Davies et al. 2005). Twenty three vegetation types were present in the study area (Mucina & Rutherford 2006), of which ten were preferentially invaded, and there was a conservation concern about seven of these, ranging from critically endangered to vulnerable. Eight of these ten vegetation types are dominated by broadleaved trees and shrubs, or have them as a major component, while the remaining two (Maputaland Wooded Grassland and Subtropical Freshwater Wetlands) are not water stressed. Containment in a formally proclaimed conservation area was no security, as conservation areas were preferentially invaded. Vegetation types that were resistant to invasion were dominated by fine-leaved Acacia spp. (for example Zululand Coastal Thornveld), and grasslands (for example Ngongoni Veld). Using controlled burns to prevent or control invasion may be possible in vegetation types that are fire adapted (Goodall & Erasmus 1996), but may lead to increased disturbance and invasion in vegetation types that are not fire adapted (Honu & Dang 2002).

61
We conclude that C. odorata can be detected and mapped using a combination of supervised classification using LandSat and multiple logistic regression. However, neither method on its own provided gave adequate results, for reasons discussed above, and there is a good opportunity to explore other methodologies that have been used for indirect mapping and modeling of alien plant distributions, for example GARP (Underwood et al. 2004), FEM (Robertson et al. 2004) and WISP (Gillham et al. 2004). What is also important is to map the full extent of the invasion in KwaZulu-Natal, thereby enabling us to assess the impact it is having on biodiversity conservation, land use and ecosystem services. This should aid the determination of appropriate management actions for various vegetation types, land cover and land use types.
REFERENCES Alston, K. P., and D. M. Richardson. 2006. The roles of habitat features, disturbance, and
distance from putative source populations in structuring alien plant invasions at the urban/wildland interface on the Cape Peninsula, South Africa. Biological Conservation 132:183-198.
Anon. 2007a. Ezemvelo KZN Wildlife Strategic Environmental Assessment. Unpublished report, Ezemvelo KZN Wildlife, Pietermaritzburg.
Anon. 2007b. LandSat 7 Science Data Users Handbook. NASA. Anon. 2009. Erdas Imagine 9.3 On-Line Documentation. Erdas, Inc., Norcross, U.S.A. Asner, G. P., M. O. Jones, R. E. Martin, D. E. Knapp, and R. F. Hughes. 2008. Remote
sensing of native and invasive species in Hawaiian forests. Remote Sensing of Environment 112:1912 - 1926.
Austin, M. P. 2002. Spatial prediction of species distribution: an interface between ecological theory and statistical modelling. Ecological Modelling 157:101 - 118.
Balfour, D. A., and O. E. Howison. 2001. Spatial and temporal variation in a mesic savanna fire regime: responses to variation in annual rainfall. African Journal of Range and Forage Science 19:43 - 51.
Beyer, H. L. 2004. Hawth's Analysis Tools for ArcGIS. Blackmore, A. C. 1998. Seed dispersal of Chromolaena odorata reconsidered in R.
Muniappen, editor. Fourth international workshop on biological control and management of C. odorata, Bangalore, India.
Bradley, B. A., and J. F. Mustard. 2005. Identifying land cover variability distinct from land cover change: Cheatgrass in the Great Basin. Remote Sensing of the Environment 94:204 - 213.
Brothers, T. S., and A. Spingarn. 1992. Forest fragmentation and alien plant invasion of central Indiana old-growth forests. Conservation Biology 6:91 - 100.
Brotons, L., W. Thuiller, M. B. Araujo, and A. H. Hirzel. 2004. Presence-absence versus presence-only modelling methods for predicitng bird habitat suitability. Ecography 27:437 - 448.
Brown, R. L., and R. K. Peet. 2003. Diversity and invasibility of Southern Appalachian plant communities. Ecology 84:32 - 39.
Chabrerie, O., K. Verheyen, R. Saguez, and G. Decocq. 2008. Disentangling relationships between habitat conditions, disturbance history , plant diversity, and

62
American black cherry (Prunus serotina Ehrh.) invasion in a European temperate forest. Diversity and Distributions 14:204 - 212.
Congalton, R. G. 1991. A review of assessing the accuracy of classifications of remotely sensed data. Remote Sensing of Environment 37:35 - 46.
Dark, S. J. 2004. The biogeography of invasive alien plants in California: an application of GIS and spatial regression analysis. Diversity and Distributions 10:1 - 9.
Davies, K. F., P. Chesson, S. Harrison, B. D. Inouye, B. A. Melbourne, and K. J. Rice. 2005. Spatial heterogeneity explains the scale dependence of the native-exotic diversity relationship. Ecology 86:1602 - 1610.
Didham, R. K., J. M. Tylianakis, N. J. Gemmell, T. A. Rand, and R. M. Ewers. 2007. Interactive effects of habitat modification and species invasion on native species decline. Trends in Ecology and Evolution 22:489 - 496.
Erasmus, D. J. 1985. Achene biology and the chemical control of Chromolaena odorata. Ph. D thesis, University of Natal, Pietermaritzburg.
Erasmus, D. J. 1988. A review of mechanical and chemical control of Chromolaena odorata in South Africa. First International Workshop of Biological Control and Management of Chromolaena odorata, Bangkok, Thailand.
Feleke, A. K. 2003. Land use and land cover in relation to Chromolaena odorata distribution: Mapping and change detection in St. Lucia wetland area, South Africa. M.Sc thesis, International Institute for Geo-information Science and Earth Observation, Enschede, the Netherlands.
Gamon, J. A., C. B. Field, M. L. Goulden, K. L. Griffin, A. E. Hartley, G. Joel, J. Penuelas, and R. Valentini. 1995. Relationships between NDVI, canopy structure, and photosynthesis in three Californian vegetation types. Ecological Applications 5:28 - 41.
Gillham, J. H., A. L. Hild, J. H. Johnson, E. R. Hunt, and T. D. Whitson. 2004. Weed Invasion Susceptibility Prediction (WISP) Model for Use with Geographic Information Systems. Arid Land Research and Management 18:1 - 12.
Goodall, J. M., and D. J. Erasmus. 1996. Review of the status and integrated control of the invasive alien weed, Chromolaena odorata, in South Africa. Agriculture, Ecosystem and Environment 56:151 - 164.
Guisan, A., and W. Thuiller. 2005. Predicting species distribution: offering more than simple habitat models. Ecology Letters 8:993 - 1009.
Higgins, S. I., D. M. Richardson, R. M. Cowling, and T. H. Trinder-Smith. 1999. Predicting the Landscape-Scale distribution of alien plants and their threat to plant diversity. Conservation Biology 13:303 - 313.
Hirzel, A. H., V. Helfer, and F. Metral. 2001. Assessing habitat-suitability models with a virtual species. Ecological Modelling 145:111 - 121.
Hobbs, R. J., and L. F. Huenneke. 1992. Disturbance, diversity, and invasion: implications for conservation. Conservation Biology 6:324 - 337.
Holmes, P. M., D. M. Richardson, K. J. Esler, E. T. F. Witkowski, and S. Fourie. 2005. A decision-making framework for restoring riparian zones degraded by invasive alien plants in South Africa. South African Journal of Science 101:553 - 564.
Honu, Y. A. K., and Q. L. Dang. 2002. Spatial distribution and species composition of tree seeds and seedlings under the canopy of the shrub, Chromolaena odorata Linn., in Ghana. Forest Ecology and Management 164:185 - 196.

63
Howison, O. E. 1998. The distribution of Chromolaena odorata in Hluhluwe Game Reserve. Unpublished report, Ezemvelo KZN Wildife, Pietermaritzburg.
Howison, O. E. 2001. The distribution of Chromolaena odorata in Hluhluwe Game Reserve. Unpublished report, Ezemvelo KZN Wildlife, Pietermaritzburg.
Jensen, J. R., K. Rutchey, M. S. Koch, and S. Narumalani. 1995. Inland wetland change detection in the Everglades Water Conservation Area 2A using a time series of normalised remotely sensed data. Photogrammetric Engineering and Remote Sensing 61:199 - 209.
Joshi, C. 2006. Mapping cryptic invaders and invisibility of tropical forest ecosystems: Chromolaena odorata in Nepal. Ph.D thesis, Wageningen University, Wageningen.
Joshi, C., J. De Leeuw, J. Van Andel, A. K. Skidmore, H. D. Lekhak, I. C. Van Duren, and N. Norbu. 2006. Indirect remote sensing of a cryptic forest understorey invasive species. Forest Ecology and Management 225.
Kriticos, D. J., T. Yonow, and R. E. McFadyen. 2005. The potential distribution of Chromolaena odorata (Siam weed) in relation to climate. Weed Research 45:246 - 254.
Le Maitre, D. C., B. W. Van Wilgen, R. A. Chapman, and D. H. McKelly. 1996. Invasive plants and water resources in the Western Cape Province, South Africa: modeling the consequences of a lack of management. Journal of Applied Ecology 33:61 - 172.
Le Maitre, D. C., D. B. Versfeld, and R. A. Chapman. 2000. The impact of invading alien plants on surface water resources in South Africa: A preliminary assessment. Water SA 26:397 - 408.
Liggitt, B. 1983. Biology, ecology and control of the weed Chromolaena odorata. Unpublished report, Institute of Natural Resources, University of Natal, Pietemaritzburg, Pietermaritzburg.
Luwum, P. 2002. Control of invasive Chromolaena odorata : An evaluation in some land use types in KwaZulu-Natal, South Africa. M.Sc thesis, International Institute for Geo-information and Earth Observation, Enschede, the Netherlands.
MacDonald, I. A. W. 1983. Alien trees, shrubs and creepers invading indigenous vegetation in the Hluhluwe-Umfolozi Game Reserve Complex in Natal. Bothalia 14:949 - 959.
Manel, S., J.-M. Dias, and S. J. Ormerod. 1999. Comparing discriminant analysis, neural networks and logistic regression for predicting species distributions: a case study with a Himalayan river bird. Ecological Modelling 120:337 - 347.
Mbalo, B. A., and E. T. F. Witkowski. 1997. Tolerance to soil temperatures experienced during and after the passage of fire in seeds of Acacia karroo, A. tortilis and Chromolaena odorata. South African Journal of Botany 63:421 - 425.
McFadyen, R. E., and B. Skarrat. 1996. Potential distribution of Chromolaena odorata (Siam weed) in Australia, Africa and Oceania. Agriculture, Ecosystems and Environment 59:89 - 96.
McKinney, M. L., and J. L. Lockwood. 1999. Biotic homogenization: a few winners replacing many losers in the next mass extinction. Tree 14:450-453.
Monserud, R. A., and R. Leemans. 1992. Comparing global vegetation maps with the Kappa statistic. Ecological Modelling 62:275 - 293.

64
Mucina, L., and M. C. Rutherford 2006. The Vegetation of South Africa, Lesotho and Swaziland. South African National Biodiversity Institute, Pretoria.
Norbu, N. 2004. Invasion success of Chromolaena odorata in the Terai of Nepal. M.Sc thesis, International Institute for Geo-Information Science and Earth Observation, Enschede, the Netherlands.
Robertson, M. P., M. H. Villet, and A. R. Palmer. 2004. A fuzzy classification technique for predicting species distributions: applications using invasive alien plants and indigenous insects. Diversity and Distributions 10:461 - 474.
Rouget, M., D. M. Richardson, R. M. Cowling, J. W. Lloyd, and A. T. Lombard. 2003. Current patterns of habitat transformation and future threats to biodiversity in terrestrial ecosystems of the Cape Floristic Region, South Africa. Biological Conservation 112:63 - 85.
Rouget, M., D. M. Richardson, S. J. Milton, and D. Polakow. 2004. Predicting invasion dynamics of four alien Pinus species in a highly fragmented semi-arid shrubland in South Africa. Plant Ecology 152:79 - 92.
Schulze, R. E., M. Maharaj, B. J. Howe, and B. Melvil-Thomson. 1997. South African Atlas of Agrohydrology and –Climatology. Report TT82/96, Water Research Commission, Pretoria.
Sutherst, R. W., and G. F. Maywald. 1985. A Computerised System for Matching climates in Ecology. Agriculture, Ecosystems and Environment 13:281 - 299.
Thompson, M. 2008. KZN Province Land-Cover Mapping (from SPOT 2 / 4 Satellite imagery 2005 – 06), Unpublished report by Geoterraimage (Pty) Ltd., South Africa, for the KZN Department of Agriculture and Environmental Affairs (Environment Branch) and Ezemvelo KZN Wildlife.
Thuiller, W., D. M. Richardson, P. Pysek, G. F. Midgeley, G. O. Hughes, and M. Rouget. 2005. Niche-based modeling as a tool for predicting the risk of alien plant invasions at a global scale. Global Change Biology 11:2234 - 2250.
Tsai, F., and M.-J. Chou. 2006. Texture augmented analysis of high resolution satellite imagery in detecting invasive plant species. Journal of the Chinese Institute of Engineers 29:581 - 592.
Underwood, E. C., R. Klinger, and P. E. Moore. 2004. Predicting patterns of non-native plant invasions in Yosemite National Park, California, USA. Diversity and Distributions 10:447 - 459.
Van Gils, H., M. Mwanangi, and D. Rugege. 2006. Invasion of an alien shrub across four land management regimes, west of St Lucia, South Africa. South African Journal of Science 102:9-12.
Van Wilgen, B. W., and D. M. Richardson. 1985. The effects of alien shrub invasions on vegetation structure and fire behaviour in South African fynbos shrublands: A simulation study. Journal of Applied Ecology 22:955 - 966.
Vila, M., and J. Pujadas. 2001. Land-use and socio-economic correlates of plant invasions in European and North African countries. Biological Conservation 100:397 - 401.
White, D., P. G. Minotti, M. J. Barzak, J. C. Sifneos, K. E. Freemark, M. V. Santelmann, C. F. Steinitz, A. R. Kiester, and E. M. Preston. 1997. Assessing risks to biodiversity from future landscape change. Conservation Biology 11:349 - 360.

65
Wiser, S. K., R. K. Peet, and P. S. White. 1996. High-elevation rock outcrop vegetation of the Southern Appalachian Mountains. Journal of Vegetation Science 7:703 - 722.
Woodward, F. I. 1987. Climate and Plant Distribution. Cambridge University Press, Cambridge, UK.
Zachariades, C., M. Day, R. Muniappan, and G. V. P. Reddy. 2009. Chromolaena odorata (L.) King and Robinson (Asteraceae). Pages 130 - 160 in R. Muniappan, G. V. P. Reddy, and A. Raman, editors. Biological Control of Tropical Weeds using Arthropods. Cambridge University Press.

66
Appendix 3.1: Error matrices and Accuracy Assessments for the supervised classification, probability mapping and combination maps
3.1.1 Error matrix and Accuracy Assessment for the Supervised Classification
Reference Data Classified data No C. odorata C. odorata Total No C. odorata 95 56 151
C. odorata 2 9 11 Total 97 65 162
Class Name Reference Totals
Classified Totals
Number Correct
Producer's Accuracy
(Percentage)
User's Accuracy
(Percentage) No C. odorata 97 151 95 97.9 62.9 C. odorata 65 11 9 13.8 81.8 Total 162 162 104
Overall classification accuracy = 64.2 %
3.1.2 Error matrix and Accuracy Assessment for Probability > 0.5
Reference data Classified data No C. odorata C. odorata Total No C. odorata 81 30 111
C. odorata 16 35 51 Total 97 65 162
Class Name Reference
Totals Classified
Totals Number Correct
Producer's Accuracy
(Percentage)
User's Accuracy
(Percentage) No C. odorata 97 111 81 83.5 73.0
C. odorata 65 51 35 53.9 68.6 Total 162 162 116
Overall accuracy = 71.6%

67
3.1.3 Error matrix and Accuracy Assessment for Probability > 0.6
Reference data Classified data No C. odorata C. odorata Total No C. odorata 83 35 118
C. odorata 14 30 44 Total 97 65 162
Class Name Reference
Totals Classified
Totals Number Correct
Producer's Accuracy
(Percentage)
User's Accuracy
(Percentage) No C. odorata 97 118 83 85.6 70.3
C. odorata 65 44 30 46.2 68.2 Total 162 162 113
Overall accuracy = 69.8%
3.1.4 Error matrix and Accuracy Assessment for Probability > 0.7
Reference data Classified data No C. odorata C. odorata
Total
No C. odorata 88 39 127 C. odorata 9 26 35
Total 97 65 162
Class Name Reference
Totals Classified
Totals Number Correct
Producer's Accuracy
(%)
User's Accuracy
(%) No C. odorata 97 127 88 90.7 69.3
C. odorata 65 35 26 40.0 74.3 Total 162 162 114
Overall accuracy = 70.4%

68
3.1.5 Error matrix and Accuracy Assessment for Probability > 0.8
Reference data Classified data No C. odorata C. odorata
Total
No C. odorata 90 45 135 C. odorata 7 20 27
Total 97 65 162
Class Name Reference
Totals Classified
Totals Number Correct
Producer's Accuracy
(Percentage)
User's Accuracy
(Percentage) No C. odorata 97 135 90 92.8 66.7
C. odorata 65 27 20 30.8 74.1 Total 162 162 110
Overall accuracy = 67.9
3.1.6 Error matrix and Accuracy Assessment for Probability > 0.9
Reference data Classified data No C. odorata C. odorata
Total
No C. odorata 95 52 147 C. odorata 2 13 15
Total 97 65 162
Class Name Reference
Totals Classified
Totals Number Correct
Producer's Accuracy
(Percentage)
User's Accuracy
(Percentage) No C. odorata 97 147 95 97.9 64.6
C. odorata 65 15 13 20.0 86.7 Total 162 162 108
Overall accuracy assessment = 66.7%

69
3.1.7 Error matrix and Accuracy Assessment for Probability > 0.6 combined with supervised classification
Reference data Classified data No C. odorata C. odorata
Total
No C. odorata 82 28 110 C. odorata 15 37 52 Total 97 65 162
Class Name Reference
Totals Classified
Totals Number Correct
Producer's Accuracy
(Percentage)
User's Accuracy
(Percentage) No C. odorata 97 110 82 84.5 74.6
C. odorata 65 52 37 56.9 71.2 Total 162 162 119
Overall accuracy assessment = 73.5%
3.1.8 Error matrix and Accuracy Assessment for Probability > 0.8 combined with supervised classification
Reference data Classified data No C. odorata C. odorata
Total
No C. odorata 89 37 126 C. odorata 8 28 36
Total 97 65 162
Class Name Reference Totals
Classified Totals
Number Correct
Producer's Accuracy
(Percentage)
User's Accuracy
(Percentage) No C. odorata 97 126 89 91.8 70.6 C. odorata 65 36 28 43.1 77.9 Total 162 162 117
Overall accuracy assessment = 72.2%

70
3.1.9 Error matrix and Accuracy Assessment for Probability > 0.9 combined with supervised classification
Reference data Classified data No C. odorata C. odorata
Total
No C. odorata 93 43 136 C. odorata 4 22 26
Total 97 65 162
Class Name Reference
Totals Classified
Totals Number Correct
Producer's Accuracy
(Percentage)
User's Accuracy
(Percentage) No C.
odorata 97 136 93 95.9 68.4 C. odorata 65 26 22 33.9 84.6
Total 162 162 115 Overall accuracy assessment= 71.0%

71
CHAPTER 4: GENERAL DISCUSSION
O. Howison Invasion by alien plants is a consequence of globalization (Mack et al. 2000), and preventing introductions is the best method to avoid impacts (Mack et al. 2000; Tucker & Richardson 1995). However, it is often too late for such preventative action (Higgins et al. 1999), and, once introduced, eradication of invasive alien plants is a goal not often achievable and maintenance at or below acceptable levels becomes the most viable solution (Mack et al. 2000; Simberloff 2003). In such cases, the abundance of the species is controlled at levels such that acceptable ecological impacts are maintained within acceptable limits and ecosystem services are still provided. How such maintenance should be achieved best depends on the relevant specific species traits in combination with the characteristics that make habitats invasible. This needs to be viewed in the context of the natural and human-induced disturbances that control community structure in the habitats under study. In this discussion I will try to integrate the findings from the local scale (Hluhluwe game reserve) with those of the regional scale (coastal KwaZulu-Natal) To maximize the cost-effectiveness of control programmes, for each invasion it is important to understand the vulnerability of the habitat to invasion, the traits of the invasive species that allow it to become invasive, the interactions between these and the financial and ecological implications of the invasion (Richardson & Pysek 2006; Turpie 2004). In alien plant ecology, much work has been done to find generalities in terms of habitat invasiveness and species traits, not always with success (Pyšek 1998; Richardson & Pysek 2006). Elton (1958) proposed that alien species would invade areas with low species diversity, as areas with high species diversity should use limiting resources more completely (Levine & D'Antonio 1999), but results from studies have both supported and rejected this hypothesis (Levine & D'Antonio 1999; Stohlgren et al. 1999). In general, small scale studies support this theory (Kennedy et al. 2002; Stohlgren et al. 1999), but at larger scales highly diverse communities may be more readily invaded due to other co-varying factors such as evolutionary history, community structure, total biomass or plant density, propagule pressure of both indigenous and invasive species, disturbance (e.g. flooding, fire), stress, resource availability, habitat heterogeneity, fragmentation and competitors, rather than diversity itself (Alpert et al. 2000; Huston 2004; Levine & D'Antonio 1999; Stohlgren et al. 1999). Some of these factors, for example fragmentation and disturbance, can both promote and inhibit invasion, depending on the relationship between the factor, the habitat and the invasive species (Brothers & Spingarn 1992; Foxcroft et al. 2008; Hobbs 2001; Huston 2004; Kemper et al. 1999; Ohlemuller et al. 2006). The influence of the factor thus needs to be understood in the context of the specific invasion and the traits that enhance the species invasiveness in a specific habitat (Richardson & Pysek 2006). Disturbance regimes in habitats are a factor then cited as a cause of invasion, but, in natural systems, some level of disturbance is also necessary to maintain maximum levels of biodiversity (Hobbs & Huenneke 1992). The response of any vegetation type to disturbance or disturbance interval is determined by the traits of the species present (both natural and invasive). The disturbance interval is important, as different species reach maturity and reproduce at different rates (Hobbs & Huenneke 1992). If a second disturbance occurs before a species has reproduced, that species may be lost. Only a few ruderal species will remain when there are frequent, severe disturbances and only a few long-lived competitive species and those that can regenerate without disturbance will remain when there is no disturbance (Hobbs & Huenneke 1992).

72
Fire is a disturbance that can both inhibit and enhance invasion by alien plants, in our case C. odorata, depending on the context. In two separate studies, annual burning of fire adapted grasslands effectively eliminated C. odorata (Goodall & Erasmus 1996), while in another study occasional severe fire in a fire sensitive habitat facilitated invasion (Honu & Dang 2002). Fire is an important management tool (Balfour & Howison 2001) that can be used to manage C. odorata infestations in communities adapted to regular fires, but it’s application in fire sensitive vegetation types needs to be carefully considered to prevent it from facilitating invasion or damaging sensitive communities. In areas with vegetation types that are not fire adapted, and need to be maintained for biodiversity conservation, manual and chemical control are the only methods that are currently being applied. These are expensive to implement and maintain, and every step needs to be properly implemented to ensure cost-effective control (Zachariades et al. 2009). Small, isolated guerilla type infestations in fire-sensitive communities need to be cleared quickly to prevent further invasion (Moody & Mack 1988). Reinvasion of cleared areas needs to be minimized through good management of the surrounding vegetation, keeping areas adjacent to roads and rivers (major sources of long-distance propagule dispersal) clear and keeping infestations at low levels to reduce propagule pressure. To reduce clearing costs and the competitiveness of C. odorata, investigation into biological control agents was initiated in the 1980s, and to date, one species (Pareuchaetes insulate) has been established in southern KwaZulu-Natal and other species are being investigated (Zachariades et al. 2009). In addition to habitat characteristics, invasive species traits have also been widely explored. The most common traits that predict invasiveness are wide latitudinal range and rapid dispersal, which in turn is related to short generation time, long fruiting period, large seed number, small seed size, prolonged seed viability and transport by wind or by animals (Dukes & Mooney 1999; Rejmanek & Richardson 1996; Williamson & Fitter 1996a). Although an invasive alien species may not have all or any of these characteristics (Williamson & Fitter 1996b), C. odorata has many of these traits: It has a wide natural range (Kriticos et al. 2005; McFadyen & Skarrat 1996), it is capable of producing seed within a year of germination, it can produce seeds apomictically and in large numbers, seeds are small and readily spread by a variety of mechanisms (Luwum 2002; Rambuda & Johnson 2004; Zachariades et al. 2009). Most seeds lose viability after a year, but a few remain viable for several years, and reinvasion occurs rapidly when a parent population is removed (Witkowski & Wilson 2001). The understanding of each specific invasion needs the involvement of both species and habitat characteristics, and their relative importance may change over time (Alpert et al. 2000; Richardson & Pysek 2006). In our study area invasion was first driven by a habitat characteristic (high rainfall), but subsequently switched to a species trait, (high seed production), which allowed the invasion to invade vegetation types from which it was previously excluded. The importance of propagule pressure in driving invasion has been documented by other authors (Foxcroft et al. 2004; Rouget & Richardson 2003). High seed production then drove the invasion into the remaining patches of susceptible vegetation types (Chapter 2). There was thus interplay between habitat susceptibility and a species trait, enforcing the point made by Richardson and Pysek (2006) that both need to be considered when studying alien plant invasions. Alpert, Bone et al. (2000) and Barney, Tommaso et al. (2005) also found interplay between habitat suitability and species traits to be important in determining invasion success, but more studies are required to see if this is a general phenomenon. At the broader scale, our study showed that, although the same vegetation types were preferentially invaded at both the probability > 0.5 + supervised classification and probability > 0.7 + supervised classification, the χ2 values indicate the relative contribution of individual vegetation types to the total χ2 changed, mostly increasing from the

73
former to the latter. This indicates that, at the higher probability of invasion, there is a positive selection for some habitats and an avoidance of others, but, as the probability of invasion is reduced (i.e. as the invasion progresses), this selectivity is also reduced, a further indication that, as an invasion progresses, the invading species may become less selective in the choice of habitat it invades or able to overcome habitat factors that inhibit the invasion (Chapter 2 and Chapter 3). In our study, an important factor contributing to invasion of resistant habitats was propagule pressure on areas adjacent to existing invasions, allowing the invasion to occur in a phalanx rather than guerilla fashion, although the latter did occur. Understanding this is also important if the invasion is to be effectively managed. Doust (1981) studied the roles of phalanx and guerilla invasion, where phalanx invasion is a strategy to monopolise habitats susceptible to invasion, while the role of guerilla invasion is two-fold. It may be a mechanism to pass through habitat that is unsuitable or marginal for invasion (Amsbery et al. 2000; Doust 1981), or to initiate new invasion foci (Moody & Mack 1988). In this study, uninvaded grids that were adjacent to existing invasions always showed a significantly higher susceptibility to being invaded, indicating that invasion was largely through phalanx invasion rather than guerilla invasion (Chapter 2). This is due to the fact that, despite their small size, most C. odorata seed falls below or within a few metres of the parent plant (Blackmore 1996), and this is the factor driving the phalanx invasion. However, there were instances of guerilla invasion which lead to the establishment of new foci (Chapter 2). The total number of invasions remained fairly stable throughout the study period, as existing invasions expanded and coalesced, but new guerilla invasions also occurred (Chapter 2). Is the invasion of Hluhluwe Game Reserve an example of what is happening in the greater area? In Hluhluwe Game Reserve the vegetation types dominated by Acacia species were mostly resistant to invasion. At the broader scale, vegetation types resistant to invasion also have Acacia species as an important taxon (Mucina & Rutherford 2006). Whether it is the genus itself that provides some measure of protection or a habitat factor (e.g. disturbance, climate, geology, soils) that, in promoting growth by Acacia spp., excludes C. odorata is a subject for further investigation. On the other hand, in Hluhluwe Game Reserve communities dominated by broadleaved species varied in their level of resistance. This was best shown by the variation in invasion between the two riverine forests (Chapter 2). Both of these vegetation types occur along the major rivers, so invasion was not limited by propagule dispersal, and have similar rainfall regimes (Chapter 2). This indicates that a habitat factor other than rainfall may have contributed to limiting invasion in the Spirostachys africana / Euclea racemosa riverine forests, but not in Ficus sycamorus / Schotia brachypetala forests. To fully assess the impact of an invasive alien species, the extent of existing infestations needs to be known and compared with the potential range (Peterson et al. 2003; Wang & Wang 2006). One of the main objectives of this study was to test the use of GIS and remote sensing to map C. odorata in the study area. However, the extent of C. odorata infestations goes beyond the study area, so future research work needs to be aimed at mapping the entire extent of C. odorata infestations in KwaZulu-Natal. Our study was also restricted to one invasive alien plant species, namely C. odorata, but there are numerous other invasive alien plant species, for example Lantana camara, Rubus sp., Solanum mauritianum and Acacia mearnsii, for which there are no recent distribution maps covering KwaZulu-Natal (O. Howison, pers. obs.). In addition, potential distributions could change with the impacts of global warming, and distribution models need to take this into account (Dukes & Mooney 1999; Kriticos et al. 2003; Pearson & Dawson 2003).

74
There are also a number of different computerized models that have been developed to assist with determining potential distribution of an alien species, including CLIMEX, (Kriticos et al. 2005; McFadyen et al. 1996; Sutherst et al. 1985), Genetic Algorithm for Rule-set Production (GARP) (Underwood et al. 2004) , Fuzzy Envelope Model (FEM) (Robertson et al. 2004) and Weed Susceptibility Prediction (WISP) (Gillham et al. 2004). Further research needs to be done to test the relative efficacy of these models to determine the potential extent of alien plant invasions in KwaZulu-Natal. Within the constraints of this study, we have documented an alien plant invasion, thereby contributing to the general understanding of alien plant invasions. We have also been innovative in combining two techniques to map the same invasion over a wider geographic area, thereby allowing us to assess the impact of the invasion on conservation of biodiversity.
REFERENCES Alpert, P., E. Bone, and C. Holzapfel. 2000. Invasiveness invasibility and the role of
environmental stress in the spread of non-native plants. Perspectives in Plant Ecology, Evolution and Systematics 3:52 - 66.
Amsbery, L., M. A. Baker, P. J. Ewanchuk, and M. D. Bertness. 2000. Clonal integration and the expansion of Phragmites australis. Ecological Applications 10:1110 - 1118.
Balfour, D. A., and O. E. Howison. 2001. Spatial and temporal variation in a mesic savanna fire regime: responses to variation in annual rainfall. African Journal of Range and Forage Science 19:43 - 51.
Barney, J. N., A. D. Tommaso, and L. A. Weston. 2005. Differences in invisibility of two constrasting habitats and invasiveness of two mugwort Artemisia vulgaris populations. Journal of Applied Ecology 42:567 - 576.
Blackmore, A. C. 1996. Seed dispersal of Chromolaena odorata reconsidered in R. Muniappen, editor. Fourth international workshop on biological control and management of C. odorata, Bangalore, India.
Brothers, T. S., and A. Spingarn. 1992. Forest fragmentation and alien plant invasion of central Indiana old-growth forests. Conservation Biology 6:91 - 100.
Doust, L. L. 1981. Population dynamics and local specialization in a clonal perennial (Ranunculus repens) i) The dynamics of ramets in contrasting habitats. Journal of Ecology 69:743 - 755.
Dukes, J. S., and H. A. Mooney. 1999. Does global change increase the success of biological invaders? Trends in Ecology and Evolution 14:135 - 139.
Elton, C. S. 1958. The ecology of invasions by plants and animals. Methuen, London, UK.
Foxcroft, L., M. Parsons, C. A. McLoughlin, and D. M. Richardson. 2008. Patterns of alien plant distribution in a river landscape following an extreme flood. South African Journal of Botany 74:463 - 475.
Foxcroft, L. C., M. Rouget, D. M. Richardson, and S. MacFadyen. 2004. Reconstructing 50 years of Opuntia stricta invasion in the Kruger National Park, South Africa: environmental determinants and propagule pressure. Diversity and Distributions 10:427 - 437.

75
Gillham, J. H., A. L. Hild, J. H. Johnson, E. R. Hunt, and T. D. Whitson. 2004. Weed Invasion Susceptibility Prediction (WISP) Model for Use with Geographic Information Systems. Arid Land Research and Management 18:1 - 12.
Goodall, J. M., and D. J. Erasmus. 1996. Review of the status and integrated control of the invasive alien weed, Chromolaena odorata, in South Africa. Agriculture, Ecosystem and Environment 56:151 - 164.
Higgins, S. I., D. M. Richardson, R. M. Cowling, and T. H. Trinder-Smith. 1999. Predicting the Landscape-Scale distribution of alien plants and their threat to plant diversity. Conservation Biology 13:303 - 313.
Hobbs, R. J. 2001. Synergisms among habitat fragmentation, livestock grazing, and biotic invasions in Southwestern Australia. Conservation Biology 15:1522 - 1528.
Hobbs, R. J., and L. F. Huenneke. 1992. Disturbance, diversity, and invasion: implications for conservation. Conservation Biology 6:324 - 337.
Honu, Y. A. K., and Q. L. Dang. 2002. Spatial distribution and species composition of tree seeds and seedlings under the canopy of the shrub, Chromolaena odorata Linn., in Ghana. Forest Ecology and Management 164:185 - 196.
Huston, M. A. 2004. Management strategies for plant invasions: manipulating productivity, disturbance, and competition. Diversity & Distributions 10:167 - 178.
Kemper, J., R. M. Cowling, and D. M. Richardson. 1999. Fragmentation of South African renosterveld shrublands: effects on plant community structure and conservation implications. Biological Conservation 90:103 - 111.
Kennedy, T. A., S. Naeem, K. M. Howe, J. M. H. Knops, D. Tilman, and P. Reich. 2002. Biodiversity as a barrier to ecological invasion. Nature 417:636 - 638.
Kriticos, D. J., R. W. Sutherst, J. R. Brown, S. W. Adkins, and G. F. Maywald. 2003. Climate change and the potential distribution of an invasive alien plant: Acacia nilotica ssp. indica in Australia. Journal of Applied Ecology 40:111 - 124.
Kriticos, D. J., T. Yonow, and R. E. McFadyen. 2005. The potential distribution of Chromolaena odorata (Siam weed) in relation to climate. Weed Research 45:246 - 254.
Levine, J. M., and C. M. D'Antonio. 1999. Elton revisited: a review of evidence linking diversity and invasibility. Oikos 87:15 - 26.
Luwum, P. 2002. Control of invasive Chromolaena odorata : An evaluation in some land use types in KwaZulu-Natal, South Africa. M.Sc thesis, International Institute for Geo-information and Earth Observation, Enschede, the Netherlands.
Mack, R. N., D. Simberloff, W. M. Lonsdale, H. Evans, M. Clout, and F. A. Bazzaz. 2000. Biotic Invasions: Causes, Epidemiology, Global Consequences, and Control. Issues in Ecology 10:689 - 710.
McFadyen, R. E., and B. Skarrat. 1996. Potential distribution of Chromolaena odorata (Siam weed) in Australia, Africa and Oceania. Agriculture, Ecosystems and Environment 59:89 - 96.
Moody, M. E., and R. N. Mack. 1988. Controlling the spread of plant invasions: The importance of nascent foci. Journal of Applied Ecology 25:1009 - 1021.
Mucina, L., and M. C. Rutherford 2006. The Vegetation of South Africa, Lesotho and Swaziland. South African National Biodiversity Institute, Pretoria.

76
Ohlemuller, R., S. Walker, and J. B. Wilson. 2006. Local vs. regional factors as determinants of the invisibility of indigenous forest fragments by alien plant species. Oikos 112:493 - 501.
Pearson, R. G., and T. P. Dawson. 2003. Predicting the impacts of climate change on the distribution of species: are bioclimate envelope models useful? Global Ecology and Biogeography 12:361 - 371.
Peterson, A. T., M. Papes, and D. A. Kluza. 2003. Predicting the potential invasive distribution of four alien plant species in North America. Weed Science 51:863 - 868.
Pyšek, P. 1998. Is there a taxonomic pattern to plant invasions? Oikos 82:282 - 294. Rambuda, T. D., and S. D. Johnson. 2004. Breeding systems of invasive alien plants in
South Africa: does Baker's rule apply? Diversity and Distributions 10:409 - 416. Rejmanek, M., and D. M. Richardson. 1996. What attributes make some plant species
more invasive? Ecology 77:1655 - 1661. Richardson, D. M., and P. Pysek. 2006. Plant invasions: merging the concepts of species
invasiveness and community invasibility. Progress in Physical Geography 30:409 - 431.
Robertson, M. P., M. H. Villet, and A. R. Palmer. 2004. A fuzzy classification technique for predicting species distributions: applications using invasive alien plants and indigenous insects. Diversity and Distributions 10:461 - 474.
Rouget, M., and D. M. Richardson. 2003. Inferring process from pattern in plant invasions: a semimechanistic model incorporating propagule pressure and environmental factors. The American Naturalist 162:713 - 724.
Simberloff, D. 2003. Eradication: Preventing iInvasions at the outset. Weed Science 51:247 - 253.
Stohlgren, T. J., D. Binkley, G. W. Chong, M. A. Kalkhan, L. D. Schell, K. A. Bull, Y. Otsuki, G. Newman, and M. S. Bashkin, Y. 1999. Exotic plant species invade hotspots of native plant diversity. Ecological Monographs 69:25 - 46.
Tucker, K. C., and D. M. Richardson. 1995. An expert system for screening potentially invasive alien plants in South African fynbos. Journal of Environmental Management 44:309 - 338.
Turpie, J. K. 2004. The role of resource economics in the control of invasive alien plants in South Africa. South African Journal of Science 100:87 - 93.
Underwood, E. C., R. Klinger, and P. E. Moore. 2004. Predicting patterns of non-native plant invasions in Yosemite National Park, California, USA. Diversity and Distributions 10:447 - 459.
Wang, R., and Y.-Z. Wang. 2006. Invasion dynamics and potential spread of the invasive alien plant species Ageratina adenophora (Asteraceae) in China. Diversity and Distributions 12.
Williamson, M., and A. Fitter. 1996a. The varying success of invaders. Ecology 77:1661 - 1666.
Williamson, M. H., and A. Fitter. 1996b. The characters of successful invaders. Biological Conservation 78:163 - 170.
Witkowski, E. T. F., and M. Wilson. 2001. Changes in density, biomass, seed production and soil seed banks of the non-native invasive plant Chromolaena odorata, along a 15 year chronosequence. Plant Ecology 152:13 - 27.

77
Zachariades, C., M. Day, R. Muniappan, and G. V. P. Reddy. 2009. Chromolaena odorata (L.) King and Robinson (Asteraceae). Pages 130 - 160 in R. Muniappan, G. V. P. Reddy, and A. Raman, editors. Biological Control of Tropical Weeds using Arthropods. Cambridge University Press.