Embed Size (px)
Citation preview

Page |1
Translating Technology to Success
Blue Hill Research 24 School Street, Mezzanine Boston, MA 02108 http://www.bluehillresearch.com
617.624.3600
@BlueHillBoston
AT A GLANCE
Data visualization tools provide the opportunity for line-of-business employees to extract insights from data without complex methods of manipulation or analysis. The inherent ability of the human mind to recognize visual patterns presents an important tool for organizations to empower their employees to make better data-driven decisions.
How Data Visualization Empowers Decision Making
Data Visualization Versus the Traditional Communication of Data
It’s no secret that data visualization tools have seen a tremendous rise in popularity. To match
the demand, an influx of tools has entered the market. The push has come from both legacy
business intelligence (BI) players adding to their core offerings, and from newer upstarts who
approach BI from a visualization-first mindset.
The story behind the popularity of visualization tools follows the general evolution of BI. The
promise of data analytics derives from the ability to put actionable information in the hands of
line-of-business users quickly. Decision makers can be empowered by gaining self-service
access to data and the ability to perform custom analysis on the fly. Traditionally, the holdup to
the realization of this promise is that most people in an organization are not formally trained
statisticians or data scientists. This presents a challenge, as analysts may need to perform
complex data manipulation before they can communicate their results.
Data visualization tools offer the chance to fill this gap; they present the opportunity to
transform collections of data into a cohesive story. The visual display of data sets - be it on
geographic maps, heat mapping, or more traditional charts - allows the human brain to pick out
correlations and relationships that we otherwise wouldn’t see. Providing self-service access to
visual analysis presents a compelling opportunity with the potential for significant value to
businesses.
The Neurological Basis of Data Visualization – Human Preferences
For the same reasons that memorable orators use stories to illustrate their points, the human
brain is uniquely adept at using pictures and visualizations to understand relationships. We
find this understanding inherently natural; we’ve long been told that a picture is worth a
thousand words, and there is a general trend towards visualization in how we consume
information. Consider the immense popularity of the New York Times visual media efforts, the
reach of Nate Silver’s project FiveThirtyEight, or just the growing research showing that social
media posts involving images receive higher levels of engagement.
In light of all of this, it is helpful to understand the benefits of data visualization from the
interesting angle of cognitive science. The human mind is fantastic at pattern recognition, yet is
comparatively lackluster in a computational sense. To test the limits of human computation,
one need go no further than competing head-to-head against an individual armed with an
inexpensive calculator. In the race to figure out the square root of any reasonably large number,
the individual with the calculator would certainly win. Alternatively, consider the task of
recommending a movie to a friend. An average person can do just as well, if not better, than
Netflix. This is something we might take for granted, but in reality we should marvel at the
Analyst Insight SHARE THIS REPORT
Page |2
Translating Technology to Success
Blue Hill Research 24 School Street, Mezzanine Boston, MA 02108 http://www.bluehillresearch.com
617.624.3600
@BlueHillBoston
human ability of making a recommendation considering the complex algorithms, vast
computing power, and millions of dollars Netflix invested in to provide an artificial version of
this recommendation capability that we all take for granted. Netflix must analyze the outcomes
and metadata associated with thousands of people and past decisions to arrive at a conclusion
we might find to be intuitively obvious.
Behind this seeming inconsistency are the neural networks of our brains. Our brains use neural
networks to allow us to predict patterns based on external stimuli at great speed. Once we learn
a pattern, the brain is excellent at recognizing it again. Visual imagery is one of the most
significant inputs into our brain’s pattern-recognition process.
In this sense, data visualization tools play into our biological sweet spot. The human mind may
not intuitively understand complex statistical models or concepts such as ‘R squared’ values,
but we are quite adept at picking out patterns from visual displays.
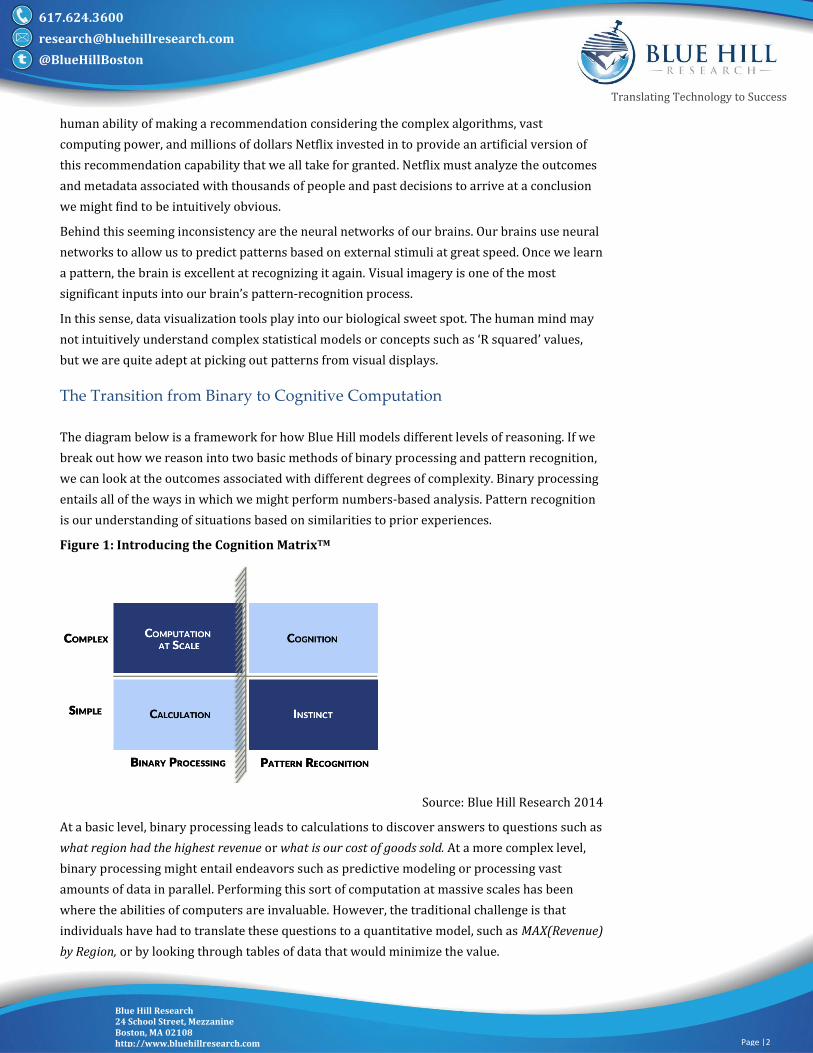
The Transition from Binary to Cognitive Computation
The diagram below is a framework for how Blue Hill models different levels of reasoning. If we
break out how we reason into two basic methods of binary processing and pattern recognition,
we can look at the outcomes associated with different degrees of complexity. Binary processing
entails all of the ways in which we might perform numbers-based analysis. Pattern recognition
is our understanding of situations based on similarities to prior experiences.
Figure 1: Introducing the Cognition MatrixTM
Source: Blue Hill Research 2014
At a basic level, binary processing leads to calculations to discover answers to questions such as
what region had the highest revenue or what is our cost of goods sold. At a more complex level,
binary processing might entail endeavors such as predictive modeling or processing vast
amounts of data in parallel. Performing this sort of computation at massive scales has been
where the abilities of computers are invaluable. However, the traditional challenge is that
individuals have had to translate these questions to a quantitative model, such as MAX(Revenue)
by Region, or by looking through tables of data that would minimize the value.

Page |3
Translating Technology to Success
Blue Hill Research 24 School Street, Mezzanine Boston, MA 02108 http://www.bluehillresearch.com
617.624.3600
@BlueHillBoston
While we frequently rely upon machines to enhance our ability in the realm of binary
processing, our brains are modeled to excel at pattern recognition. Simple pattern recognition
manifests itself in the form of instinct. In the physical world, it is our ability to do things such as
catch a fly ball, while in the business world it may be the understanding that two straight
quarters of declining revenue spells trouble.
However, complex pattern recognition is the most valuable form of understanding the world
around us. It is the level of cognition and critical decision-making. Complex pattern recognition
enables decision makers to know what product line to launch, or which emerging market
presents the greatest opportunity. It’s how we forecast the future and make sense of the past. In
the data-centric world of today’s businesses, it is the ability to make sense of the large-scale
computations our computers run. Most importantly, pattern recognition gives us the ability to
know when our models are useful, and when they might be wrong.
Because of our brain’s disposition to visual cues, bridging the gap from binary processing to
pattern recognition often requires some form of visualization. In the example of catching a fly
ball, a major league outfielder could use inputs of velocity and trajectory to calculate exactly
where a ball is going to land – but the binary processing would take too long. Instead, our brain
understands the visual cue of the ball’s flight in relation to past experiences, and the fielder
instinctually knows where to go. At more complex levels, visualizations show interrelationships
and trends that we may not have previously picked up. For this reason, visualization is an
extremely useful tool in breaking down barriers between computations and decision-making.
Figure 2: How Visualization Affects the Cognition MatrixTM
Source: Blue Hill Research 2014

Page |4
Translating Technology to Success
Blue Hill Research 24 School Street, Mezzanine Boston, MA 02108 http://www.bluehillresearch.com
617.624.3600
@BlueHillBoston
COGNITIVE
COMPUTING
Cognitive computing represents a transition in enabling computers to “think” or “reason” in a way similar to the human mind. Cognitive computing systems learn and interact naturally with people to extend what either humans or machine could do on their own. IBM has been the most visible innovator in this arena, as it has championed the advent of cognitive computing through both Watson and the cognitive-inspired SyNAPSE chip, and committed to growing their Watson unit to a $10 billion business.
IBM Watson Analytics: Getting from Computation to Understanding
On December 16th 2014, IBM announced the public release of IBM Watson Analytics. Watson
Analytics is a combination of data cleansing, analytics, and visualization delivered as a
self-service solution. This enables users to discover correlations, interdependencies, and most
importantly, insights from data. Watson Analytics combines cognitive computing aspects and
predictive capabilities (such as SPSS Analytic Catalyst for analytic presentation) from IBM’s
portfolio to provide a platform well-suited for visual-based data discovery and analysis. The
IBM Design-created user experience enhances the ease of use so that nearly anyone with a basic
understanding of spreadsheets can gain value from the solution.
IBM is offering Watson Analytics through a freemium cloud-based deployment. Options are
available to migrate to a paid version for larger and more complex deployments throughout an
organization, or to provide integration with other IBM analytics software solutions such as
Cognos or SPSS.
Watson Analytics features a search-engine like interface where users type questions to directly
get answers from their data. Users can also interact with tiles and buttons to simplify predictive
and data cleansing requests. Watson Analytics users can access predictive analysis without
needing to know how to build and develop statistical models, because predictive modeling is
built-in and automated based on the plain-language requests and clicks that a user provides. In
this way, Watson Analytics extends the accessibility of data analysis to a broader spectrum of
users from the statistically savvy to general business users with no prior analytic training.
Watson Analytics highlights suggested areas to further explore, and recommends the best ways
to visually portray findings. Users will find that the solution further emphasizes visual
storytelling through heavily integrated storyboards and automated analysis displays.
Figure 3: Watson Analytics Home Screen
Source: Blue Hill Research 2014

Page |5
Translating Technology to Success
Blue Hill Research 24 School Street, Mezzanine Boston, MA 02108 http://www.bluehillresearch.com
617.624.3600
@BlueHillBoston
Watson Analytics automates data cleansing and the identification of relevant data points and
trends through back-end machine learning and pattern recognition that front-end users do not
directly set up or interface. Because of this, Watson Analytics presents an opportunity to
augment the efforts of users by reducing both technical and time-consuming barriers to
analysis. For instance, an analyst uploading a spreadsheet containing missing, incomplete, or
redundant information would find that Watson Analytics could identify points of friction in
future analysis. The value for users is further extended as Watson Analytics can automate or
recommend actions to standardize, complete, or prepare the data for analysis.
A key component to the value proposition of Watson Analytics is its contribution to visual
storytelling of data. A traditional struggle for many has been choosing the right type of
visualization method to best display findings or communicate relationships within data. Watson
Analytics automatically produces visualizations tailored to the type of data used and analysis
being performed. Further, Watson Analytics provides recommendations for alternative ways to
display data that users can easily choose and toggle between. For instance, Watson Analytics
may automatically display data sets over a geographic map, while providing the option to
display data alternatively as a tree map, heat map, or bubble chart depending on the style of
analysis being performed.
Watson Analytics furthers the value of automated recommendations through building out an
intuitive workflow for authoring dashboards and infographics. Rather than work through
traditional command lines and code, Watson Analytics provides customizable interfaces, a
drag-and-drop design, and a search engine where users can use natural-language queries to
support their data.
As a result, Watson Analytics provides users with help throughout the visualization process. At
the beginning, Watson Analytics will provide initial recommendations on the most relevant and
important data fields and relationships so that the user focuses on the data that matters within
what may be a large and incomplete table, spreadsheet, or database. Afterwards, the software
will provide a number of visual recommendations to demonstrate optimal visualizations for the
data in question, each of which can be selected through a single click. Once the user has chosen
the visualization best suited to the intended data-driven story, the user can also edit the
visualization as necessary. This allows for authoring appropriate insights needed in storytelling
and presentation.
As Watson Analytics is generally available, Blue Hill expects that the solution will provide an
opportunity for a wide audience of users to more efficiently gain insights and to communicate
results from data analysis. The intersection of machine learning capabilities and the visual
communications of analysis ultimately allow Watson Analytics to bridge the gap between
complex calculations and intuitive cognition for human decision-making.

Page |6
Translating Technology to Success
Blue Hill Research 24 School Street, Mezzanine Boston, MA 02108 http://www.bluehillresearch.com
617.624.3600
@BlueHillBoston
Conclusion
Because visualization presents high value opportunities to effectively discover and
communicate results from data analysis, software providers have invested heavily in bringing
these capabilities to market. As vendors in the analytics space continue to converge on
providing strong visualization offerings, a challenge will emerge around differentiation. Ease of
use, advanced visualization capabilities, and industry-specific targeting will be ongoing
battlegrounds for market share. With solutions continuing to evolve, self-service access for
line-of-business users, embedded storytelling features, and support of governed data discovery
will be competitive necessities. Established vendors and new entrants looking to play in the
data visualization space must compete in these emerging areas to provide the value that
businesses are demanding.
Companies considering how to best empower the decision-making of their business analysts
should not underestimate the power of data visualization. The right visualization tools
represent an attainable way for business analysts to transform data from columns and rows
into actionable storylines.
Authors: James Haight, Analyst, [email protected]
Published: December 2014