Embed Size (px)
Citation preview

© 2015 McGraw Hill Financial. All Rights Reserved.
A McGraw Hill Financial White Paper
October 2015
Lillian Federico Andrew Heath Dan Seldin, Ph.D.
President Senior Director Director Regulatory Research Associates, Utility & Infrastructure Practice Analytic Center of Excellence a division of SNL Energy J.D. Power J.D. Power
How Customer Satisfaction Drives Return On Equity for Regulated Utilities

© 2015 McGraw Hill Financial. All Rights Reserved. 1
TABLE OF CONTENTS
Introduction 2
Executive Summary 3
Impact of Customer Satisfaction on Profit and Credit Ratings 4
Capital Expenditure Overview 6
Rate Case Trends 10
Return on Equity Trends 12
Relationship between Customer Satisfaction and Return on Equity 16
Conclusions 23
Copyright © 2015 by McGraw Hill Financial. All Rights Reserved. Reproduction Prohibited. This material is the property of McGraw Hill Financial or is licensed to McGraw Hill Financial. The user of this material shall not edit, modify, or alter any portion. Any material quoted from this publication must be attributed to “How Customer Satisfaction Drives Return On Equity for Regulated Electric Utilities” published by McGraw-Hill Financial, © 2015 McGraw Hill Financial. All Rights Reserved.

© 2015 McGraw Hill Financial. All Rights Reserved. 2
Introduction
The purpose of this white paper is to share the key findings from in-depth analyses completed by J.D.
Power and SNL Energy regarding the recent results of rate cases for regulated U.S. utilities. The white
paper focuses on the approved return on equity (ROE) for recent rate cases, demonstrating how
customer satisfaction influences the authorized ROE for regulated electric utilities.
The research presented herein updates the previous analysis conducted by J.D. Power, which found that
customer satisfaction is a leading indicator of the approved return on equity for regulated electric
utilities. The original J.D. Power white paper on this topic was published in May 2012:
“How Customer Satisfaction Drives Return On Equity for Regulated Electric Utilities”
Andrew Heath and Dan Seldin, Ph.D.
Both the 2015 and 2012 white papers are published at www.jdpower.com and www.snlenergy.com.
© 2015 McGraw Hill Financial. All Rights Reserved. 3
Executive Summary
During the past decade, J.D. Power, SNL Energy affiliate Regulatory Research Associates, and Standard and Poor’s Rating Services* have examined the relationship between customer satisfaction and key financial metrics in the electric utility industry, such as profitability and credit ratings. During the same period, the number of electric rate cases has steadily increased, prompting McGraw Hill Financial to take a closer look at the relationship between satisfaction and return on equity (ROE) in the industry. Similar to profitability and credit ratings, customer satisfaction has a noteworthy impact on ROE for regulated electric utilities. This white paper summarizes and provides an update to the findings previously published in 2012.
When the customer satisfaction results of regulated electric utilities are categorized into quartiles, results show that higher levels of satisfaction one year prior to a rate case are associated with higher levels of ROE. On average, a 10-point increase in satisfaction (based on J.D. Power’s proprietary 1,000-point index scale) is associated with a .04% increase in ROE. More importantly, there is an increase in ROE among utilities in the top quartile of customer satisfaction one year prior to their rate case; on average, top quartile utilities earned 10.7% ROE whereas bottom quartile utilities earned 10.1% ROE. Applying this 0.6% increase to an equity base of $1 billion translates into a $6 million annualized increase in earnings available to shareholders. Moreover, utilities in the top quartile also receive rate increases closer to their request than do utilities in the bottom quartile.
The primary implication of these findings is this: investing in the customer experience can yield rewards as significant as those when investing in tangible assets, such as power plants, transmission lines, and distribution infrastructure.
* J.D. Power, SNL Energy, and Standard and Poor’s Rating Services are business units of McGraw Hill Financial

4 © 2015 McGraw Hill Financial. All Rights Reserved.
Impact of Customer Satisfaction on Profit and Credit Ratings

© 2015 McGraw Hill Financial. All Rights Reserved. 5
• In a 2005 report, S&P Rating Services provided insights regarding how it uses customer satisfaction data when determining utility credit ratings.1
The report included findings from an internal study conducted by S&P that compared the opinions of credit analysts about the regulatory environment of particular utility companies with a utility’s customer satisfaction index score, as measured by J.D. Power. S&P’s analysis identified a correlation between the credit analyst’s view of regulatory risk and customer satisfaction. Furthermore, based on those findings, S&P clarified its methodology would include customer satisfaction as one of the many variables they use to assess risk and, ultimately, their credit ratings.
1 “Customer Satisfaction Levels Can Affect U.S. Utility
Credit Quality,” Todd Shipman. Standard & Poor’s Ratings Direct Service. August 2005.
Impact of Customer Satisfaction on Credit Ratings and Profit
• One of the primary drivers and key performance indicators for all companies is profit. Ongoing research conducted by J.D. Power examines the relationship between electric utilities’ customer satisfaction performance and their most recently published profit margin, as reported by utilities to the Federal Energy Regulatory Commission (FERC). Results show a positive relationship between the level of satisfaction and profit margin. Electric utilities in the top quartile of customer satisfaction typically report profits 3%-4% higher than utilities in the three lower quartiles.
8.3% 7.9%
10.0%
12.4%
Bottom Quartile 3rd Quartile 2nd Quartile Top Quartile
2015 Industry Quartiles based on Overall Customer Satisfaction
2014 Profit Margin %
Sources: J.D. Power 2015 Electric Utility Residential Customer Satisfaction StudySM and Federal Energy Regulatory Commission (FERC) Data, 2014

6 © 2015 McGraw Hill Financial. All Rights Reserved.
Capital Expenditure Overview

© 2015 McGraw Hill Financial. All Rights Reserved. 7
Drivers of Capital Expenditure/Rate Case Activity
Rate Base Additions/Capital Expenditures
• Remediating aging infrastructure
• Storm restoration costs
• Reliability-system hardening
• Environmental compliance
• Need for new generation
• Renewable resource requirements
• Transmission expansion
Net Operating Income Impacts
• Rising employee costs—pension and healthcare
• Demand Side Management program costs/lost revenues
• Weakness in (or lack of) sales growth
• Inflation
There are many drivers that have led to the need for the electric industry to increase capital investments and address changes in net operating income. In turn, these drivers have led to an increased need to secure rate case increases for the majority of regulated U.S. electric utilities. The main drivers in each category are as follows:

© 2015 McGraw Hill Financial. All Rights Reserved. 8
• One of the overarching themes in regulation during the next several years will be the need to address increased utility capital spending plans. While capital expenditures in the utility industry are expected to be somewhat lower in 2016 and 2017 than are forecasted for 2015, the projected level of spending in the 2015-2017 time frame is nearly double the level spent in the 2006-2008 time frame.
• As illustrated in the graph below, the 45 companies included in the RRA Index are projecting that capital expenditures will aggregate to $102 billion in 2015 vs. only $52 billion in 2006. These companies include the largest (by customer count) investor-owned electric and gas utility holding companies in the United States.
• While 2016 and 2017 forecasts are somewhat lower than 2015 at $99 million and $92 million, respectively, these levels are higher than previously forecasted for 2016 and 2017. The increased level of capital expenditure is expected to continue.
Capital Expenditure Trends
51.9 60.5
68.2 65.8 65.1 70.4
84.3 85.6 91.2
102.4 99.2 91.6
2006 2007 2008 2009 2010 2011 2012 2013 2014 2015E 2016E 2017E
Total Capital Expenditures for 45 Utilities Historical and Forecast ($ billions)
Source: Regulatory Research Associates, a division of SNL Energy
© 2015 McGraw Hill Financial. All Rights Reserved. 9
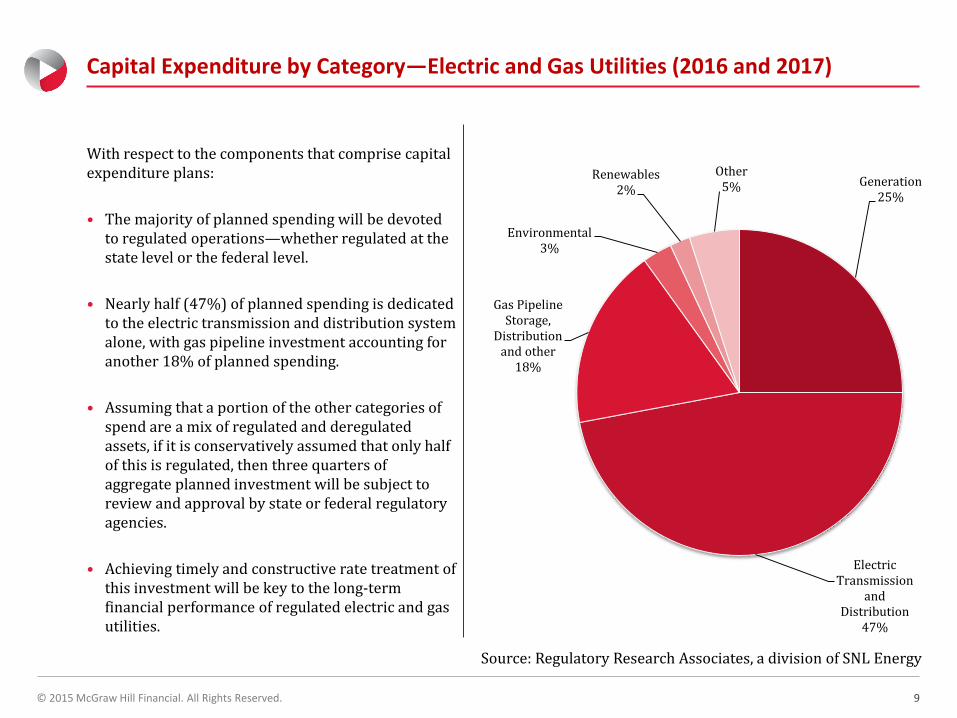
With respect to the components that comprise capital expenditure plans:
• The majority of planned spending will be devoted to regulated operations—whether regulated at the state level or the federal level.
• Nearly half (47%) of planned spending is dedicated to the electric transmission and distribution system alone, with gas pipeline investment accounting for another 18% of planned spending.
• Assuming that a portion of the other categories of spend are a mix of regulated and deregulated assets, if it is conservatively assumed that only half of this is regulated, then three quarters of aggregate planned investment will be subject to review and approval by state or federal regulatory agencies.
• Achieving timely and constructive rate treatment of this investment will be key to the long-term financial performance of regulated electric and gas utilities.
Capital Expenditure by Category—Electric and Gas Utilities (2016 and 2017)
Generation 25%
Electric Transmission
and Distribution
47%
Gas Pipeline Storage,
Distribution and other
18%
Environmental 3%
Renewables 2%
Other 5%
Source: Regulatory Research Associates, a division of SNL Energy

10 © 2015 McGraw Hill Financial. All Rights Reserved.
Rate Case Trends
© 2015 McGraw Hill Financial. All Rights Reserved. 11
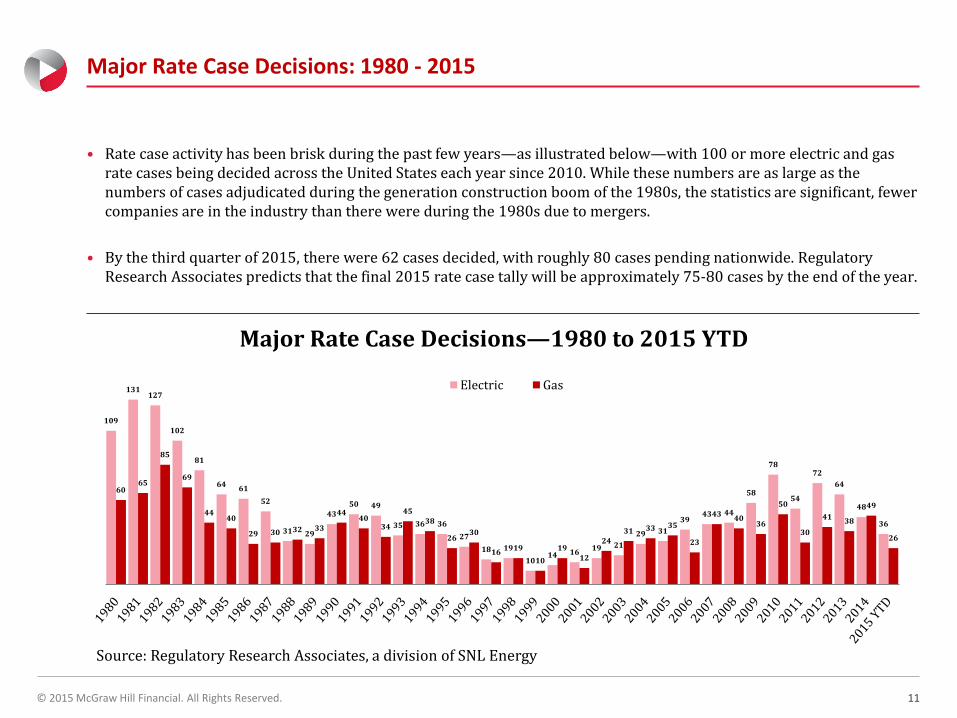
• Rate case activity has been brisk during the past few years—as illustrated below—with 100 or more electric and gas rate cases being decided across the United States each year since 2010. While these numbers are as large as the numbers of cases adjudicated during the generation construction boom of the 1980s, the statistics are significant, fewer companies are in the industry than there were during the 1980s due to mergers.
• By the third quarter of 2015, there were 62 cases decided, with roughly 80 cases pending nationwide. Regulatory Research Associates predicts that the final 2015 rate case tally will be approximately 75-80 cases by the end of the year.
Major Rate Case Decisions: 1980 - 2015
109
131 127
102
81
64 61
52
31 29
43 50 49
35 36 36
27
18 19
10 14 16
19 21
29 31
39 43 44
58
78
54
72
64
48
36
60 65
85
69
44 40
29 30 32 33
44 40
34
45 38
26 30
16 19
10
19 12
24 31 33 35
23
43 40
36
50
30
41 38
49
26
Major Rate Case Decisions—1980 to 2015 YTD
Electric Gas
Source: Regulatory Research Associates, a division of SNL Energy

12 © 2015 McGraw Hill Financial. All Rights Reserved.
Return on Equity Trends

© 2015 McGraw Hill Financial. All Rights Reserved. 13
Drivers of Authorized Return on Equity
Approved return on equity has recently been driven by interest rates that are at or near historical lows; regulators’ concerns about the economic hardship for customers associated with increasing rates as well as their tolerance for the same in light of the sheer amount of capital spending that must be recognized; and the presence of such risk-reducing features as decoupling mechanisms.
In contrast to the negative forces has been a heightened sensitivity among regulators to liquidity and credit quality issues that developed following the 2008 economic crisis; the need to maintain access to capital to fund capital expenditure programs; incentive ROE premiums that have been awarded for certain asset classes; and a recognition by commissions that uncertainty in the broader economic markets means uncertainty for utilities.
Return on
Equity
• Interest rates—near historical lows
• Impact and timing of quantitative easing
• Economic hardship for customers
• Risk-reducing mechanisms
• Consideration of utility liquidity/financial health
• Need to maintain access to capital
• Incentive ROE premiums
• Economic uncertainty for utilities
Return on
Equity
© 2015 McGraw Hill Financial. All Rights Reserved. 14
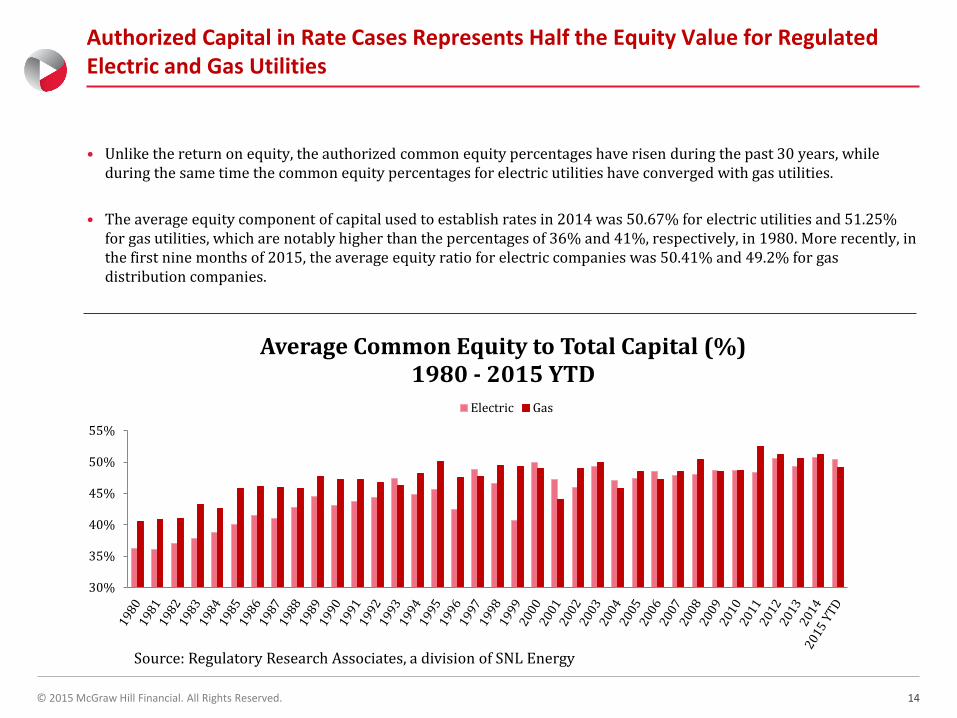
• Unlike the return on equity, the authorized common equity percentages have risen during the past 30 years, while during the same time the common equity percentages for electric utilities have converged with gas utilities.
• The average equity component of capital used to establish rates in 2014 was 50.67% for electric utilities and 51.25% for gas utilities, which are notably higher than the percentages of 36% and 41%, respectively, in 1980. More recently, in the first nine months of 2015, the average equity ratio for electric companies was 50.41% and 49.2% for gas distribution companies.
Authorized Capital in Rate Cases Represents Half the Equity Value for Regulated Electric and Gas Utilities
30%
35%
40%
45%
50%
55%
Average Common Equity to Total Capital (%) 1980 - 2015 YTD
Electric Gas
Source: Regulatory Research Associates, a division of SNL Energy

© 2015 McGraw Hill Financial. All Rights Reserved. 15
• Average authorized returns on equity for electric and gas utilities included in the RRA Index have been trending downward since they peaked at close to 16% in 1982. In general, electric and gas ROEs have moved together, while authorized ROEs for the gas industry have remained modestly below those for the electric industry.
• In 2014, the average ROE authorized for electric utilities nationwide was 9.91%, and the average ROE for gas utilities was 9.78%. For the first nine months of 2015, the average ROE was 10.0% for electric utilities and 9.49% for gas utilities. This difference is largely attributable to incentive ROE premiums offered in certain jurisdictions for select types of electric generation investment.
Authorized ROE Trends: 1980-2015 YTD
8%
9%
10%
11%
12%
13%
14%
15%
16%
17%
Average Return on Equity (%) 1980 - 2015 YTD
Electric Gas
Source: Regulatory Research Associates, a division of SNL Energy

16 © 2015 McGraw Hill Financial. All Rights Reserved.
Relationship between Customer Satisfaction and Return on Equity

© 2015 McGraw Hill Financial. All Rights Reserved. 17
Methodology
• To assess the relationship between satisfaction and rate case outcomes, the approved ROE from each rate case and the customer satisfaction results of the J.D. Power Electric Utility Residential Customer Satisfaction Study,SM 2001- 2015 were examined. The study surveys customers of large and midsize utilities regarding their experiences with their utility in six key factors: Power Quality & Reliability; Price; Billing & Payment; Communications; Corporate Citizenship; and Customer Service. The relative importance of each factor in relation to overall customer satisfaction with a utility’s performance is derived using J.D. Power’s proprietary index methodology. These derived importance weights are then applied to customer ratings, and utility company customer satisfaction performance is then based on aggregating the weighted ratings into an overall satisfaction index score that ranges from 100 to 1,000 points.
• National rate case information for 2002 to 2014 was gathered from SNL Energy’s Regulatory Research Associates’ database of regulator requests and outcomes. The majority of the rate cases included in the final analysis occurred between 2006 and 2015. The rate case database included the submission and close dates for each rate case; the initial requested amount; the return on equity; the authorized amount; the RRA commission utility score; the first counteroffer amount; and the second counteroffer amount.
• To assess the relationship between satisfaction and rate case outcomes, brand-level customer satisfaction data by year were merged with rate case data, yielding 436 data points. Customer satisfaction one year prior to the rate case submission was used to predict the various rate case outcomes. Pearson product moment correlations and simple linear regression models were used to determine the degree to which customer satisfaction impacts rate case outcomes.

© 2015 McGraw Hill Financial. All Rights Reserved. 18
• In general, utility brands with above-average customer satisfaction scores realize higher approved rates of return on equity than below-average brands. Furthermore, every year since 2001 the utilities with above-average satisfaction have realized the highest average approved return on equity.
• The approved ROE for bottom-quartile utilities is relatively flat over time and, while ROE rates are still higher among top-two quartile brands vs. bottom-two quartile brands today, that gap between the top and bottom brands has narrowed. In 2013 and 2014, there is some evidence that this premium is increasing again.
Since 2001, Electric Utilities with Above-Average Satisfaction Have Above-Average Return on Equity
9%
10%
11%
12%
13%
2001 2002 2003 2004 2005 2006 2007 2008 2009 2010 2011 2012 2013 2014
Av
era
ge
Ap
pro
ve
d R
OE
Approved ROE by Customer Satisfaction Quartile - Electric
Top Quartile 2nd Quartile 3rd Quartile Bottom Quartile
Customer Satisfaction
Sources: J.D. Power Electric Utility Residential Customer Satisfaction Study,SM 2001-2014 and Regulatory Research Associates, a division of SNL Energy
© 2015 McGraw Hill Financial. All Rights Reserved. 19
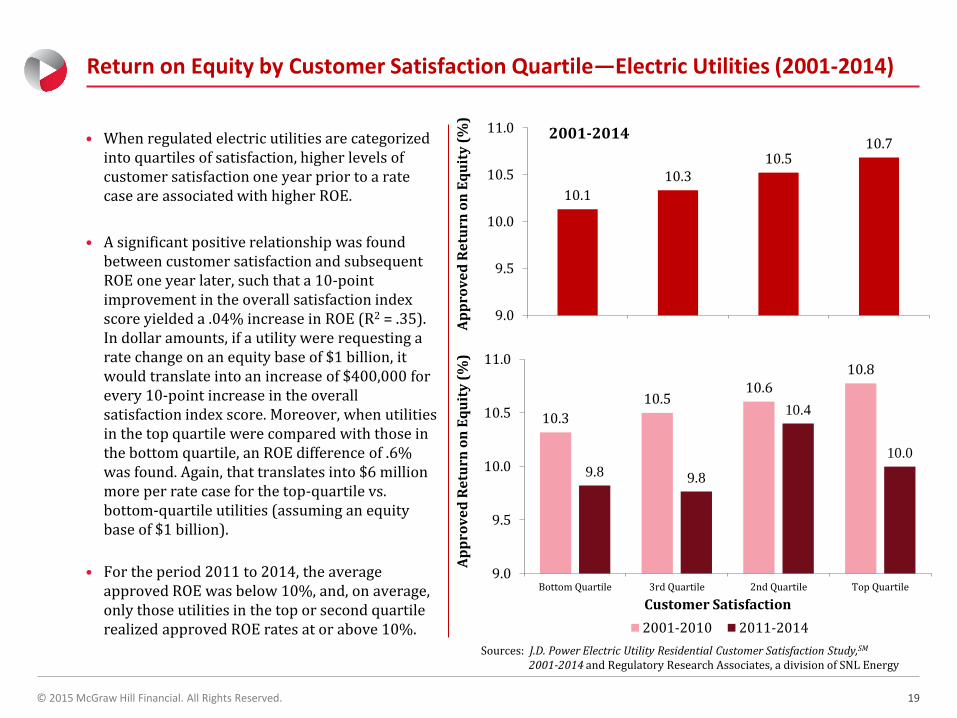
• When regulated electric utilities are categorized into quartiles of satisfaction, higher levels of customer satisfaction one year prior to a rate case are associated with higher ROE.
• A significant positive relationship was found between customer satisfaction and subsequent ROE one year later, such that a 10-point improvement in the overall satisfaction index score yielded a .04% increase in ROE (R2 = .35). In dollar amounts, if a utility were requesting a rate change on an equity base of $1 billion, it would translate into an increase of $400,000 for every 10-point increase in the overall satisfaction index score. Moreover, when utilities in the top quartile were compared with those in the bottom quartile, an ROE difference of .6% was found. Again, that translates into $6 million more per rate case for the top-quartile vs. bottom-quartile utilities (assuming an equity base of $1 billion).
• For the period 2011 to 2014, the average approved ROE was below 10%, and, on average, only those utilities in the top or second quartile realized approved ROE rates at or above 10%.
Return on Equity by Customer Satisfaction Quartile—Electric Utilities (2001-2014)
10.1
10.3 10.5
10.7
9.0
9.5
10.0
10.5
11.0
Ap
pro
ve
d R
etu
rn o
n E
qu
ity
(%
)
10.3
10.5 10.6
10.8
9.8 9.8
10.4
10.0
9.0
9.5
10.0
10.5
11.0
Bottom Quartile 3rd Quartile 2nd Quartile Top Quartile
Ap
pro
ve
d R
etu
rn o
n E
qu
ity
(%
)
Customer Satisfaction
2001-2010 2011-2014
2001-2014
Sources: J.D. Power Electric Utility Residential Customer Satisfaction Study,SM 2001-2014 and Regulatory Research Associates, a division of SNL Energy

© 2015 McGraw Hill Financial. All Rights Reserved. 20
• There are 21 electric brands measured by J.D. Power that submitted rate cases in 2014 that were approved on completion of the analysis in this white paper.
• In 2014, customer satisfaction explains 34% of the variability in the outcome of the levels of ROE approved by electric utility regulators.
• With one exception, the analysis of rate cases from each year from 2003 to 2013 also shows a positive relationship between satisfaction scores the year prior to submitting a rate case and the approved ROE.
• The 2014 data* shows the strongest relationship since 2003. Each year between 2003 and 2014, ROE explains an average of 10% of the variations in ROE.
* Sources: J.D. Power 2013 Electric Utility Residential
Customer Satisfaction StudySM and Regulatory Research Associates, a division of SNL Energy
2014 Correlation between Customer Satisfaction and ROE
8.5%
9.0%
9.5%
10.0%
10.5%
11.0%
11.5%
12.0%
12.5%
625 650 675 700 725 750
Ap
pro
ved
RO
E
Overall Customer Satisfaction Index
Approved ROE by Customer Satisfaction: 2014 Rate Cases
R2 = 0.34
Sources: J.D. Power 2013 Electric Utility Residential Customer Satisfaction StudySM and Regulatory Research Associates, a division of SNL Energy

© 2015 McGraw Hill Financial. All Rights Reserved. 21
• Consistent with findings from the 2012 white paper that examined the impact of customer satisfaction on ROE, the 2011 to 2015 findings also show that utilities with the highest proportions of highly satisfied customers (i.e., top quartile) received rate increases closer to their requests than did utilities in the bottom quartile.
• When measured in absolute terms, utilities in the bottom quartile received an approved rate increase that was an average of $49 million below their original request, whereas top-quartile utilities received an approved rate increase that was an average of $34 million less than initially requested.
Disallowance by Satisfaction—Electric Utilities (2011-2015)
($49)
($63)
($33) ($34)
BottomQuartile 3rd Quartile 2nd Quartile Top Quartile
Dis
all
ow
an
ce A
mo
un
t (m
illi
on
s)
Overall Customer Satisfaction
Sources: J.D. Power Electric Utility Residential Customer Satisfaction Study,SM 2001-2015 and Regulatory Research Associates, a division of SNL Energy

© 2015 McGraw Hill Financial. All Rights Reserved. 22
• Over the past five years, the average time taken to approve rate cases is more than seven months.
• On average, electric utilities with top-quartile satisfaction scores receive regulatory approval in less than seven months, compared with more than eight months for bottom-quartile utilities.
Top-Quartile Utilities Secure Rate Case Approvals Sooner Than Bottom-Quartile Utilities
8.1 8.6
7.5 6.9
0
2
4
6
8
10
Bottom Quartile 3rd Quartile 2nd Quartile Top Quartile
De
cisi
on
La
g (
mo
nth
s)
Customer Satisfaction
Decision Lag by Satisfaction Quartile (2011-2015)
Sources: J.D. Power Electric Utility Residential Customer Satisfaction Study,SM 2011-2015 and Regulatory Research Associates, a division of SNL Energy
23 © 2015 McGraw Hill Financial. All Rights Reserved.
Conclusions

© 2015 McGraw Hill Financial. All Rights Reserved. 24
Implications of Customer Satisfaction and Its Influence on Key Financial Metrics
• This research replicates previous work that found customer satisfaction is a leading indicator of the approved return on equity for regulated electric utilities.
• Providing customers a better experience yields improved rate case outcomes via faster approval turnaround, higher percentage of requested amounts granted, and an elevated allowed rate of return.
• That customer satisfaction can be a leading indicator of ROE remains an important discovery of the analysis conducted by J.D. Power and SNL Energy. This finding clearly suggests that utility companies can benefit directly from investing in programs aimed specifically at improving customer satisfaction. Data submitted to FERC indicate that when electric utilities invest in their customers, there is a corresponding improvement in satisfaction, suggesting that efforts can be aligned to achieve benefits for both customers and utilities.
• For regulated electric utilities, higher customer satisfaction is associated with higher rates of ROE and allowed returns that are closer to the requested returns. Other factors, especially prevailing interest rates, also drive ROE. Indeed, it is unlikely that customer satisfaction is the main driver of ROE. However, even a relatively small influence on ROE is noteworthy, given the major impact that approved ROE has on a regulated utility’s financial performance.
• For utilities with higher levels of customer satisfaction, it is encouraging that, on average, regulators tend to look more favorably on the requested ROE when reviewing their rate case. This positive regulatory environment, in turn, provides the utilities with additional support for further investments in their operations that continue to promote customer satisfaction. Unfortunately, the same dynamic may also explain why many utilities with dissatisfied customers fail to improve—they lack the regulatory support necessary to secure approval for the investments required to convert their dissatisfied customers into satisfied customers.

© 2015 McGraw Hill Financial. All Rights Reserved. 25
• For regulated electric utilities looking to maximize ROE during a rate case, it is important to know that customer satisfaction makes a difference. Therefore, regulated utilities need to understand their levels of satisfaction and what drives satisfaction. Furthermore, knowing how to improve customer satisfaction is important and can play a critical role in realizing higher ROE rates.
• Positive customer satisfaction creates positive regulatory outcomes that, in turn, support further investments to promote customer satisfaction. Conversely, customer dissatisfaction can constrain a utility’s ability to secure the funding needed to resolve the causes of dissatisfaction.
A Virtuous (or Vicious) Cycle
Satisfied Customers
Positive Regulatory Outcomes
Support for Investments that Satisfy Customers