Embed Size (px)
Citation preview
http://www.jstor.org
How Costly Is "Clean"? An Analysis of the Benefits and Costs of Superfund Site RemediationsAuthor(s): James T. Hamilton and W. Kip ViscusiSource: Journal of Policy Analysis and Management, Vol. 18, No. 1 (Winter, 1999), pp. 2-27Published by: John Wiley & Sons on behalf of Association for Public Policy Analysis andManagementStable URL: http://www.jstor.org/stable/3326070Accessed: 22/08/2008 16:13
Your use of the JSTOR archive indicates your acceptance of JSTOR's Terms and Conditions of Use, available at
http://www.jstor.org/page/info/about/policies/terms.jsp. JSTOR's Terms and Conditions of Use provides, in part, that unless
you have obtained prior permission, you may not download an entire issue of a journal or multiple copies of articles, and you
may use content in the JSTOR archive only for your personal, non-commercial use.
Please contact the publisher regarding any further use of this work. Publisher contact information may be obtained at
http://www.jstor.org/action/showPublisher?publisherCode=jwiley.
Each copy of any part of a JSTOR transmission must contain the same copyright notice that appears on the screen or printed
page of such transmission.
JSTOR is a not-for-profit organization founded in 1995 to build trusted digital archives for scholarship. We work with the
scholarly community to preserve their work and the materials they rely upon, and to build a common research platform that
promotes the discovery and use of these resources. For more information about JSTOR, please contact [email protected].

How Costly Is "Clean"? An Analysis of the Benefits and Costs of Jams . K ipVis si c -r^~~~~~ ^i~~ cand W. Kip Viscusi Superfund Site Remediations
Abstract
The cleanup of hazardous waste sites under the U.S. Environmental Protection Agency's Superfund program is governed by a number of legislative and regulatory constraints. Congress passed legislation in 1986 directing the Environmental Pro- tection Agency (EPA) to pursue permanent remedies that embodied stringent cleanup standards. The agency has chosen to use conservative assumptions in risk assess- ments at hazardous waste sites, including a presumption that on-site risks for hypo- thetical future residents should be calculated in the site remediation process. This article offers the first comprehensive assessment of the cost-effectiveness of these Superfund cleanups. Our results reveal that many EPA Superfund remediations fail a partial benefit-cost test. For a sample of the 150 Superfund sites, we find that at the majority of sites the expected number of cancers averted by remediation is less than 0.1 cases per site and that the cost per cancer case averted is over $100 million. The analysis demonstrates the importance of explicitly calculating the trade-offs embodied in environmental cleanup decisions. ? 1998 by the Association for Public Policy Analysis and Management
INTRODUCTION
During the 1980s risks from hazardous waste sites ranked as the top environmental problem in popular opinion surveys, even though environmental experts rated these risks as low to moderate [U.S. Environmental Protection Agency (EPA), 1987]. The Superfund program translated this public concern into government and private expenditures to clean up hazardous waste sites. Public and private expenditures and commitment of funds to clean up nonfederal sites totaled $20 billion in the first dozen years of the program, 1981 to 1992 [Congressional Budget Office (CBO), 1994]. The program accounted for nearly 25 percent of the EPAs budget from 1991 to 1996. When the program's authorization expired in 1994, legislative debate centered around the stringency of cleanup standards (that is, "How clean is clean?") and the desirability of alternative funding mechanisms (that is, "Who pays?"). Academic debates about the program have focused on program management and decision rules [Barnett, 1994;
Journal of Policy Analysis and Management, Vol. 18, No. 1, 2-27 (1999) ? 1998 by the Association for Public Policy Analysis and Management Published by John Wiley & Sons, Inc. CCC 0276-8739/98/01002-26

How Costly Is "Clean"? An Analysis of the Benefits and Costs of/ 3 Superfund Site Remediations
Church and Nakamura, 1993; Doty and Travis, 1989], the role of transaction costs in site remediations [Acton and Dixon, 1992], the potential impact of congressional oversight or neighborhood composition on site cleanups [Gupta, Van Houtven, and Cropper, 1996; Hird, 1990, 1994; Zimmerman, 1993], the way risk assessments are conducted in the program [Burmaster and Harris, 1993; Hamilton and Viscusi, 1995], the nature of site risks [Johnson, 1995; National Research Council, 1991], and the effects of funding mechanisms on program operation [Probst and Portney, 1991; Probst, et al., 1995; Revesz and Stewart, 1995; Sigman 1998]. Although the aggregate costs of cleanups have been estimated during the reauthorization debate [CBO, 1994; Russell and Davis, 1995], analysts have not presented detailed evidence on how cost- effective Superfund remediations are.
This article offers the first systematic evidence that links risks measures with cost data to derive estimates of the effectiveness of Superfund site remediations. For a sample of 150 sites, we find that the maximum individual cancer risks calculated by the agency are high relative to other regulated risks. More than 85 percent of the sites had maximum individual cancer risks greater than or equal to 1 in 10,000. Yet many of these risks are based on hypothetical changes in land use envisioned in the future and involve conservative parameter assumptions. Monte Carlo analysis reveals that the compounding of conservatism in current EPA guidance results in risks that are often in the 99th percentile of simulated risks. If mean parameter values are used for chemical concentration, ingestion rate, and exposure duration, the percentage of sites with maximum adult ingestion risks greater than or equal to 1 in 10,000 drops to 54 percent.
Once individual risk data are linked with census information on exposed populations, the dangers arising from Superfund site contamination appear much different. For our sample of 150 sites, expected cancer cases arising from chemical contamination are relatively low at the majority of sites. The median number of expected cancer cases per site over 30 years is less than 0.1 expected cancer cases. Costs per cancer case averted are very high at most of these sites, with only 44 out of 145 sites having a cost per cancer case averted less than $100 million. Costs per cancer case averted are high in part because of the state environmental standards imported from other environmental programs, standards that result in cleanup goals that are more stringent than those based on site-level analysis of individual risks. Although our work establishes that the majority of Superfund site remediations would fail a partial benefit- cost analysis, questions remain about why the agency's policies generate such inefficient remediations. The results from our analysis suggest at least four hypotheses: the costs of delegation in the principal-agent relationship between Congress and the EPA; the general focus on levels of individual cancer risk rather than numbers of expected cancer cases in many federal risk regulation programs; the distrust of explicit calculations of the cost-effectiveness of site remediations; and the potential opposition of residents surrounding Superfund sites to less costly cleanups. Our analysis demonstrates the potential gains in implementing the Superfund program if sensitivity analysis were implemented in risk assessments, geographic information systems technology were used to combine individual risk information with population data, and regulators were required to estimate benefit-cost trade-offs and allowed to choose remediations in part on the basis of these estimates.
THE DISTRIBUTION OF INDIVIDUAL RISKS AT SUPERFUND SITES
The original legislation establishing the Superfund program, the Comprehensive Environmental Response, Compensation, and Liability Act of 1980 (CERCLA), became

4 / How Costly Is "Clean"? An Analysis of the Benefits and Costs of Superfund Site Remediations
law during the waning months of the Carter administration. The definition and implementation of this national program for the cleanup of hazardous wastes, however, was left to an EPA directed by Reagan appointees who questioned the efficacy of vigorous attempts to enforce the act. The early years of the Superfund program were marked by a lack of clear cleanup standards, a preference for containment of waste rather than its treatment, an emphasis on the selection of the lowest cost remedies at sites, declining expenditures on agency enforcement and on research and development, and mismanagement [Barnett, 1994; Church and Nakamura, 1993; Hird, 1994]. The Superfund Amendments and Reauthorization Act of 1986 (SARA) was passed as an explicit attempt by Congress to alter the pace and quality of Superfund cleanups. Reversing the EPAs revealed preference for low cost-containment remedies, the legislation stated a preference for site remediation that "permanently and significantly reduces the volume, toxicity, or mobility of hazardous substances" [42 USC 9621 (b)( 1)]. The act also required that remedial actions at sites comply with federal environmental standards considered to be an "applicable or relevant and appropriate" requirement (ARAR) and declared that state ARARs had to be met at Superfund sites if they were stricter than federal ones, except under certain conditions where ARARs could be waived.
The language of SARA created goals for more stringent cleanups but left the implementation of those goals to the EPA to specify. In the years following SARA, the EPA explicitly articulated those cleanup goals. The EPAs 1990 National Contingency Plan defined two criteria, overall protection of human health and the environment, and the attainment (or specific waiver) of federal or state ARARs as thresholds that every remedy would have to meet [National Oil and Hazardous Substances Pollution Contingency Plan, 1990]. In choices among those remediation alternatives that passed this threshold, EPA rules did leave some discretion. The agency's policy allowed regional EPA officials choosing site remediations to consider the criteria of long- term effectiveness and permanence; reduction of toxicity, mobility, or volume; short- term effectiveness; implementability; and cost-effectiveness. The EPA also specified as additional modifying criteria the state's and community's acceptance of the remedy. Cleanup goals that protected human health were identified for noncarcinogens as chemical levels "to which human populations, including sensitive subgroups such as pregnant women and children, may be exposed without adverse effect during a lifetime or part of a lifetime" and for carcinogens as concentration levels that "represent an excess upperbound lifetime cancer risk to an individual to between 10-4 and 10-6 lifetime excess cancer risk" [National Oil and Hazardous Substances Pollution Contingency Plan, 1990, p. 8713]. These numerical guidelines and the use of an individual risk- level trigger rather than a risk measure reflecting both probability and population size were agency decisions, not legislative constraints. Because of the role that individual risk levels may play in remediation decisions, our analysis starts by examining the distribution of individual risks across Superfund sites.
The progress of a hazardous waste site through the Superfund evaluation process generates a large amount of data. Over 36,000 sites had been reported by 1992 to the EPA as potentially of concern [EPA, 1994]. Using a rough index system called the Hazard Ranking System that incorporated information on contamination and potential exposure of populations, the EPA has placed 1388 sites (153 federal, 1235 nonfederal) on the National Priorities List (NPL). Any site representing an immediate threat may qualify for removal actions. Since 1980, the EPA has conducted over 3000 removals at both NPL and non-NPL sites at an average cost approaching $500,000 to address imminent health dangers [U.S. EPA, 1990; U.S. EPA 1994]. Only sites on the NPL, however, qualify for the expenditure of federal remediation funds. Sites on the NPL progress through a process of remedial investigation and feasibility studies (RI/
How Costly Is "Clean"? An Analysis of the Benefits and Costs of/ 5 Superfund Site Remediations
FS), which generate detailed risk assessments and examinations of alternative remedies. This process is targeted to take 18 months at a cost of $1.1 million per site [U.S. EPA, 1989]. Based on risk and cost information and cleanup targets established by statute and regulations, the EPA issues a Record of Decision (ROD) detailing which remedy will be employed and what the target cleanup goals are in terms of chemical concentrations or risk levels.
Our examination of risks and costs at Superfund sites builds on the data generated by the EPA in site decisionmaking. The analysis focuses on the 267 nonfederal sites where RODs were signed in 1991 or 1992, a group of sites that is representative of the full nonfederal NPL in terms of regional distribution, past site use, and the nature of contamination. The RODs from this period were selected since the risk assessments done were generally comparable because they were based on the 1989 U.S. EPA Risk Assessment Guidance for Superfund. Based on site-level risk assessments, we developed a human health risk database containing information on over 20,000 chemical level exposure pathways at a subsample of 150 sites. Though the sample size drops from 267 to 150 sites for the risk assessment analysis since not all sites had comparable risk assessments, and resource constraints prevented data entry for all sites, this subsample of 150 sites is still representative of the full NPL in terms of regional distribution, past site use, and the nature of contamination. To determine population risks from exposure to groundwater and soil contamination, we used site-specific chemical concentrations and standardized mean parameters to calculate population risks for each site. Using geographic information systems (GIS) technology, we combined these risks with data on site boundaries, contaminated groundwater plume maps, and 1990 census data to estimate the expected numbers of cancers arising from site contamination over a 30-year period. We also developed a separate cost database, which contains information on capital costs and operation and maintenance expenditures for over 1700 remediation alternatives at 267 sites. Finally, for each site we linked the costs of remediation operation selected to the expected cancer cases in order to estimate the cost per cancer case averted [for an expanded discussion of our methodology, see Hamilton and Viscusi, 1998].
Concern for human health risks formed a primary basis for the development of the Superfund program. Under the CERCLA, the EPA has the authority to take action at hazardous waste sites "to prevent, minimize, or mitigate damage to the public health or welfare or to the environment" [42 USC 9601(23)]. In 1991 the EPAs Office of Solid Waste and Emergency Response further defined the role of risk assessment in remedy selection through a directive that stated in part: "Where the cumulative carcinogenic site risk to an individual based on reasonable maximum exposure for both current and future land use in less than 10-4, and the noncarcinogenic hazard is less than 1, action generally is not warranted unless there are adverse environmental impacts" [U.S. EPA, 1991]. The directive also stated that remedial actions could be taken at sites with risks between 10-4 and 10-6 if they were justified and that once a remediation was undertaken the cleanup goal would be in the 10-4 to 10-6 range. We refer to the range of risks between 10-4 and 10-6 as the discretionary zone because of the flexibility in EPA policy of choosing whether to remediate. Note that in order to change remediation policies at Superfund sites, one would need to address both the risk-based cutoffs that may trigger cleanups and the state and federal environmental standards imported into Superfund from other regulatory programs through ARARs.
At each site, risk assessments are conducted that detail the assumptions made by the EPA about chemical concentrations and exposure factors [Hamilton and Viscusi, 1995]. Cancer risks are expressed as lifetime excess cancer risks, and noncancer risks from a chemical are expressed as a hazard quotient, which equals the calculated

6 / How Costly Is "Clean"? An Analysis of the Benefits and Costs of Superfund Site Remediations
exposure intake of the chemical divided by its reference dose (an estimate of the level of exposure likely to be without appreciable risk or harmful noncarcinogenic effects). Risk assessors at each site have discretion in deciding which pathways of individual risks to estimate. A given risk pathway at a site is defined by a number of assumptions, including time scenario of exposure (for example, does the pathway involve a current or future land use?), exposed population (residents or workers?), exposed age group (adult or child?), population location (on-site or off-site?), medium location (on-site or off-site?), exposure medium (soil or groundwater?), and exposure route (dermal or ingestion?). From the EPA-approved baseline risk assessments, we collected data on over 20,000 chemical level risk pathways at 150 sites. These chemical level risks were then aggregated by population type to determine a cumulative risk to each population (for example, all risk pathways for different chemicals and different exposure media that on-site adult residents encountered were aggregated to form a cumulative individual cancer risk for a person in this population group). In Table 1 we use the maximum of the cumulative risk (for example, the summation of ingestion, dermal, and inhalation risks from all media) faced by a population as our indicator of carcinogenic risks at each site. This risk indicator was selected in part because remediations often focus on the maximum individual risk at sites.
Table 1 takes the risk scenarios as calculated in site documents as given and analyzes the distribution of the risk levels across 150 Superfund sites where RODs were signed in 1991 or 1992. The table shows that these maximum individual lifetime excess cancer risks are extremely high relative to risks addressed under other federal regulatory programs [see Viscusi, 1996, for evidence on individual annual risk levels regulated across different federal programs]. The mean maximum cumulative risk
Table 1. Distribution of sites by maximum cumulative risk.
Carcinogenic risk level Mean Median
Risk scenario 10-4 to 1 10-4 to 10-6 Below 10-6 Total sitesa risk risk
All 130 20 0 150 7.0E-02 2.5E-03 On-site 94 12 0 106 6.5E-02 3.8E-03 Off-site 41 8 0 49 7.7E-02 1.0E-03 Current 16 3 0 19 1.7E-02 5.1E-04 Future 114 19 0 133 7.6E-02 2.6E-03 F.O. res. 81 11 0 92 7.4E-02 4.0E-03 Not F.O. res. 53 9 0 62 6.3E-02 1.1E-03 Soil 18 11 0 29 5.3E-02 6.0E-04 Groundwater 112 9 0 121 7.2E-02 2.6E-03
Note: FO. res.=Future on-site resident. aTotal number of sites in categories does not sum to 150 because at some sites multiple populations are
exposed to the same cumulative risk level.
for the 150 sites is 0.070 and the median is 0.0025. At over 85 percent of the sites the maximum individual lifetime excess cancer risk is greater than or equal to 0.0001. Of these maximum site risks, most involve on-site populations. This does not mean that the populations are currently on-site. In fact, survey data indicate that there are on- site residents at only 18 of these 150 sites [U.S. EPA, 1993]. The on-site risks rather are an indication that risk assessors have assumed that populations will reside or come onto the site. Assumptions about future land use obviously play a key role in estimating risks in the Superfund program. In Table 1, pathways that involve changes
How Costly Is "Clean"? An Analysis of the Benefits and Costs of I 7 Superfund Site Remediations
in current land uses (for example, residential development on a currently barren site) or changes in current exposure pathways (for example, the contamination of well water from future migration of a groundwater plume) are referred to as future scenarios. Of the 133 maximum cumulative risks that involve future pathways, 130 are hypothetical because they would require a change in land use to be realized and 3 are hypothetical because they would involve a change in exposure pathways. Note that overall future on-site residents account for 60 percent of the number of cumulative maximum risks. Future risks are also estimated to be higher than current risks (the median of the maximum cumulative risks that are current is 0.00051 versus 0.0026 for the median maximum risks that are future risks). No attempt is made in the EPAs methodology to estimate a probability that a future land use will occur, that is, future risks are not multiplied further by an estimate that the land use will change through the construction of residential developments in what are currently industrial areas.
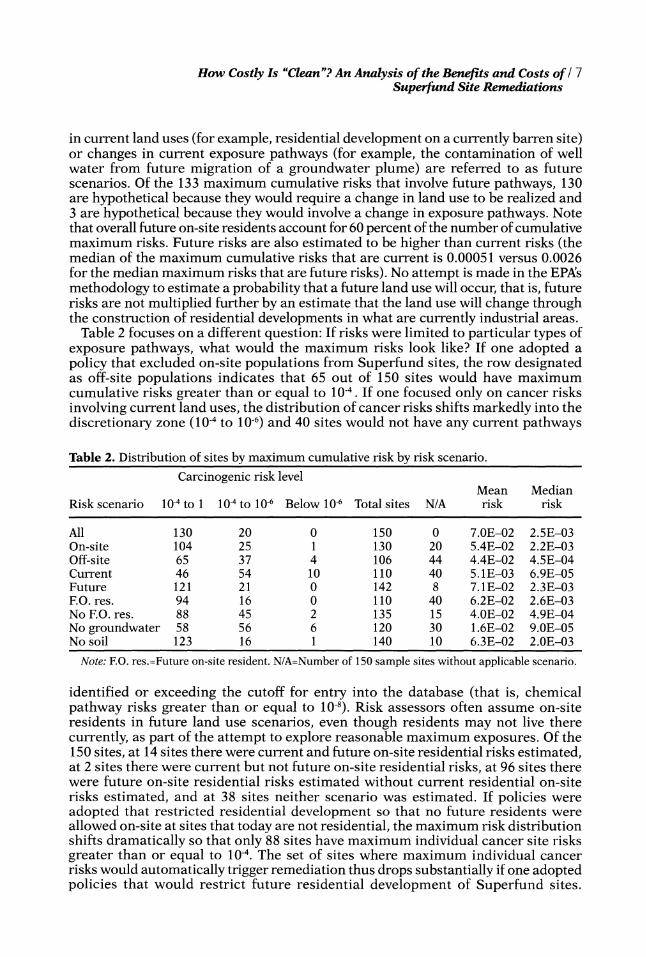
Table 2 focuses on a different question: If risks were limited to particular types of exposure pathways, what would the maximum risks look like? If one adopted a policy that excluded on-site populations from Superfund sites, the row designated as off-site populations indicates that 65 out of 150 sites would have maximum cumulative risks greater than or equal to 10-4. If one focused only on cancer risks involving current land uses, the distribution of cancer risks shifts markedly into the discretionary zone (10-4 to 10-6) and 40 sites would not have any current pathways
Table 2. Distribution of sites by maximum cumulative risk by risk scenario.
Carcinogenic risk level Mean Median
Risk scenario 10-4 to 1 104 to 10-6 Below 10-6 Total sites N/A risk risk
All 130 20 0 150 0 7.0E-02 2.5E-03 On-site 104 25 1 130 20 5.4E-02 2.2E-03 Off-site 65 37 4 106 44 4.4E-02 4.5E-04 Current 46 54 10 110 40 5.1E-03 6.9E-05 Future 121 21 0 142 8 7.1E-02 2.3E-03 F.O. res. 94 16 0 110 40 6.2E-02 2.6E-03 No EO. res. 88 45 2 135 15 4.0E-02 4.9E-04 No groundwater 58 56 6 120 30 1.6E-02 9.0E-05 No soil 123 16 1 140 10 6.3E-02 2.0E-03
Note: FO. res.=Future on-site resident. N/A=Number of 150 sample sites without applicable scenario.
identified or exceeding the cutoff for entry into the database (that is, chemical pathway risks greater than or equal to 10-8). Risk assessors often assume on-site residents in future land use scenarios, even though residents may not live there currently, as part of the attempt to explore reasonable maximum exposures. Of the 150 sites, at 14 sites there were current and future on-site residential risks estimated, at 2 sites there were current but not future on-site residential risks, at 96 sites there were future on-site residential risks estimated without current residential on-site risks estimated, and at 38 sites neither scenario was estimated. If policies were adopted that restricted residential development so that no future residents were allowed on-site at sites that today are not residential, the maximum risk distribution shifts dramatically so that only 88 sites have maximum individual cancer site risks greater than or equal to 10-4. The set of sites where maximum individual cancer risks would automatically trigger remediation thus drops substantially if one adopted policies that would restrict future residential development of Superfund sites.
8 / How Costly Is "Clean"? An Analysis of the Benefits and Costs of Superfund Site Remediations
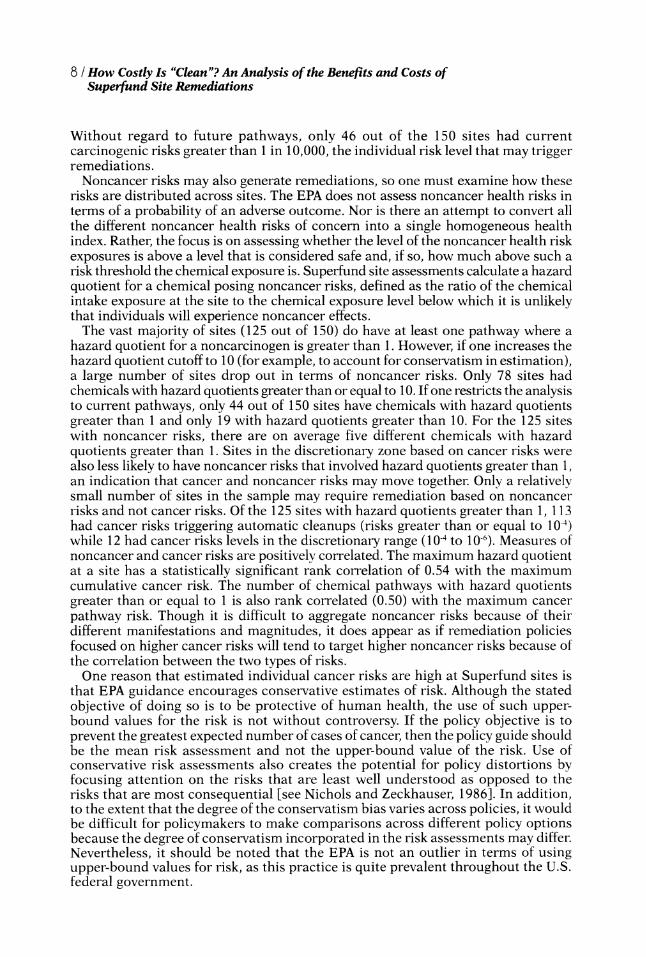
Without regard to future pathways, only 46 out of the 150 sites had current carcinogenic risks greater than 1 in 10,000, the individual risk level that may trigger remediations.
Noncancer risks may also generate remediations, so one must examine how these risks are distributed across sites. The EPA does not assess noncancer health risks in terms of a probability of an adverse outcome. Nor is there an attempt to convert all the different noncancer health risks of concern into a single homogeneous health index. Rather, the focus is on assessing whether the level of the noncancer health risk exposures is above a level that is considered safe and, if so, how much above such a risk threshold the chemical exposure is. Superfund site assessments calculate a hazard quotient for a chemical posing noncancer risks, defined as the ratio of the chemical intake exposure at the site to the chemical exposure level below which it is unlikely that individuals will experience noncancer effects.
The vast majority of sites (125 out of 150) do have at least one pathway where a hazard quotient for a noncarcinogen is greater than 1. However, if one increases the hazard quotient cutoff to 10 (for example, to account for conservatism in estimation), a large number of sites drop out in terms of noncancer risks. Only 78 sites had chemicals with hazard quotients greater than or equal to 10. If one restricts the analysis to current pathways, only 44 out of 150 sites have chemicals with hazard quotients greater than 1 and only 19 with hazard quotients greater than 10. For the 125 sites with noncancer risks, there are on average five different chemicals with hazard quotients greater than 1. Sites in the discretionary zone based on cancer risks were also less likely to have noncancer risks that involved hazard quotients greater than 1, an indication that cancer and noncancer risks may move together. Only a relatively small number of sites in the sample may require remediation based on noncancer risks and not cancer risks. Of the 125 sites with hazard quotients greater than 1, 113 had cancer risks triggering automatic cleanups (risks greater than or equal to 10-4) while 12 had cancer risks levels in the discretionary range (10-4 to 10-6). Measures of noncancer and cancer risks are positively correlated. The maximum hazard quotient at a site has a statistically significant rank correlation of 0.54 with the maximum cumulative cancer risk. The number of chemical pathways with hazard quotients greater than or equal to 1 is also rank correlated (0.50) with the maximum cancer pathway risk. Though it is difficult to aggregate noncancer risks because of their different manifestations and magnitudes, it does appear as if remediation policies focused on higher cancer risks will tend to target higher noncancer risks because of the correlation between the two types of risks.
One reason that estimated individual cancer risks are high at Superfund sites is that EPA guidance encourages conservative estimates of risk. Although the stated objective of doing so is to be protective of human health, the use of such upper- bound values for the risk is not without controversy. If the policy objective is to prevent the greatest expected number of cases of cancer, then the policy guide should be the mean risk assessment and not the upper-bound value of the risk. Use of conservative risk assessments also creates the potential for policy distortions by focusing attention on the risks that are least well understood as opposed to the risks that are most consequential [see Nichols and Zeckhauser, 1986]. In addition, to the extent that the degree of the conservatism bias varies across policies, it would be difficult for policymakers to make comparisons across different policy options because the degree of conservatism incorporated in the risk assessments may differ. Nevertheless, it should be noted that the EPA is not an outlier in terms of using upper-bound values for risk, as this practice is quite prevalent throughout the U.S. federal government.
How Costly Is "Clean"? An Analysis of the Benefits and Costs of I 9 Superfund Site Remediations
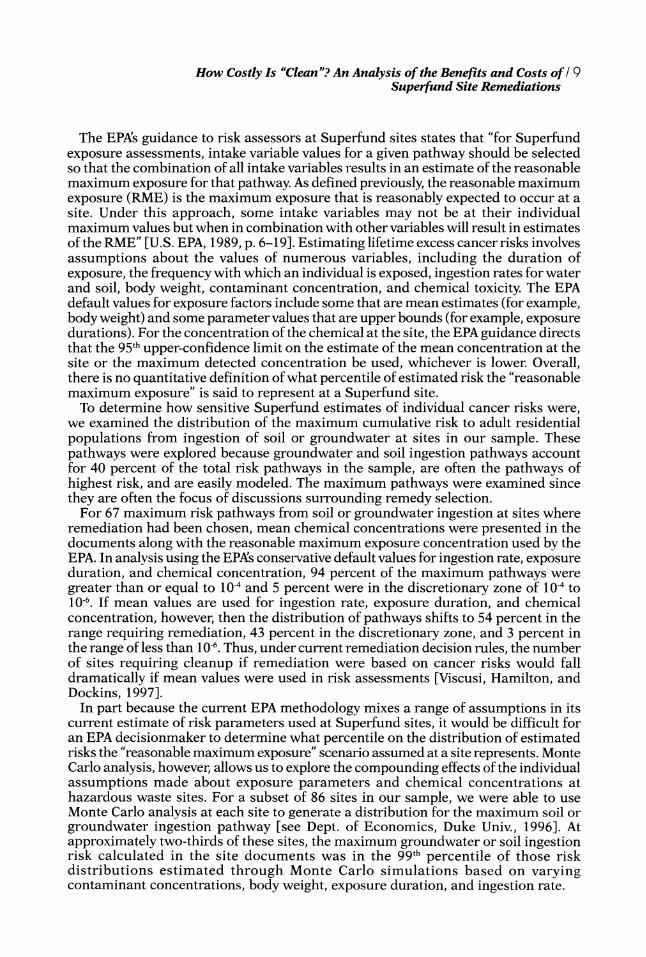
The EPA's guidance to risk assessors at Superfund sites states that "for Superfund exposure assessments, intake variable values for a given pathway should be selected so that the combination of all intake variables results in an estimate of the reasonable maximum exposure for that pathway. As defined previously, the reasonable maximum exposure (RME) is the maximum exposure that is reasonably expected to occur at a site. Under this approach, some intake variables may not be at their individual maximum values but when in combination with other variables will result in estimates of the RME" [U.S. EPA, 1989, p. 6-19]. Estimating lifetime excess cancer risks involves assumptions about the values of numerous variables, including the duration of exposure, the frequency with which an individual is exposed, ingestion rates for water and soil, body weight, contaminant concentration, and chemical toxicity. The EPA default values for exposure factors include some that are mean estimates (for example, body weight) and some parameter values that are upper bounds (for example, exposure durations). For the concentration of the chemical at the site, the EPA guidance directs that the 95th upper-confidence limit on the estimate of the mean concentration at the site or the maximum detected concentration be used, whichever is lower. Overall, there is no quantitative definition of what percentile of estimated risk the "reasonable maximum exposure" is said to represent at a Superfund site.
To determine how sensitive Superfund estimates of individual cancer risks were, we examined the distribution of the maximum cumulative risk to adult residential populations from ingestion of soil or groundwater at sites in our sample. These pathways were explored because groundwater and soil ingestion pathways account for 40 percent of the total risk pathways in the sample, are often the pathways of highest risk, and are easily modeled. The maximum pathways were examined since they are often the focus of discussions surrounding remedy selection.
For 67 maximum risk pathways from soil or groundwater ingestion at sites where remediation had been chosen, mean chemical concentrations were presented in the documents along with the reasonable maximum exposure concentration used by the EPA. In analysis using the EPAs conservative default values for ingestion rate, exposure duration, and chemical concentration, 94 percent of the maximum pathways were greater than or equal to 10-4 and 5 percent were in the discretionary zone of 10-4 to 10-6. If mean values are used for ingestion rate, exposure duration, and chemical concentration, however, then the distribution of pathways shifts to 54 percent in the range requiring remediation, 43 percent in the discretionary zone, and 3 percent in the range of less than 10-6. Thus, under current remediation decision rules, the number of sites requiring cleanup if remediation were based on cancer risks would fall dramatically if mean values were used in risk assessments [Viscusi, Hamilton, and Dockins, 1997].
In part because the current EPA methodology mixes a range of assumptions in its current estimate of risk parameters used at Superfund sites, it would be difficult for an EPA decisionmaker to determine what percentile on the distribution of estimated risks the "reasonable maximum exposure" scenario assumed at a site represents. Monte Carlo analysis, however, allows us to explore the compounding effects of the individual assumptions made about exposure parameters and chemical concentrations at hazardous waste sites. For a subset of 86 sites in our sample, we were able to use Monte Carlo analysis at each site to generate a distribution for the maximum soil or groundwater ingestion pathway [see Dept. of Economics, Duke Univ., 1996]. At approximately two-thirds of these sites, the maximum groundwater or soil ingestion risk calculated in the site documents was in the 99th percentile of those risk distributions estimated through Monte Carlo simulations based on varying contaminant concentrations, body weight, exposure duration, and ingestion rate.

10 / How Costly Is "Clean"? An Analysis of the Benefits and Costs of Superfund Site Remediations
Analysis of the risk assessments at Superfund sites thus reveals that individual cancer risks calculated in the site documents are high, although many of these risks are hypothetical risks based on changes in future land use. The levels of risk drop substantially, however, if one shifts to mean values for risk assessment parameters. Monte Carlo analysis at sites also indicates that there is a high degree of conservatism inherent in current Superfund policies. Reactions to the level of conservatism adopted in the risk assessment guidance will depend on the desired levels of protection and costs of remediation. At a minimum, however, this analysis indicates that sensitivity analysis and Monte Carlo simulations should be conducted at sites to demonstrate the range of estimated risks that could arise at a site. Attempts to estimate the likelihood that land uses will change as envisioned in future risk scenarios should be made. Data on individual level risks should also be combined with census figures to produce population risk estimates, which we do in the following section.
POPULATION RISKS AT SUPERFUND SITES
Over 51 million people live within four miles of a Superfund site, according to our analysis of 1990 census figures for 1173 nonfederal and federal NPL sites. The risks to populations surrounding Superfund sites in terms of additional cancer cases arising from contamination at each site will vary widely, depending on the extent of contamination, proximity of populations, and likelihood of exposure. Because EPA guidance focuses on levels of risks that individuals would face if exposed to the chemical, no explicit attempt is made in current EPA site-level decisions to combine individual risk levels with population data to estimate the number of cancer cases averted through remediation. Our analysis is thus the first attempt to link up estimated cancer cases as a step toward deriving a cost per cancer case averted at these sites.
Our risk database contains information on chemical concentrations at sites for pathways where the cancer risk from the chemical reported in the ROD or risk assessment was 10-8 or higher. Because of the large variation across risk assessments in terms of pathways selected for evaluation, we found it necessary to develop a standardized set of risk scenarios at each site that used the chemical concentration data from the site-level documents. For each site in our 150-site sample, we estimated the cancer risks arising over a 30-year time period from a consistent set of residential exposure pathways-soil and groundwater ingestion, inhalation, and dermal exposure pathways. We developed estimates based on three scenarios:
Case 1. The 95th percentile of the combination of two exposure factors, intake rate and body weight, was used in conjunction with EPA values for other residential risk assessment parameters. The concentration used was the mean of the "reasonable maximum exposure" values for all areas (including areas of high chemical concentrations called "hot spots") at the site. No cancer latency period was assumed.
Case 2. The same methodology was used as in case 1, except that estimates were only developed for sites (99) that had mean concentration values for all contaminated media presented in documents. This provides a baseline for comparison to case 3.
Case 3. This case was estimated for the 99 sites with mean concentration values available for all contaminated media. The mean of intake rate/body weight ratio was used in conjunction with EPA values for other residential risk assessment parameters. The concentration used was the average of the mean sampling concentrations presented in the site documents. A 10-year latency was assumed for the onset of cancers, and the cancer cases are discounted at a 3 percent rate to reflect the different

How Costly Is "Clean"? An Analysis of the Benefits and Costs of/ 11 Superfund Site Remediations
values placed on avoiding harms today versus those in the future'. Site boundaries were obtained from the EPA and combined with 1990 block-level
census data to produce estimates of populations living in rings of various radii around a site. On-site populations were estimated using 1990 census data if the EPA survey data [U.S. EPA, 1993] indicated that populations were currently living on the site. To estimate cancer cases arising from soil exposures, populations living within one mile were assumed to be potentially exposed to the chemicals in the soil pathways. The probability these populations were exposed to the soil pathway was assumed to vary with distance from the site, ranging for dermal and ingestion exposure from 1 for on- site resident exposure to 0.0063 for residents within one mile. These probabilities were derived from a U.S. EPA report [1988], which describes the probability that individuals will come into contact with a site as a function of their distance from the area. Multiplying the individual cancer risk estimated from soil exposure pathways by the population size within the ring by the probability of exposure yields an expected number of cancer cases by ring for a given year. Populations were grown by taking the 1990 census figures for the site and applying a growth factor estimated from the annual rate of population change in the county from 1980 to 1990. A different population per ring area thus was used for each year to estimate the number of cancer cases arising from soil exposure over a 30-year period. In essence, this procedure takes current land uses as given and estimates the additional incidence of cancer cases that would arise over 30 years.
Groundwater risks were estimated at the 142 sites where the risk assessments indicated that this pathway could potentially be present. At 74 sites, plume maps from site documents were digitized using GIS technology so that 1990 block-level census data could be used to estimate the number of people living above a plume and relying on groundwater for drinking water. This population figure was then multiplied by the estimated individual groundwater exposure pathway risks to derive an estimate of the number of cancer cases per year from exposure to groundwater. This approach for estimating cancers arising from groundwater contamination implicitly assumes that residents using public water supplies will be protected by the monitoring and treatment of public water supplies. At sites where plume maps were unavailable, we combined the populations in each ring with the percentage of the ring that would be affected by a groundwater plume of average size (based on analysis of the sample sites where plume maps were given in site documents) to derive an estimate of the exposed population.
Under the case 1 scenario, there are estimated to be 731 cancer cases over 30 years arising from exposure to contamination at these 150 sites. The vast majority of these cancer cases arise from soil exposure (695) rather than groundwater exposure (36). Note that nearly 90 percent of the total cancer cases are estimated to occur at one site, the Westinghouse Electric site in California (which had 652 expected cancer cases). This concentration of estimated cancers at one site means that the median number of cancer cases per site (0.017) is more indicative of the population risks
1 Although one might be reluctant to discount cases of cancer, the willingness to pay to prevent cases of cancer in the future is a monetary amount. For benefit-cost analysis, one is, in effect, simply discounting the willingness to pay associated with these future cases of cancer that are prevented. If one were to assume that no discounting of remote cases of cancer is desirable, then one would be led to very irrational policies if the efficacy of policies in reducing cancer is constant or increasing. With constant efficacy, one would be indifferent to an indefinite postponement of any cancer reduction effort. With policies that increase in their efficacy over time, it is always optimal to defer policy actions until some future juncture. The use of a discount rate is a reflection of the importance society places on preventing cases of cancer now rather than deferring such actions to the future.

12 / How Costly Is "Clean"? An Analysis of the Benefits and Costs of Superfund Site Remediations
60 -
50 50 -
39 40 -
? 30-* cu v v 24
20- 15
10 -
3 4 4 1 1
Oto .00001 .001 to .1 to1 10 to 1E-6 to .01 100
.0001
Number of Expected Cancers
Figure 1. Number of cancers expected from site contamination
overall than the average number of cancer cases (4.87). Figure 1 underscores how low the number of cancer cases is at most sites. Of the 150 sites where cancer cases were estimated, only 10 had one or more cancer cases estimated to arise over a 30- year period from groundwater and soil exposures. If average exposure factors and concentrations are assumed, a 10-year cancer latency period is assumed, and a 3 percent discount factor is used, the discounted number of cancer cases at these sites drops by two-thirds. For the 99 sites where average concentrations are available, the number of cancer cases estimated under scenario 3 is 204 cases, versus 698 cases under scenario 2.
The majority of Superfund sites in our sample thus have less than 0.1 cancer cases estimated to arise from exposure to soil or groundwater contamination. Our estimation approach is conservative, in that the concentrations of chemicals used at sites were taken as the mean of the RME concentrations derived from site-level documents. Thus, "hot spot" figures were included in the figures averaged to yield the exposure point concentrations in cases 1 and 2, even if it were unlikely that populations around the site would come into contact with the chemical at these elevated concentrations. The large number of expected cancer cases at the Westinghouse site derives from this assumption. At this site, soil exposures are estimated to include exposure to high PCB (polychlorinated biphenyl) concentrations from a 650-square-foot area that is mostly paved over. The approach could be made more conservative, however, if one assumed that current land use patterns changed so that areas and sites that are currently not residential became sites for new developments. In that case, the population figures associated with the individual cancer risks would be increased and the number of estimated cancer cases would rise. Note also that the chemical concentration figures used at sites are post removal action, so that the cancer cases that would arise if prior Superfund removal actions had not taken place are not estimated.
The small number of expected cancer cases arising from unremediated exposures also indicates the potential importance of analyzing how the risks to cleanup workers and surrounding residents of remediating these sites compare to the risks at the site

How Costly Is "Clean"? An Analysis of the Benefits and Costs of / 13 Superfund Site Remediations
under alternative remedies (for example, institutional controls, containment, or treatment of waste). Recent work on dealing with chemical risks [Graham and Wiener, 1995; Travis, Scofield, and Blaylock, 1993] underscores the potential for some remediations to entail larger risks in their execution than the original hazard addressed.
Although noncancer risks cannot be aggregated due to the variations in the adverse health outcomes associated with different chemicals, we can use the methodology described earlier to estimate the expected number of people exposed to different levels of noncancer risks. At each of the 150 sites, we combined information on the level of noncancer individual risks, the probabilities of exposure described earlier for soil and groundwater contaminants, and the total populations living on-site and within a four-mile radius. The expected number of people exposed to noncancer hazard quotients greater than or equal to 1 for soil were 6130 persons for dermal exposure; 6430 via ingestion; and 109,400 for inhalation (primarily because of the low reference dose for chromium). For groundwater, these numbers were 320 people via dermal; 1610 for ingestion; and 900 via inhalation. The expected number of exposed individuals to hazard quotients greater than 10 drop for soil to 2250 for dermal; 5050 for ingestion; and 15,850 for inhalation and for groundwater to 40 via dermal; 860 for ingestion; and 480 for inhalation. These figures represent the expected number of people exposed to these levels of noncancer risks, not the expected number of cases of noncancer reactions. The current information used by the EPA in risk assessment does not translate exposure to varying levels of noncancer risks into the probability of an actual adverse outcome. Note, however, that the Agency for Toxic Substances and Disease Registry (ATSDR) has tried to link actual human health outcomes to chemical exposures at the sites through long-term health monitoring and epidemiological studies. The agency has documented human exposures to contamination at 40 percent of the sites, determined that 35 percent of the sites are public health hazards, and classified 2 percent of the sites as imminent and urgent public health hazards [Johnson, 1993, 1995].
REMEDIATION COSTS AND GOALS
To examine the cost-effectiveness of current EPA Superfund policies and proposed alternative policies, we had to develop our own estimates of remediation expenditures. To analyze the costs of remediation at Superfund sites, we collected detailed cost data from site documents on the remedy selections considered and chosen at 267 nonfederal NPL sites where RODs were signed during 1991 or 1992. We also collected cost information on past remediation actions and estimated figures where documents indicated future RODs were anticipated. These data allow us to estimate a site-level cost for remediation expenditures. Note, however, that these figures exclude transaction costs borne by the agency or private parties and do not cover the expenditure of funds for removal actions (for example, emergency actions to avert immediate dangers at a site) that were done prior to the long-term remediations considered here.
At 19 sites in the sample the agency formally chose not to pursue further remediation action, although some of these did entail additional costs for monitoring of potential hazards. With these no-action sites included, the average cost of remediation per site was $18.1 million (7 percent discount rate, in 1993 in dollars) according to estimates in site documents. The EPA data indicate, however, that actual remediation costs tend to be higher at most sites than estimated costs. When one adjusts for the projected growth in costs once a remediation is undertaken, the average cleanup cost per site
14 / How Costly Is "Clean"? An Analysis of the Benefits and Costs of Superfund Site Remediations
rises to $25.7 million. Remediation costs for soil averaged $17.3 million (with cost growth) and are highly concentrated in capital costs (91 percent), while those for groundwater remediation averaged $13.1 million and are split between capital costs (34 percent) and operations and maintenance (66 percent). Overall expenditures are highly concentrated at a small percentage of the sites. The top 20 percent of sites in terms of costs accounted for 47 percent of all estimated grown expenditures, while the bottom 40 percent of sites totaled only 14 percent of these remediation costs. The magnitude and concentration of costs reinforce the importance of conducting site- level marginal analysis to determine the cost-effectiveness of Superfund expenditures.
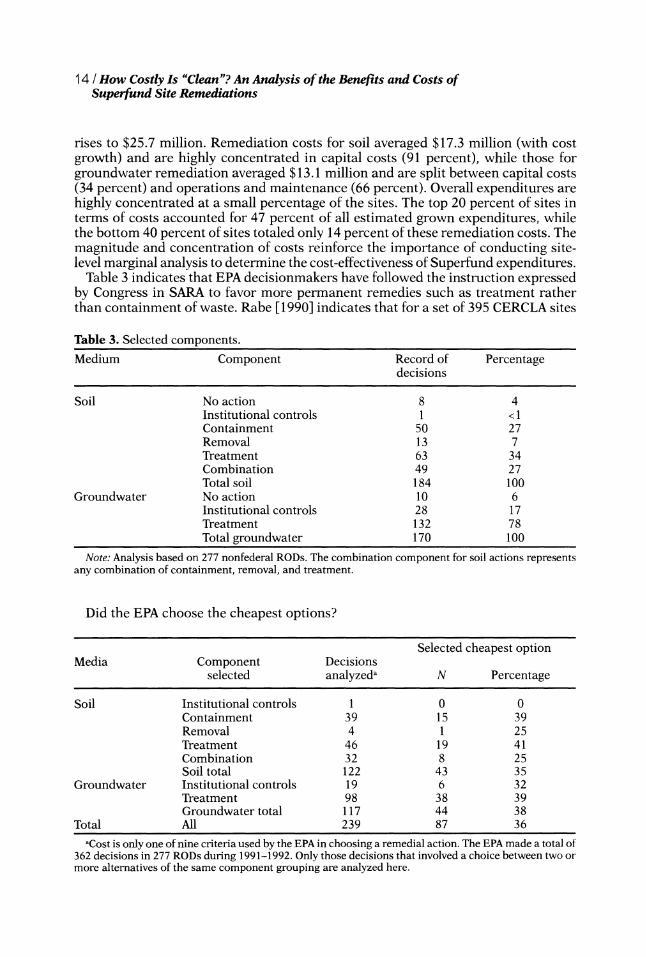
Table 3 indicates that EPA decisionmakers have followed the instruction expressed by Congress in SARA to favor more permanent remedies such as treatment rather than containment of waste. Rabe [1990] indicates that for a set of 395 CERCLA sites
Table 3. Selected components. Medium Component Record of Percentage
decisions
Soil No action 8 4 Institutional controls 1 < 1 Containment 50 27 Removal 13 7 Treatment 63 34 Combination 49 27 Total soil 184 100
Groundwater No action 10 6 Institutional controls 28 17 Treatment 132 78 Total groundwater 170 100
Note: Analysis based on 277 nonfederal RODs. The combination component for soil actions represents any combination of containment, removal, and treatment.
Did the EPA choose the cheapest options?
Selected cheapest option Media Component Decisions
selected analyzeda N Percentage
Soil Institutional controls 1 0 0 Containment 39 15 39 Removal 4 1 25 Treatment 46 19 41 Combination 32 8 25 Soil total 122 43 35
Groundwater Institutional controls 19 6 32 Treatment 98 38 39 Groundwater total 117 44 38
Total All 239 87 36
aCost is only one of nine criteria used by the EPA in choosing a remedial action. The EPA made a total of 362 decisions in 277 RODs during 1991-1992. Only those decisions that involved a choice between two or more alternatives of the same component grouping are analyzed here.

How Costly Is "Clean"? An Analysis of the Benefits and Costs of/ 15 Superfund Site Remediations
examined as of 1984 (that is, pre-SARA), containment remedies were employed at 99 percent of the sites and treatment of waste at only 1 percent of the sites. Table 3 shows that among groundwater ROD actions signed in 1991-1992, 78 percent involved treatment of the contaminated groundwater. For soil actions, 34 percent involved treatment and 27 percent consisted of some combination of containment, removal, and treatment. In making decisions among remedies at sites, the EPA decisionmakers are guided by the nine explicit criteria discussed earlier, including costs. Table 3 also demonstrates that when faced with multiple remedies using a given technology (for example, two remedy options that involved treatment), the agency chose the cheapest remedy option 35 percent of the time when soil contaminants were involved and in 38 percent of the instances when groundwater remedies were involved. Because remedies may vary in effectiveness, however, the EPA may have selected a higher cost remedy to provide a higher level of protection at some sites. The results in Table 3 are consistent with work by Gupta, Van Houtven, and Cropper [1996] that reveals that in the selection of remediation technologies the EPA took cost into consideration and demonstrated a preference for more permanent remedies. These authors found that at larger sites the agency was willing to pay as much as $40 million in additional costs over and above the costs of capping contaminated wastes to incinerate soils.
The EPA site documents contain detailed information on both the costs of remedies selected and the cost of remedies not selected. At each site we averaged the costs of remedies by type of policy action (institutional controls, containment, removal, treatment, and combination). Some sites did not have cost estimates for a given policy option, so we weighted the cost observations for each policy by site type to produce estimates of the costs of using alternative remedies at the sites in our cost sample. Our results indicate that if institutional controls were adopted for soil and groundwater actions at the sample sites, the average cost per site, including projected cost growth, would be $2.6 million. If containment were chosen as the remedy for contaminated soils and institutional controls for groundwater actions, the costs would be $13 million. This figure would jump to $22 million if groundwater treatment and soil containment were selected. A policy of soil removals (with containment for landfill sites) and treatment for groundwater generated an estimate of $38.6 million per site, while treatment for both soil and groundwater at all types of sites would generate an average of $118.9 million. The costs of remediating Superfund sites would thus vary widely depending on whether a permanent treatment remedy or another policy were selected. Shifting away from a policy focused on treatment, however, would require legislative changes to the language in the SARA legislation directing the agency to pursue permanent treatment solutions. Russell and Davis [1995] also estimate that remediation expenditures would drop if requirements for permanent cleanups and the ARAR cleanup standards were removed.
Though the bases for cleanup standards vary across Superfund sites, three main standards are most often used: state standards from other environmental programs, federal standards from environmental programs other than Superfund, and risk-based goals that are translated back into the chemical concentrations that may remain after remediation. The EPA guidance indicates that cleanups should generally be undertaken when risks are greater than or equal to 10-4 (with a discretionary zone up to 10-6) and that the risk targets for remediation actions should be individuals risks in the range of 10-4 to 10-6. Legislation also indicates, however, that if state or federal standards (generally expressed in terms of the concentration of a given chemical that is acceptable) exist for exposure to a given chemical that these become the basis for remediation (state standards must be met if they are stricter). Groundwater standards

16 / How Costly Is "Clean"? An Analysis of the Benefits and Costs of Superfund Site Remediations
exist for many chemicals from the federal Clean Water Act or state legislation, so that many chemicals involved with groundwater contamination at Superfund sites have cleanup standards imported into hazardous waste remediations from these other regulatory programs. Chemical concentration standards are less common for soil exposure in federal and state regulatory programs, so soil remediations at Superfund sites may be based on risk analysis where chemical concentrations are backed out from a given cancer risk level (for example, what chemical concentrations would yield a site-level risk of 10-6 given the exposure pathways for a given population at the site?).
Table 4 provides information on the basis of remediation concentration selected for the carcinogenic and noncarcinogenic chemicals that matched up in our risk and remediation databases. The justification for the remediation level chosen was coded directly from the ROD at the site. For soil contaminants, state regulations were the source of 21.3 percent of the concentration goals and federal regulations accounted
Table 4. Basis of chemical remediation goal, cancer and noncancer (N= 194 sites).
Panel A. Soil (N= 111 sites) Basis for remediation level Number of chemicals Percentage of total
Federal regulations 15 1.5 State regulations 216 21.3 Site-specific levels 102 10.1 EPA directives 54 5.3 Risk-based level 367 36.2 Environmental standards 5 0.5 Modeled concentration 254 25.1 Total 1013 100.0
Panel B. Groundwater (N=151 sites) Basis for remediation level Number of chemicals Percentage of total
Federal MCLs 733 31.4 Other federal regulations 69 3.0 State MCLs 513 22.0 Other state regulations 638 27.3 Site-specific levels 85 3.6 EPA directives 52 2.2 Risk-based level 179 7.7 Environmental standards 66 2.8 Modeled concentration 1 0.0 Total 2336 100.0
Notes: Federal MCLs=Maximum contaminant levels as promulgated under the Clean Water Act (in- cludes MCLs, proposed MCLs, and MCLGs (maximum contaminant level goals)). Other federal
regulations=Levels determined by federal regulations other than those dealing with Superfund or the Clean Water Act. State MCLs=Maximum contaminant levels as promulgated under state drinking water
regulations. Other state regulations=Levels determined by state regulations other than those dealing with
drinking water. Risk-based levels=Concentrations needed to produce a specific chemical or site risk level.
Site-specific levels=Level determined by background concentration or detection limit. Modeled concentrations=Soil level based on output of model using groundwater remediation levels (one observa- tion models groundwater levels based on soil remediation). EPA directives=Levels as promulgated in Of- fice of Solid Waste and Emergency Response (OSWER) directives or regional guidance documents. Envi- ronmental standard=Levels established explicitly to protect the environment.

How Costly Is "Clean"? An Analysis of the Benefits and Costs of/ 17 Superfund Site Remediations
for 1.5 percent. Most soil concentration goals were derived from risk-based levels (that is, what soil concentration values would yield a risk of 10-6?), which accounted for 36.2 percent of the remediation goals, or modeled concentrations (25.1 percent), where risk assessors took a groundwater concentration standard or risk level and derived what soil concentration would be consistent with this goal if the soil contaminant leached into the groundwater. For groundwater concentrations of chemicals, however, federal MCLs (maximum contaminant levels) and standards accounted for 31.4 percent of the cleanup remediation goals, followed by other state regulations (27.3 percent) and state MCLs (22 percent). Site-specific risk assessment calculations thus accounted for very few of the concentration goals set for groundwater remediations at Superfund sites.
Some site documents list remediation goals that are already met at the site, that is, remediation concentrations exceed the current concentrations of chemicals. If one eliminates those "goals" that are already met prior to remediation, one can examine how the individual risk levels established by the different chemical concentration standards vary in stringency. For the 1253 groundwater and 431 soil chemical pathways at the sites in our sample where contaminant concentrations exceeded established cleanup goals specified in the site documents, these remediation goals were fed back into the risk assessment equations to calculate the individual cancer risks to human health remaining after remediation. Table 5 sheds light on our finding that the mean postremediation risks implied by groundwater cleanup targets established under state regulations (9.6E-6) are statistically significantly lower at the 1 percent level than those established on all other bases (6.1E-5). For soil contaminants, state standards (mean 8.1E-6) also result in more stringent cleanup goals than those based on other rationales (mean 8.0E-5) (also statistically significant at the 1 percent level).
Cleanup standards from other state and federal regulatory programs are thus regularly imported into the Superfund program. These standards are aimed at multiple objectives, including environmental protection as well as protection of human populations from cancer and noncancer risks. When these standards are translated back into individual cancer risks, however, it is evident that state and federal regulatory requirements from programs outside of Superfund result in chemical concentrations much lower than those that would result if remediations were chosen solely on the basis of cancer risk analysis. Although attention in the reauthorization debate has focused scrutiny on what levels of individual risks are appropriate remediation goals, these results also suggest the importance of examining the strict remediation goals established by state and federal standards derived form regulatory programs outside of Superfund.
MEASURES OF COST-EFFECTIVENESS
The EPA has multiple goals for Superfund site remediations, including protection of individuals from cancer risks, reduction of noncancer risks to individuals, and protection of the physical environment (including natural resources). This section uses one measure of cost-effectiveness, the cost per cancer case avoided at sites, to analyze the EPA actions taken under current legislative mandates. Our analysis assumes that the remedy selected at each site will fully address the estimated cancer cases arising over 30 years, although the actual degree of prevention may vary with each site. Estimated cancer cases are based on the conservative assumptions described in case 1, and costs are presented without factoring in cost growth.

18 / How Costly Is "Clean"? An Analysis of the Benefits and Costs of Superfund Site Remediations
Table 5. Individual cancer risk goals implied by remedial concentration standards.
Panel A. Soil (N=44 sites)
Basis Number of matched Baseline risk Implied mean chemical observations assessment remediation risk
mean pathway risk
Risk-based 186 6.1E-4 3.4E-5 State 74 8.4E-5 8.1E-6 EPA directive 92 3.2E-2 2.3E-4 Site-specific 61 1.6E-4 1.1 E-5 Modeled 18 1.3E-5 5.7E-8 Total 431
Panel B. Groundwater (N=83 sites) Basis Number of matched Baseline risk Implied mean
chemical observations assessment remediation risk mean pathway risk
Risk-based 100 2.8E-4 1.5E-5 Federal 417 8.2E-3 8.3E-5 State 644 5.7E-3 9.6E-6 EPA directive 1 1.8E-4 5.6E-6 Site-specific 91 3.8E-3 1.3E-5 Total 1253
Note: This table focuses on chemical risk pathways for which remediation levels were established below existing concentrations.
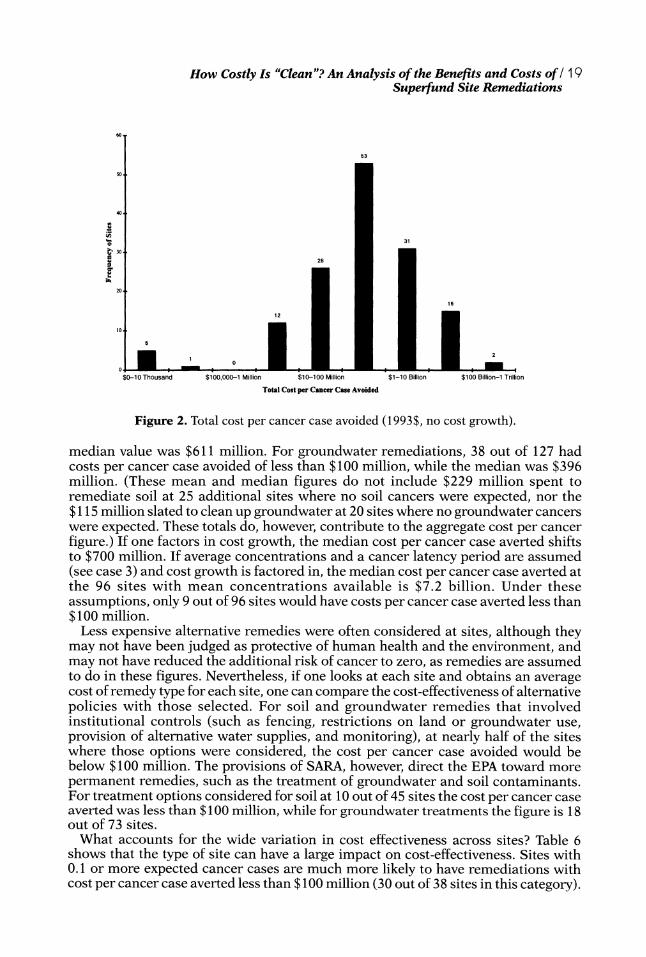
Overall, at these 150 sites, $2.2 billion dollars (1993$) in current and planned remediation actions are slated to be expended to avert 731 cancer cases, which yields a mean cost per cancer case averted of $3 million for remediation actions at the sites. This indicates that on balance the program is cost-effective in the aggregate using a mean cost per cancer case averted. Yet the analysis in previous sections indicates that both risks and costs are concentrated at a small segment of sites, so averages may not be fully informative. The median cost per cancer case averted is $388 million, without factoring in cost growth. Figure 2 emphasizes that the cost per cancer case averted ranges widely from less than $20,000 to over $1 billion. Overall, 44 out of the 145 sites with nonzero cancer cases averted2 had costs per cancer case averted less than $100 million (a figure chosen in part because the Office of Management and Budget (OMB) has never rejected a rule on a cost-benefit basis that had a cost per life saved less than $100 million). About 25 percent (26 out of 107 with soil cancers) of the soil remediations had costs per cancer case avoided less than $100 million, while the
2 The cost per cancer case averted, as calculated at the site level, is the sum of the groundwater and soil remediation costs divided by the sum of the cancer cases expected to arise from groundwater and soil exposures. Media-specific costs per cancer are media costs divided by the cancers expected from the rel- evant medium only. Where there are no actions addressing a given medium, cancers arising from that medium cannot be considered "avoided." These sites are thus dropped from the set of observations for the medium cost per cancer case averted analyses, and the cancers arising from that medium are not included in the denominator for the total site cost per cancer averted figure. Sites with zero expected cancers- whether overall or for a given medium-are also dropped from the respective mean and median analyses, but their costs are included in the aggregate cost per cancer figures.
How Costly Is "Clean"? An Analysis of the Benefits and Costs of/ 19 Superfund Site Remediations
60-
53
so -
40 -
i0
o5 o31 O 30_
26
20 | -
$0-10Thousand $100,000-1 Million $10-100 Million $1-10 Billion $100 Billion-1 Trillion
Total Cost per Cancer Case Avoided
Figure 2. Total cost per cancer case avoided (1993$, no cost growth).
median value was $611 million. For groundwater remediations, 38 out of 127 had costs per cancer case avoided of less than $100 million, while the median was $396 million. (These mean and median figures do not include $229 million spent to remediate soil at 25 additional sites where no soil cancers were expected, nor the $115 million slated to clean up groundwater at 20 sites where no groundwater cancers were expected. These totals do, however, contribute to the aggregate cost per cancer figure.) If one factors in cost growth, the median cost per cancer case averted shifts to $700 million. If average concentrations and a cancer latency period are assumed (see case 3) and cost growth is factored in, the median cost per cancer case averted at the 96 sites with mean concentrations available is $7.2 billion. Under these assumptions, only 9 out of 96 sites would have costs per cancer case averted less than $100 million.
Less expensive alternative remedies were often considered at sites, although they may not have been judged as protective of human health and the environment, and may not have reduced the additional risk of cancer to zero, as remedies are assumed to do in these figures. Nevertheless, if one looks at each site and obtains an average cost of remedy type for each site, one can compare the cost-effectiveness of alternative policies with those selected. For soil and groundwater remedies that involved institutional controls (such as fencing, restrictions on land or groundwater use, provision of alternative water supplies, and monitoring), at nearly half of the sites where those options were considered, the cost per cancer case avoided would be below $100 million. The provisions of SARA, however, direct the EPA toward more permanent remedies, such as the treatment of groundwater and soil contaminants. For treatment options considered for soil at 10 out of 45 sites the cost per cancer case averted was less than $100 million, while for groundwater treatments the figure is 18 out of 73 sites.
What accounts for the wide variation in cost effectiveness across sites? Table 6 shows that the type of site can have a large impact on cost-effectiveness. Sites with 0.1 or more expected cancer cases are much more likely to have remediations with cost per cancer case averted less than $100 million (30 out of 38 sites in this category).

20 / How Costly Is "Clean"? An Analysis of the Benefits and Costs of Superfund Site Remediations
Table 6. Cost per cancer case avoided (millions, in 1993 dollars) by number of expected cancer cases.
Expected Cost per cancer case avoided cancer cases Mean Median Aggregate X<100M N'
0.1 or more 58.6 30.9 1.1 30 38 0.05-0.1 241.0 171.2 219.1 2 11 0.01-0.05 853.3 538.5 650.3 8 39 0.005-0.01 1296.8 1156.2 1550.5 0 8 0.001-0.005 4812.4 2494.8 3926.4 3 30 0-0.001 72,910.0 17,488.3 24,108.3 1 19 Total 10,884.1 387.6 3.0 44 145
Cost per cancer case avoided by whether cleanup standards were based on ecological risk criteria.
Are ecological risk Cost per cancer case avoided standards present? Mean Median Aggregate X<100M N
No 12,282.8 454.4 2.7 33 124 Yes 2624.6 89.2 12.4 11 21
Cost per cancer case avoided by cleanup standard basis.
Basis of cleanup Cost per cancer case avoided due to soil contamination standard Mean Median Aggregate X<100M N
Federal 1473.9 1473.9 1473.9 0 1 State 8023.5 501.8 439.2 1 7 Site 2448.1 225.9 0.46 11 34 None 153,139 2723.2 81.9 14 65
Basis of cleanup Cost per cancer case avoided due to groundwater contamination standard Mean Median Aggregate X<100M N
Federal 4291.8 244.8 50.8 7 25 State 63,992.2 521.7 95.5 9 38 Site 2714.0 326.3 2.1 2 7 Combination 1689.0 203.7 440.7 2 7 None 6265.7 379.8 27.0 18 50
Notes: The variable N represents the number of sites for which a cost per cancer case avoided figure can be calculated for the given scenario. The aggregate cost per cancer case avoided column, however, in- cludes costs at sites where cancers equal zero (that is, aggregate cost per cancer case avoided=? costs divided by I cancer cases avoided). The inequality X< 100M indicates the number of sites with a cost per cancer case avoided less than $100 million. All costs are in 1993$ dollars in millions and do not include cost growth estimates.
How Costly Is "Clean"? An Analysis of the Benefits and Costs of / 21 Superfund Site Remediations
The median cost per cancer sites with 0.1 or more cancers was $31 million, which is much lower than the figures at sites with lower expected cancer cases averted. Using remediation information from site documents, we also examine in Table 6 the cost per cancer case avoided at sites where environmental protection standards influenced remedy selection. The median cost per cancer case averted was actually lower at sites where environmental standards (those aimed at ecological/natural resource risks) were used as a basis for remediation decisions. The median cost per cancer case averted also declines at sites that have high maximum hazard quotients. Thus, it is generally not the case that sites with higher cost per cancer case averted were sites with remediations based on environmental protection standards or sites with higher noncancer risks, although one site with no expected cancers did have substantial noncancer risk, and 17 sites with less than 0.1 cancers had maximum noncancer chemical pathways with hazard quotients exceeding 100. Table 6 also matches up the costs of cancer cases averted by the dominant type of binding remediation standard used at the site (that is, the most frequent basis for remediation standards where remediations were required). For both soil and groundwater remedies, the median cost per cancer case avoided is nearly twice as high when decisions were based on state standards than when remediations were based on site-level (risk-based) standards. The poor performance of EPA cleanup decisions on this measure of cost- effectiveness in part results from the importation of cleanup goals from state environmental protection programs into the Superfund program, in accordance with requirements established in the 1986 SARA legislation.
A comparison of risk and cost data does indicate that expenditures are related to measures of cancer risks on a site-by-site basis. In terms of rank order correlations, remediation expenditures and number of cancer cases averted are positively correlated (0.36). The EPA appears to be spending more to remediate sites with current risks today than at sites where risks are hypothetical. Mean site costs (1993$, 7 percent, without cost growth) were $22 million at sites where the maximum cancer risk was a current risk greater than or equal to 10-4 versus $12.1 million at sites where the maximum risk was a future risk greater than or equal to 10-4 (t = statistic = 2.7). The difference between expenditures at sites where maximum risks were in the discretionary zone is not different for current risks ($10.8 million) versus future risks ($9.8 million). For noncancer risks, the mean site cleanup at sites with current maximum hazard quotients greater than or equal to 10 of $25.4 million was greater than the mean cleanup cost of $12.9 million for sites without these high current noncancer risks (t = statistic = 1.8). In terms of these measures of priorities, the EPA has thus targeted more resources at sites where there are risks today rather than simply hypothetical risks in the future.
CONCLUSION
Our analysis does not constitute a full measure of the costs and benefits of the Superfund program. The examination of sites where RODs were signed in 1991 and 1992 begins after emergency removal actions have occurred at many of the sites. The early actions that the EPA takes to remove imminent hazards are thus not addressed. Existence values that people may place on pristine groundwater, potential avoidance of other natural resource damages [Stewart, 1995], and the value of avoiding noncancer effects ranging from skin lesions to birth defects are not quantified here. The loss in property values to society if site contamination were addressed through institutional

22 / How Costly Is "Clean"? An Analysis of the Benefits and Costs of Superfund Site Remediations
controls or containment rather than full-scale treatment is not calculated. Nor are questions about what demographic groups bear what types of risks investigated here [see Hird, 1993, 1994; Zimmerman, 1993; Sanford Institute of Public Policy, 1996, which explores the environmental equity aspects of this sample of sites].
The results from our study do demonstrate, however, the potential benefit of conducting more site-level analysis of the benefits of remediations. Individual cancer risk estimates at Superfund sites are high relative to other risks regulated by the federal government. The mean maximum cumulative risk was 0.070 and the median and 0.0025. Over 85 percent of the sites had maximum individual cancer risks greater than or equal to 1 in 10,000. Yet many of these risks are hypothetical risks based on changes in land use envisioned in the future and on conservative parameter assumptions, and they represent a combination of conservative assumptions across parameters so that the point on the distribution of risks at a site represented by the EPA's reasonable maximum exposure scenario is unclear. If mean parameter values are used for chemical concentration, ingestion rate, and exposure duration, the percentage of sites with maximum adult ingestion risks greater than or equal to 1 in 10,000 drops to 54 percent. Monte Carlo analysis reveals that the compounding of assumptions in the current EPA guidance results in risks that are often in the 99th
percentile of simulated risks. At a minimum, these results demonstrate the need to consider what types of parameter assumptions should be used in the analysis of Superfund risks, the potential for Monte Carlo analysis to contribute to the understanding of these risks, and the need to explore the likelihood that different land uses will arise at sites where remediation is based on future risk scenarios such as future residential developments on current industrial sites.
Linking up individual risk data with census information through GIS technology shows how current Superfund information can be extended to develop estimates of population risks. Once this was done at a sample of 150 sites, we found that expected cancer cases arising from chemical exposure are high at a very small fraction of sites and relatively low at the majority of sites. The median number of expected cancer cases over 30 years at the sites in our sample is less than 0.1. Costs per cancer case averted are very high at most of the Superfund sites in the sample, with only 44 out of 145 sites having a cost of cancer cases averted (precost growth) less than $100 million. Alternative policies, such as institutional controls or containment, yielded lower estimates of costs of cancer cases averted, assuming they were equally as effective as treatment over the short run in reducing risks. Treatment policies are also aimed at risks aside from cancer, such as noncancer risks and ecological risks. If these are to be the primary justification for action at Superfund sites, however, more attempts should be made to quantify and rate both noncancer and ecological risks. Costs per cancer case averted are also high in part because of the state standards imported from other environmental programs, standards that result in cleanup goals that are more stringent than those based on site-level analysis of individual risks.
Though our results answer questions about the effectiveness of the EPA's Superfund remediation policies, they raise an additional question-why are the EPAs remediation decisions so inefficient in terms of the cost per cancer case averted? One answer lies in the principal-agent relationship between Congress and the agency. Officials at the EPA possess more information about site characteristics than Congress members and are able to take actions difficult for Congress to monitor. These elements of both hidden action and information give agents the ability to take actions different than those that principals would choose. When Congress delegated discretion in the initial design of the Superfund program, Reagan appointees implementing the program

How Costly Is "Clean"? An Analysis of the Benefits and Costs of/ 23 Superfund Site Remediations
chose remediations that were viewed as favorable to polluters. The 1986 SARA legislation imposed additional constraints on the agency by instructing that permanent cleanup remedies, such as treatment of waste, should be favored over containment and that cleanups should meet standards (ARARs) from other environmental programs. Although these policies reduce the likelihood that the EPA will be able to use its delegated authority to favor polluters, they also carry a cost in terms of generating the selection of remedies with extremely high costs per cancer case averted. While one could argue that the agency currently has discretion to select less costly remedies, until Congress actually revises the statute, the agency, reprimanded in 1986 for lax enforcement, may avoid changes in policy that could be interpreted as being less protective of the environment.
A second source of inefficiency in remediation policies is the EPA's focus on individual cancer risk levels generated by contamination rather than a focus on the expected number of cancer cases arising from exposure of a population to contaminant risks. For a given remediation budget, the number of cancer cases averted will be maximized by a policy that considers the size of the populations exposed to risks of different magnitudes across sites. Federal policies in many agencies focus on individual risk levels rather than population risks, in part because of equity concerns about groups highly vulnerable to risk (for example, those who rely on well water). In willingness- to-pay surveys, individuals often exhibit a scope effect in their willingness to protect animals from harm (for example, they are willing to pay the same to protect 2000 migratory waterfowl as for 200,000 migratory waterfowl-see Diamond and Hausman [1994]). The focus on individual risk levels in federal regulatory policies may arise from a similar scope effect in the demand for policies that involve risk reduction, so that regulators face demands to protect individuals against risk without regard to the number of individuals facing such risks. Risk biases such as this "scope effect" may thus influence the formation of risk policies, a topic explored more in Noll and Krier [1990]. Hird [1994] relates how factors associated with risk biases, such as "the degree of control of risk, the dread of risk, the catastrophic potential, its potential fatal consequences, and the inequitable distribution of risks," help generate support for the Superfund policies despite potential inefficiencies in the program (p. 215).
A third hurdle to cost-effective remediations is a rejection by some analysts of the validity of using current cost-effectiveness measures to judge the program. Problems with calculating the benefits of site remediation include the lack of data on synergistic effects among chemical contaminants [Finkel, 1989], the difficulty of translating noncancer exposures into adverse outcomes and the valuing of these noncancer effects (such as monetizing the value of a bronchitis case averted), and the uncertainty surrounding future land uses at Superfund sites [Hersh et al., 1997]. Some participants in the Superfund debate see cost-effectiveness estimates as a covert way to reduce environmental protection. Regulatory reforms requiring benefit-cost analysis are thus opposed on the basis that they lead to undesirable reductions in environmental protection.
A fourth explanation for the inefficiency of EPA remediations may lie in the distribution of benefits and costs associated with more efficient remedies. The debate over the degree that democratic institutions produce efficient results has attracted increasing scrutiny [Becker, 1983; Lott, 1997; Wittman, 1989]. In the context of Superfund, consider how a reduction in remediation expenditures to efficient levels could have concentrated costs for residents surrounding sites that did not receive extensive cleanups and dispersed benefits for taxpayers/consumers who faced lower taxes or product prices to fund public and private cleanups. Local residents have an
24 / How Costly Is "Clean"? An Analysis of the Benefits and Costs of Superfund Site Remediations
incentive to push for pristine cleanups because remediation funds come from federal budgets and corporate expenditures. Politicians are responsive to the political activity of those surrounding Superfund sites. Hamilton [1997] demonstrates that legislators' votes on the 1986 SARA amendments in part depended on the distribution of Superfund NPL sites in their districts. The EPA decisionmakers set more stringent cleanup standards at NPL sites where residents are more politically active [Viscusi and Hamilton, in press]. When spending their own funds in the housing market, residents surrounding Superfund sites reflect a willingness to pay to avoid risks similar to that found in value of life studies from labor markets [Dept. of Economics, Duke Univ., 1997]. When pushing for the expenditure of others' funds, residents have an incentive to push for remediations that are inefficient but result in more stringent cleanups. Hird [1994] has proposed as part of Superfund reform that citizen-based committees be involved in the allocation of funds to address environmental hazards, so that individuals are more likely to incorporate opportunity costs in remediation decisions.
Against this backdrop of uncertainty and distrust, our analysis demonstrates the advantages of conducting site-level analysis of population risks, calculating the benefit- cost trade-offs implicit in different remedy decisions, and analyzing the implications of using different land use scenarios and different parameter assumptions in the calculation of risks. If this were done, the EPA could target resources more effectively within the Superfund program, although it would require the removal of congressional requirements such as ARARs that currently limit agency discretion. Legislation proposed in the 104th Congress (H.R. 9) would have required the agency to conduct a benefit-cost analysis for projects where expected expenditures exceed $5 million, which would affect at least 194 of the 267 sites in our sample based on costs as estimated in site documents (that is, before cost growth). True benefit-cost analysis at these sites, however, would require more research expenditures on topics such as chemical toxicity, natural resource damages, and noncancer impacts. Note also that the benefits of added analysis would need to be balanced with the cost of information. Currently, the agency targets $1.1 million to spend on the remedial investigation/feasibility study characterizing the nature of contamination at a site. Translating these individual risk
figures into estimates of population risks is extremely low cost given GIS technology and census data. The clustering of chemicals in particular combinations and similarities of contamination across site types may even mean that standard remedies based on population risks could also be developed by the agency. Our analysis demonstrates that whether decisions are based on-site-level risk assessments or the
applications of standard remedies to site types, the trade-offs should be analyzed so that the costs of remediation are directly linked to explicit benefits.
This work was supported by U.S. EPA Cooperative Agreement CR-817478-02-03. We have benefited from the excellent editorial and research support of Kristen Blann and the research assistance of Scott Rehmus (project staff director), Jason Bell, Chris Dockins, Ted Gayer, Rob- ert Malme, Zachary Robinson, and Este Stifel. Helpful comments were received from Dr. Alan Carlin, Dr. Suzanne Giannini-Spohn, other members of U.S. EPA Office of Policy, Planning, and Evaluation (OPPE) and Office of Emergency and Remedial Response (OERR), and this journal's editor and referees. All errors remain our own.
JAMES T HAMILTON is Associate Professor of Public Policy at Duke University.
W KIP VISCUSI is John E Cogan Jr. Professor of Law and Economics, and Director of the Program on Empirical Legal Studies at Harvard Law School.

How Costly Is "Clean"? An Analysis of the Benefits and Costs of/ 25 Superfund Site Remediations
REFERENCES
Acton, J.P., & Dixon, L.S. (1992). Superfund and transaction costs: The experiences of insurers and very large industrial firms. Santa Monica, CA: Rand, Institute for Civil Justice.
Barnett, H.C. (1994). Toxic debts and the Superfund dilemma. Chapel Hill, NC: University of North Carolina Press.
Becker, G.S. (1983). A theory of competition among pressure groups for political influence. Quarterly Journal of Economics, 98, 371-399.
Burmaster, D., & Harris, R. (1993). The magnitude of compounding conservatisms in Super- fund risk assessments. Risk Analysis, 13, 131-134.
Church, T.W., & Nakamura, R.T. (1993). Cleaning up the mess: Implementation strategies un- der Superfund. Washington, DC: The Brookings Institution.
Congressional Budget Office. (1994). The total costs of cleaning up nonfederal Superfund sites. Washington, DC: U.S. Government Printing Office.
Department of Economics, Duke University. (1996). Monte Carlo analysis of the distribution of hazardous waste risks. Durham, NC: Dockins, P.C.., Hamilton, J.T., & Viscusi, W.K.
Department of Economics, Duke University. (1997). Private values of risk tradeoffs at Super- fund sites: Housing market evidence. Durham, NC: Gayer, T., Hamilton, J.T., & Viscusi, W.K.
Diamond, P., & Hausman, J. (1994). Contingent valuation: Is some number better than no number? Journal of Economic Perspectives, 8, 45-64.
Doty, C.B., & Travis, C.C. (1989). The Superfund remedial action decision process: A review of fifty records of decision. Journal of the Air Pollution Control Association, 39, 1535-1542.
Finkel, A.M. (1989) Is risk assessment really too conservative? Revising the revisionists. Co- lumbia Journal of Environmental Law, 14, 427-467.
Graham, J.D., & Wiener, J.B. (1995). Risk versus risk: Tradeoffs in protecting health and envi- ronment. Cambridge, MA: Harvard University Press.
Gupta, S., VanHoutven, G., & Cropper, M. (1996). Paying for permanence: An economic analysis of EPA's cleanup decisions at Superfund sites. Rand Journal of Economics, 27, 563-582.
Hamilton, J.T., & Viscusi, W.K. (1995). The magnitude and policy implications of health risks from hazardous waste sites. In R.L. Revesz and R..B. Stewart (Eds.). Analyzing Superfund: Economics, science, and law. Washington, DC: Resources for the Future.
Hamilton, J.T. (1997). Taxes, torts, and the Toxics Release Inventory: Congressional voting on instruments to control pollution. Economic Inquiry, 35, 745-762.
Hamilton, J.T., & Viscusi, W.K. (1998). Calculating risks? A spatial analysis of hazardous waste cleanups. Unpublished manuscript, Sanford Institute of Public Policy, Duke University, Durham, NC.
Hersh, R., Probst, K., Wernstedt, K., & Mazruek, J. (1997) Linking land use and Superfund cleanups: Unchartered territory. Washington, DC: Resources for the Future.
Hird, J.A. (1990). Superfund expenditures and cleanup priorities: Distributive politics or the public interest? Journal of Policy Analysis and Management, 9, 455-483.
Hird, J.A. (1993). Environmental policy and equity: The case of Superfund. Journal of Policy Analysis and Management, 12, 323-343.
Hird, J.A. (1994). Superfund: The political economy of environmental risk. Baltimore: Johns Hopkins.
Johnson, B.L. (1993). Testimony before Senate subcommittee on Superfund, recycling, and solid waste management, May 6, 1993. Agency for Toxic Substances and Disease Registry, Atlanta, GA.
26 / How Costly Is "Clean"? An Analysis of the Benefits and Costs of Superfund Site Remediations
Johnson, B.L. (1995). Nature, extent, and impact of Superfund hazardous waste sites. Chemo- sphere, 31, 2415-2428.
Lott, J.R. (1997). Does political reform increase wealth? Or, why the difference between the Chicago and Virginia schools is really an elasticity question. Public Choice, 91, 219-227.
National Oil and Hazardous Substances Pollution Contingency Plan, 55 Federal Register 8666- 8865, 1990.
National Research Council. (1991). Environmental epidemiology: Public health and hazard- ous waste. Washington, DC: National Academy Press.
Nicholas, A.L., and Zeckhasuer, R.J. (1986). The perils of prudence: How conservative risk assessments distort regulation. Regulation, 10, 13-24.
Noll, R.G., & Krier, J.E. (1990). Some implications of cognitive psychology for risk regulation. Journal of Legal Studies, 19, 747-779..
Probst, K.N., & Portney, P.R. (1991). Assigning liability for Superfund cleanups: An analysis of policy operations. Washington, DC: Resources for the Future.
Probst, K.N., Fullerton, D., Litan, R.E., & Portney, P.R. (1995). Footing the bill for Superfund cleanups: Who pays and how? Washington, DC: The Brookings Institution and Resources for the Future.
Rabe, B.G. (1990) Legislative incapacity: The Congressional role in environmental policy-making and the case of Superfund. Journal of Health Politics, Policy, and Law, 15, 571-589.
Revesz, R.L., & Stewart, R.B. (Eds.). (1995). Analyzing Superfund: Economics, science, and law. Washington, DC: Resources for the Future.
Russell, M., & Davis, K.L. (1995). Resource requirements for NPL sites: Phase II interim re- port. Knoxville, TN: Joint Institute for Energy and Environment.
Sanford Institute of Public Policy, Duke University. (1996). Estimating environmental equity: Who bears risks at Superfund sites? Durham, NC: Hamilton, J.T., & Viscusi, W.K.
Sigman, H. (1998) Liability funding and Superfund clean-up remedies. Journal of Environ- mental Economics and Management, 35, 205-224.
Stewart, R.B. (1995). Liability for natural resource injury: Beyond tort. In R.L. Revesz & R.B. Stewart (Eds.), Analyzing Superfund: Economics, science, and law. Washington, DC: Re- sources for the Future.
Travis, C.C., Scofield, P.A., & Blaylock, B.P. (1993). Evaluation of remediation worker risk at radioactively contaminated sites. Journal of Hazardous Materials, 35, 387-401.
U.S. Environmental Protection Agency (EPA). (1987). Unfinished business: A comparative as- sessment of environmental problems. Washington, DC: U.S. Government Printing Office.
U.S. Environmental Protection Agency (EPA). (1988). Hazardous ranking system revisions technical support document, CERCLA Docket No. 105 NCP-HRS-10-a. Washington, DC: U.S. Environmental Protection Agency.
U.S. Environmental Protection Agency (EPA). (1989). Risk assessment guidance for Super- fund, Volume I: Human health evaluation manual part A (Interim final). Office of Emer- gency and Remedial Response, OSWER Directive 9285.701A, EPA/540/1-89-002. Washing- ton, DC: U.S. Environmental Protection Agency.
U.S. Environmental Protection Agency (EPA). (1990). Progress toward implementing Super- fund fiscal year 1989: Report to Congress. Office of Emergency and Remedial Response EPA/540/8-90/017. Washington, DC: U.S. Environmental Protection Agency
U.S. Environmental Protection Agency (EPA). (1991). Role of the baseline risk assessment in Superfund remedy selection decisions. OSWER Directive 9355-30. Washington, DC: U.S. Environmental Protection Agency.
U.S. Environmental Protection Agency (EPA). (1993). Remedial project managers site data- base. Office of Emergency and Remedial Response. Washington, DC: U.S. Environmental Protection Agency.

How Costly Is "Clean"? An Analysis of the Benefits and Costs of / 27 Superfund Site Remediations
U.S. Environmental Protection Agency (EPA). (1994). A report on state/territory non-NPL haz- ardous waste site cleanup efforts for the period 1980-1992. Office of Solid Waste and Emer- gency Response EPA/540/R-94/001. Washington, DC: U.S. Environmental Protection Agency.
Viscusi, W.K. (1996). Regulating the regulators. University of Chicago Law Review, 63, 1423- 1461.
Viscusi, W.K., & Hamilton, J.T. (in press). Are risk regulators rational? Evidence from hazard- ous waste cleanup decisions. American Economic Review.
Viscusi, W.K., Hamilton, J.T., & Dockins, P.C. (1997). Conservative versus mean risk assess- ments: Implications for Superfund policies. Journal of Environmental Economics and Man- agement, 34, 198-206.
Wittman, D. (1989). Why democracies produce efficient results. Journal of Political Economy, 97, 1395-1424.
Zimmerman, R. (1993). Social equity and environmental risk. Risk Analysis, 13, 649-666.