Embed Size (px)
Citation preview

© Yann Arthus-Bertrand / Altitude
How Climate Change Science Can Inform Weather Reports
Thomas Stocker
Co-Chair IPCC Working Group I University of Bern, Switzerland

Conclusion:
Unique opportunity
Widest possible audience
Access to wide audience on a daily basis
Activate Weather Channels
for Climate
Last Slide of Presentation to the WMO Executive Council Meeting, Geneva 16.5.2013
www.climatechange2013.org

IPCC Assessment Reports (2011 − 2014)

Key SPM Messages
19 Headlines on less than 2 pages
5
14 Chapters & Atlas
1,100,000 Words
Summary for Policymakers
14,000 Words

Key SPM Messages
19 Headlines on less than 2 Pages
6
14 Chapters & Atlas
1,100,000 Words
Summary for Policymakers
14,000 Words

Warming of the climate system is unequivocal
IPC
C 2
013,
Fig
. SP
M.1
b
Temperature Difference 1901 to 2012 based on trend (°C)

atmosphere, land, ocean
extreme events
water cycle
global mean sea level
Human influence on the climate system is clear.
sea ice, glaciers, ice sheets
Cause Worldwide Effects

Limiting climate change will require substantial and sustained reductions of greenhouse gas emissions.

Communicating Climate through News Channels

How to communicate key IPCC assessment findings through Weather Channels and Meteo News?
Need a “Weather ” Anchor
Provide short scientific facts from the IPCC Assessment
Use figures and headline statements from the WGI AR5 SPM
Message in 1 minute plus 1 simple graphics
Examples of “Weather” Anchors for WGI AR5 (1) Atmospheric CO2 concentration: record levels
(2) Warming Pause: Where has the heat gone?
(3) Greenland melting and sea level rise
(4) Extreme temperatures: Eastern Europe 2010

Geneva, 26 May 2014 (WMO) - For the first time, monthly concentrations of carbon dioxide (CO2) in the atmosphere topped 400 parts per million (ppm) in April throughout the northern hemisphere.
Anchor 1: Record CO2 concentration levels
WMO Press Release

(Lüthi et al.,2008, NOAA)
+40%
2013
Anchor 1: Record CO2 concentration levels
The concentrations of CO2 have increased to levels
unprecedented in at least the last 800,000 years.

( mod
ified
from
Pet
ers
et a
l., 2
013,
Glo
bal C
arbo
n Pr
ojec
t)
2013 9.9±0.5 Bill tons C per year
+61% since Rio '92
CO
2 Em
issi
ons
(Bill
tons
C /
yr)
CO2 emissions by human activity are unprecedented
Anchor 1: Record CO2 concentration levels
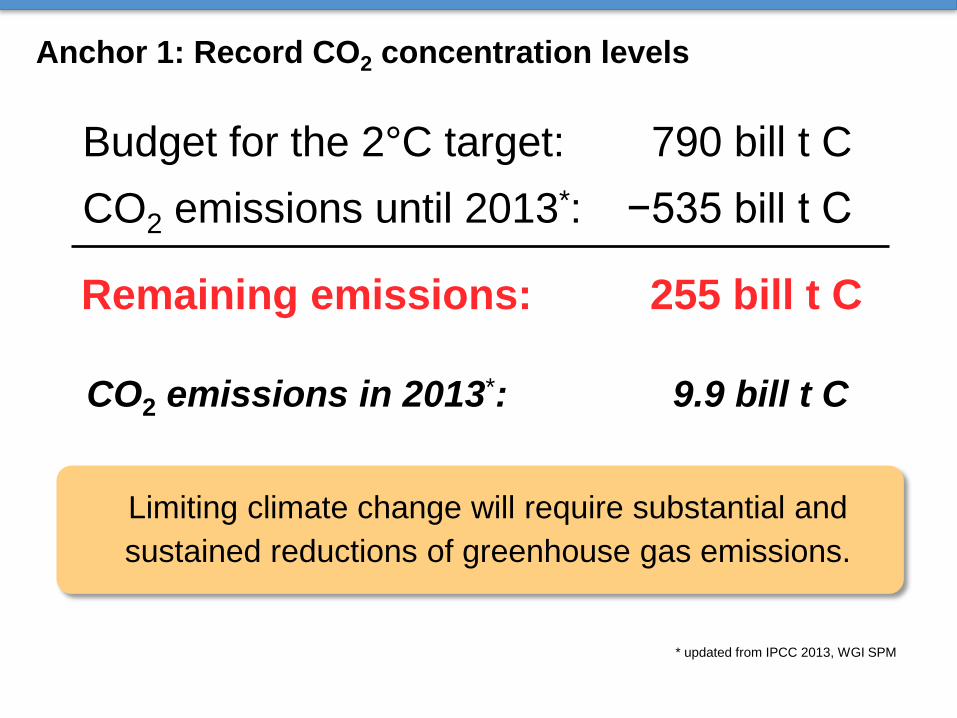
Budget for the 2°C target: 790 bill t C CO2 emissions until 2013*: −535 bill t C
CO2 emissions in 2013*: 9.9 bill t C
Remaining emissions: 255 bill t C
Limiting climate change will require substantial and sustained reductions of greenhouse gas emissions.
* updated from IPCC 2013, WGI SPM
Anchor 1: Record CO2 concentration levels

Geneva, 13 November 2013 (WMO) - Temperatures so far this year are about the same as the average during 2001-2010 ...
WMO Press Release
Anchor 2: Warming Pause: Where has the heat gone?

Ano
mal
y (°
C) r
elat
ive
to 1
961-
1990
Anchor 2: Warming Pause: Where has the heat gone?
[…] the rate of warming over the past 15 years […] is smaller than the rate calculated since 1951 […]
IPC
C 2
013
Fig.
SPM
.1a

Cha
nge
in E
nerg
y C
onte
nt (1
021 J
oule
)
1980 1990 2000 2010
300
200
0
100
-100 1970
(IPC
C 2
013,
Box
3.1
, Fig
. 1, m
odifi
ed)
Anchor 2: Warming Pause: Where has the heat gone?
About half of all heat accumulated in the ocean since 1970 was added after 1998.
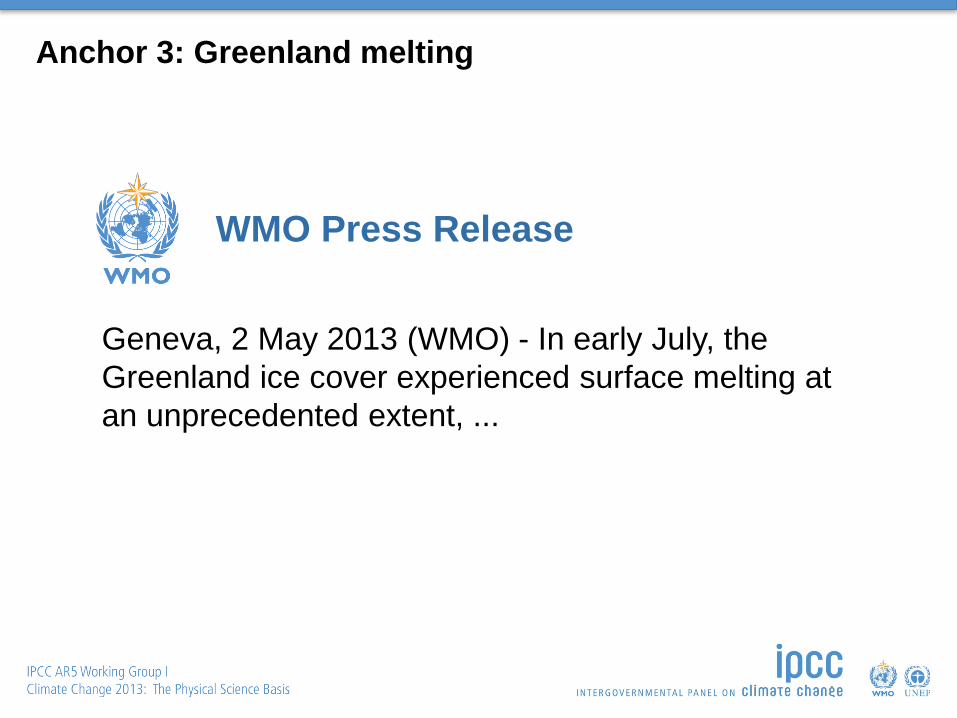
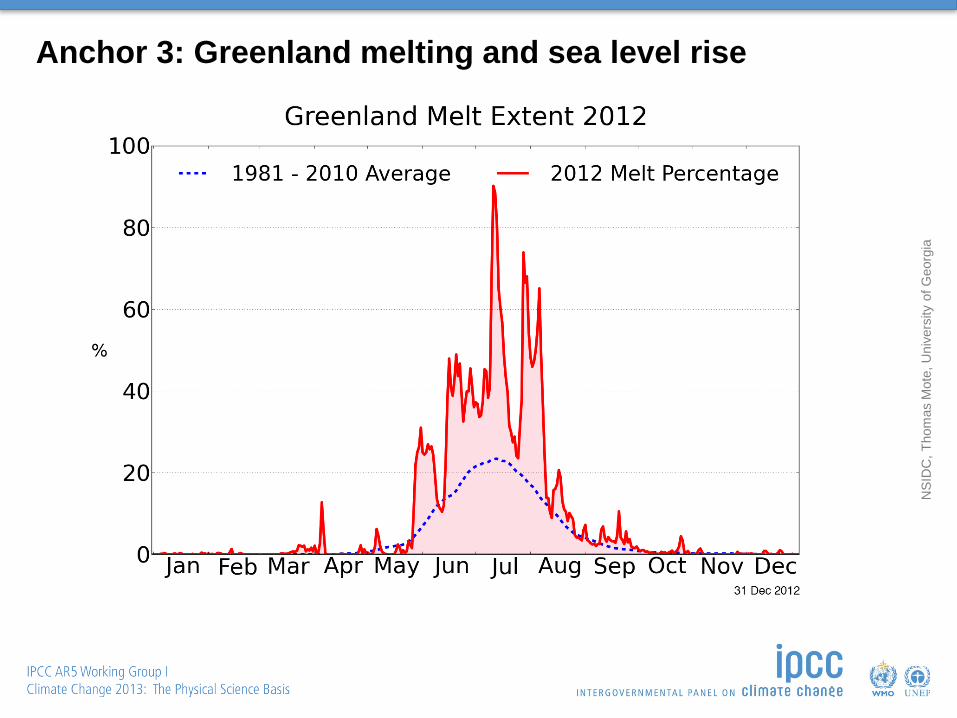
Geneva, 2 May 2013 (WMO) - In early July, the Greenland ice cover experienced surface melting at an unprecedented extent, ...
Anchor 3: Greenland melting
WMO Press Release

Anchor 3: Greenland melting and sea level rise
Nic
olo
E. D
iGiro
lam
o, S
SAI/N
ASA
GSF
C,
and
Jes
se A
llen,
NAS
A Ea
rth O
bser
vato
ry
NSI
DC
, Tho
mas
Mot
e, U
nive
rsity
of G
eorg
ia
Anchor 3: Greenland melting and sea level rise
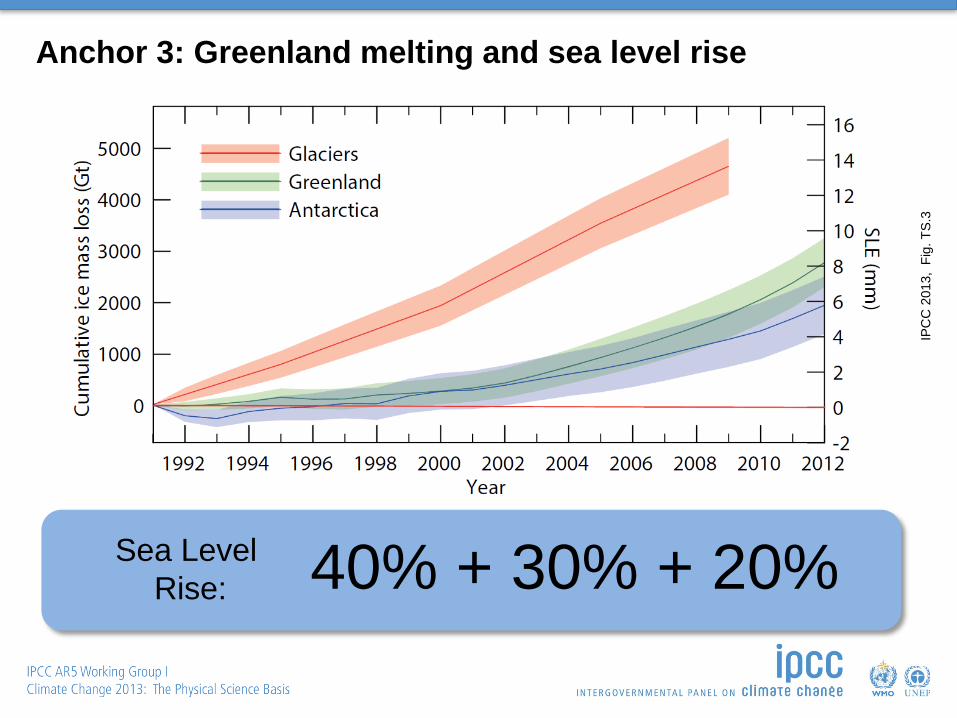
IPC
C 2
013,
Fig
. TS.
3
Anchor 3: Greenland melting and sea level rise
40% + 30% + 20% Sea Level Rise:

IPC
C 2
013,
TFE
.2, F
ig. 2
+19 cm
+63 cm
Anchor 3: Greenland melting and sea level rise

Geneva, 19 September 2014 (WMO) - The globally averaged temperature over land and ocean surfaces for August 2014 was the highest for August since record keeping began ...
WMO Press Release
Anchor 4: Extreme Summer Heat

Anchor 4: Extreme Summer Heat: Eastern Europe 2010
NA
SA
Ear
th O
bser
vato
ry im
age
by J
esse
Alle
n,
base
d on
MO
DIS
land
sur
face
tem
pera
ture
dat
a

Bario
pedr
o et
al.,
201
2
The five hottest summers in Europe occurred after 2001, the five coldest before 1924.
Anchor 4: Extreme Summer Heat: Eastern Europe 2010

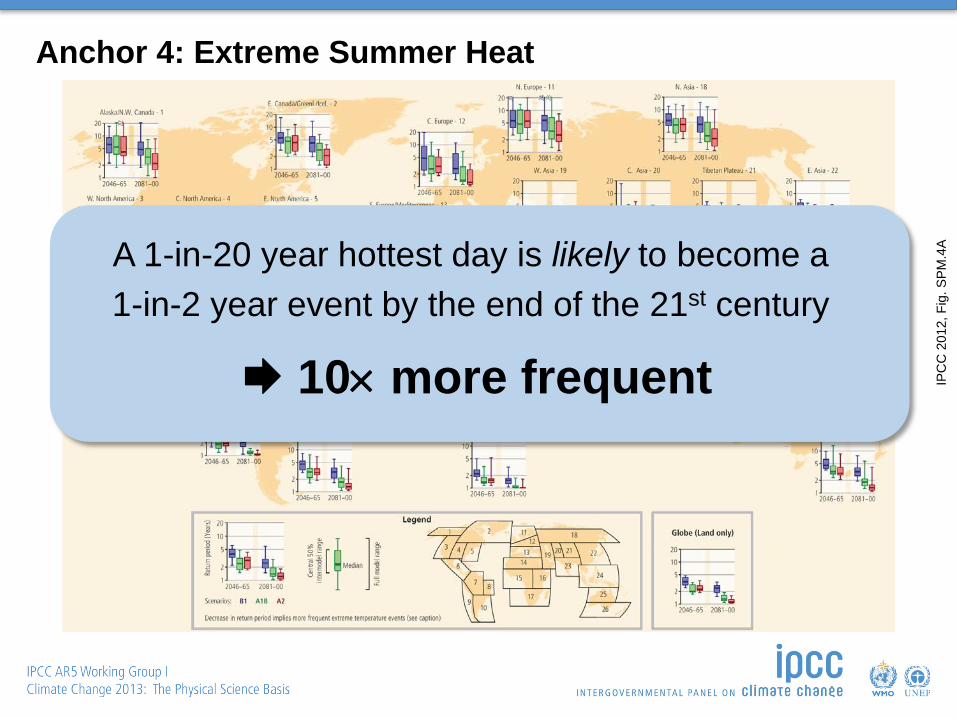
Anchor 4: Extreme Summer Heat
IPC
C 2
012,
Fig
. SPM
.4A
IPC
C 2
012,
Fig
. SPM
.4A
Anchor 4: Extreme Summer Heat
A 1-in-20 year hottest day is likely to become a 1-in-2 year event by the end of the 21st century
10× more frequent

Conclusions
WGI Co-Chairs and TSU would be interested to assist in the preparation of background material from IPCC WGI AR5 that could be widely used (contact: [email protected])
Communication of climate facts through Weather Channels provides:
a unique opportunity of citizen information
occasions to evidence the weather-climate link
bring climate science to the people
Activate Weather and News Channels for Climate Facts
© Yann Arthus-Bertrand / Altitude
www.climatechange2013.org Further Information