Embed Size (px)
Citation preview

HOW CAN IT POSSIBLY FLY? THE PARADOX OF A DYNAMIC LABOUR MARKET
IN A SCANDINAVIAN WELFARE STATE
Per Kongshøj Madsen
Centre for Labour Market Research (CARMA) Department of Economics, Politics and Public Administration
University of Aalborg)
Thanks for comments go to the editors and two anonymous reviewers. Forthcoming in: National Identity and a Variety of Capitalism: The Case of Denmark, edited by John L. Campbell, John A. Hall and Ove K. Pedersen. Montreal: McGill University Press (2006).

2
CARMA Research paper 2005:2 Centre for Labour Market Reseeaech (CARMA) Aalborg University Fibigerstraede 1 DK-9220 Aalborg Denmark www.carma.aau.dk Ph. + 45 96 35 82 03 Fax + 45 98 15 53 46 Email: [email protected] Aalborg 2005-09-09 Copyright: CARMA ISBN 87-89639-29-4

3
1. The Danish job miracle .......................................................................................................4
The international interest in the Danish experience ..........................................................8 2. A good old-fashioned upturn! .............................................................................................9 3. The main research questions .............................................................................................10 4. The ‘golden triangle’ of the Danish employment system....................................................11 5. Worker mobility...............................................................................................................12 6. The Danish unemployment benefit system.........................................................................15 7. Danish active labour market policy...................................................................................16 8. Evaluations of active programmes.....................................................................................19 9. Labour market reforms and the functioning of the labour market.......................................22 10. A small state phenomenon?.............................................................................................26 11. Tensions in the Danish employment system.....................................................................31
Large groups expelled from the labour market...............................................................31 Unemployment benefits and poverty traps .....................................................................32 Problems of active labour market policy........................................................................33 And on the horizon... ....................................................................................................33
12. Conclusion: The feasibility of ‘flexicurity’ and the role of ALMP ...................................33 References............................................................................................................................35

1. The Danish job miracle1 Over the past decade, Denmark has experienced a substantial rise in employment and a fairly
dramatic decline in unemployment. From a maximum of 12.4 per cent in 1993, the rate of
unemployment (national definition) gradually declined to 5.2 per cent in 2001, the lowest level
since 1976. Figure 1 portraits this development against the background of the Danish post-war
experience.
0
500
1000
1500
2000
2500
3000
1948
1951
1954
1957
1960
1963
1966
1969
1972
1975
1978
1981
1984
1987
1990
1993
1996
1999
2002
1,00
0 pe
rson
s
0
50
100
150
200
250
300
350
400
Employment Unemployment
Figure 1: Total employment (left scale) and unemployment (right scale) in Denmark, 1948-2002. Source: Databanks of the macro-econometric model ADAM (Statistics Denmark)
As is evident from figure 1, the development from 1993 and onwards is characterized not only by a
reduction in unemployment but also by a considerable increase in employment to its highest level
ever. As a result, the employment rate increased to 76.2 percent, which as shown in figure 2
represents the top level among EU Member States. In the OECD area as a whole, the employment
rate of Denmark is only surpassed by Norway and Switzerland.

5
0 10 20 30 40 50 60 70 80 90
Italy
Greece
Spain
Belgium
France
Korea
Ireland
Germany
Finland
Portugal
Austria
Japan
Australia
Canada
United States
UK
Netherlands
Sweden
Denmark
Norway
Switzerland
Employment rate 2002 (Percent)
Figure 2: Employment rates (age group 15-64 years) of a number of OECD-countries, 2002. Source: OECD 2003, table B.
Table 1 takes a closer look at the main statistical indicators of labour market development in the
recent period and also compares with the economic downturn from 1987 to 1993. During the
whole period since 1987, the workforce has been almost constant. Thus the changes in open
unemployment mainly reflect changes in total employment. The reduction in unemployment from
1993 to 2002 of just above 200,000 persons mirrors an increase in private employment of about
141,000 persons and in public employment of 68,000 persons. As shown in the last row, the
employment rate increased during the 1990s and almost returned to the level of the mid-1980s. In
this light, the Danish employment success in recent years is not just a reflection of surplus labour
being transformed into participants in different labour market programmes or moved outside the
workforce.

6
Table 1: Main statistical indicators for the Danish labour market, 1983-2002
Year 1987 1993 2002
Change 87-93 (1,000
p.)
Change 93-02
(1,000 p.)
Population, aged 15-64 years, 1,000 p. 3421 3495 3569 74 74
Workforce, 1,000 persons 2888 2880 2885 -8 5
Employment, 1,000 persons 2666 2531 2740 -135 209
Private sector employment, 1,000 p.
1901 1759 1900 -141 141
Public sector employment, 1,000 p. 765 771 840 6 68
Open unemployment, 1,000 p. 222 349 145 127 -204
Employment rate (employment as a share of adult population)
77.9 72.4 76.8 * *
Source: Author’s calculations based on the databanks of the macro-econometric model ADAM (Statistics Denmark) Turning to the question of the level of unemployment, as opposed to the shifts in recent years, it is
important to notice that the number of registered unemployed (labelled ‘open unemployed’ in table
1) to some degree underestimates the size of the labour reserve, because it does not include
unemployed taking part in active labour market programmes, various leave schemes and the
Voluntary Early Retirement Pay Scheme. This scheme, under certain conditions, allows both
unemployed and employed to retire at the age of 60 years receiving a benefit, which is similar to
unemployment benefits, until they qualify for old-age pension at the age of 65. The recipients of
voluntary early retirement pay and the participants in active labour market programs are not included
in the workforce, as it is normally defined.
Figure 3 present information on both open unemployment and ‘gross unemployment’, which
includes not only the registered unemployed but also the unemployed that participate in various
active labour market programmes, leave schemes and the Voluntary Early Retirement Pay Scheme.
As can be seen from figure 3, total ‘gross unemployment’ fell from 600,000 persons in 1994 to
about 434,000 persons in 2002. This is first of all the result of a strong decline in open
unemployment.

7
0
100
200
300
400
500
600
700
1994 1995 1996 1997 1998 1999 2000 2001 2002
1,00
0 pe
rson
s
Open unemployment Active programmes Voluntary early retirement
Figure 3: Open unemployment and gross unemployment, 1994-2002. Source: Databanks of Statistics Denmark. Also the number of participants in active programmes fell during the upturn. Due to a steep
increase in the number of recipients of voluntary early retirement pay, the total number of persons
at the margin of the labour market did not fall as fast as the number of open unemployed.
However, the main conclusion from figure 3 is that the reduction in open unemployment does not
merely reflect a shift in the composition of persons at the margin of the labour market, but a
genuine reduction in the labour reserve.
Finally, one could suspect that the positive employment performance to some extent could have
been the outcome of a widening of the wage dispersion, which then allowed for the creation of
new jobs at the lower end of the wage scale. The available statistical evidence shows that the
relative yearly wage of low-wage workers fell slightly from 39 percent of the income of high-
income earners in 1994 to 37 percent in 2002 (Dansk Arbejdsgiverforening 2003). However, the
decline is only seen after 1999 and is thus more probably the outcome of the upturn in employment
than its cause. Also, from 1994 to 2001, the Gini-coefficient, calculated on the basis of taxable
incomes, increased a little from 0.36 to 0.37 (Danmarks Statistik 2003). Again, the increase is
observed only at the very end of the period.

8
Summing up, the overall impression of the accomplishments of the Danish employment system in
recent years is that of a genuine upturn, which reflects a strong increase in private and public
employment. Furthermore, these results were obtained without deficits on the external balance of
payments (except for 1998) and with rising surpluses for public budgets. Also, this remarkable
improvement in the overall employment situation has been accomplished without any significant
increase in wage-inflation. Finally, no sharp shifts are observed with respect to the wage or income
distribution.
The international interest in the Danish experience Not surprisingly, these favourable developments have caused international interest and made
Denmark a member of the group of small successful European economies (Auer 2000; Auer &
Casez 2003). To many international observers, Denmark seems to have created a unique
combination of stable economic growth and social welfare since the mid-1990s, at a time when
liberals were arguing that the classical Scandinavian model was becoming obsolete and was no
longer able to face the demands of flexibility and structural change arising out of technological
progress and the growing forces of international competition.
The term flexicurity is often used to characterize this successful combination of adaptability to a
changing international environment and a solidaristic welfare system, which protects the citizens
from the more brutal consequences of structural change. In recent years there has been a growing
interest in the scientific study of various model of flexicurity characterized by different combination
of forms of flexibility and security. In this broader perspective the Danish model can be seen as a
specific variant, where a high level of mobility between firms (external numerical flexibility) is
combined with income security. For an introduction to this new line of research, reference can be
made to Wilthagen and Tros (2004). The success of the Danish model of flexicurity thus points to
a ‘third way’ combining the flexibility of the labour market often ascribed to a liberal market
economy with the social safety nets of the traditional Scandinavian welfare state.
However, reality is, as usual, more complex than the portraits of model societies found in
international discussions of welfare state systems. The purpose of this chapter is therefore to
present a brief, as well as critical analysis of the factors behind the Danish version of a ‘flexicurity
model’. Emphasis will be put on disentangling the various elements behind the apparent success of
the Danish employment system by highlighting the following three aspects:
• The role of the macroeconomic expansion of the 1990s
• The long-term nexus between a high level of labour market flexibility and a generous
system of economic support to the unemployed.
• The contributions of the reforms of Danish labour market policy since 1994.

9
Finally, the chapter takes a critical look at the future trends and challenges of the Danish version of
flexicurity.
2. A good old-fashioned upturn! A first factor to be noted is that the Danish upturn and the decline in unemployment since 1993 is
not in itself an economic miracle, but a standard example of demand-driven growth. Figure 4
portraits the development in different components of aggregate demand since the early 1990s.
-4
-2
0
2
4
6
8
10
12
14
1990 1991 1992 1993 1994 1995 1996 1997 1998 1999 2000 2001 2002
Gro
wth
rat
es,
perc
ent
Private consumption Domestic demand Export of good and services
Figure 4: Real growth rates of components of aggregate demand in Denmark, 1990-2002. Source: Databanks of the macro-econometric model ADAM (Statistics Denmark)
The most notable observation from figure 4 is of course the steep rise in total domestic demand
(especially private consumption) and in exports in 1994, both showing growth rates above 6
percent. This ‘kick-start’ of the economy was followed by four years of solid growth in both
domestic demand and exports. Only in 1999 did the boom in domestic demand level out with
export taking over as the main driving force.
There were several causal factors behind this remarkable development. Firstly, an expansion of
fiscal policy was implemented by the Social Democratic government, which took office in January
1993. Then came falling international interest rates, rising prices of houses and a credit reform
allowing home-owners to convert the fall in long-term interest rates into lower housing costs.
Private demand was therefore strongly stimulated. In 1994 alone, private consumption grew by

10
almost 7 per cent in real terms. Investment in housing accelerated. The same happened, after a
while, with private investment in general, all according to the standard economic textbook. Also,
export developed positively due to a strong international competitiveness, which was among other
factors the result of slow wage increases during the previous years and the fact that nominal wages
during the upturn after 1994 were still remarkably stable.
3. The main research questions The success of the Danish economy and labour market in recent years has stimulated ideas about
the existence of a particular Danish model of the employment system. Due to the correspondence
of the beginning of the upturn in 1994 and the implementation of a number of reforms of labour
market policy, it is sometimes argued that the decline in unemployment can be directly attributed
to the changes in labour market policy. However, as argued in the previous section, the decline in
unemployment itself can be explained perfectly well within the framework of standard macro-
economic analysis. The remarkable feature is therefore not the fall in unemployment as such, but
the fact that this reduction took place without any outburst of wage inflation, cf. figure 5, which
shows the Danish Phillips-curve since 1956. As seen, the Danish Phillips-curve can be subdivided
into three distinct sub-periods. Both the first period from 1956 to the late 1960s and the second
period from the early 1970s to the early 1990 are characterized by downward-sloping curves,
while the third sub-period after 1993-94 shows an almost perfectly flat curve (Boje and Madsen
2003).
0
5
10
15
20
25
Nom
inal
wag
e gr
owth
0 2 4 6 8 10 12 14 Unemployment rate
1956
19571958
1959
1960
1961
1962
19631964
19651966
1967196819691970
1971
1972
1973
19741975
1976
1977 19781979 19801981
1982
1983
198419851986
1987
1988
19891990 1991
1992 19931994
19951996199719981999
200020012002

11
Figure 5: The Danish Phillips-curve 1956-2002. Source: Databanks of the macro-econometric model ADAM (Statistics Denmark)
On this background, the developments of the Danish employment system lead to two different, but
related, research questions. The first deals with the longer terms relative success of the Danish
economy, which – as indicated in section 1 - has been able to sustain a high and rising level of
employment during the post-war period leading to a level of the employment rate, which is among
the highest found in the OECD-countries. The second question focuses on the more spectacular
part of Danish employment history, which is the remarkable – and inflation-free - reduction in
unemployment in recent years. In the remainder of this chapter both those questions will be dealt
with in an attempt to disentangle the longer-term positive development of the Danish employment
system from the noticeable success of the last decade.
4. The ‘golden triangle’ of the Danish employment system The analysis will be carried forward applying a simple model of the Danish employment
system, which has gained popularity in recent years. It takes the form of the so-called ‘golden
triangle’ shown in figure 6 (adapted from Arbejdsministeriet 1999, figure 1.6). The model focuses
on three elements of the Danish labour market and labour market policy:
• A flexible labour market with a high level of external numerical flexibility indicated by high
levels of worker flows in and out of employment and unemployment
• A generous system of economic support for the unemployed
• Active labour market policies aimed a upgrading the skills of the unemployed, that are
unable to return directly from unemployment to a new job
Figure 6: The ‘Golden Triangle’ of flexicurity
Flexible labour market
Generous welfare systems
Active LMP
12
The arrows in the model symbolize flows of persons between different positions within work,
welfare and active labour market programmes. The two arrows linking the flexible labour market
and the generous welfare system indicates that large number of workers are affected by
unemployment every year, but that most of them return to employment after a short spell of
unemployment. Active labour market programmes assist those who do not quickly go back into
employment, before re-entering a job.
The argument underlying the concept of the golden triangle is that the success of the Danish
employment system is due to its unique combination of flexibility (measured by a high level of
external numerical flexibility), social security (a generous system of social welfare and
unemployment benefits) and active labour market programmes, all of which support the ongoing
transformation of the economy. The golden triangle therefore depicts Denmark as a kind of hybrid
employment system. Due to a non-restrictive employment protection legislation, which allows
employers to dismiss workers with short notice, the Danish system has a level of flexibility, which
is comparable to liberal labour markets like those of Canada, Ireland, United Kingdom and United
States. At the same time, through its social security system and active labour market programmes,
Denmark resembles the other Nordic welfare states in providing a tightly knit safety net for its
citizens.
Concerning the historical background for the model, it should be seen not as the result of a well-
defined grand scheme, but as the outcome of a long historical development. The high level of
worker mobility supported by a low level of employment protection is a long-term feature of the
Danish labour market. Actually, the employers’ right to freely hire and dismiss their workers was
accepted by the trade unions as a part of the so-called September Compromise between the social
partners in 1899. Also, she present version of the system for economic support for the
unemployed dates back to the last large reform of the unemployment benefit system in 1969.
Finally, the present system of active labour market policy dates back to programmes introduced in
1979, which were given a large-scale overhaul in 1993-94.
The following sections 5 to 9 looks at each of the corners of the golden triangle, while section 10
in more detail returns to the issue of its historical origin.
5. Worker mobility Compared to the net changes in employment, the underlying mobility of workers between jobs and
the level of both job creation and job destruction are surprisingly high. A recent study concerning
hires, separations, job creation and job destruction has found that, on average, the level of worker
turnover during the period 1980-1995 was about 30 per cent, and in no year less than 25 per cent
(Bingley et al. 2000). The level of job turnover (job creation and job destruction) is also much

13
higher than the level of yearly net changes in employment levels. The overall average of job
turnover is around 12 per cent. Furthermore, the level of worker turnover is high for most
categories of employees and not concentrated to a minor share of extremely mobile unskilled
workers.
0
2
4
6
8
10
12
14
United
Stat
es
United
King
dom
Denm
ark
Nether
lands
Irelan
d
Finla
ndSpa
in
German
y
Franc
e
Luxe
mbour
g
Belgium
Sweden
Japa
n
Portug
alIta
ly
Greec
e
Yea
rs
1992 2000
Figure 7: Average tenure (years) for employees in a number of OECD-countries. Source: Auer and Cazes 2003, table 2.1.
Another indicator of the high rate of mobility on the Danish labour market is provided by data on
the average tenure of employees. Figure 7 shows the distribution of employees by average tenure
in 1992 and 2000 in a number of OECD countries. Denmark is at the low end of the international
scale in terms of average tenure, along with countries such as the United Kingdom and the United
States. In contrast, other Nordic countries, such as Finland and Sweden, have significantly higher
levels of average tenure. Sweden is actually at the top end of the rank, with Japan, Portugal, Italy
and Greece. Moreover, it may be noted that the average levels of tenure, in both Denmark and in
other countries, are fairly stable over time. The level of average tenure therefore appears to be an
inherent structural characteristic of the employment system of each country. Finally, during the
time span covered by the data, there are no signs of a general decline in the stability of the
employment relationship in the countries covered by Figure 7. For the countries in the sample as a
whole, average tenure actually increased a bit from 10.2 years to 10.4 years during the period
covered by figure 7.

14
The composite index of labour mobility calculated by Eurostat based on its labour force survey
gives a similar impression of a flexible Danish labour market. The index takes account of job
rotation, inflows into employment following a period of unemployment, after leaving the education
system and after having looked after a family. With EU-average at 100, the Danish score of 138 is
the highest among the EU Member States (European Commission 2002, p. 10).
An important explanation for the high level of Danish worker mobility is the liberal regime of
employment protection found in Denmark. A number of studies have compared the level of
employment protection in Denmark to that of other countries. Figure 8 summarizes the results of
an OECD study on employment protection legislation (OECD 1999, Chapter 2). As shown by the
indicator of employment protection legislation, Denmark is ranked as having a low level of
employment protection compared to most other industrialized countries, and much lower than the
other Nordic countries, with which Denmark is commonly grouped. Although there may be
differences between the formal level of employment protection and the actual enforcement of the
legislation, the data still shows a surprising divergence between Denmark and the other Nordic
welfare states.
0 1 2 3 4 Overall EPL Strictness Late 1990s
USAUnited Kingdom
IrelandCanada
DenmarkSwitzerland
FinlandNetherlands
JapanAustria
BelgiumGermanySwedenNorwayFrance
SpainItaly
GreecePortugal
Figure 8: Overall strictness of employment protection legislation (ELP) in the late 1990s. Average indicator for regular contracts, temporary contracts and collective dismissals. Source OECD 1999, table 2.5.

15
It might be thought that this high level of job mobility and low level of employment protection
would lead to a widespread feeling of insecurity among Danish employees. Paradoxically, this is
not the case. In a survey conducted in 1996, the proportion of Danish workers not strongly
agreeing with the statement ‘my job is secure’ was about 45 per cent, and therefore considerably
lower than for all the other countries in the sample. This feeling of job security was found among
all subgroups of workers (OECD 1997, Table 5.2). Although this may also reflect the positive
situation on the Danish labour market at the time of the survey, there are no clear indications that
Danish workers are reacting to the high level of numerical flexibility with a strong feeling of
insecurity. Similar results have also been found in a more recent survey (Auer and Casez 2003,
figure 1.1).
There are at least three explanations for this apparent paradox. One is the predominance of small
and medium-sized enterprises (SMEs) in the Danish industrial structure, which implies that strong
internal labour markets are less important than in other countries. It is easier to shift from one firm
to another due to lower entry barriers at the enterprise level. Furthermore, the general
improvement in the Danish labour market situation since 1994 may also have influenced the
responses, although Danish registered unemployment in 1996 was still at the level of 8.9 percent of
the labour force. But a final explanation is the relatively generous unemployment benefits paid to
unemployed workers from the first day of unemployment and for a considerable period. This is the
subject of the following section.
6. The Danish unemployment benefit system The vast majority of unemployed persons who are members of an unemployment insurance fund
receive unemployment benefits calculated at the rate of 90 per cent of their previous earned
income, with a ceiling of 162,000 DKK (21,800 Euro) per year (2003). Unemployment benefits
may be claimed from the first day of unemployment and for a maximum of four years, including
periods of activation.
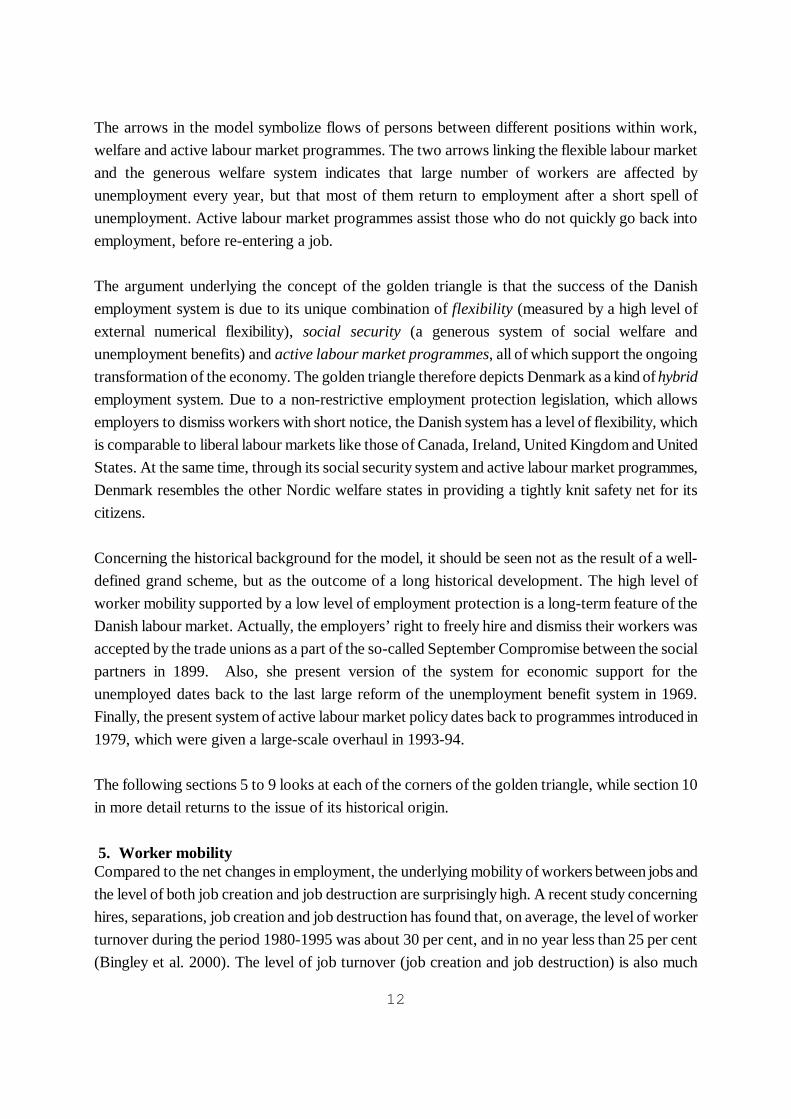
For low-income groups, this and other income-related benefits, combined with the effects of the
rather high level of income tax, result in high net income replacement rates (OECD 2002). For an
average production worker, for example, the replacement rate is around 70 per cent. For low-
income groups, the net replacement rate is around 90 per cent, highest for single parents. This
system puts Denmark in the top end of the EU Member States, when one compares the net
replacement rates. Figure 9 shows the results from the comparison provided by OECD.
The minority of the unemployed, who are not members of an unemployment insurance fund (often labeled the ‘non-insured’ unemployed), will receive means-tested social security cash benefits, which for adult family supporters are at a level around 80 percent of normal unemployment benefits. The most important difference between unemployment benefits and social security cash benefits is thus the means testing. Furthermore, social security cash benefits will depend on the recipient’s family situation. Also, a special low level of cash benefits was introduced in 2002 for
16
newly arrived immigrants.
0
10
20
30
40
50
60
70
80
90
Italy
Greec
eSpa
in
Franc
e
Irelan
d
Portu
gal
Germ
any
Austri
a
Finlan
d UK
Belgium
Luxe
mbo
urg
Nethe
rland
s
Sweden
Denm
ark
NR
R (
perc
ent)
Figure 9: Average net replacement rates (NRR) for 60 months of unemployment for an average of different family types and income levels. Percent. Source OECD 2002, table 3.10
In the Danish labour market system, the potential disincentives caused by such high income
replacement rates are addressed by requiring the unemployed to be actively seeking jobs and by
offering mandatory activation after 12 months of unemployment for adults and 6 months of
unemployment for young unemployed persons under the age of 25. Activation is therefore seen as
fulfilling both a qualification and a motivation purpose.
7. Danish active labour market policy Between 1979 and 1993, the main pillar of the active policies to address long-term unemployment
was a programme combining job offers, training and support to the unemployed to help them start
up in self-employment. However, this programme showed relatively poor results, with only a
minority of the participants becoming employed on the open labour market. This factor, combined
with a sharp new increase in unemployment between 1990 and 1993, increased the political
pressure to find new measures to break the vicious circles of long-term unemployment. The result
was a general labour market reform, which came into force in January 1994, having the following
main characteristics:
• The introduction of a two-period benefit system, with an initial passive period of four
years and a subsequent activation period of three years; during the passive period, an
unemployed person receives benefits and is also eligible for 12 months of activation;

17
• A change in the assistance provided to individual long-term unemployed persons from a
rule-based system to a system based on an assessment of the needs of the individual (with
the introduction of individual action plans as an important instrument);
• The decentralization of policy implementation to regional tri-partite labour market
councils, which are empowered to adjust programme design to fit local needs;
• The abolition of the connection between participation in labour market measures and the
unemployment benefit system, with the effect that employment with a wage subsidy no
longer would prolong the period for which the unemployed are eligible for unemployment
benefits.
• The introduction of three paid leave arrangements for childcare, education and sabbatical
leave to encourage job rotation by allowing employed (and unemployed) persons to take
leave while receiving a benefit paid by the state and calculated as a fraction of
unemployment benefit.2
Under the governments headed by the Social Democrats from 1994 to 2001, Danish labour market
policy underwent a number of further reforms, having as their main effect a shortening of the
maximum period for which the unemployed would receive benefits (the passive period). As noted
above, this passive period was four years in 1994 (with an option of 12 months of activation
during this period). In 1996, the passive period was reduced to two years. For young unskilled
unemployed persons, the period was reduced to six months in 1996. It was subsequently decided
in 1999 to further reduce the passive period to one year for adult unemployed persons. By the end
of 2000, Denmark had therefore implemented the element of the European Union’s employment
guidelines, which call for early activation for both young and adult unemployed persons.
The Conservative-Liberal government in 2003 with broad political support introduced a new major
reform of labour market policy, ‘More people at work’. With respect to active measures, it had the
following main elements:
• The number of individual programmes of active labour market policy was reduced from 32
different schemes to only 3 main types of instruments covering a) guidance, training and
education, b) practical introduction to the enterprises and c) wage subsidies.
• Higher priority was given to early guidance and other forms of personal contact with the
individual unemployed at least every 3 months. The demands on the unemployed for active
job search and mobility were increased
• The whole administrative system for active labour market policy and benefits was
modernised applying an extensive use of digital technologies.
• Other actors (private firms and organisations, including the unemployment insurance
funds) were to become more involved in implementing active employment policies at all
stages.
• All adult unemployed should still take part in an active program after 1 year of

18
unemployment. However, the exact extent of activation was now specified more vaguely
than under the previous system, which had a rule stating that activation should be on a full-
time basis (defined as 75 percent of the time in the ‘active period’).
• A long-term target of the reform goal was to fully integrate the two tiers of the present
Danish system, which now handles insured and non-insured unemployed separately. Here
an important step is to be taken in 2006, where joint job-centres located in in the
municipalities will take over the responsibility for both the insured and the non-insured
unemployed.
Also as part of the reform, social security cash benefits for some groups (married couples and
newly arrived immigrants) were reduced. However the vast majority of recipient of social benefits
and of normal unemployment insurance benefits have not been affected by this element of the
reform. Therefore the main impression of the reforms of labour market policy since the change in
Government in 2001 is that the main policy profile is kept intact as a reflection of a broad political
consensus about the merits of the style of labour market policy, which was developed during the
second half of the 1990s.
0 0,5 1 1,5 2 2,5 3 3,5 4 4,5 5
USA
Japan
UK
Greece
Canada
Italy
Switzerland
Norway
Portugal
Austria
Ireland
Sweden
Spain
France
Finland
Germany
Belgium
Netherlands
Denmark
Share of GDP (percent)
Active Passive
Figure 10: Expenditure on active and passive labour market policy, 2002 or latest year. Share of
GDP. Source: OECD 2003.

19
The change in the profile of Danish labour market policy since the mid-1990s has placed Denmark
in the upper range of OECD countries in terms of expenditure on both active and passive labour
market policy measures. The data in figure 10 illustrate the high level in Denmark of total
expenditure on active measures and passive benefits (unemployment benefits including early
retirement for labour market reasons).3 Also when it comes to expenditure on active measures
alone, Denmark is ranked high among the OECD-countries, only surpassed by the Netherlands.
8. Evaluations of active programmes As in many other countries, the net effects of active labour market policy are disputed. One reason
is that active programmes have both positive and negative effects on the future employments
prospects of the individual participants:
• The motivation effect implies that an unemployed person seeks work more actively in the
period immediately before she or he has to participate in a mandatory activation programme.
The strength of the motivation effect is indicated by the change in the probability of leaving
unemployment in the period immediately before the person is obliged to take part in an
activation programme.
• The ‘locking-in’-effect means that job-search activities are reduced during the period that an
individual takes part in a programme.
• The training (or qualification) effect stems from the rise in the level of qualifications during
activation, which should improve the possibilities of finding a job for those who have
participated in one of the active programmes.
In a study published in 2000, the Ministry of Labour presented some of the first results based on a
new database, which it had developed (Ministry of Labour 2000). The database contains
information on the labour market situation of all individuals, including their participation in labour
market programmes and their contacts with the social security system.
First of all, the study revealed significant motivation effects, measured by an increased probability
to take up employment in the period immediately before having to take part in mandatory
activation programmes. Such effects have been confirmed by later studies (e.g. Geerdsen 2003;
Rosholm and Svarer 2004) and play an increasing role for the proponents of active programmes.
However, the specific dilemma posed by such observations should be borne in mind. If it is wished
to increase the motivation effect, there may be a temptation to change the content of activation
programmes in order to make them less attractive to participants. But this would also probably
imply that the quality of the programmes themselves would be lowered in terms of their training
content and other activities to improve the skills of the participants. As a result, the overall
outcome might be less positive for those unemployed persons who are unable to find a job before
entering activation.

20
Another potential effect for the individuals taking part in activation programmes is that they
increase their chance of gaining employment due to the improvement in their qualifications and
therefore their employability. In the study by the Ministry of Labour, the improvement in
employability is measured by the reduction in the proportion of the year for which the persons
concerned receive any form of transfer income (such as unemployment benefit, social assistance or
sickness benefit). A reduction in this proportion is a reliable indicator of a genuine improvement in
the employment situation of an individual, either because they have found ordinary employment or
taken up some form of ordinary education.
0 10 20 30 40 50
Private jobtraining
Public jobtraining (long)
Public jobtraining
Other activation
Education
Total
Percent
Figure 11: Increase in economic self-dependency after taking part in different programmes, averages for 1996-1998. Source: Beskæftigelsesministeriet 2002, figure 9.
Such qualification effects of the various types of labour market programmes are of considerable
interest, cf. figure 11.4 In this respect, the largest improvement in the employment situation
(measured by an increase in the economic self-dependency of the participant) is found for
participants in private job training. For public job training and labour market education the effects
are positive, but smaller. These findings are in line with international experience (Martin 2000).
Other studies have been more sceptical towards the positive net effects of active programmes,
often pointing to the existence of significant locking-in effects. By example, the Chairmen of the
Economic Council in their report from December 2002 ascribe about one third of the reduction in
unemployment since 1993 to improved structural performance of the Danish labour market and
attributes part hereof to improved labour market policy (Det økonomiske Råds formandskab
2002). However, the report gives a rather critical account of the majority of the instruments

21
applied within active labour market policy and especially points to significant locking-in effects of
several measures. Only job training in private firms seems to have large positive net effects and to
be cost-effective. Job-training in the public sector and many forms of education have dubious or
negative net outcomes for the participants. On this background the Chairmen proposes
improvements in the use of active measures (including giving higher priority to job search and
private job-training).
0
2
4
6
8
10
12
Nethe
rland
s
Austri
a
Irelan
d
Denm
ark
Sweden
Portu
gal
United
King
dom
Belgium
Germ
any
Franc
e
Finlan
dIta
ly
Greec
eSpa
in
Per
cent
Total unemployment Long-term unemployment Youth unemployment
Figure 12: Total unemployment (unemployed as % of workforce), long-term unemployment (long-term unemployed as % of workforce) and youth unemployment (unemployed as % of age group) in a number of EU Member States. Source: European Commission 2003, statistical annex. The countries are ranked according to the sum of the three indicators.
Concerning international comparisons, it is difficult to assess the efficiency of Danish active labour
market policy in a comparative perspective. Figure 12 gives some data on overall unemployment,
long-term unemployment and youth unemployment for a number of European countries. As
indicated by figure 12, Denmark is among the best performers among the European countries,
when assessed by various aspects of unemployment. Also when measured by other indicators of
labour market performance like life-long learning, gender pay gaps, employment rates of older
workers etc. Denmark is among the top performers of the EU Member States.

22
9. Labour market reforms and the functioning of the labour market The evaluation findings discussed above have focussed on the micro-level. However, the
coincidence of the implementation of the labour market reforms and the dramatic fall in
unemployment has of course stimulated discussions about the extent to which the inflation-free
macro-economic upturn can be attributed to the shift in labour market policy in the 1990s. A
lowering of the level of wage inflation for a given size of unemployment is taken as an indicator of
greater flexibility in the functioning of the labour market. As noted above, the Danish Phillips
curve has since 1994 become almost horizontal, indicating a steep fall in structural unemployment.
Of course, there could be a number of factors behind these developments. The changing attitudes
of the social partners could be important. Thus, in 1987 the social partners issued a joint
declaration stating that they would take the overall macro-economic performance into
consideration and therefore negotiate wage increases below the international wage inflation in
order to improve the competitiveness of the Danish industry. This declaration has since laid the
foundation for the general wage negotiations. From a theoretical perspective this explanation can
be supported by the concept of the ‘negotiated economy’, which sees Denmark as a prime example
of a society, where a joint conception of the overall targets and constraints for macro-economic
development has been established (Nielsen & Pedersen 1991).
Furthermore, Danish wage negotiations have to an increasing degree been decentralised to the
level of the individual firms. Thus, in the collective agreements covering the major part of the
private sector, only 15 percent of the agreements had centrally negotiated wage rates in 2000. In
1989, the share was 34 percent. The share of agreements, which mentions no wage rate at all
increased during the same period from 4 to 20 percent (Dansk Arbejdsgiverforening 2003, table
8.10). According to the well know Calmfors-Driffill-hypothesis, this development could also
explain slower wage growth (Calmfors and Driffill 1988).
Combining the conditions for wage negotiations at the central and de-central level, one could
therefore point to a shift in the norms for wage negotiations, which implies both a recommendation
of wage restraint from actors at the central level and a higher acceptance of the need to keep
wages in line with (foreign) competitors at the firm level. Thus shifts in norms and in the
organisation of wage formation overruled the potential inflationary effects of a large reduction in
unemployment. Following the argument of Smith (1992) this points to the complexity of the forces
that determine inflation and to the fragility of the traditional Phillips-curve.
In this context one must furthermore emphasize the lowering of the international level of inflation
(including wage inflation) as an important factor behind the lower internal pressure for nominal

23
wage increases. In their report from December 2002, the Chairmen of the Economic Council
presented a new model of Danish wage formation, which includes wage increases abroad as an
important explanatory variable. The estimate for the influence of foreign wage growth implies that
Danish nominal wages increase by almost 0.6 percent, when foreign wages increase by 1 percent
(Det Økonomiske Råds Formandsskab 2002, pp. 155-6).
A final point worth taking into the argument concerning the lowering of nominal wage inflation is
the difference between the development of nominal and real wages during the last decades, cf.
figure 13. The main message is that stable growth in real wages of about 2 percent per year can be
reached also at a moderate level of nominal wage growth, as indicated by the experience from the
1990s. The opposite lesson was learned during the years from 1977 to 1986, where increases in
nominal wages of 5 to 12 percent resulted in increases in real wages around zero. An added factor
during the period from 1994 and onwards was the further increase in private consumption made
possible by the growth in prices of private homes and the easy access to cheap mortgage.
Therefore the perception of the need to moderate nominal wage growth was strongly supported by
the daily experience of the wage earners themselves – slow wage increases and rising living
standards could easily go hand in hand.
-5
0
5
10
15
20
25
1970
1972
1974
1976
1978
1980
1982
1984
1986
1988
1990
1992
1994
1996
1998
2000
2002
Per
cent
Nominal wage growth Real wage growth
Figure 13: Growth in nominal and real hourly wages for workers in manufacturing industry, 1980-2002. Source: Databanks of the macro-econometric model ADAM (Statistics Denmark)

24
While one can therefore present a number of explanations for the shift in the unemployment-
inflation nexus on the Danish labour market since the early 1990s, one can also point to evidence,
which support the view that the reforms of labour market policy during the 1990s made a
significant contribution to the improved functioning of the labour market. Thus the Chairmen of
the Economic Council, who as indicated above are rather sceptical to the merits of active labour
market programmes, nevertheless ascribe a little less than half of the reduction in unemployment
since 1993 to improved structural performance of the Danish labour market and attributes a
significant part hereof to the reforms of labour market policy, although they find it difficult to
provide a more exact estimate. The Chairmen furthermore point to an increase in the share of
unemployed that are actively looking for work and relate this to the shortenings of the period of
passive benefits payments and the stricter demands to take part in activation (Det Økonomiske
Råds Formandskab 2002, pp. 163-5 and 153).
A study from the Danish National Institute of Social Research in 1998 summed up the evidence
from a large-scale evaluation programme studying the initial labour market reform of 1994 (Larsen
and Langager 1998, pp. 34-36). Concerning the importance of the activation strategy, the analysis
showed that:
$ The employment goals specified in the individual action plans indicated that there was a
considerable planned mobility among the unemployed.
$ Labour market policy seemed to function effectively in that planned mobility among the
unemployed was larger in those regions where the need for mobility was the highest (due
to threats of bottlenecks)
$ There were significant positive employment effects of both job training and education for
unemployed.
$ The effective supply of labour among the insured unemployed seemed to have increased
from 1994 to 1997 probably due to the stricter demands made on the unemployed during
the second phase of the reform (for instance in relation to the increased demands on the
young unemployed).
Concerning the activities directed at the firms, there were indications that the reform has
contributed to the absence of bottlenecks since 1994:
$ There was a (weak) indication that the quality of the services of the Public Employment
Service to the firms has improved since the reform when looking at the ability to fulfil the
needs for qualified labour (though there were also examples of labour shortages in the
short run).
$ The introduction of new forms of placement services (in the form of ‘open’ self-service
placements) had - together with the surveillance activities and regular contacts with
employers - lead to an increase in the transparency of the labour market and thus

25
improved its function as a system to match demand for and supply of labour; the market
share of the Public Employment Service however, was still rather low.
Thus, based on the positive evaluation findings for both the process and the effect of the labour
market reforms, there is a well-based case for arguing that the change in Danish labour market
policy in 1993-94 has made a separate contribution to the improved functionality of the Danish
labour market in recent years. The absence of labour shortages and wage-pressure since 1994, in
spite of the fall in unemployment and the strong growth in employment, indicate that the func-
tioning of the labour market has improved.
0
100
200
300
400
500
600
700
800
900
1000
1960
1962
1964
1966
1968
1970
1972
1974
1976
1978
1980
1982
1984
1986
1988
1990
1992
1994
1996
1998
2000
2002
1,00
0 pe
rson
s
Total Whereof unemployed
Figure14: Number of adults aged 15-65 years and receiving transfer income 1960 to 2002. Full time equivalents. Source: Databank of ADAM (Statistics Denmark) Also, as indicated in figure 14, the number of both unemployed and the total number of adult
persons receiving transfer income has been falling since 1993. Besides the unemployed, the number
of adult persons aged 15-65 years and receiving transfer income includes persons on sickness
benefits, invalidity pension and voluntary early retirement schemes. The number of recipients of
transfer income has been steadily rising since the early 1960s, but started falling in 1993. To what
extent this is due to the labour market reforms, the economic upswing or to other of the above
mentioned factors cannot be definitively determined on the basis of the available evidence.
However, on the basis of the data in figure 14, it is hard to judge Danish labour market policy

26
during the 1990s as creating social exclusion or being in other ways destructive to the functioning
of the labour market or the welfare state.
10. A small state phenomenon? Given the interest in the Danish experience in recent years, it is appropriate to address the question
of the background and uniqueness of the interplay between labour market flexibility, social security
and active labour market policies that has been spelled out in detail in the previous sections.
As already indicated, the Danish ‘model of flexicurity’ is not the result of a well-defined grand
scheme, but as the outcome of a long historical development. Thus, the high level of worker
mobility supported by a low level of employment protection is a long-term feature of the Danish
labour market. Already in the September Compromise between the social partners in 1899, the
trade unions accepted the employers’ right to freely hire and dismiss their workers. Since then, a
set of agreements and norms have developed, which put some restrictions of the practices of the
employers with respect to dismissals. Thus, a revision of the General Agreement between the
social partners in 1960 stated that dismissals should not be arbitrary and that suspected unfair
dismissals could be assessed by a special tribunal (Kristensen 1997, chapter 10). However, as
indicated by the indicators provided by the OECD, the Danish regime concerning dismissals still
puts relative few restrictions on the employers (OECD 2004, chapter 2).
Similarly, the system for economic support for the unemployed in not of a recent date, but has its
origin in unemployment insurance funds founded by the trade unions and regulated by law since
1907. The last large reform of the unemployment benefit system took place in 1969, where the
state undertook the responsibility for financing the extra costs of unemployment benefits that were
caused by increases in unemployment (the principle of financing ‘at the margin’). The members of
the unemployment insurance funds would therefore only be obliged to pay a fixed membership
contribution, independent of the actual level of unemployment. Furthermore, as shown by
Kærgaaard and Hansen (1994), the average compensation rate of unemployment benefits almost
doubled during the late 1960s and 1970s. Data from the databank of the macro-econometric model
ADAM indicate that the level of compensations then levelled out round 60 percent. During the
1990s the average rate of compensation has slowly fallen to around 50 percent. Finally, as
described in detail above, the present system of active labour market policy dates back to
programmes introduced in 1979, which were given a large-scale overhaul in 1993-94 and
subsequent years.
A further observation can be made concerning the present foundation for this model. The
relationship between the liberal regime of employment protection and the well-developed state-
financed system of unemployment compensation is strongly supported by both trade unions and
employers’ organisations. This support becomes manifest every time political proposals for

27
restrictions in the access to unemployment benefits are put forward. In such cases a strong alliance
between trade unions and employer’s organisations is formed, where the employer’s organisations
point to the risk of claims for better employment protection in case of deteriorations of the benefit
system. An illustration of the strength of this alliance was given in August 2003, when the Minister
of Employment, as part of the negotiations for the budget for 2004, put forward a proposal to
reduce unemployment benefits by a number of reforms, including the introduction of a longer
waiting period for high-income earners. Originally the aim for this and related proposals was to
reduce public expenditures by around 100 million Euros. Immediately the proposals met strong
resistance from the trade unions, especially in the construction sector. Longer terms of notice were
called for, if the rules were changed. Then the employer’s organisations moved in and supported
the views of the trade unions referring to the lower flexibility that would be the outcome of
cutbacks in the benefit-system. At first the protests lead to a reduction in the intended savings to
around 20 million Euros, and in the end the Minister had to drop the proposal all together.
The third element in the triangle, active labour market policy, is also the outcome of a long
tradition for interventions into the functioning of the labour market. When it comes to the settling
of wage negotiations, the September Compromise in 1899 is often taken as the starting point,
because this agreement between the social partners also laid the foundation for the state’s role as
mediator in collective agreements. In 1907 the first law on Unemployment Insurance Funds was
passed and in 1913 a public employment service was established. In 1942 the Ministry of Labour
was established as a separate ministry. Thus, labour market policy in Denmark has a long political
legacy, although it only developed into a distinct policy area in the mid-1950 (Jørgensen & Larsen,
2002, pp.171-175). Being partly based on a system of private unemployment insurance funds
affiliated with the trade unions and having traditionally a large number of tri-partite bodies
responsible for labour market training and other institutions, Danish labour market policy is thus a
prime example of the negotiated economy:
‘The September Compromise provided the foundation for labour market regulation that
emphasized negotiation early on, and organizational representation in government
committees, boards and commissions has remained strong ever since. The state has
learned to delegate authority to the labour market organizations, and they almost
always assist in the design of initiatives. The organizations also have a strong sense of
‘ownership’ of the post-war labour market policy’ (Jørgensen & Larsen, 2002, p. 171)
Also the reforms of labour market policy in the 1990s were the outcome of a compromise between
the Government and the social partners, which was struck in the early 1990s in a special tri-partite
committee (the Zeuthen Committee). The committee hammered out the foundation for the active
and de-central profile of Danish labour market policy in the following years. The background for
the Zeuthen-Committee was increasing dissatisfaction with the general design of labour market

28
policy, which had been the outcome of the last reform in 1979. Also, the dramatic rise in open
unemployment in the early 1990s pushed the need for reform higher on the political agenda.
Recent studies of the political processes behind the reform of labour market policy in 1993 and its
successors have pointed to a number of factors behind this development (cf. the various
contributions in Madsen & Pedersen 2003b):
• The changes in the discourse where active labour markets programmes were increasingly
argued as a important instrument to lower structural employment and received support
from both proponents of workfare-oriented and human-capital oriented strategies (cf. also
Torfing 2004)
• The need of the newly elected government lead by the Social Democrats to demonstrate its
ability to ‘break the curve’ of unemployment
• The broad public support for reforms, including the various leave schemes.
• While the social partners had a dominant role during the work in the Zeuthen Committee,
their function in the subsequent adjustments has been somewhat ambiguous. In some years,
especially in 1998, they played an important part, while the Government took the lead in
other situations, thus shifting between different political channels for decision making (cf.
Winter 2003).
However most observers will agree that corporatist structures play an important role in explaining
the development and robustness of the particular Danish version of ‘flexicurity’ (Mailand & Due
2003; Jørgensen & Larsen 2003). Furthermore, the above observations also fit well with Peter
Katzenstein’s view on small state democratic corporatism in the sense that the Danish version of
‘flexicurity’ allows for flexible adaptation of the level and composition of employment to a
changing international environment with ongoing shifts in the demand for goods and services
(Katzenstein 1985). In a slightly different context, Auer (2000) has also pointed to the importance
of strong corporatist governance as a factor of explanation for the success of a number of small
European countries, including Denmark.
With reference to the literature on the Varieties of Capitalism (VOC), Denmark on the other hand
provides an interesting case of a variety, which does not fit well with the idea of regimes clustering
either around the liberal market economy (LME) or the coordinated market economy (CME) (Hall
and Soskice 2001). From the VOC-perspective, Denmark would be seen as having an unstable
configuration of institutions and being on the move in the direction of one of the two clusters.
However, when looking at the historical background for the Danish model of flexicurity, the main
notion is that of a model developed through a long time period and underpinned by stable
institutions and class compromises.
Concerning the question of the relation between the longer-term traits of the Danish labour market
and the specific developments of the 1990s, it is important to note that neither the flexibility-

29
security nexus nor a well-performing employment system (indicated by a high employment rate) is
something new. To the contrary, and in spite of the difficult years of the first and the second oil
crisis, the post-war economic and social history of Denmark must in most respects be seen as a
successful transformation from an agrarian to a modern society, which has kept its place in the top
league of nations based on most indicators of economic and social performance.

30
Table 2: An overview of the Danish system of ‘flexicurity’
Basic traits of the Danish system of ‘flexicurity’
Specific developments in the 1990s
Political environment • Strong corporatist structures • Implicit social contract
concerning balance between security and flexibility
• Broad political support for reforms of labour market policies
• Acceptance by social partners of need for wage restraint
• New government headed by the Social Democrats
Macroeconomic environment
• Changing international economic conditions
• Active fiscal policy, but constrained by external balance
• Strong internal demand • Favourable external balance • Lower level of international
inflation
Employment situation • High employment rate (around 75 percent)
• Shifting levels of open unemployment
• Rising share of persons receiving transfer income
• Significant reduction in both open and gross unemployment
• Reduction in structural unemployment
Worker mobility (external numerical flexibility)
• High by international standards
• High by international standards
Employment protection
• Weak • Weak
Unemployment benefits
• Significant increase in compensation rate with reform in the late 1960s
• Cash benefits for non-insured unemployed
• Slow decline in compensation rate, but still high by international standards
• Reduction in duration, especially for passive benefits
Active labour market policy
• High expenditures on LMP in general
• Incremental policy adjustments since 1979
• Decentralized • Individualized • Right and duty to early
activation

31
Table 2 aims at summing up the basic traits and the more recent developments of the Danish model
of flexicurity. The main points from table 2 is that the combination of high employment rates, weak
employment protection and generous economic support for the unemployed has been a
characteristic of the Danish employment system since the late 1960s. The added features during
the 1990s were firstly a more favourable macro-economic environment, and secondly, a more
ambitious labour market policy.
The interesting aspect of the most recent Danish development in the 1990s is therefore that
Denmark has been able to keep its position as a successful economy at times, where the Nordic
welfare states were criticised for being ill adapted to face the pressures from increased
internationalisation. However, the present situation of the Danish employment system is not
without strains and tensions. This is the subject of the following section.
11. Tensions in the Danish employment system As noted in the introduction, the dramatic fall in open unemployment in Denmark since the mid-
1990s has attracted the attention of international observers. In many respects, there are real
grounds for this admiration. But on the other hand, it may be useful to take a closer look at some
of the drawbacks and tensions in the Danish model of flexicurity. Returning to the concept of the
golden triangle, a number of problems can be identified in the Danish employment system.
Large groups expelled from the labour market Firstly, the highly dynamic nature of the labour market, involving a large number of shifts between
jobs, also implies a continuous testing of the productivity of employees. One outcome of these
ongoing selection processes is that some workers are being gradually expelled from the labour
market if they fail to meet the productivity criteria set by employers. The few restrictions placed on
employers with regard to lay-offs may of course add to the risk of exclusion from the labour
market. There may also be many other, often inter-related, causes of marginalisation, such as
health problems, lack of formal or informal skills, age or ethnic background.
Over the 40-year period from 1960 to 1999, the number of full-time persons receiving some form
of transfer income increased from about 200,000 persons to over 800,000 persons equivalent to
about one quarter of the adults aged 15-66 years. This number does not include persons covered
by active labour market measures for the unemployed, who accounted for another 87,000 persons
in 1999, or persons above the age of 67 receiving old-age pensions. One price paid for the high
level of efficiency of the Danish labour market therefore appears to be that a large number of
persons are being gradually excluded from the labour market and placed on transfer income.

32
However, the growth in the number of persons supported by transfer income has not been at the
expense of the share of employed adults. Figure 15 shows the distribution of the adult population
(aged 15-65 years) from 1960 to 2002 into the number of persons receiving some form of transfer
income, the number of adults supported in the family and the employed (divided into public and
private employment). During the last forty years, the share of adult Danes in employment has been
around 75 percent. The rise in the share of adults receiving transfer income has therefore solely
been reflected in a corresponding decline in the share of adults being supported in the family
(mainly as married women).
0
10
20
30
40
50
60
70
80
90
100
1960
1962
1964
1966
1968
1970
1972
1974
1976
1978
1980
1982
1984
1986
1988
1990
1992
1994
1996
1998
2000
2002
Per
cent
Private employment Public employment Transfer income Supported by the family
Figure 15: Denmark: Adult population (15-65 years) by source of income, full-time equivalents, 1960-2002. Source: Author’s calculations based on ADAM’s databank (Statistics Denmark) Secondly, it should be noted that the high level of the population receiving transfer income is not a
purely Danish phenomenon. All four Scandinavian countries experienced the growth in the share
of inactive adults receiving transfer income up to the level of about 25 per cent in the late 1990s,
indicating that the mechanisms involved cannot be attributed solely to special features of the
dynamics of the Danish labour market, but also to more general aspects of the interplay between
welfare states of the Scandinavian type, modern labour markets and the business cycle.
Unemployment benefits and poverty traps Another debate related to the golden triangle has already been foreshadowed. The high
replacement rates in the Danish unemployment benefit system increase the risk of financial
disincentives, especially for low-income groups (Finansministeriet, 2001). While such effects are

33
theoretically plausible, they have been hard to verify empirically, at least as being important in their
magnitude. Indeed, the general remedy has been to rely on early and intensive activation measures
to counter problems related to the potential disincentives of the unemployment benefit system.
Problems of active labour market policy Turning to the third corner of the golden triangle, some further critical points may be made to
supplement the discussion of the micro-effects already touched upon. Thus, Danish labour market
policy has been given a more active profile during a period of economic expansion. In the event of
a change in the business cycle, the cost of maintaining the level of ambition to activate the
unemployed at an early stage would lead to a sharp increase in public expenditure at a time when
revenues would be falling due to the economic downturn. The political pressure to cut active
programmes could therefore become overwhelming, and would be compounded by Denmark’s de
facto need to comply with EMU budget criteria.
And on the horizon... Taking a longer-term perspective, a number of further problems may be identified which could
increase the forces that are already causing a rise in the number of persons excluded from the
Danish labour market. These include:
• The demographic changes over the coming decades, which imply a growth in the number
of older workers, with higher risks of marginalisation.
• The rising share of immigrants in the Danish population, with the proportion of persons
from non-European countries rising from about 4 per cent today to about10 per cent in
2020.
• The increasing wage competition from low-wage countries, also within Europe, which
will be strengthened in the event of the accession of a number of Eastern European
countries to the European Union.
These challenges to the Danish model will place the need to reduce the upward trend in the
numbers of persons left outside the golden triangle high on the Danish political agenda in coming
years (Nordic Council of Ministers 2000).
12. Conclusion: The feasibility of ‘flexicurity’ and the role of ALMP The analysis of the Danish version of flexicurity can be summarized in three steps. Firstly, one can
identify a high level of worker mobility (external numerical flexibility) as a structural characteristic
of the Danish labour market. An important explaining factor for this situation is the liberal regime
of employment protection found on the Danish labour market. Secondly, the high level of
numerical flexibility is made acceptable for the trade unions and more broadly within the
framework of the traditional value system of a Scandinavian type welfare state by the development
of a state supported unemployment insurance system supplemented by cash benefits for the

34
uninsured unemployed. These two elements constitute the basic flexibility-security nexus. Thirdly
during the 1990s, a more ambitious active labour market policy added stronger both motivation
and qualification effects to stimulate the flows of workers between employment and
unemployment.
Figure 16 sums up the argument applying a modified version of figure 6. The dotted eclipse
indicates the basic flexibility-security nexus combining a high level of numerical external flexibility
and a generous system of economic support for the unemployed. In this context the main role of
active labour market policy is seen as supporting the flows from unemployment back to
employment by creation motivation effects to all the unemployed in the target groups and by
upgrading the skills of the unemployed actually taking part in the programmes.
Figure 16: The Danish model of ‘flexicurity’ revisited
Finally, the positive Danish experience during the 1990s illustrates the importance of the macro-
economic environment. Labour market policies cannot generate ordinary jobs by themselves.
Sufficient pressure from the demand side is a prerequisite. On the other hand, once the upturn is
under way, active labour market policies play an important role in securing the supply of skilled
labour and avoiding bottlenecks.
Thus the Danish experience points to the economic feasibility of a ‘hybrid employment system’
combining on the one hand the traditional virtues of a liberal labour market with few restrictions
on the employment contract with - on the other hand - a reasonable level of economic protection
Flexible labour market
Generous welfare system
Active LMP
The basic flexibility-security nexus
The motivation effect of ALMP
The qualification effect of ALMP
35
of the individual wage earner. The Danish model therefore fits the picture of a possible ‘trade-off’
between a very flexible employment relation and a social protection system combined with active
labour market programmes, which defends the individuals from the potential costs of a low level of
employment security. In this respect the model represent a genuine alternative to the common idea
of making the firms more responsible for employment by developing a high level of individual
employment protection at the company level.
However, one should remember that the Danish model of ‘flexicurity’ itself is the outcome of a
long historical process involving a series of negotiations and compromises between the social
partners, the evolution of the welfare state and – in recent years - a gradual development of a more
active profile of labour market policy. The model is thus a prime example of the specific Danish
version of the negotiated economy. Therefore it should be taken as a source of inspiration for new
ideas about alternative configurations of flexible labour markets and economic security for the
individual – not as a simple scheme, which is ready for immediate export.
References Arbejdsministeriet. 1999. Arbejdsmarkedsreformerne – en status. København: Arbejdsministeriet. Auer, Peter. 2000. Employment revival in Europe. Labour market success in Austria, Denmark, Ireland and the Netherlands, Geneva: International Labour Organization. Auer.P and Sandra Cazes, editors. 2003. Employment stability in an age of flexibility. Evidence from industrialized countries. Geneva: International Labour Organization. Beskæftigelsesministeriet. 2002. Flere i arbejde – analyse af den beskæftigelsespolitiske indsats. København: Beskæftigelsesministeriet. Bingley, Paul, Tor Eriksson, Axel Werwatz and Niels Westergård-Nielsen. 1999. Beyond ‘Manucentrism’: Some fresh facts about job and worker flows. Working paper 99-09. Aarhus: Centre for Labour Market and Social Research. Boje, Thomas.P. and Per Kongshøj Madsen. 2003. ‘Wage Formation, Institutions and Unemployment’. Pp. 213-238 in Post-industrial Labour Markets. Profiles of North America and Scandinavia, edited by Thomas P. Boje and Bengt Furåker. London: Routledge. Calmfors, Lars and John Driffill. 1988. ‘Bargaining Structure, Corporatism and Macroeconomic Performance’. Economic Policy 6: 14-61. Compston, Hugh and Per Kongshøj Madsen. 2001. ‘Conceptual innovation and public policy: unemployment and paid leave schemes in Denmark’. Journal of European Social Policy 11(2): 117-132.

36
Danmarks Statistik. 2003. Statistisk Tiårsoversigt 2003. København: Danmarks Statistik. Dansk Arbejdsgiverforening. 2003. ArbejdsMarkedsRapport 2003. København: Dansk Arbejdsgiverforening. Det Økonomiske Råds Formandskab. 2002. Dansk Økonomi, Efteråret 2002. København: Det Økonomiske Råd. European Commission. 2002. Industrial Relations in Europe. Luxembourg: European Commission. European Commission. 2003. Employment in Europe 2003. Luxembourg: European Commission. Finansministeriet. 2001. Finansredegørelse 2001. København: Finansministeriet Geerdsen, Lars Pico. 2003. Marginalisation Processes in the Danish Labour Market. København: Socialforskningsinstituttet. Hall. Peter A. and David Soskice. 2001. Varieties of Capitalism: The Institutional Foundations of Comparative Advantage. Cambridge: Cambridge University Press Jørgensen, Henning and Flemming Larsen. 2002. ‘Chapter 8: Labour market policies’. Pp. 167-189 in Consensus, Cooperation and Conflict: The Policy Making Process in Denmark edited by Henning Jørgensen. Cheltenham: Edward Elgar. Jørgensen, Henning and Flemming Larsen. 2003. ‘Aktivgørelsen af aktiveringen kommer ikke af sig selv – Betydningen af institutionelt design for udviklingen af ledighedsindsatser’. Pp. 164-200 in Drivkræfter bag arbejdsmarkedspolitikken edited by Per Kongshøj Madsen and Lisbeth Pedersen. København: Socialforskningsinstituttet. Katzenstein, P.J. (1985): Small States in World Markets. Industrial Policy in Europe, London: Cornell. Kristiansen, Jens. 1997. Lønmodtagerbeskyttelsen i dansk arbejdsret. København: GadJura Kærgaard, Niels and Henrik Hansen. 1994. ‘Den danske arbejdsløshed 1903-1990’. Samfundsøkonomen 6: 9-13. Larsen, Mona and Klaus Langager.1998. Arbejdsmarkedsreformen og arbejdsmarkedet. København: Socialforskningsinstituttet Madsen, Per Kongshøj, Peter Munch-Madsen and Klaus Langhoff-Roos. 2001. ‘All Hands on Deck! - Fighting Social Exclusion in Denmark’. Pp.124-151 in Social Exclusion and European Policy edited by David Mayes, Jos Berghman and Robert Salais. Cheltenham: Edward Elgar. Madsen , Per Kongshøj. 2002. ‘The Danish model of flexicurity: A paradise - with some snakes’. Pp. 243-265 in Labour market and social protections reforms in international perspective: Parallel or converging tracks? edited by Hedva Sarfati and Giuliano Bonoli . Aldershot : Ashgate.

37
Madsen, Per Kongshøj . 2003. ‘Flexicurity’ through labour market policies and institutions in Denmark’. Pp. 59-105 in Employment stability in an age of flexibility. Evidence from industrialized countries edited by Peter Auer and Sandrine Cazes. Geneva: International Labour Organization. Madsen, Per Kongshøj and Lisbeth Pedersen, editors. 2003. Drivkræfter bag arbejdsmarkedspolitikken. København: Socialforskningsinstituttet. Mailand, Mikkel and Jesper Due. 2003. ‘Partsstyring i arbejdsmarkedspolitikken – perspektiver og alternativer’. Pp. 202-233 in Drivkræfter bag arbejdsmarkedspolitikken edited by Per Kongshøj Madsen and Lisbeth Pedersen. København: Socialforskningsinstituttet. Martin, John P. 2000. ‘What works among active labour market policies: Evidence from OECD countries’ experience’. OECD Economic Studies 30 (1): 79-112. Ministry of Labour. 2000. Effects of Danish Employability Enhancement Programs. København: Arbejdsministeriet. Nielsen, Klaus and Ove K. Pedersen. 1991. ‘From the Mixed Economy to the Negotiated Economy: The Scandinavian Countries.’ Pp. 145-167 in Morality, Rationality, and Efficiency: New Perspectives on Socio-Economics, edited by Richard M. Coughlin. Armonk: M. E. Sharpe. Nordic Council of Ministers. 2000. Supply of labour in the Nordic countries: Experience, developments and political deliberations. København: Nordisk Ministerråd. OECD. 1997. Employment Outlook, Paris: OECD. OECD. 1999. Employment Outlook, Paris: OECD. OECD. 2002. Benefits and wages. OECD Indicators. Paris: OECD. OECD. 2003. Employment Outlook. Paris: OECD. Rosholm, Michael and Michael Svarer. 2004. ‘Estimating the Threat Effect of Active Labour Market Programmes’, IZA Discussion Paper No. 1300. Smith, Michael R. 1992. Power, Norms and Inflation. New York: Aldine de Gruyter Torfing, Jacob. 2004: Det stille sporskifte i velfærdsstaten, Århus: Magtudredningen, Aarhus Universitetsforlag Wilthagen, Ton and Frank Tros. 2004. ‘The concept of ‘Flexicurity’: A new approach to regulating employment and labour markets’, TRANSFER 10(2): 166-186 Winter, Søren. 2003. ‘Kanalrundfart eller Zapning? – Om kanaler og arenaer i den aktive arbejdsmarkedspolitik’, Pp. 268-317 in Drivkræfter bag arbejdsmarkedspolitikken edited by Per Kongshøj Madsen and Lisbeth Pedersen. København: Socialforskningsinstituttet.

38
1 The author is Professor of Labour Market Research, Department of Economics, Politics and
Public Administration, Aalborg University. The chapter draws on the author’s contributions to
studies initiated by ILO and by ISSA, cf. Madsen (2002, 2003). Inspiration is also taken from his
work within the EXSPRO-project financed by the European Commission, cf. Madsen et al (2001). 2 For a detailed account of the introduction of the three leave schemes, see Compston and Madsen
(2001). The schemes have later been integrated into other pieces of legislation (concerning
maternity leave and adult education). 3 One should mention that expenses for the Danish Voluntary Early Retirement Pay is included in
the figures for Danish passive expenditure and constitutes about 1.7 percent of GDP. However
similar schemes or substitutes for them are found in other countries. It has therefore been chosen
to present the aggregate figures for public expenditure on labour market programs 4 The estimated effects in figure 11 are based on an version of the so-called ‘fixed-effect’ method,
which applies information about the labour market history of each participant to estimate the
effects of participation on subsequent employment and unemployment. Each individual is therefore
used as his or her own control-group. Space does not allow for a more elaborate presentation of
the Danish debate on the relative sizes of the different effects of active programs and of further
effects (like dead-weight and substitution effects) to be included in a full-fledged evaluation of
active labour market programs.


![The Paradox of Free-Market Democracy · The Paradox of Free-Market Democracy [3] As it turned out,of course,the paradox of free-market democ-racy did not prove insuperable.Far from](https://img.dokumen.tips/doc/110x75/602a359aa6bd3f2a8b43d704/the-paradox-of-free-market-democracy-the-paradox-of-free-market-democracy-3-as.jpg)