Embed Size (px)
DESCRIPTION
Homebuilder Hovnanian Quarterly Update
Citation preview

Review of Financial Results
Second Quarter Fiscal 2014

Note: All statements in this presentation that are not historical facts should be considered as “forward-
looking statements.” Such statements involve known and unknown risks, uncertainties and other
factors that may cause actual results, performance or achievements of the Company to be materially
different from any future results, performance or achievements expressed or implied by the forward-
looking statements. Although we believe that our plans, intentions and expectations reflected in, or
suggested by, such forward looking statements are reasonable, we can give no assurance that such
plans, intentions, or expectations will be achieved. Such risks, uncertainties and other factors include,
but are not limited to, (1) changes in general and local economic, industry and business conditions and
impacts of the sustained homebuilding downturn, (2) adverse weather and other environmental
conditions and natural disasters, (3) changes in market conditions and seasonality of the Company’s
business, (4) changes in home prices and sales activity in the markets where the Company builds
homes, (5) government regulation, including regulations concerning development of land, the home
building, sales and customer financing processes, tax laws, and the environment, (6) fluctuations in
interest rates and the availability of mortgage financing, (7) shortages in, and price fluctuations of, raw
materials and labor, (8) the availability and cost of suitable land and improved lots, (9) levels of
competition, (10) availability of financing to the Company, (11) utility shortages and outages or rate
fluctuations, (12) levels of indebtedness and restrictions on the Company’s operations and activities
imposed by the agreements governing the Company’s outstanding indebtedness, (13) the Company's
sources of liquidity, (14) changes in credit ratings, (15) availability of net operating loss carryforwards,
(16) operations through joint ventures with third parties, (17) product liability litigation, warranty claims
and claims made by mortgage investors, (18) successful identification and integration of acquisitions,
(19) significant influence of the Company’s controlling stockholders, (20) changes in tax laws affecting
the after-tax costs of owning a home, (21) geopolitical risks, terrorist acts and other acts of war, and
(22) other factors described in detail in the Company’s Annual Report on Form 10-K for the fiscal year
ended October 31, 2013 and subsequent filings with the Securities and Exchange Commission. Except
as otherwise required by applicable securities laws, we undertake no obligation to publicly update or
revise any forward-looking statements, whether as a result of new information, future events, changed
circumstances or any other reason.
2

Q2 13 Q2 14
18.9%
20.2%
Q2 13 Q2 14
12.2%
13.9%
Q2 13 Q2 14
$865
$1,046
Operating Results
Q2 13 Q2 14
$423
$450
$ in millions
Q2 13 Q2 14
8.0%8.0%
SG&A Interest
Total Interest & SG&A Expenses as a % of Total Revenues
Total Revenues Homebuilding Gross Margin
Backlog $
Note: Excluding unconsolidated joint ventures.
3

Q1 14 Q2 14
18.8%
20.2%
Q1 14 Q2 14
16.6%
13.9%
Q1 14 Q2 14
($24)
($7)
Operating Results
Q1 14 Q2 14
$364
$450
$ in millions
Q1 14 Q2 14
9.0%
8.0%
SG&A Interest
Total Interest & SG&A Expenses as a % of Total Revenues
Total Revenues Homebuilding Gross Margin
Pre-tax Loss
4
Note: Excluding unconsolidated joint ventures.

Dollar Value of Net Contracts
$ in millions
Q2 2013 Q2 2014 Q2 2013 Q2 2014
$580
$669
$696
$703
Consolidated
Including Unconsolidated
Joint Ventures
5

4 5 5 4 4 4 5 5 4 4 4 4 5 5 4 4 4 4 5 5 4 4 4 4
Dollar Amount of Net Contracts Per Month
$175
$199
$168
$163
$167
$160
$177
$161
$169
$169
$133 $150
$139
$131
$191
$175
$222
$211
$224 $
278
$250
$214
$185
$187
Jun-1
2
Jun-1
3
Jul-
12
Jul-
13
Aug-1
2
Aug-1
3
Sep-1
2
Sep-1
3
Oct-
12
Oct-
13
Nov-1
2
Nov-1
3
Dec-1
2
Dec-1
3
Jan-1
3
Jan-1
4
Feb-1
3
Feb-1
4
Mar-
13
Mar-
14
Apr-
13
Apr-
14
May-1
3
May-1
4
$ in m
illio
ns
Includes unconsolidated joint ventures.
Number of
Sundays
6
2.6 3.1
2.7
2.3
2.5
2.2
2.6
2.1
2.5
2.3
2.0
1.8
2.2
1.8
2.8
2.3
3.3
2.9
3.4 3.6 3.6
2.9
2.8
2.4
Jun
-12
Jun
-13
Jul-
12
Jul-
13
Au
g-1
2
Au
g-1
3
Sep
-12
Sep
-13
Oct
-12
Oct
-13
No
v-12
No
v-13
Dec
-12
Dec
-13
Jan
-13
Jan
-14
Feb
-13
Feb
-14
Mar
-13
Mar
-14
Ap
r-13
Ap
r-14
May
-13
May
-14
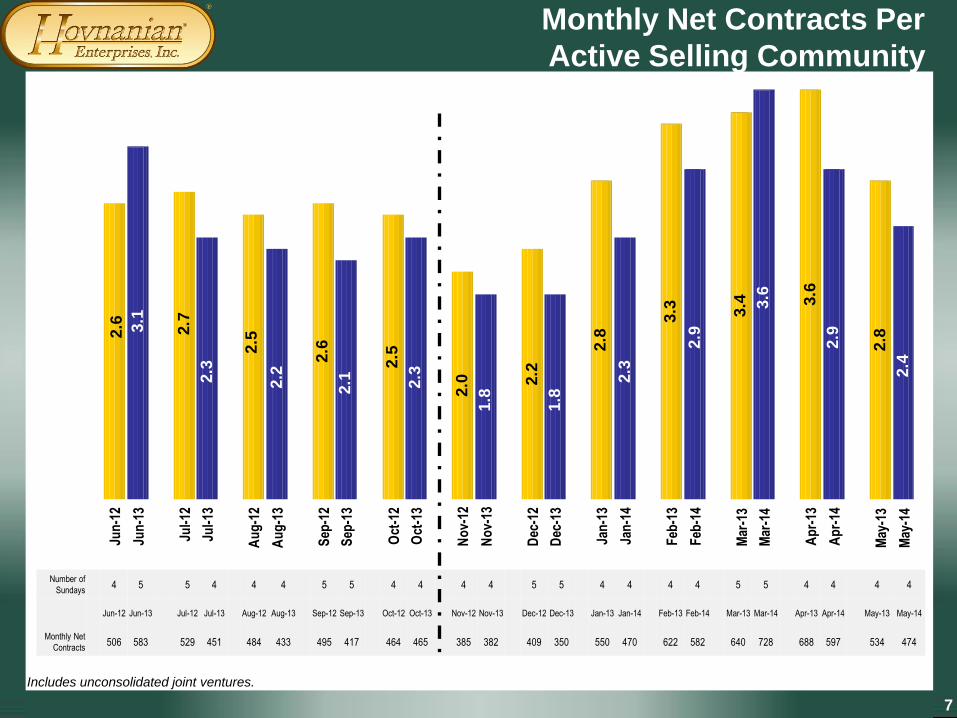
Monthly Net Contracts Per
Active Selling Community
Includes unconsolidated joint ventures.
Number of
Sundays 4 5 5 4 4 4 5 5 4 4 4 4 5 5 4 4 4 4 5 5 4 4 4 4
Jun-12 Jun-13 Jul-12 Jul-13 Aug-12 Aug-13 Sep-12 Sep-13 Oct-12 Oct-13 Nov-12 Nov-13 Dec-12 Dec-13 Jan-13 Jan-14 Feb-13 Feb-14 Mar-13 Mar-14 Apr-13 Apr-14 May-13 May-14
Monthly Net
Contracts 506 583 529 451 484 433 495 417 464 465 385 382 409 350 550 470 622 582 640 728 688 597 534 474
7

-20.0%
-15.0%
-10.0%
-5.0%
0.0%
5.0%
Pulte
DR
Ho
rton
Bea
ze
r
Ho
vna
nia
n*
Ryla
nd
Me
rita
ge
NV
R
Sta
n P
ac
MD
C
M/I
Ho
mes
4.1%
-2.0% -2.1%
-5.6%
-10.3%
-12.4%
-14.3% -14.6%
-15.8%
-19.9%
* Hovnanian is shown as if its quarter ended March 31, 2014.
Year Over Year Change in
Net Contracts per Community
For March Quarter End Median: - 11.3%
Average: - 9.3%
8

Q2 2013 Q2 2014
$865
$1,046
Solid Growth in Backlog
$ in millions
$ Backlog
Note: Consolidated total
9
Q2 2013 Q2 2014
2,462
2,797
# Backlog

-20%
-9%
2%
13%
24%
35%M
DC
(M
ar Q
2)
Pu
lte
(Mar
Q1
)
NV
R (
Mar
Q1
)
Be
aze
r (M
ar Q
2)
KB
Ho
me
(Feb
Q1
)
DR
Ho
rto
n (
Mar
Q2
)
Ryl
and
(M
ar Q
1)
Stan
Pac
(M
ar Q
1)
M/I
Ho
mes
(M
ar Q
1)
Ho
vnan
ian
(A
pr
Q2
)
Len
nar
(Fe
b Q
1)
Mer
itag
e (M
ar Q
1)
Toll
(Jan
Q1
)
-16%
-8%
-3% -2%
4% 5% 7% 9% 10%
14% 15% 15%
31%
Excluding unconsolidated joint ventures.
Year-Over-Year Change in Backlog (in Units)
10

Apr. 13 Apr. 14
177
196
Active selling communities are open for sale communities with 10 or more home sites available.
Active Selling Communities
In the trailing twelve months, we
opened 95 communities and
closed out 76 communities.
Unconsolidated
Joint Ventures 13 7
11

Increasing Lots Controlled
Q3 12 Q4 12 Q1 13 Q2 13 Q3 13 Q4 13 Q1 14 Q2 14
1,387
1,750
1,1881,424 1,502
1,816
1,1381,331
1,800
2,400
1,600
2,700
3,900 3,800
1,600
4,600
Deliveries Net Additions
Note: Net additions include new options, new lots purchased but not previously optioned and walk aways from new options,
including unconsolidated joint ventures.
Note: Deliveries include unconsolidated joint ventures.
Net additions of approximately
10,900 lots in excess of deliveries,
over eight quarters
12
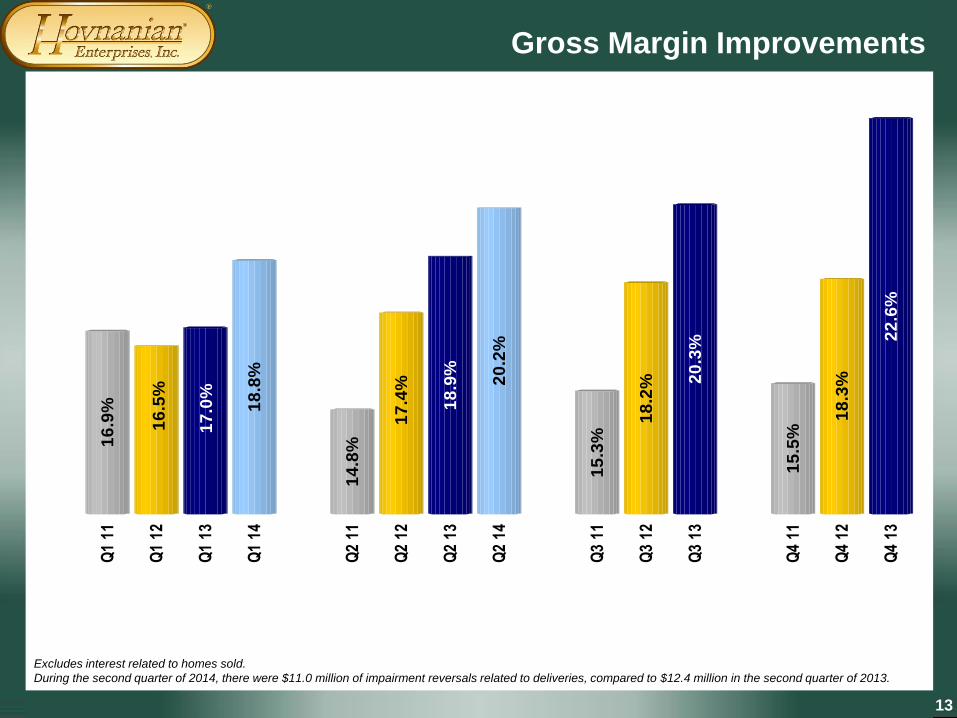
Gross Margin Improvements
16
.9%
16
.5%
17
.0%
18
.8%
14
.8%
17
.4%
18
.9%
20
.2%
15
.3%
18
.2% 2
0.3
%
15
.5%
18
.3%
22
.6%
Q1
11
Q1
12
Q1
13
Q1
14
Q2
11
Q2
12
Q2
13
Q2
14
Q3
11
Q3
12
Q3
13
Q4
11
Q4
12
Q4
13
Excludes interest related to homes sold.
During the second quarter of 2014, there were $11.0 million of impairment reversals related to deliveries, compared to $12.4 million in the second quarter of 2013.
13

FY
00
FY
01
FY
02
FY
03
FY
04
FY
05
FY
06
FY
07
FY
08
FY
09
FY
10
FY
11
FY
12
FY
13
20
.7%
20.6
%
22
.0%
25
.5%
25
.5%
26
.4%
23
.1%
15
.1%
6.7
%
9.2
% 1
6.8
%
15
.6%
17
.8%
20
.1%
Gross Margin
Excludes interest related to homes sold.
14

Q1 13 Q2 13 Q3 13 Q4 13 Q1 14 Q2 14
$49 $52 $56 $63 $60 $62
SG&A Expenses
Note: Total SG& A as a percentage of total revenues. Total SG&A includes homebuilding selling, general and administrative and corporate general and administrative.
SG&A as a
% of Total
Revenue
13.8% 12.2% 11.8% 10.6% 16.6% 13.9%
$ in millions
15

Total SG&A as a Percentage of Total Revenues
Note: Total SG& A as a percentage of total revenues. Total SG&A includes homebuilding selling, general and administrative and corporate general
and administrative.
FY
01
FY
02
FY
03
FY
04
FY
05
FY
06
FY
07
FY
08
FY
09
FY
10
FY
11
FY
12
FY
13
10
.6%
9.7
%
10.0
%
9.5
%
10
.0%
11.2
%
13
.0%
13
.9%
20
.1%
17
.4%
18
.6%
12
.8%
11.9
%
16
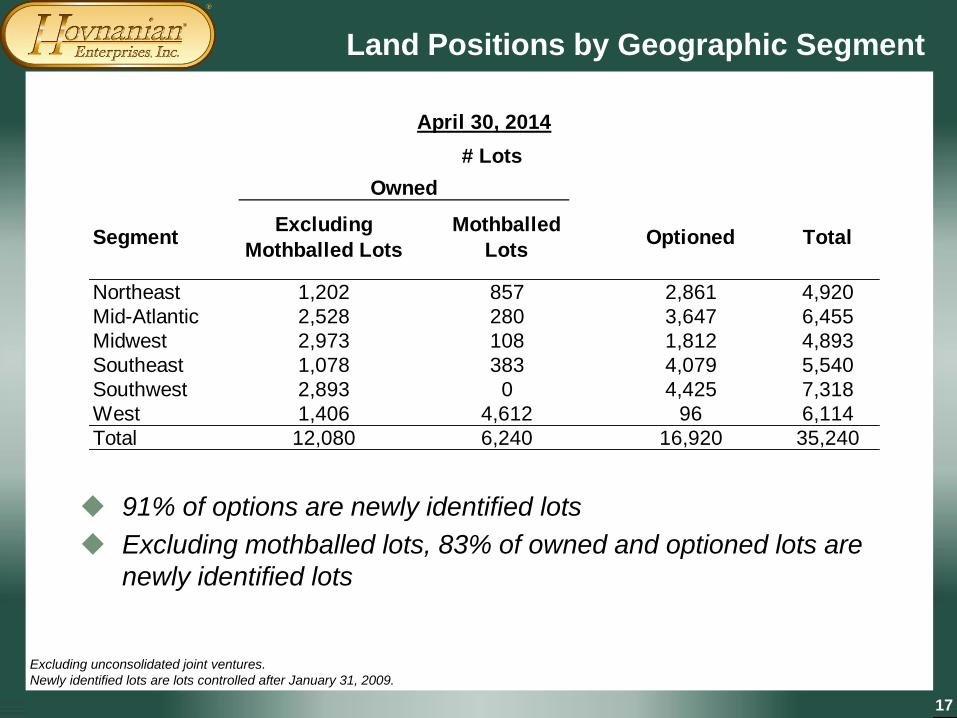
Land Positions by Geographic Segment
SegmentExcluding
Mothballed Lots
Mothballed
LotsOptioned Total
Northeast 1,202 857 2,861 4,920
Mid-Atlantic 2,528 280 3,647 6,455
Midwest 2,973 108 1,812 4,893
Southeast 1,078 383 4,079 5,540
Southwest 2,893 0 4,425 7,318
West 1,406 4,612 96 6,114
Total 12,080 6,240 16,920 35,240
Owned
# Lots
April 30, 2014
Excluding unconsolidated joint ventures.
Newly identified lots are lots controlled after January 31, 2009.
◆ 91% of options are newly identified lots
◆ Excluding mothballed lots, 83% of owned and optioned lots are
newly identified lots
17
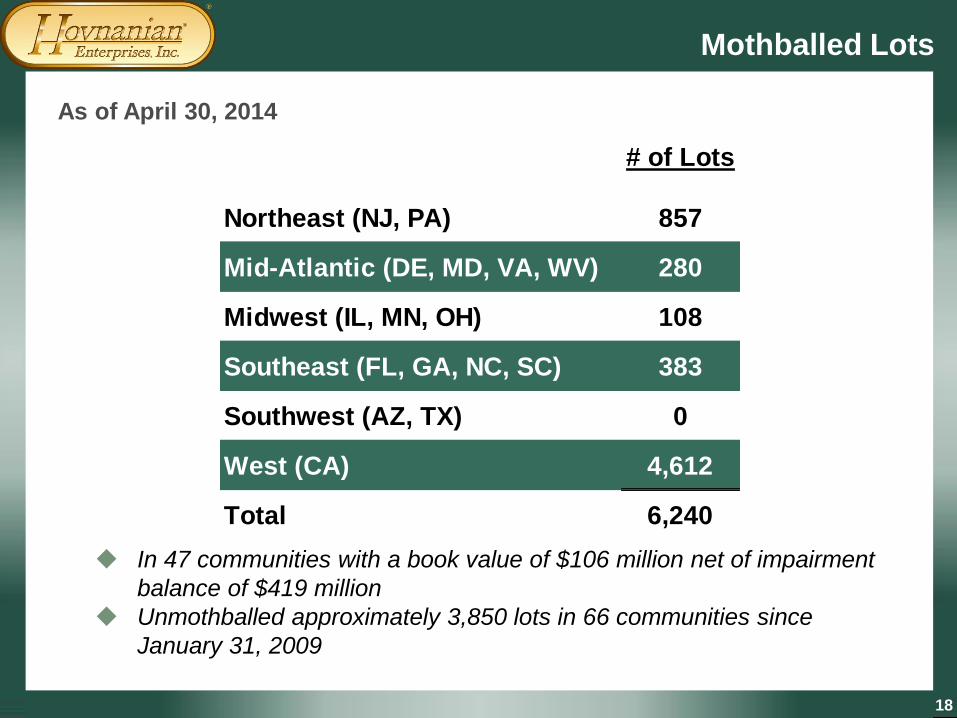
# of Lots
Northeast (NJ, PA) 857
Mid-Atlantic (DE, MD, VA, WV) 280
Midwest (IL, MN, OH) 108
Southeast (FL, GA, NC, SC) 383
Southwest (AZ, TX) 0
West (CA) 4,612
Total 6,240
Mothballed Lots
As of April 30, 2014
◆ In 47 communities with a book value of $106 million net of impairment
balance of $419 million
◆ Unmothballed approximately 3,850 lots in 66 communities since
January 31, 2009
18

04/30/2014 Adjusted 04/30/14
($463)
$473
Adjusted Hovnanian Stockholders’ Equity
$ in millions
(1) Total Hovnanian Stockholders’ Deficit of $(463) million with $936 million valuation allowance added back to Stockholders’ Equity. The $936 million
valuation allowance consisted of a $720 million federal valuation allowance and a $216 million state valuation allowance.
(1)
19

Fiscal Year 2013:
● Average LTV: 85%
● Average CLTV: 85%
● ARMs: 3.1%
● FICO Score: 746
● Capture Rate: 71%
Credit Quality of Homebuyers
*Loans originated by our wholly-owned mortgage banking subsidiary.
Second Quarter 2014:
● Average LTV: 84%
● Average CLTV: 84%
● ARMs: 5.0%
● FICO Score: 747
● Capture Rate: 64%
20

Hovnanian Mortgage Breakdown*
Prime (Full
Doc: Conforming)
62.7%
FHA
21.5%
VA
11.2%
USDA
1.6%
All Jumbo
Loans3.0%
Fiscal Year 2013
Prime (Full Doc:
Conforming)
69.6% FHA16.1%
VA11.9%
USDA0.5%
All Jumbo Loans
1.9%
Second Quarter 2014
*Loans originated by our wholly-owned mortgage banking subsidiary.
FHA Percentages
2010 2011 2012 2013
38.0% 34.1% 27.8% 21.5%
21
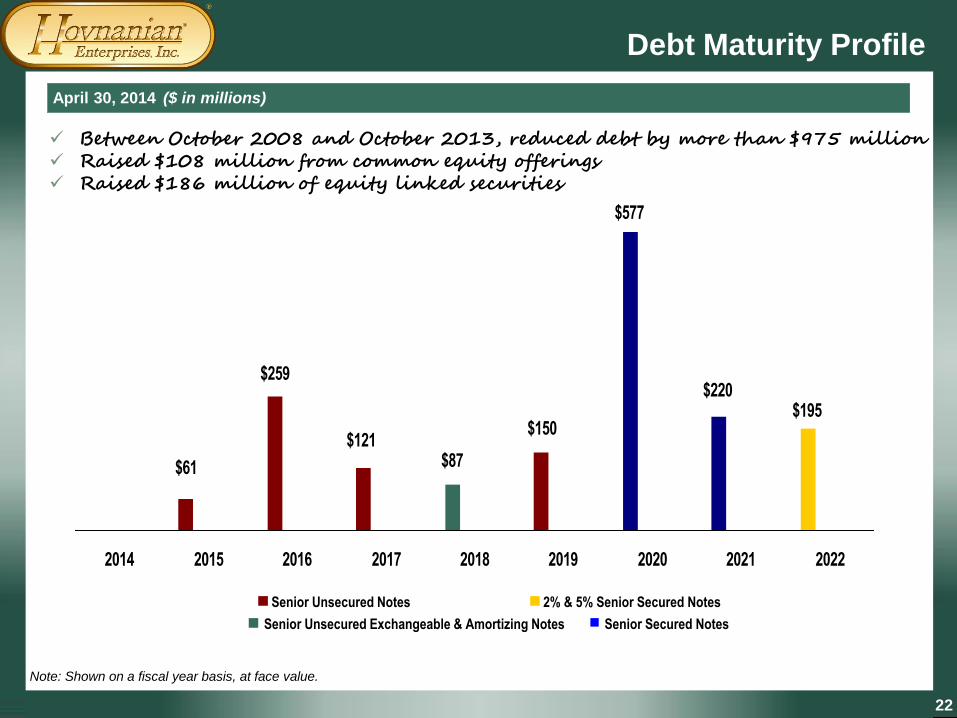
$87$121
$259
$61
$577
$150
$220$195
2014 2015 2016 2017 2018 2019 2020 2021 2022
Debt Maturity Profile
April 30, 2014 ($ in millions)
Between October 2008 and October 2013, reduced debt by more than $975 million Raised $108 million from common equity offerings Raised $186 million of equity linked securities
Senior Secured Notes
Senior Unsecured Notes 2% & 5% Senior Secured Notes
Senior Unsecured Exchangeable & Amortizing Notes
Note: Shown on a fiscal year basis, at face value.
22

LiquidityPosition01/31/13
LiquidityPosition04/30/13
LiquidityPosition07/31/13
LiquidityPosition10/31/13
LiquidityPosition01/31/14
LiquidityPosition04/30/14
$262 Homebuilding
Cash
$263 Homebuilding
Cash
$227 Homebuilding
Cash
$324Homebuilding
Cash
$288Homebuilding
Cash
$243Homebuilding
Cash
$52Revolver
Availability
$49Revolver
Availability $51Revolver
Availability $55Revolver
Availability
$279
$373
$339
$298
$262 $263
Liquidity Position and Target
We are
comfortable
operating at
the lower end
of the range
($ in Millions)
Note: Liquidity position includes homebuilding cash (which includes unrestricted cash and restricted cash to collateralize letters of credit)
and revolving credit facility availability.
$245
$170
Target Liquidity Range
23

2.1
1.1
1.4
1.71.6 1.6
20
02
20
11
20
12
20
13
TT
M
Ap
ril
20
13
TT
M
Ap
ril
20
14
Inventory turnover derived by dividing cost of sales, excluding capitalized interest, by the five quarter average homebuilding inventory, excluding
capitalized interest and inventory not owned.
Inventory Turnover
24

Appendix
25
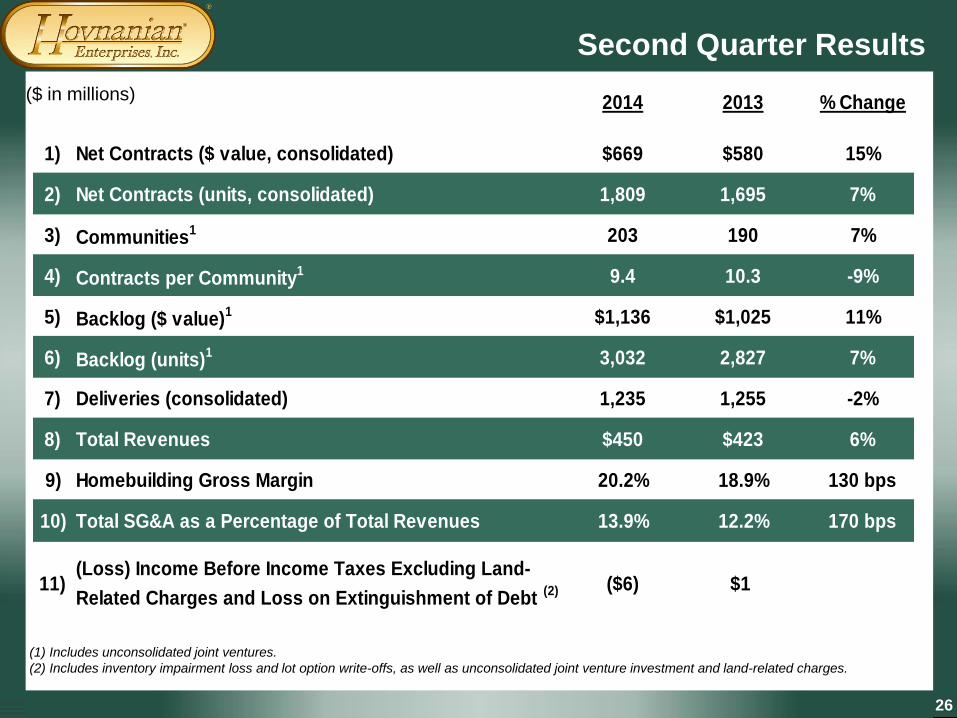
Second Quarter Results
($ in millions) 2014 2013 % Change
1) Net Contracts ($ value, consolidated) $669 $580 15%
2) Net Contracts (units, consolidated) 1,809 1,695 7%
3) Communities1 203 190 7%
4) Contracts per Community1 9.4 10.3 -9%
5) Backlog ($ value)1 $1,136 $1,025 11%
6) Backlog (units)1 3,032 2,827 7%
7) Deliveries (consolidated) 1,235 1,255 -2%
8) Total Revenues $450 $423 6%
9) Homebuilding Gross Margin 20.2% 18.9% 130 bps
10) Total SG&A as a Percentage of Total Revenues 13.9% 12.2% 170 bps
11)(Loss) Income Before Income Taxes Excluding Land-
Related Charges and Loss on Extinguishment of Debt (2) ($6) $1
(1) Includes unconsolidated joint ventures.
(2) Includes inventory impairment loss and lot option write-offs, as well as unconsolidated joint venture investment and land-related charges.
26
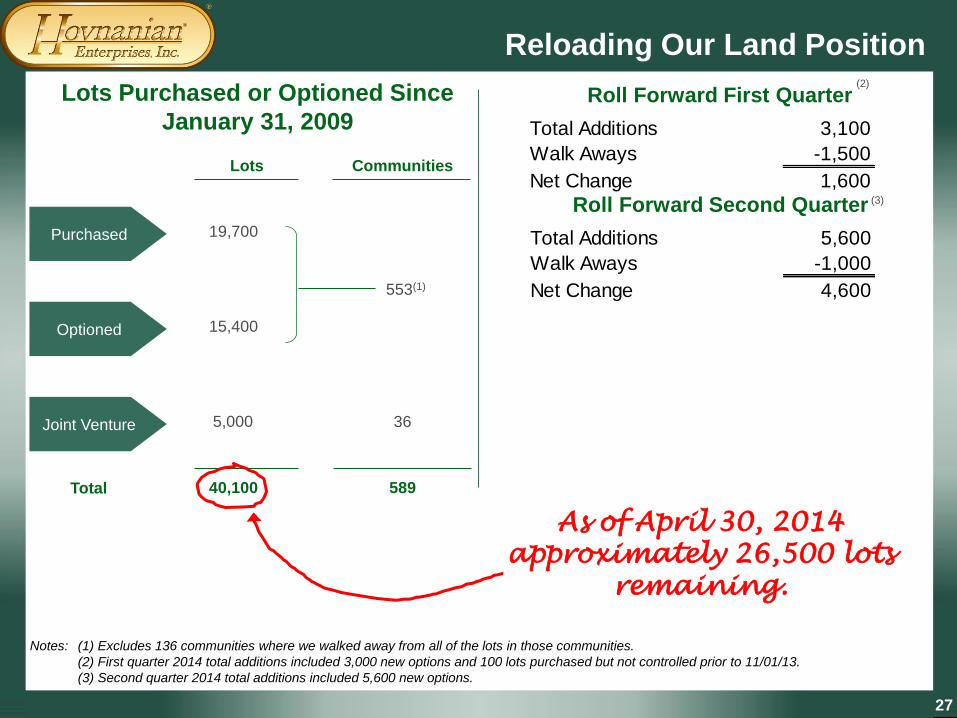
Reloading Our Land Position
Notes: (1) Excludes 136 communities where we walked away from all of the lots in those communities.
(2) First quarter 2014 total additions included 3,000 new options and 100 lots purchased but not controlled prior to 11/01/13.
(3) Second quarter 2014 total additions included 5,600 new options.
Purchased
Optioned
Joint Venture
Lots Communities
19,700
15,400
5,000
553(1)
36
40,100 589 Total
Lots Purchased or Optioned Since
January 31, 2009
As of April 30, 2014
approximately 26,500 lots
remaining.
Total Additions 3,100
Walk Aways -1,500
Net Change 1,600
Roll Forward First Quarter (2)
Total Additions 5,600
Walk Aways -1,000
Net Change 4,600
Roll Forward Second Quarter (3)
27

Land Positions by Geographic Segment
Segment
TTM
Deliveries
Excluding
Mothballed
Lots
Mothballed
Lots Optioned Total
Investment in Land (raw
land, finished lots and
lots under development)
($ in millions)
Northeast 620 1.9 1.4 4.6 7.9 $184
Mid-Atlantic 641 3.9 0.4 5.7 10.1 $106
Midwest 696 4.3 0.2 2.6 7.0 $66
Southeast 586 1.8 0.7 7.0 9.5 $48
Southwest 2,304 1.3 0.0 1.9 3.2 $154
West 373 3.8 12.4 0.3 16.4 $92
Total 5,220 2.3 1.2 3.2 6.8 $650
Years Supply
Owned
Excluding unconsolidated joint ventures.
28

0.0
3.0
6.0
9.0
Ap
r-9
8O
ct-9
8A
pr-
99
Oct
-99
Ap
r-0
0O
ct-0
0A
pr-
01
Oct
-01
Ap
r-0
2O
ct-0
2A
pr-
03
Oct
-03
Ap
r-0
4O
ct-0
4A
pr-
05
Oct
-05
Ap
r-0
6O
ct-0
6A
pr-
07
Oct
-07
Ap
r-0
8O
ct-0
8A
pr-
09
Oct
-09
Ap
r-1
0O
ct-1
0A
pr-
11
Oct
-11
Ap
r-1
2O
ct-1
2A
pr-
13
Oct
-13
Ap
r-1
4
Started Unsold Homes Models
# H
om
es /
Co
mm
un
ity
◆ 669 started unsold homes at 04/30/14, excluding models
◆ 4.7 average started unsold homes per community since 1997
◆ As of April 30, 2014, 3.4 started unsold homes per community
Unsold Homes per Community
Excluding unconsolidated joint ventures.
29
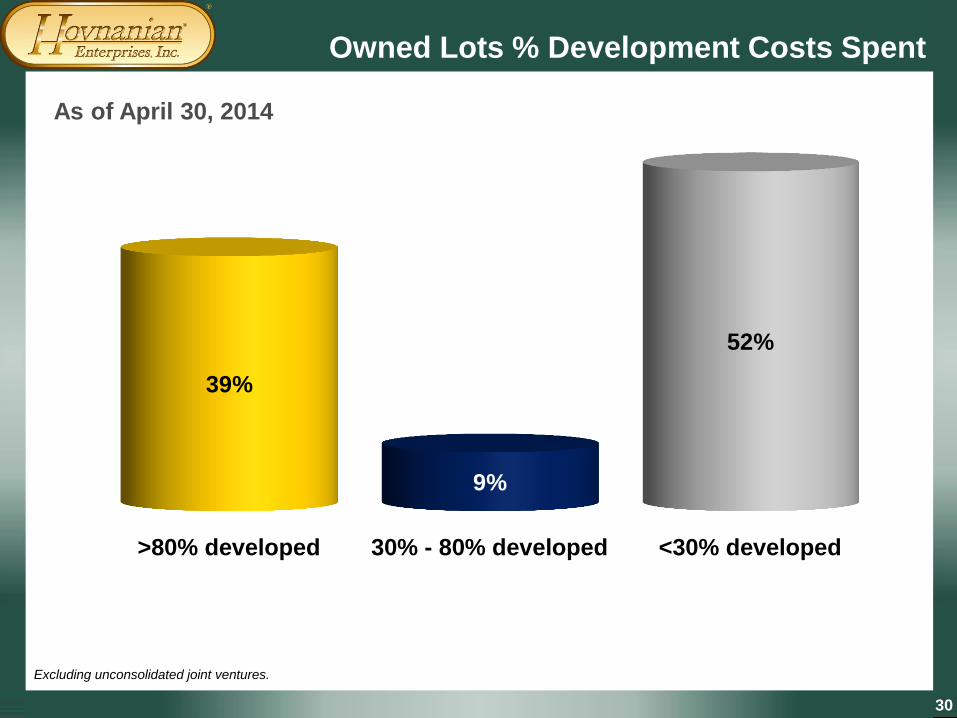
>80% developed 30% - 80% developed <30% developed
39%
9%
52%
Owned Lots % Development Costs Spent
As of April 30, 2014
Excluding unconsolidated joint ventures.
30

$1,1
34
$727
$1,0
20
$643
$776
$500
$686
$468
$559
$394
$562
$362
$586
$385
$560
$356
$521
$336
$522
$353
$561
$345
$628
$360
$576
$357
$570
$374
$503
$381
$469
$413
$464
$370
$495
$369
$447
$418
$504
$436
$555
$338
$645
$379
$650
$450
Oct-
08
Jan-0
9
Apr-
09
Jul-09
Oct-
09
Jan-1
0
Apr-
10
Jul-10
Oct-
10
Jan-1
1
Apr-
11
Jul-11
Oct-
11
Jan-1
2
Apr-
12
Jul-12
Oct-
12
Jan-1
3
Apr-
13
Jul-13
Oct-
13
Jan-1
4
Apr-
14
Sold and Unsold homes (including land, land development and WIP)
Land (raw land, finished lots and land under development)
Inventory Breakdown
$ in Millions
Excluding Inventory Not Owned, on-your-lot construction, assets outside the US and option deposits and pre-development costs.
31

$2.6
$1.6$1.5
$1.0
$1.6
$0.7
$0.2
FY 2008 FY 2009 FY 2010 FY 2011 FY 2012 FY 2013 YTD 2014
Payments for Loan Repurchases
and Make Whole Requests
$ in millions
17 loans 28 loans 28 loans
Note: All of these losses had been adequately reserved for in prior periods.
◆ As of April 30, 2014, reserve for loan repurchases and make whole requests was $11.1 million.
18 loans 29 loans
As of April 30, 2014
Settlements
98 loans 41 loans 45 loans 58 loans 39 loans Repurchase
Inquires
10 loans
66 loans
13 of 18 loans were
small second lien
repurchases.
5 loans
16 loans
32

33