Embed Size (px)
Citation preview

1 6/10/2014
Housing Supply and Policy
Albert Saiz
Massachusetts Institute of Technology
Center for Real Estate and Department of Urban Studies and Planning

2
The Key Role of Housing Supply
• Housing supply examines the cost and competitive environment at which housing is produced and sold
• The value of a house in the market is equal to
=
• land value + cost of construction – physical depreciation – functional obsolescence
• Policies have an impact on all of these!

3
Housing Supply and Demand for a Metropolitan Area
Home
Value
(P)
# of Households (Q)
Residential Demand for the
Metro
Housing Supply
P*
Q*
4
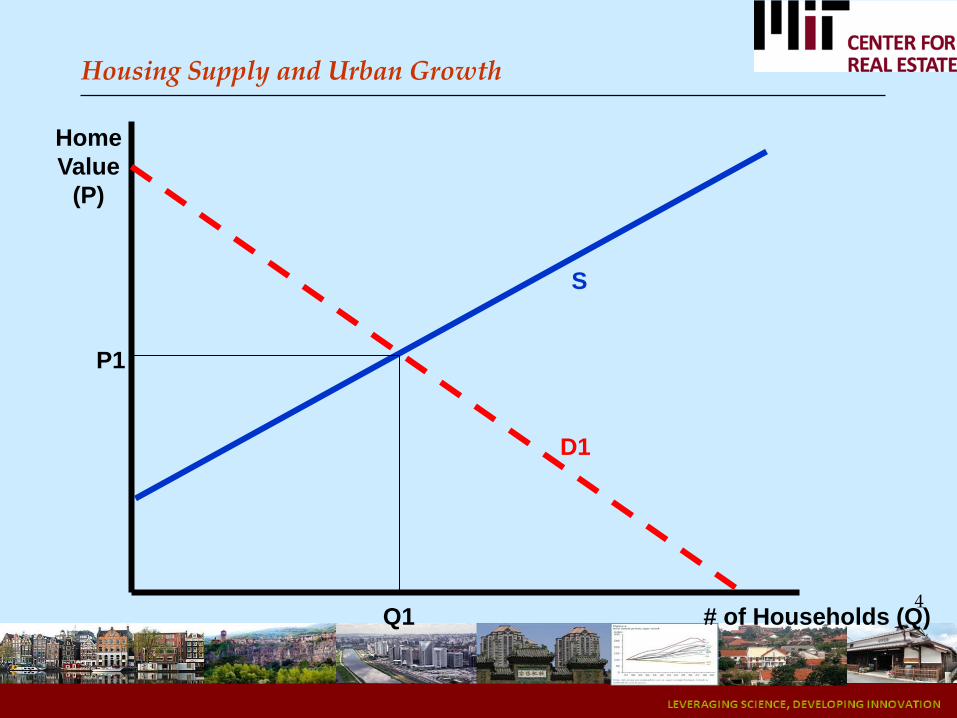
Housing Supply and Urban Growth
Home
Value
(P)
# of Households (Q)
D1
S
P1
Q1

5
Housing Supply and Urban Growth: Elastic Supply
Home
Value
(P)
# of Households (Q)
D1
S
P1
Q1
D2
P2
Q2
6
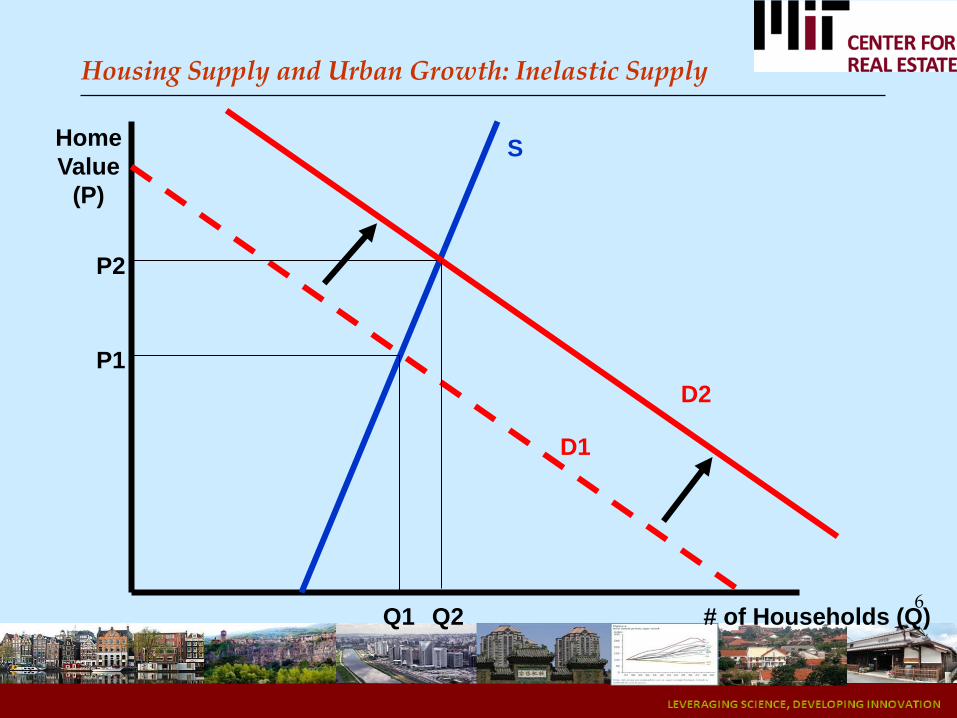
Housing Supply and Urban Growth: Inelastic Supply
Home
Value
(P)
# of Households (Q)
D1
S
P1
Q1
D2
P2
Q2

7
Housing Supply Issues
• Construction costs
Supply extremely elastic: but effect to levels!
Differences across cities
• Supply or renovations/additions
Sensitive to construction costs
• Supply of rental properties
Sensitive to legal environment
• Geography and Land
• Land Use Policy for new Development
Wharton Residential Land Regulatory Index: US

8
Housing Supply and Demand for a City
Home
Value
(P)
# of Households (Q)
Housing Supply with
expensive construction
Housing Supply with
Cheaper construction
Residential Demand for the City
Construction
Cost 2
Construction
Cost 1

9
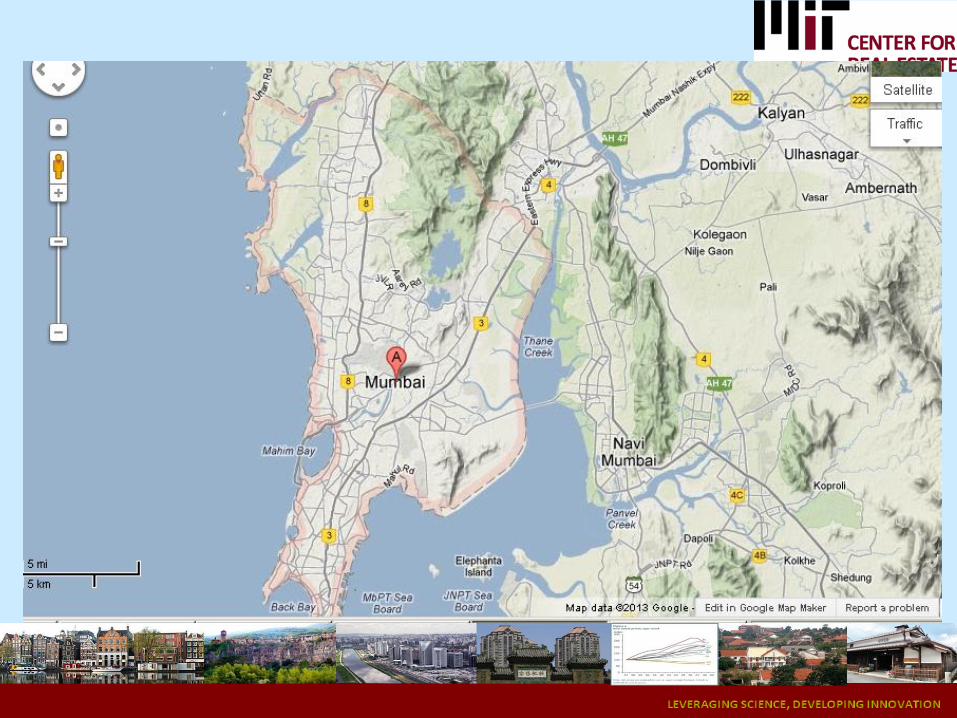
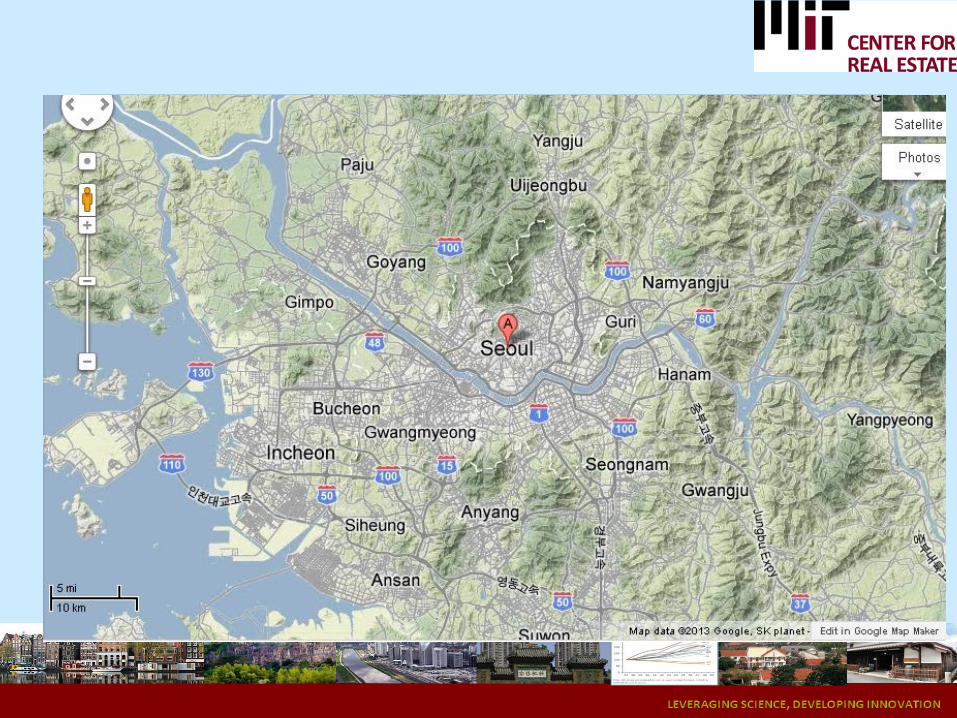
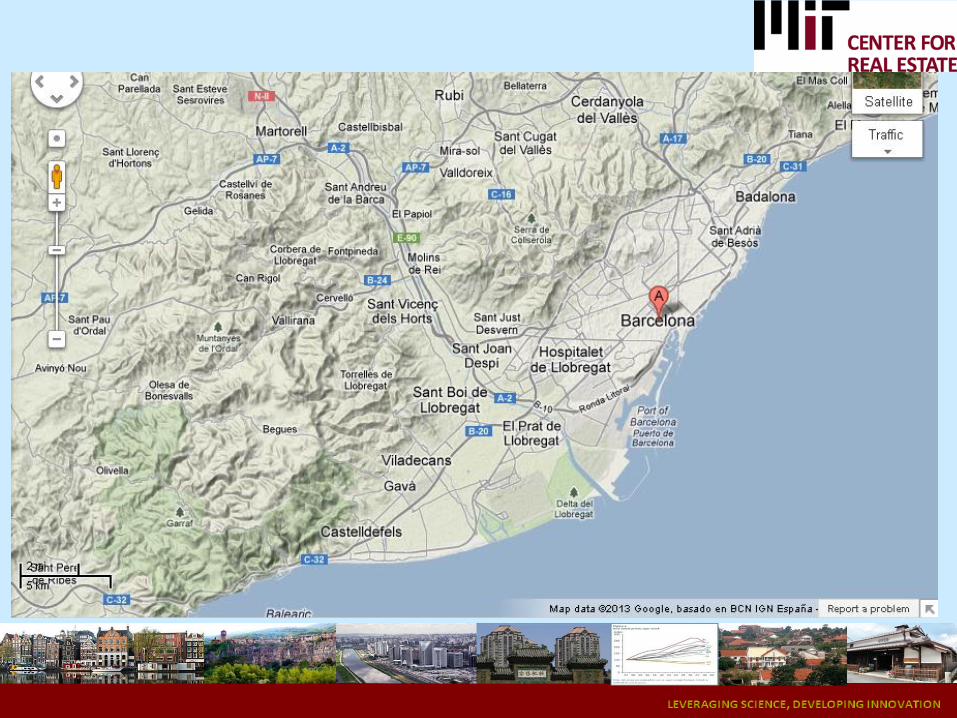
Construction costs: a global perspective
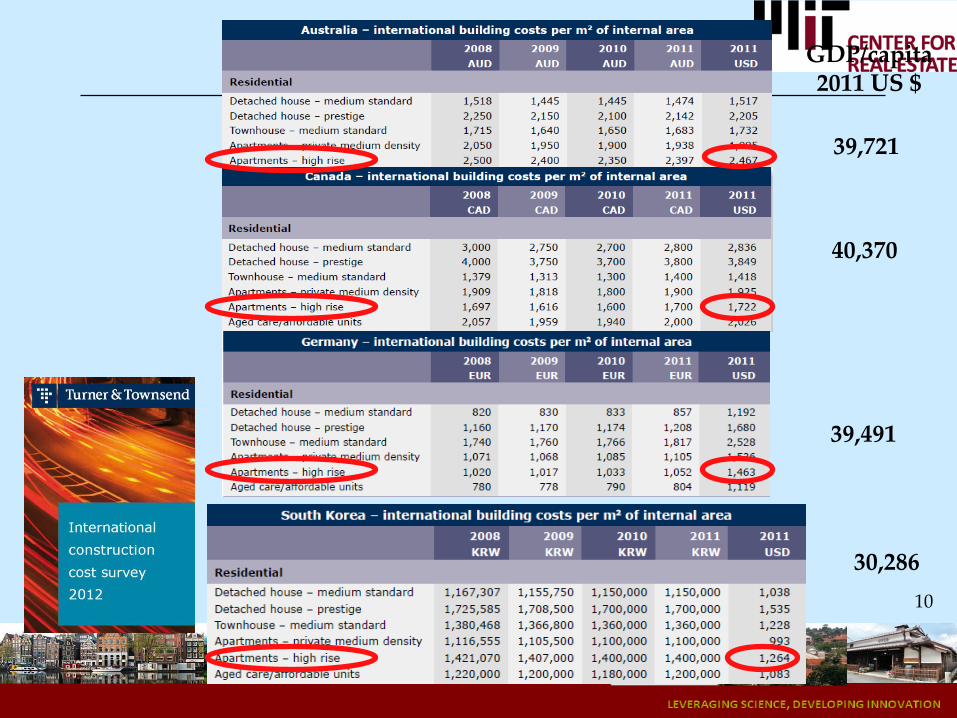
10
39,721
GDP/capita 2011 US $
40,370
39,491
30,286
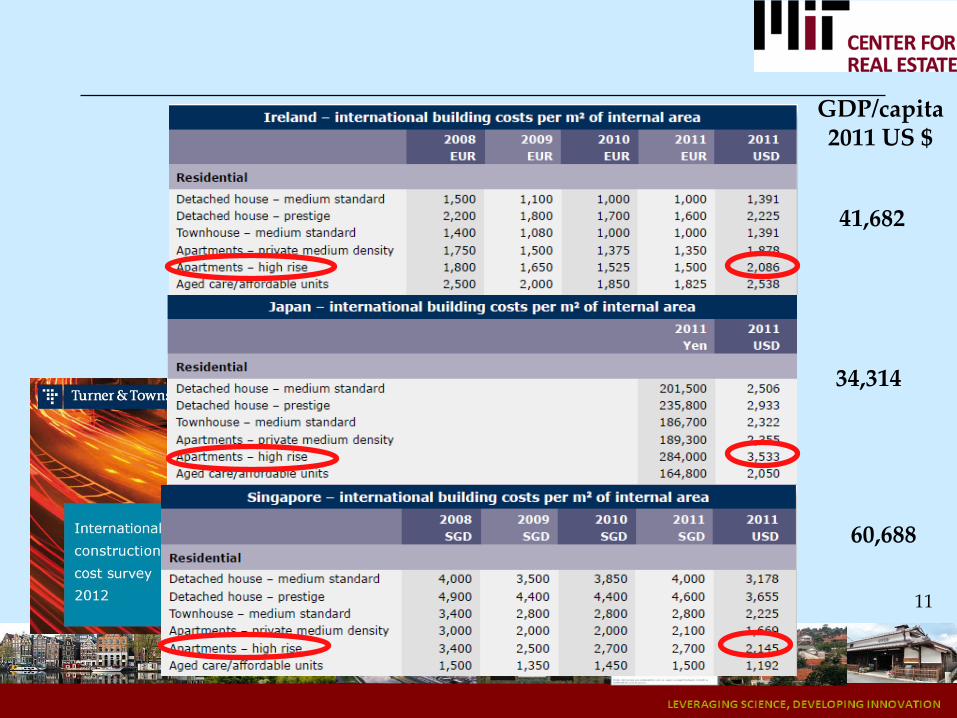
11
41,682
34,314
GDP/capita 2011 US $
60,688
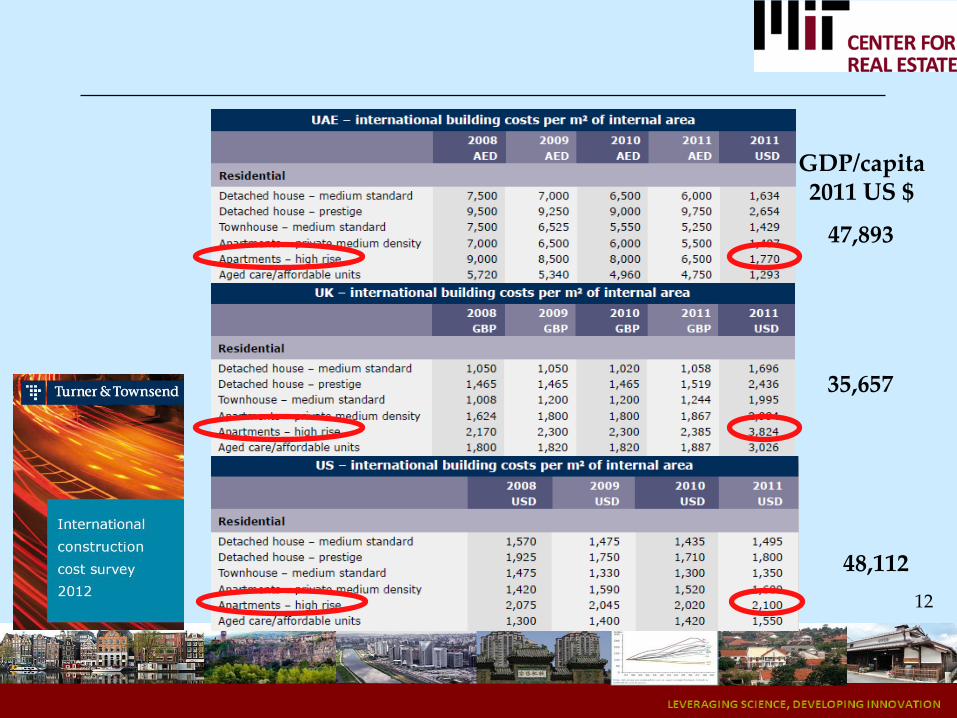
12
47,893
35,657
48,112
GDP/capita 2011 US $

13
Determinants of Construction Costs
• Technology
• Wages
• Competition in Construction and Inputs (Cement, Electricity)
• Efficiency in Practices (Unions)
• Efficiency in the Enforcement of Building Codes
• Efficiency of Governments in Moving forward Projects that Comply with Codes and Zoning
14
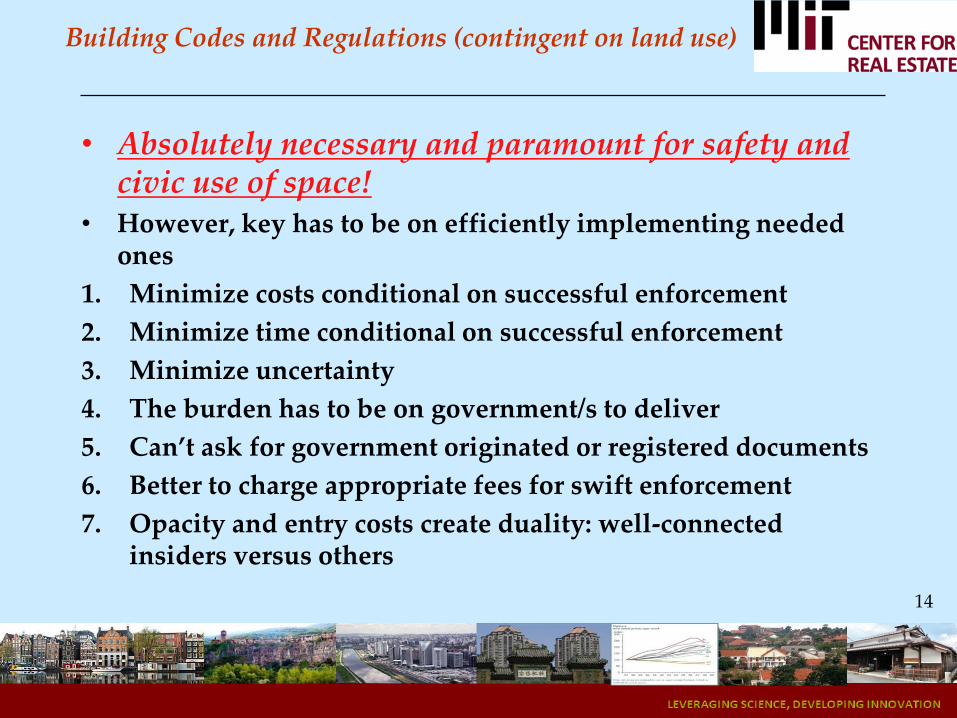
Building Codes and Regulations (contingent on land use)
• Absolutely necessary and paramount for safety and civic use of space!
• However, key has to be on efficiently implementing needed ones
1. Minimize costs conditional on successful enforcement
2. Minimize time conditional on successful enforcement
3. Minimize uncertainty
4. The burden has to be on government/s to deliver
5. Can’t ask for government originated or registered documents
6. Better to charge appropriate fees for swift enforcement
7. Opacity and entry costs create duality: well-connected insiders versus others

15
Empirically, places where new construction burdens tend to be higher tend also to be places where actual enforcement of safety, etc… is extremely poor!
16
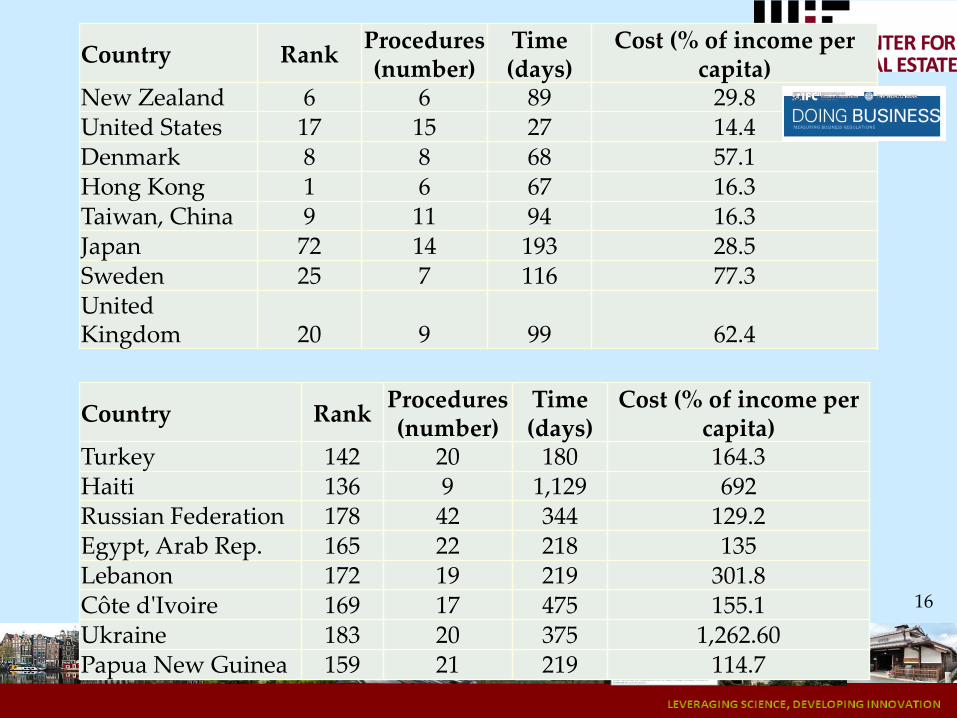
Country Rank Procedures (number)
Time (days)
Cost (% of income per capita)
New Zealand 6 6 89 29.8 United States 17 15 27 14.4 Denmark 8 8 68 57.1 Hong Kong 1 6 67 16.3 Taiwan, China 9 11 94 16.3 Japan 72 14 193 28.5 Sweden 25 7 116 77.3 United Kingdom 20 9 99 62.4
Country Rank Procedures (number)
Time (days)
Cost (% of income per capita)
Turkey 142 20 180 164.3 Haiti 136 9 1,129 692 Russian Federation 178 42 344 129.2 Egypt, Arab Rep. 165 22 218 135 Lebanon 172 19 219 301.8 Côte d'Ivoire 169 17 475 155.1 Ukraine 183 20 375 1,262.60 Papua New Guinea 159 21 219 114.7

17
Country Rank Procedures (number)
Time (days)
Cost (% of income per capita)
India 182 34 196 1,528.00 Indonesia 75 13 158 95 Iran, Islamic Rep. 166 16 320 262.3 Iraq 84 12 187 109.8 Ireland 106 12 156 626.1
18
LAND SUPPLY
• There is a large amount of land…
• … however limited amount of land in desirable locations
• Access to jobs
• Access to amenities
• Public service: schools
• Relative scarcity of desirable land has an effect on the slope of housing supply
• The higher the demand for housing in a city the more “marginal” or “further away” plots have to be developed
• That pushes up implicit land values in good locations

19
20
21
22
23
24

25
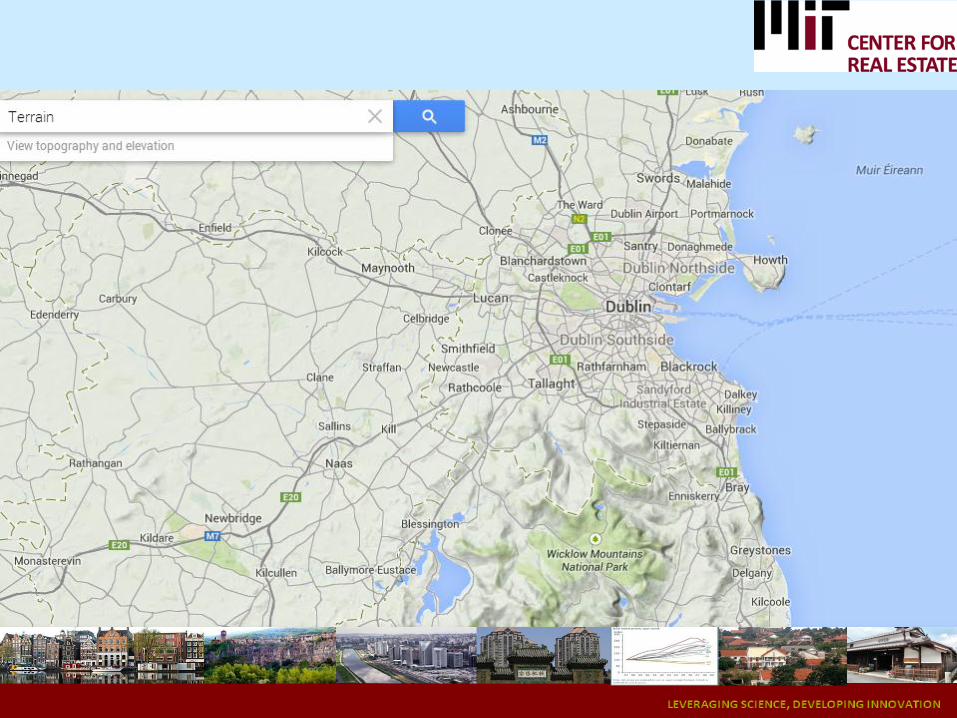
Van de Voorde, T., van der Kwast, J., Engelen, G., Binard, M., Cornet, Y. and Canters, F. (2009).
Quantifying intra-urban morphology of the Greater Dublin area with spatial metrics derived
from medium resolution remote sensing data, IEEE Proceedings of the 7th international Urban
Remote Sensing conference (URS 2009), May 20-22, 2009, Shanghai, PRC
Dublin (Ireland)
26
Wharton Residential Land Regulatory Index
• We measured political opposition, procedural, and time delays to new development projects
• Include steps prior to construction: rezoning, variances, and approval of development characteristics according to plan and zoning board
• In general, clear patterns arise: pro-development and anti-development communities in a quantitative sense
• Not In My Backyard (NIMBY) dynamics
• Note that we do not pass judgment on quality of local planning activity
• Good planning is good!
27
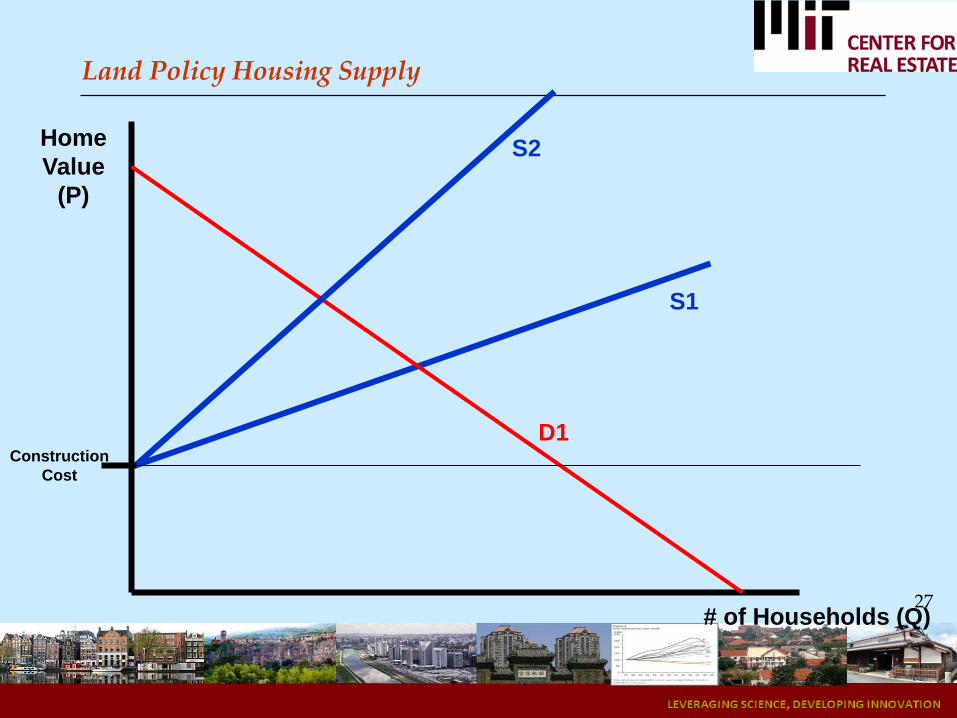
Land Policy Housing Supply
Home
Value
(P)
# of Households (Q)
D1
S1
S2
Construction
Cost
28
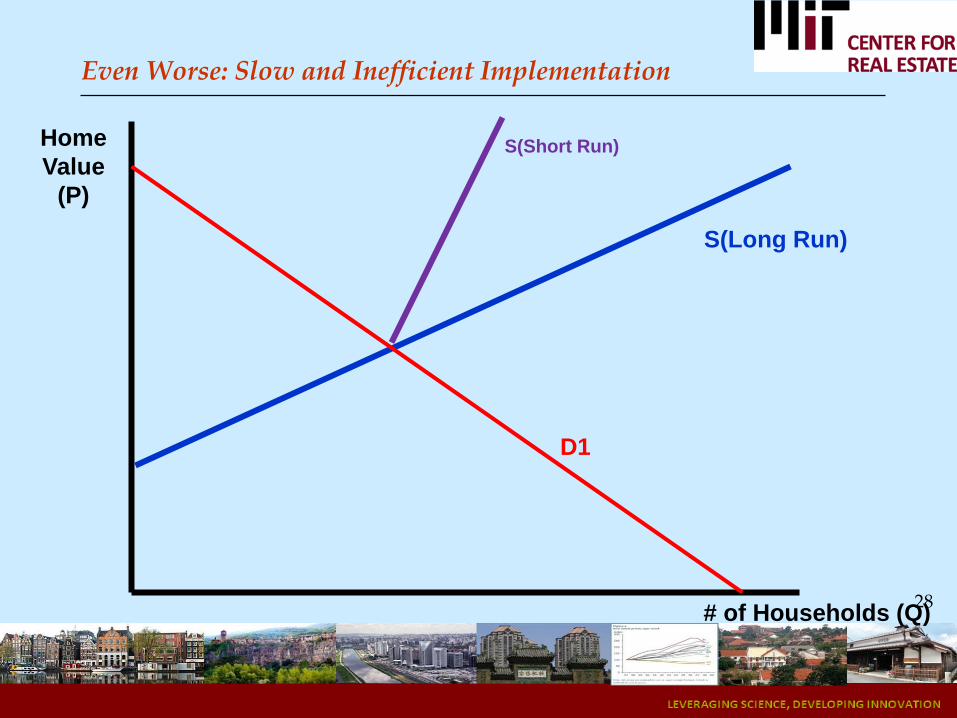
Even Worse: Slow and Inefficient Implementation
Home
Value
(P)
D1
S(Long Run)
# of Households (Q)
S(Short Run)

29
Even Worse: Slow and Inefficient Implementation Creates Boom-Bust
Value
(P)
D1
S(Long Run)
# of Households (Q)
S(Short Run)
D2
P1
P2
30
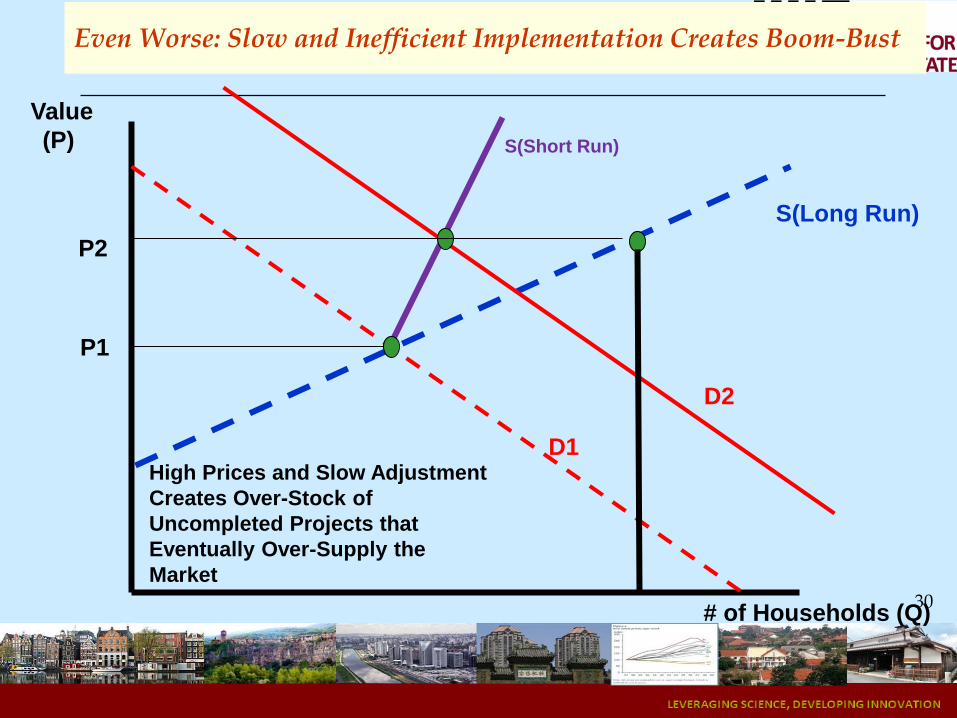
Even Worse: Slow and Inefficient Implementation Creates Boom-Bust
Value
(P)
D1
S(Long Run)
# of Households (Q)
S(Short Run)
D2
P1
P2
High Prices and Slow Adjustment
Creates Over-Stock of
Uncompleted Projects that
Eventually Over-Supply the
Market
31
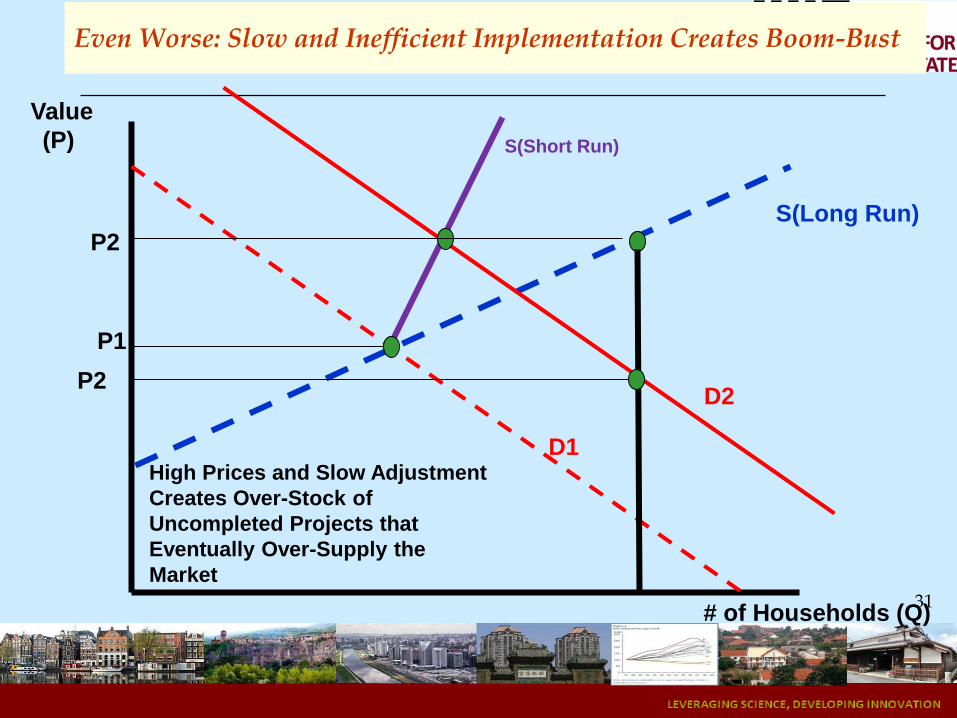
Even Worse: Slow and Inefficient Implementation Creates Boom-Bust
Value
(P)
D1
S(Long Run)
# of Households (Q)
S(Short Run)
D2
P1
P2
High Prices and Slow Adjustment
Creates Over-Stock of
Uncompleted Projects that
Eventually Over-Supply the
Market
P2

32
Supply is Kinked Due to Durable Housing
Long Run Supply
Demand 0
Construction cost
Homes
Housing prices
Demand 1
P*

33
Overbuilding is Worse in Areas where Supply was Abundant and Land was Cheap
Value
(P)
D1
S(Long Run)
# of Households (Q)
S(Short Run)
D2
Construction
Cost
Over-building

34
Policy Prescriptions
• Focus on zoning and entitlement of land for future: cannot forecast or time the future!
• Plan: land banks and expansion for the next 25 years
• Plan: pro-development path
• Allow for higher densities in desirable locations
• Facilitate land assembly via “land trusts”
• Facilitate swifter changes to high-and-best use
• Stop speculation by having a readily-available portfolio of plots ready for development under clear specifications
• This can include public land-banking!
• Make entitlement process extremely transparent: database
• Speed up intensive use of land by using value capture instruments
• Align incentives of local authorities /public and development
• Make process more transparent
• Make process more progressive
35
AFTERTHOUGHT
• POLICIES GEARED TO INCREASING SUPPLY ARE A GOOD IDEAS REGARDLESS OF THE LOCATION AND MARKET SEGMENT THEY TARGET
• SOMETIMES THERE IS POLITICAL OPPOSITION TO PROJECTS THAT TARGET UPPER AND MIDDLE-UPPER SEGMENTS
• HOWEVER NEW DENSER DEVELOPMENTS IN MORE CENTRAL AREAS –TYPPICALLY QUITE EXPENSIVE- RELIEF PRESSURE ON OTHER SEGMENTS

36
Price Levels Across Neighborhoods in Dublin Metro

37
Price Levels Across Neighborhoods in Dublin Metro
38
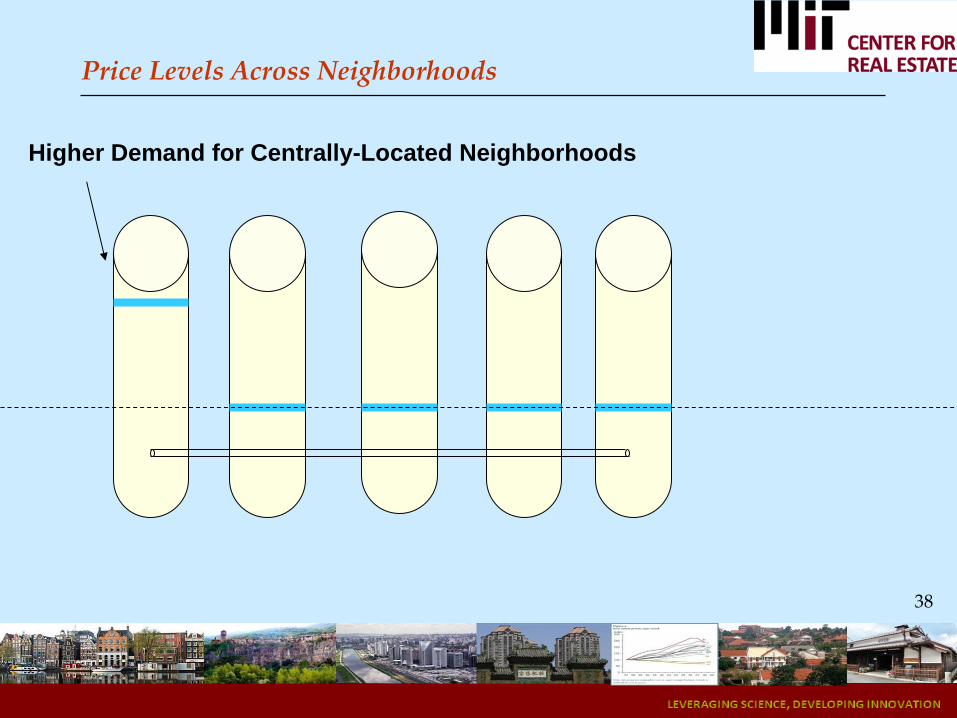
Higher Demand for Centrally-Located Neighborhoods
Price Levels Across Neighborhoods

39
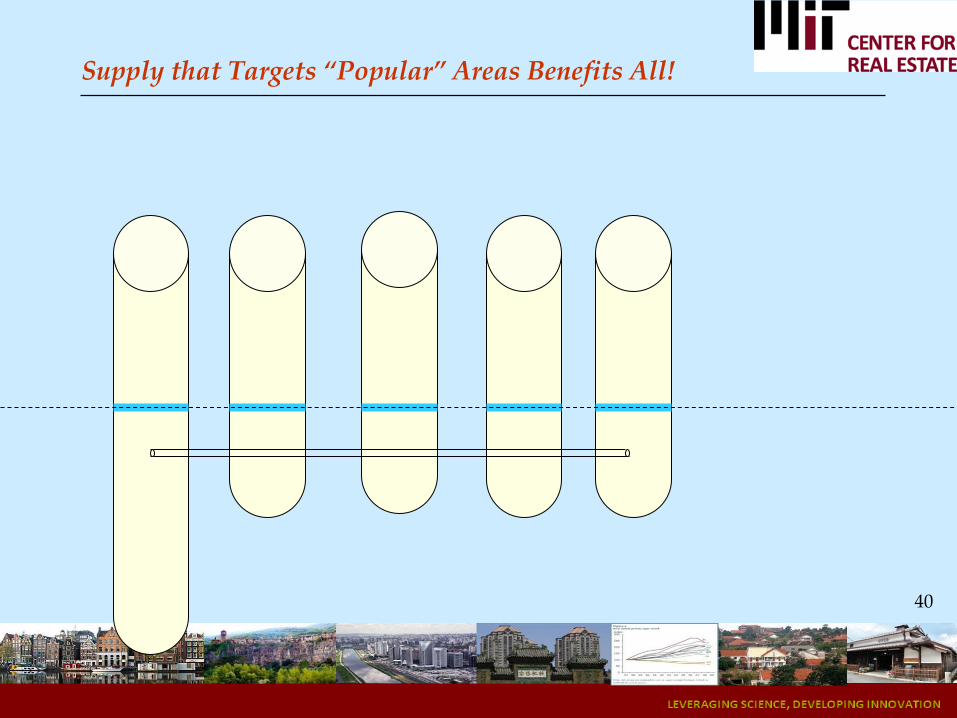
With no Extra Supply: Pressure will Communicate Throughout Urban System
40
Supply that Targets “Popular” Areas Benefits All!
41
THANK YOU!