Embed Size (px)
Citation preview

Final Report
Housing Market Study
Prepared for:
City of Oklahoma City
Prepared by:
Economic & Planning Systems, Inc.
EPS #193045
October 11, 2021

Table of Contents
Executive Summary .......................................................................................... 1
Housing and Neighborhood Features .................................................................... 7
Housing Density Analysis ................................................................................. 31
Housing Plans and Preferences ......................................................................... 33

List of Tables
Table 1. Average Density of Housing Units over Time ..................................................... 32
Table 2. Average Density by Housing Type and Subarea ................................................. 32
Table 3. Top Housing Choices by Resident Current Housing Type, 2013 ............................ 34
Table 4. Top Housing Choices by Resident Current Housing Type, 2020 ............................ 35
Table 5. First Choice for Where Residents Would Like to Live, 2020 .................................. 39
List of Figures
Figure 1. Importance Rank ............................................................................................ 7
Figure 2. Importance by Subarea Types .......................................................................... 9
Figure 3. Importance of Housing & Neighborhood Features by Age Category ....................... 10
Figure 4. Importance of Housing & Neighborhood Features, 2013 and 2020 ........................ 11
Figure 5. Satisfaction Rank .......................................................................................... 12
Figure 6. Satisfaction by Context .................................................................................. 13
Figure 7. Satisfaction with Housing and Neighborhood Features by Age Category ................ 14
Figure 8. Satisfaction with Housing & Neighborhood Features, 2013 and 2020 .................... 15
Figure 9. Overall Satisfaction vs. Importance ................................................................. 16
Figure 10. Satisfaction vs. Importance in Rural Subareas ................................................... 17
Figure 11. Satisfaction vs. Importance in Suburban Subareas ............................................. 18
Figure 12. Satisfaction vs. Importance in Urban Subareas .................................................. 19
Figure 13. Comparison of Satisfaction and Importance Scores, 2013 and 2020 ..................... 20
Figure 14. New Residential Units by Subarea, 2010-2020 .................................................. 21
Figure 15. School Proximity and New Housing Construction ................................................ 22
Figure 16. Housing in Proximity to Schools ...................................................................... 23
Figure 17. Transit Proximity and New Housing Construction ............................................... 24
Figure 18. Housing in Proximity to Transit ....................................................................... 25
Figure 19. Restaurant Proximity and New Housing Construction .......................................... 26

List of Figures (continued)
Figure 20. Housing in Proximity to Restaurants ................................................................ 27
Figure 21. Grocery Proximity and New Housing Construction .............................................. 28
Figure 22. Housing in Proximity to Grocery Stores ............................................................ 29
Figure 23. Change in Preferred Future Housing Choices, 2013 and 2020 .............................. 36
Figure 24. Recent Development vs. Preferred Housing Types .............................................. 37
Figure 25. Subarea Preferences, 2013 and 2020 ............................................................... 38
Figure 26. Plans to Move in Next 1 to 5 Years by Tenure, 2013 ........................................... 40
Figure 27. Plans to Move in Next 1 to 5 Years by Tenure, 2020 ........................................... 40
Figure 28. Plans to Move in Next 1 to 5 Years by Age, 2013 ............................................... 41
Figure 29. Plans to Move in Next 1 to 5 Years by Age, 2020 ............................................... 41
Figure 30. Where Likely to Move in Next 1 to 5 Years by Tenure, 2013 ................................ 42
Figure 31. Where Likely to Move in Next 1 to 5 Years by Tenure, 2020 ................................ 42
Figure 32. Where Likely to Move in Next 1 to 5 Years by Age, 2013 ..................................... 43
Figure 33. Where Likely to Move in Next 1 to 5 Years by Age, 2020 ..................................... 43
Economic & Planning Systems, Inc.
193045-Housing Market Study Final Report_10-11-21 1
Executive Summary
Introduction
This Housing Market Study (HMS) updates the central outputs of the Housing Market Preference and Demand Study dated December 31, 2013. The purpose of the 2013 study was to provide the City Planning Department with a better understanding of the demand and housing choice preferences within the city’s municipal boundaries. Like the 2013 study, this HMS is intended give the City Planning Department an understanding of the extent that these demand and housing choice preferences have shifted over time. Reflecting as well on the policy direction and achievements of planokc, the HMS is also intended to inform and guide decisions on land use, infrastructure investments, and code change decisions.
Objectives
As many of America’s cities evolve and adapt to both demographic and cultural change, there is growing interest in understanding whether large urban-suburban housing environments, like Oklahoma City, built to satisfy automobile-centric desires, will accommodate shifts in demand characteristics. To address questions related to this situation, this update explores the quantitative and qualitative elements of housing demand in the context of the city’s housing market, neighborhood characteristics, and development patterns. The findings of this report are intended to:
• Supplement findings of the Housing Affordability Study (HAS) 1 by illuminating how household preferences have changed around product diversity, neighborhood characteristics, and proximity to services.
• Guide neighborhood infrastructure improvement decisions by identifying where and to what extent there is opportunity to better align neighborhood amenity infrastructure investment decisions with household preferences.
• Improve market alignment regarding how the City engages with the development community on residential and mixed-use land use development – design, product types, locations, and neighborhood features.
1 Housing Affordability Study dated August 10, 2021.

Oklahoma City Housing Market Study
2
To accomplish these objectives, patterns of housing market development in the city are examined in the context of resident responses to a statistically-valid random sample survey fielded at the beginning of 2020 (discussed below) regarding housing demand preferences, housing and neighborhood satisfaction levels, and plans for the future, among other issues. The main questions guiding the approach to this report are:
• What is important to residents in choosing where to live? • How satisfied are people with their housing and neighborhoods? • Are there differences in how renters and owners choose housing? • Are there ways in which different age groups make these decisions? • Have preferences changed since these and related questions were fielded in
advance of planokc? • Has the market responded to these preferences?
Approach
This work was completed simultaneous to the completion of the HAS, utilizing the qualitative and quantitative analysis and research to draw market-oriented conclusions. In addition to the analytical approach described below, the report also leveraged the qualitative and open-ended feedback from residents through focus groups and the community-wide survey. Core elements that informed the findings of this work are:
• A Community Survey was fielded through direct mailings and an open weblink, which yielded a 15 percent response rate representing approximately 6,000 residents. The survey was fielded between December 2019 and February 2020.
• A Proximity Analysis was completed against current and new housing inventory data using county assessor parcel data and building permit data. The analysis was used to identify the portion of existing and new housing that is built and has been recently built within a half-mile of schools, restaurants, transit, and grocery stores.
• Comparisons with 2013 Study2 Survey Findings were used to identify how preferences, satisfaction levels, and plans for the future have shifted over time. These comparisons are helpful for indirectly assessing the effectiveness of infrastructure and neighborhood-level investments since planokc was adopted in 2015.
2 Housing Market Preference and Demand Study dated December 31, 2013.

Economic & Planning Systems, Inc.
193045-Housing Market Study Final Report_10-11-21 3
Key Conclusions
In general, the findings of the HMS reaffirm the guiding philosophy of the HAS recommendations – that a one-size-fits-all approach will not meet the housing demand, preferences, and needs of the city’s residents. Rather, that neighborhood investment, new residential development, and regulatory framework that is context-sensitive (distinguishing urban, suburban, and rural housing approaches) will best address resident demand and preferences. The following are specific findings of the HMS as they relate to the components of the research and analysis.
1. The 3 most important considerations to residents in choosing where to live are: 1) sense of safety/security, 2) price, and 3) construction quality/ appearance.
The analysis of housing and neighborhood features that are most important to residents reveals consistency among resident responses in 2013 and 2020. Residents continue to be very safety-/security-, price-, and quality-conscious. Preferences also appear to be distinguishable on the basis of where a resident lives more so than the age of the resident. For example, urban-dwellers prioritize amenity-drive lifestyles. Suburban-dwellers prioritize family and work orientations, and rural-dwellers prioritize safety, lot size, and schools. And while there is general consistency of resident responses since planokc, construction quality/appearance, privacy, and home size appear to have become slightly more important over time.
2. The 3 aspects of their current housing residents are most satisfied with are: 1) home size, 2) lot size, and 3) proximity to dining.
As noted above, the findings illuminate that the most significant distinctions between resident housing preferences exists on the basis of where people live. What residents are satisfied with, however, seems to vary more significantly by how old they are. That is, the findings suggest that older age cohorts are more satisfied with their housing and neighborhood characteristics than they younger age cohorts. One possible explanation for this is that as people age, they generally have access to more financial resources, which enables them in part to meet their own housing needs more substantially.
3. Oklahoma City has made progress since planokc on responding to resident housing preferences.
The findings of the analysis affirm the progress Oklahoma City has made since planokc toward improving and investing in neighborhoods and housing infrastructure. For example, when comparing the importance and satisfaction scores from the 2013 and 2020 HMS surveys, there are notable improvements in proximity to parks, open space, trails, as well as transit. This suggests that as the city continues to respond to resident needs through gathering information on what is important, the more it may achieve resident housing satisfaction.

Oklahoma City Housing Market Study
4
4. The “market” could be doing a better job of meeting resident needs.
There is always room for improvement, though. As in the HAS, the term “market” refers to the broad context of housing producers, suppliers, and the regulatory framework of development policies, programs, and procedures. Although the analysis of importance and satisfaction scores reveals positive outcomes, it and other analyses indicate that much more can be done to orient the market to meeting resident demands and preferences. As such, this HMS examined how well the market has provided housing in alignment with resident preferences over the past ten years from the following perspectives – density, product diversity, location, and proximity to services, as discussed in the following paragraphs.
5. The market could respond to resident demand and preferences better through tailored density and housing product diversity.
Due largely to the predominance of apartment construction over the past 10 years, the overall density of product appears to have increased slightly, reversing a decades-old trajectory of lower and lower product density over time. When viewed from the lens of single-family product, however, the trend of lower densities and thus greater land consumption has continued. That is, the majority of new residential product over the past 10 years has been single-family. Yet findings from the 2013 and 2020 surveys suggest a slightly greater interest in small-lot single-family and even townhomes, duplexes, and condominiums than the market appears to be providing.
6. The market could better target new product development by location, ensuring proximity to services meets the demand and preferences of residents.
Also as noted in the HAS, the majority of new development has occurred in the peripheral parts of the city, whereas the HMS findings suggest that locational preferences appear more diverse. In 2013, the HMS Survey found considerable interest in moving toward the peripheral parts of the city. The 2020 HMS Survey found that residents appear more interested in close-in locations than they were in the 2013 HMS Survey. This aligns with the analysis of housing in proximity to services and the analysis of resident preferences for living in close proximity to them. For example, there appears to be an opportunity for the market to better meet the needs of rural residents by ensuring proximity to dining, parks, and trails. Among suburban residents, there is an opportunity for the market to better meet their needs by ensuring ADA accessibility, neighborhood character, quality public schools, and proximity to trails, for example. Among urban residents, there is an opportunity for the market to ensure proximity to grocery, provide affordable housing options, quality public schools, and availability to bike lanes (efforts of which are underway).
Economic & Planning Systems, Inc.
193045-Housing Market Study Final Report_10-11-21 5
While the HMS findings affirm the City’s progress, the findings illustrate (as they do in the HAS) that the market continues to build the product type with which it is most comfortable. Although the market has been providing a product type in locations that do align with a large portion of resident housing demands and preferences, the product the market has been providing does not align with all resident housing demands and preferences.
In general, the HMS findings point toward opportunities for Oklahoma City to improve the market’s response to resident housing demands and preferences. The findings point toward solutions that are context-sensitive in which placemaking – through neighborhood investment, residential development, and regulatory improvements, is aligned with the housing elements that are important to residents who live in urban, suburban, and rural contexts.
Echoing the research in the HAS, the City’s regulatory context, zoning code, and development processes also play a significant role in the diversity of product that gets built. From this perspective, these HMS findings add weight and grounding to the HAS recommendations regarding modifications to zoning code in targeted areas, incentives for product diversity, access to capital for smaller-scale developers that are often more focused on delivering greater product diversity, and especially at facilitating infill development in targeted areas.

THIS PAGE INTENTIONALLY LEFT BLANK

Economic & Planning Systems, Inc.
193045-Housing Market Study Final Report_10-11-21 7
Housing and Neighborhood Features
This chapter of the report explores resident stated preferences regarding elements of housing choice, such as the tangible and intangible elements of physical and neighborhood features, as well as broader community features, such as proximity to work, shopping, dining, and recreation.
Importance
This discussion explores which features are “very important” to residents’ considerations of where to live. Responses are summarized several ways: 1) overall, 2) by subarea, and 3) by age category. Responses are further compared against stated preferences from the 2013 HMS survey fielded for the Housing Element of planokc.
Overall. The findings in the left-hand column of Figure 1 displays, in descending order, the features that the highest portion of residents believe are “very important” in choosing where to live: 1) safety and security, 2) price, 3) appearance/construction quality, 4) sense of privacy, and 5) neighborhood character. On the other end of the spectrum are those features that the smallest portion of residents feel are “very important” in choosing where to live: 1) proximity to caregiver, 2) proximity to parks, 3) ADA accessibility, 4) proximity to trails and bike lanes, and 5) proximity to public transit. As will be illustrated, the ranking of these features reflect unique market demand profiles not only by subarea, but by age.
Figure 1. Importance Rank
86%
78%
69%
69%
60%
58%
55%
52%
46%
39%
35%
33%
29%
23%
22%
21%
Sense of Safety and Security
Price
Appearance / Construction Quality
Sense of Privacy
Neighborhood Character
Close Proximity to Grocery
Home Size
Quality of Public Schools
Close Proximity to Dining, Shops, and Entertainment
Close to Work
Lot Size
Close Proximity to care-giver/healthcare facilities
Close Proximity to Parks
ADA/Disability Accesibility
Close to Trails or Bike Lanes
Close Proximity to Public Transit
Source: RRC Associates / Economic & Planning Systems

Oklahoma City Housing Market Study
8
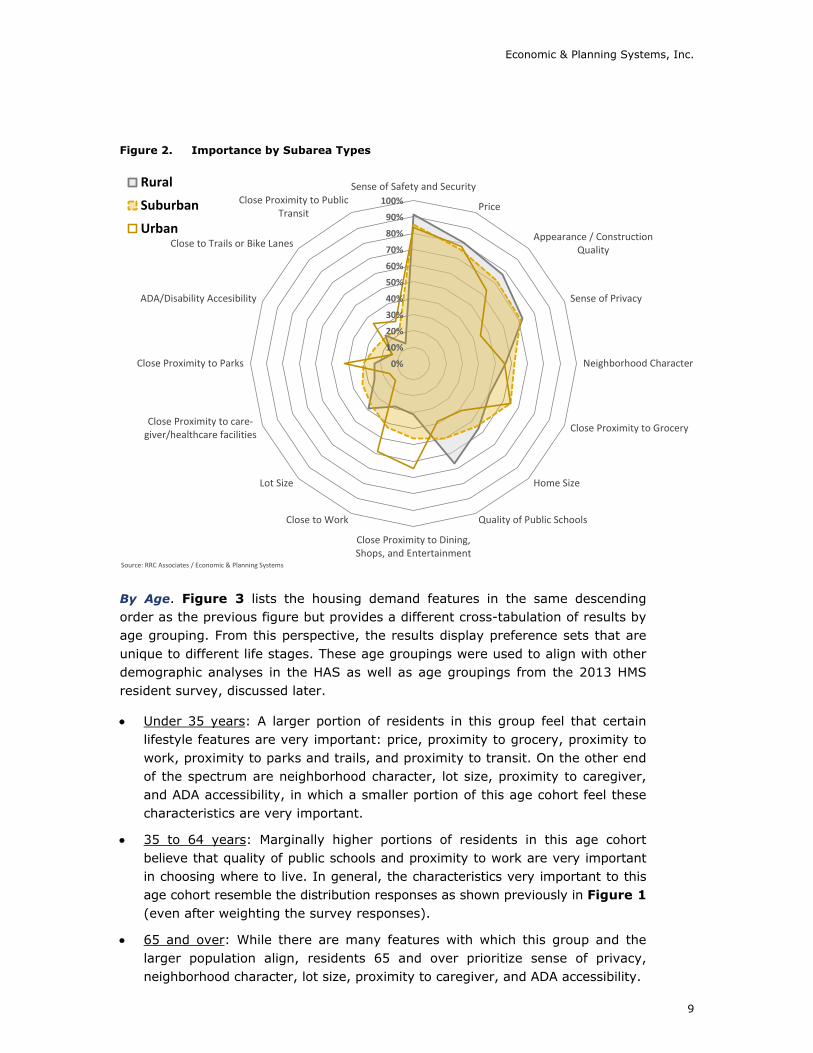
By Subarea. When examining this preferences question by location, patterns emerge (Figure 2) that reveal how differently or similarly residents living in rural, suburban, and urban parts of the community view the importance of various housing characteristics.
• Rural: A larger portion of residents in these subareas consider the quality of public schools very important in choosing where to live. They also perceive the sense of safety and security, price, home and lot size, and appearance/construction quality marginally more important than other residents. On the other end of the spectrum, they seem less likely to say that the following are very important to them: neighborhood character, proximity to grocery, work, parks, dining/shops/entertainment, and public transit.
• Suburban: Although residents in suburban areas are likelier to fit within the overall average response profile, a marginally higher portion of this grouping of residents is likely to say that proximity to grocery, caregiver, and ADA accessibility are very important in choosing where to live.
• Urban: Compared to the rest of the city’s residents, this grouping feels that proximity to dining, shops, and entertainment, as well as proximity to work, parks, and trails/bike lanes is very important in choosing where to live. On the other hand, smaller portions of them are likely, however, to say that the following are important: appearance/construction quality, sense of privacy, home size, quality of public schools, lot size, and proximity to caregiver.
When examining the commonalities among resident groupings from the perspective of location, there are three unifying themes: sense of safety and security, price, and neighborhood character. The portions of residents who consider these “very important” considerations are within 10 percentage points of one another. As a market demand consideration, it is important for all neighborhoods to maximize resident sense of safety and security, neighborhood character, while optimizing affordability/price.
Economic & Planning Systems, Inc.
9
Figure 2. Importance by Subarea Types
By Age. Figure 3 lists the housing demand features in the same descending order as the previous figure but provides a different cross-tabulation of results by age grouping. From this perspective, the results display preference sets that are unique to different life stages. These age groupings were used to align with other demographic analyses in the HAS as well as age groupings from the 2013 HMS resident survey, discussed later.
• Under 35 years: A larger portion of residents in this group feel that certain lifestyle features are very important: price, proximity to grocery, proximity to work, proximity to parks and trails, and proximity to transit. On the other end of the spectrum are neighborhood character, lot size, proximity to caregiver, and ADA accessibility, in which a smaller portion of this age cohort feel these characteristics are very important.
• 35 to 64 years: Marginally higher portions of residents in this age cohort believe that quality of public schools and proximity to work are very important in choosing where to live. In general, the characteristics very important to this age cohort resemble the distribution responses as shown previously in Figure 1 (even after weighting the survey responses).
• 65 and over: While there are many features with which this group and the larger population align, residents 65 and over prioritize sense of privacy, neighborhood character, lot size, proximity to caregiver, and ADA accessibility.
0%
10%
20%
30%
40%
50%
60%
70%
80%
90%
100%Sense of Safety and Security
Price
Appearance / ConstructionQuality
Sense of Privacy
Neighborhood Character
Close Proximity to Grocery
Home Size
Quality of Public Schools
Close Proximity to Dining,Shops, and Entertainment
Close to Work
Lot Size
Close Proximity to care-giver/healthcare facilities
Close Proximity to Parks
ADA/Disability Accesibility
Close to Trails or Bike Lanes
Close Proximity to PublicTransit
Rural
Suburban
Urban
Source: RRC Associates / Economic & Planning Systems

Oklahoma City Housing Market Study
10
When looking at these preference sets across age cohorts, they reveal commonalities unique from those revealed at a locational level. Across the three age groups, there is less than a 10 percent difference among residents on six issues: 1) sense of safety and security, 2) appearance and construction quality, 3) close proximity to grocery, 4) quality of public schools, 5) close proximity to dining, shops, and entertainment, and 6) close proximity to transit. This does not imply that these considerations are top priorities, but that residents across age groups believe that these are uniformly important to the same degree.
That the commonalities identified by location and by age group are not consistent reflects the reality that resident preferences within each age cohort are not uniform. That is, some residents within each age group prefer to live in different types of housing and in different locations (urban, suburban, and rural).
Figure 3. Importance of Housing & Neighborhood Features by Age Category
0%
10%
20%
30%
40%
50%
60%
70%
80%
90%Sense of Safety and Security
Price
Appearance / ConstructionQuality
Sense of Privacy
Neighborhood Character
Close Proximity to Grocery
Home Size
Quality of Public Schools
Close Proximity to Dining,Shops, and Entertainment
Close to Work
Lot Size
Close Proximity to care-giver/healthcare facilities
Close Proximity to Parks
ADA/Disability Accesibility
Close to Trails or Bike Lanes
Close Proximity to PublicTransit
Under 35
35 to 64
65 and over
Source: RRC Associates / Economic & Planning Systems

Economic & Planning Systems, Inc.
11
Comparison. Figure 4 illustrates, also in the descending order used in the previous two figures, the portion of residents who feel these features are very important in choosing where to live. While the differences are minor, as conditions have changed over time, minor attitudinal shifts have emerged where some characteristics have become slightly more or slightly less important.
• Little to No Change: At the upper end of the spectrum, residents in Oklahoma City remain safety and security-minded, price-conscious, and privacy-oriented to nearly the same extent today as several years ago. At the other end of the spectrum, a similarly small portion of residents also feel that proximity to public transit is very important.
• More Important: Slightly larger portions of residents believe that appearance and construction quality, home size (a relative perspective discussed later in Table 3 and Table 4), and lot size are important.
• Less Important: On the other hand, slightly smaller portions of residents indicated that proximity to work and parks was very important (this relative shift is also discussed in the following section on satisfaction levels). No score for “Close to Trails or Bike Lanes” is shown for 2013 because the question was asked in a different phrasing for the 2013 HMS Survey.
Figure 4. Importance of Housing & Neighborhood Features, 2013 and 2020
0% 10% 20% 30% 40% 50% 60% 70% 80% 90% 100%
Sense of Safety and Security
Price
Appearance / Construction Quality
Sense of Privacy
Home Size
Close Proximity to Dining, Shops, and Entertainment
Close to Work
Close Proximity to Parks
Lot Size
Close to Trails or Bike Lanes
Close Proximity to Public Transit
Series1
Series2
2013
2020
Source: RRC Associates / Economic & Planning Systems, 2013 and 2020 Surveys
Z:\Shared\Projects\DEN\193045-Oklahoma City OK Housing Study\Data\[193045-Comparison of 2013 and 2020 Survey Findings-061821.xlsx]Table - Importance
Oklahoma City Housing Market Study
12
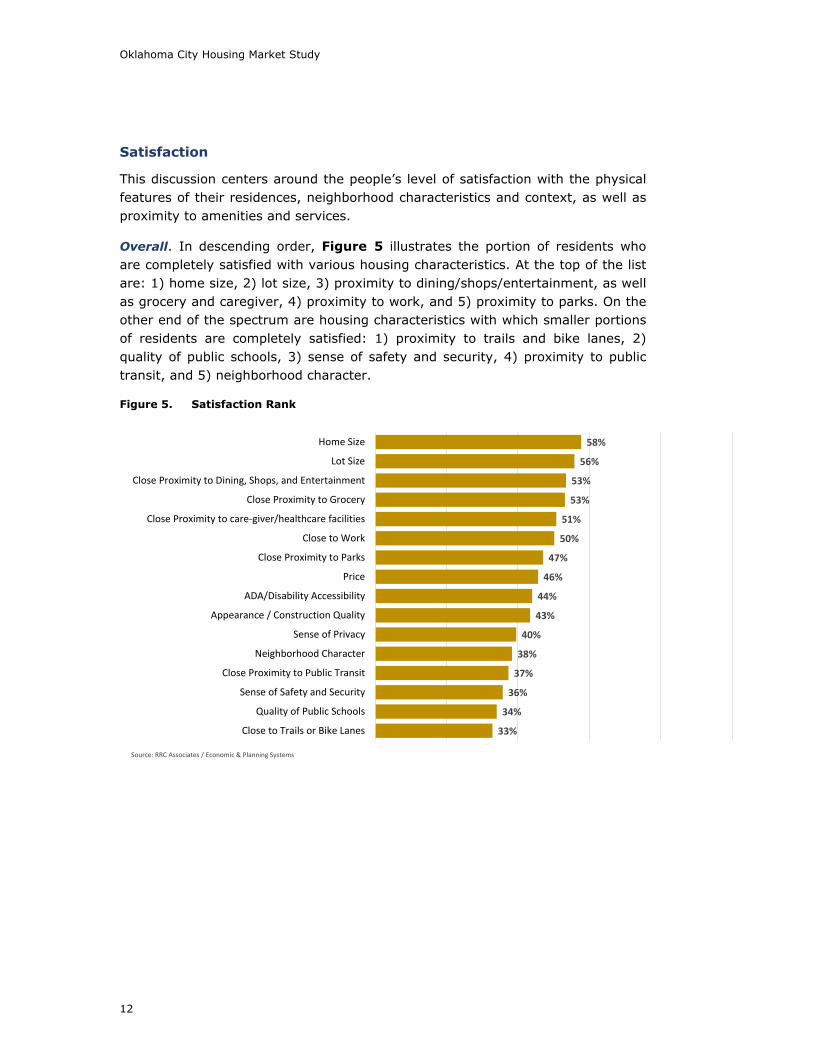
Satisfaction
This discussion centers around the people’s level of satisfaction with the physical features of their residences, neighborhood characteristics and context, as well as proximity to amenities and services.
Overall. In descending order, Figure 5 illustrates the portion of residents who are completely satisfied with various housing characteristics. At the top of the list are: 1) home size, 2) lot size, 3) proximity to dining/shops/entertainment, as well as grocery and caregiver, 4) proximity to work, and 5) proximity to parks. On the other end of the spectrum are housing characteristics with which smaller portions of residents are completely satisfied: 1) proximity to trails and bike lanes, 2) quality of public schools, 3) sense of safety and security, 4) proximity to public transit, and 5) neighborhood character.
Figure 5. Satisfaction Rank
58%
56%
53%
53%
51%
50%
47%
46%
44%
43%
40%
38%
37%
36%
34%
33%
Home Size
Lot Size
Close Proximity to Dining, Shops, and Entertainment
Close Proximity to Grocery
Close Proximity to care-giver/healthcare facilities
Close to Work
Close Proximity to Parks
Price
ADA/Disability Accessibility
Appearance / Construction Quality
Sense of Privacy
Neighborhood Character
Close Proximity to Public Transit
Sense of Safety and Security
Quality of Public Schools
Close to Trails or Bike Lanes
Source: RRC Associates / Economic & Planning Systems
Economic & Planning Systems, Inc.
13
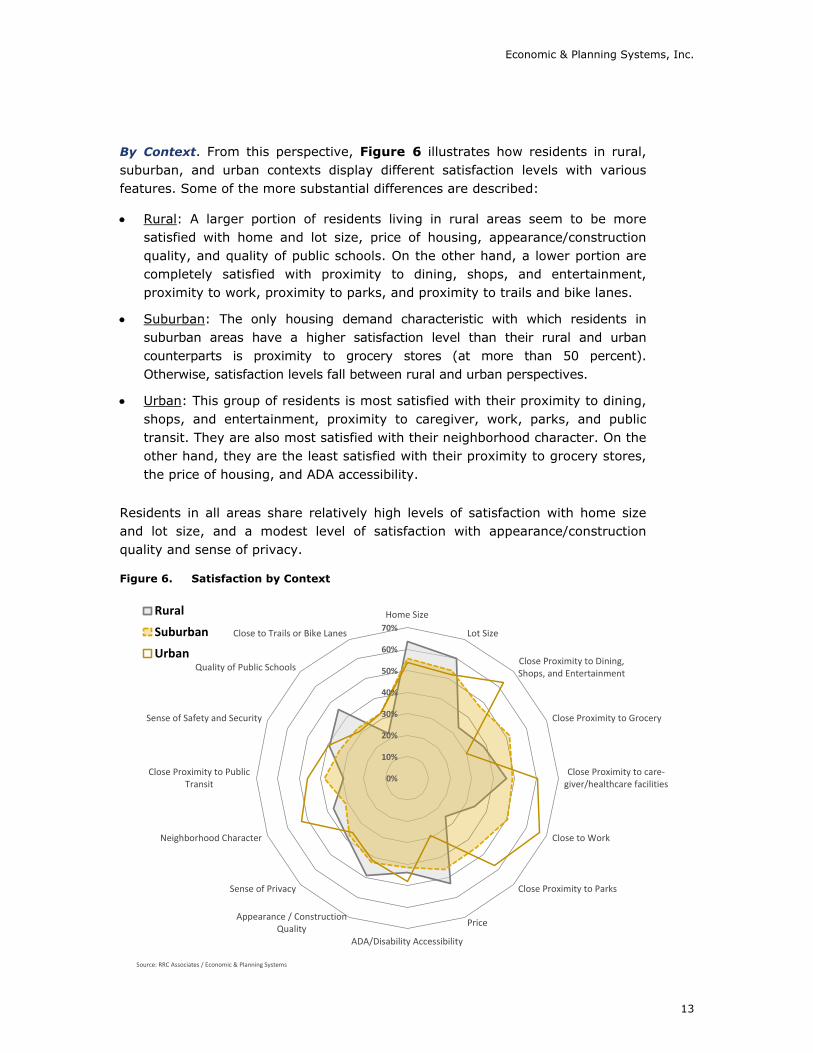
By Context. From this perspective, Figure 6 illustrates how residents in rural, suburban, and urban contexts display different satisfaction levels with various features. Some of the more substantial differences are described:
• Rural: A larger portion of residents living in rural areas seem to be more satisfied with home and lot size, price of housing, appearance/construction quality, and quality of public schools. On the other hand, a lower portion are completely satisfied with proximity to dining, shops, and entertainment, proximity to work, proximity to parks, and proximity to trails and bike lanes.
• Suburban: The only housing demand characteristic with which residents in suburban areas have a higher satisfaction level than their rural and urban counterparts is proximity to grocery stores (at more than 50 percent). Otherwise, satisfaction levels fall between rural and urban perspectives.
• Urban: This group of residents is most satisfied with their proximity to dining, shops, and entertainment, proximity to caregiver, work, parks, and public transit. They are also most satisfied with their neighborhood character. On the other hand, they are the least satisfied with their proximity to grocery stores, the price of housing, and ADA accessibility.
Residents in all areas share relatively high levels of satisfaction with home size and lot size, and a modest level of satisfaction with appearance/construction quality and sense of privacy.
Figure 6. Satisfaction by Context
0%
10%
20%
30%
40%
50%
60%
70%Home Size
Lot Size
Close Proximity to Dining,Shops, and Entertainment
Close Proximity to Grocery
Close Proximity to care-giver/healthcare facilities
Close to Work
Close Proximity to Parks
Price
ADA/Disability Accessibility
Appearance / ConstructionQuality
Sense of Privacy
Neighborhood Character
Close Proximity to PublicTransit
Sense of Safety and Security
Quality of Public Schools
Close to Trails or Bike Lanes
Rural
Suburban
Urban
Source: RRC Associates / Economic & Planning Systems

Oklahoma City Housing Market Study
14
By Age. Broadly, satisfaction levels appear to rise with age, which also correlates positively to increased income with age – that is, as income increases with age, the ability to make choices that satisfy one’s needs increases. Given that Oklahoma City has continued to see robust employment and population growth, in particular from younger age groups (as noted in the HAS), Figure 7 illuminates an opportunity to ensure that people’s most important needs are met.
• Under 35 years: This cohort is most concerned with price, proximity to work, proximity to parks, proximity to trails and bike lanes, and proximity to public transit. On the other hand, they are least concerned with neighborhood character, sense of privacy, proximity to a caregiver or healthcare facilities.
• 35 to 64 years: This group is more concerned about lot size and quality of public schools, while most of their other concerns align with overall averages.
• 65 and over: This group is most concerned with ADA/disability accessibility, neighborhood character, sense of privacy, proximity to caregiver or health facilities. On the other hand, they are less concerned with proximity to work and proximity to trails and bike lanes.
All three age groups share a relatively modest degree of satisfaction with proximity to dining, shops, and entertainment and proximity to grocery and a relatively low degree of satisfaction with proximity to parks, proximity to trails and bike lanes, proximity to transit.
Figure 7. Satisfaction with Housing and Neighborhood Features by Age Category
0%
10%
20%
30%
40%
50%
60%
70%Sense of Safety and Security
Price
Appearance / ConstructionQuality
Sense of Privacy
Neighborhood Character
Close Proximity to Grocery
Home Size
Quality of Public Schools
Close Proximity to Dining,Shops, and Entertainment
Close to Work
Lot Size
Close Proximity to care-giver/healthcare facilities
Close Proximity to Parks
ADA/Disability Accessibility
Close to Trails or Bike Lanes
Close Proximity to PublicTransit
Under 35
35 to 64
65 and over
Source: RRC Associates / Economic & Planning Systems

Economic & Planning Systems, Inc.
15
Comparison of 2013 and 2020 Survey Results. Figure 8 illustrates the differences between the portion of residents completely satisfied with certain features in 2013 and 2020. Most interesting are the series of six features for which residents are substantially more satisfied: 1) home size, 2) lot size, 3) proximity to dining/shopping/entertainment, 4) proximity to work, 5) proximity to parks, and 6) proximity to public transit. Although there were marginal shifts (to the positive) along the remainder of the array of features, residents were less satisfied with sense of safety and security (the only metric to decline).
Figure 8. Satisfaction with Housing & Neighborhood Features, 2013 and 2020
Satisfaction vs. Importance
Framed in the context of the HAS land use development pattern analysis, processes, and regulatory context, this section looks at how well satisfaction levels align with level of importance residents place on them. Charting both is one way to visually organize and prioritize land use, process, or broader development code efforts. Figure 9, and the following figures, show: 1) the percentage of residents that are satisfied and 2) the percentage of residents that feel each consideration is very important to their housing choice.
• Less Important, More Satisfied • Very Important, More Satisfied • Less Important, Less Satisfied • Very Important, Less Satisfied
0% 10% 20% 30% 40% 50% 60% 70%
Home Size
Lot Size
Close Proximity to Dining, Shops, and Entertainment
Close to Work
Close Proximity to Parks
Price
Appearance / Construction Quality
Sense of Privacy
Close Proximity to Public Transit
Sense of Safety and Security
Close to Trails or Bike Lanes
Series1
Series2
2013
2020
Source: RRC Associates / Economic & Planning Systems, 2013 and 2020 Surveys
Z:\Shared\Projects\DEN\193045-Oklahoma City OK Housing Study\Data\[193045-Comparison of 2013 and 2020 Survey Findings-061821.xlsx]Table - Satisf

Oklahoma City Housing Market Study
16
Overall. Figure 9 and subsequent charts are organized according to these four respective categories in quadrants. The quadrant of most interest is that labeled “Very Important, Less Satisfied” in the bottom right. As the label suggests, characteristics that fall in this quadrant imply that more could be done to bring to parity the portion of residents who consider certain characteristics very important with the portion of residents who are completely satisfied with those characteristics. From the perspective of what Oklahoma City can do about it, the characteristics in this quadrant indicate where more investment or efforts could be made to improve housing supply and its contexts.
As shown, across the city, the level of satisfaction falls short of the level of importance for the following six (6) features: 1) sense of safety and security, 2) sense of privacy, 3) neighborhood character, 4) price, and 5) quality of public schools. On the other hand, across the city, the portion of residents completely satisfied are in line (or exceed) the portion of residents who see the following characteristics as very important (top right and left quadrants): 1) home size, 2) lot size, 3) close to grocery, 4) close to dining, 5) close to caregiver, and 6) close to work.
Figure 9. Overall Satisfaction vs. Importance
Sense of Safety and Security
Price
Appearance / Construction Quality
Sense of Privacy
Neighborhood Character
Close Proximity to Grocery
Home Size
Quality of Public Schools
Close Proximity to Dining, Shops, and Entertainment
Close to Work
Lot SizeClose Proximity to care-giver/healthcare facilities
Close Proximity to Parks
ADA/Disability Accesibility
Close to Trails or Bike Lanes
Close Proximity to Public Transit
0%
10%
20%
30%
40%
50%
60%
70%
80%
90%
100%
0% 10% 20% 30% 40% 50% 60% 70% 80% 90% 100%
% R
esid
ents
"Co
mpl
etel
y Sa
tisfie
d"
% Resident Consider it "Very Important in Choosing Where to Live"
Less Important, More Satisfied
Very Important, More Satisfied
Less Important, Less Satisfied
Very Important, Less Satisfied
Source: RRC Associates / Economic & Planning Systems

Economic & Planning Systems, Inc.
17
Rural Contexts. Figure 10 shows that for residents in the rural context, the level of satisfaction falls short of the level of importance for the following six (6) features: 1) sense of safety and security, 2) appearance / construction quality, 3) sense of privacy, 4) quality of public schools, 5) neighborhood character, and 6) proximity to grocery.
When asked specifically what type of improvements their respective neighborhoods and subareas needed, the following were themes that emerged from a text analysis of open-ended responses in the community-wide survey:
• Northwest-Rural (1): Better roads, better sidewalks, access to public transportation, parks, trails, and bike lanes.
• Northeast-Rural (3): Better sidewalks, need for grocery store and public transportation, noise, safety, and lighting.
• Southwest-Rural (9): Better streets, better roads, better lighting, security and safety.
• Southeast-Rural (11): Better public transportation, better roads, smaller homes, walking trails.
Figure 10. Satisfaction vs. Importance in Rural Subareas
Sense of Safety and Security
Price
Appearance / Construction Quality
Sense of Privacy
Neighborhood Character
Close Proximity to Grocery
Home Size
Quality of Public Schools
Close Proximity to Dining, Shops, and Entertainment
Close to Work
Lot Size
Close Proximity to care-giver/healthcare facilities
Close Proximity to Parks
Close to Trails or Bike Lanes
Close Proximity to Public Transit
0%
10%
20%
30%
40%
50%
60%
70%
80%
90%
100%
0% 10% 20% 30% 40% 50% 60% 70% 80% 90% 100%
% R
esid
ents
"Co
mpl
etel
y Sa
tisfie
d"
% Resident Consider it "Very Important in Choosing Where to Live"
Less Important, More Satisfied
Very Important, More Satisfied
Less Important, Less Satisfied
Very Important, Less Satisfied
Source: RRC Associates / Economic& Planning Systems

Oklahoma City Housing Market Study
18
Suburban Contexts. Figure 11 shows that for residents in the suburban context, the level of satisfaction falls short of the level of importance for the following seven (7) features: 1) sense of safety and security, 2) price, 3) appearance / construction quality, 4) sense of privacy, 5) neighborhood character, 6) quality of public schools, and 7) proximity to dining, shops, and entertainment. Among residents in the suburban subareas, the following were themes emerged:
• Northwest-Urban (4): Better sidewalks, streetlights, better public transportation, public schools, streets, lighting, maintenance.
• Southwest-Urban (5): Better schools, need for grocery store, public transportation, reduce the crime, get rid of slumlords, better lighting, better public safety.
• Northeast-Urban (7): Better schools, need grocery store, better sidewalks, better streets, better quality housing and need for repair.
• Southeast-Urban (10): Better upkeep of homes, better streets, parks, public transportation, police presence, street lighting, street maintenance.
Figure 11. Satisfaction vs. Importance in Suburban Subareas
Sense of Safety and Security
Price
Appearance / Construction
Quality
Sense of Privacy
Neighborhood Character
Close Proximity to GroceryHome Size
Quality of Public Schools
Close Proximity to Dining, Shops, and
Entertainment
Close to WorkLot Size
Close Proximity to care-
giver/healthcare facilities
Close Proximity to
Parks
Close to Trails or Bike Lanes
Close Proximity to Public Transit
0%
10%
20%
30%
40%
50%
60%
70%
80%
90%
100%
0% 10% 20% 30% 40% 50% 60% 70% 80% 90%
% R
esid
ents
"Co
mpl
etel
y Sa
tisfie
d"
% Resident Consider it "Very Important in Choosing Where to Live"
Less Important, More Satisfied
Very Important, More Satisfied
Less Important, Less Satisfied
Very Important, Less Satisfied
Source: RRC Associates / Economic& Planning Systems
Economic & Planning Systems, Inc.
19
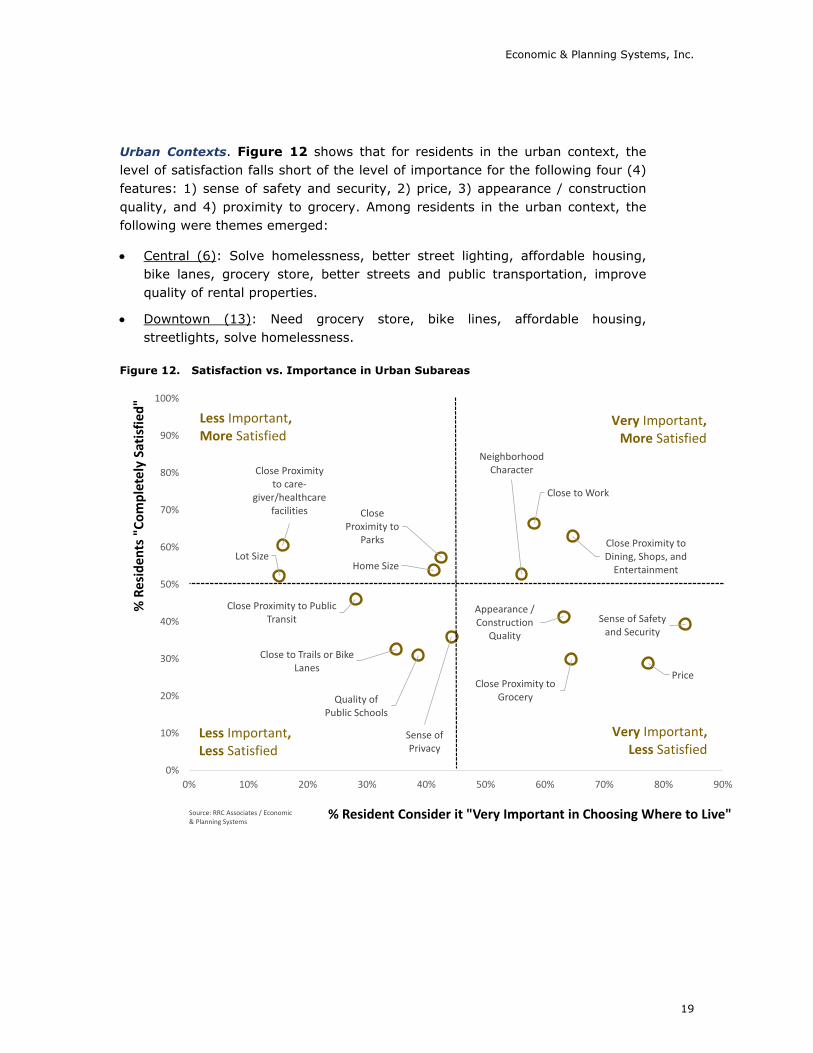
Urban Contexts. Figure 12 shows that for residents in the urban context, the level of satisfaction falls short of the level of importance for the following four (4) features: 1) sense of safety and security, 2) price, 3) appearance / construction quality, and 4) proximity to grocery. Among residents in the urban context, the following were themes emerged:
• Central (6): Solve homelessness, better street lighting, affordable housing, bike lanes, grocery store, better streets and public transportation, improve quality of rental properties.
• Downtown (13): Need grocery store, bike lines, affordable housing, streetlights, solve homelessness.
Figure 12. Satisfaction vs. Importance in Urban Subareas
Sense of Safety and Security
Price
Appearance / Construction
Quality
Sense of Privacy
Neighborhood Character
Close Proximity to Grocery
Home Size
Quality of Public Schools
Close Proximity to Dining, Shops, and
Entertainment
Close to Work
Lot Size
Close Proximity to care-
giver/healthcare facilities Close
Proximity to Parks
Close to Trails or Bike Lanes
Close Proximity to Public Transit
0%
10%
20%
30%
40%
50%
60%
70%
80%
90%
100%
0% 10% 20% 30% 40% 50% 60% 70% 80% 90%
% R
esid
ents
"Co
mpl
etel
y Sa
tisfie
d"
% Resident Consider it "Very Important in Choosing Where to Live"
Less Important, More Satisfied
Very Important, More Satisfied
Less Important, Less Satisfied
Very Important, Less Satisfied
Source: RRC Associates / Economic& Planning Systems
Oklahoma City Housing Market Study
20
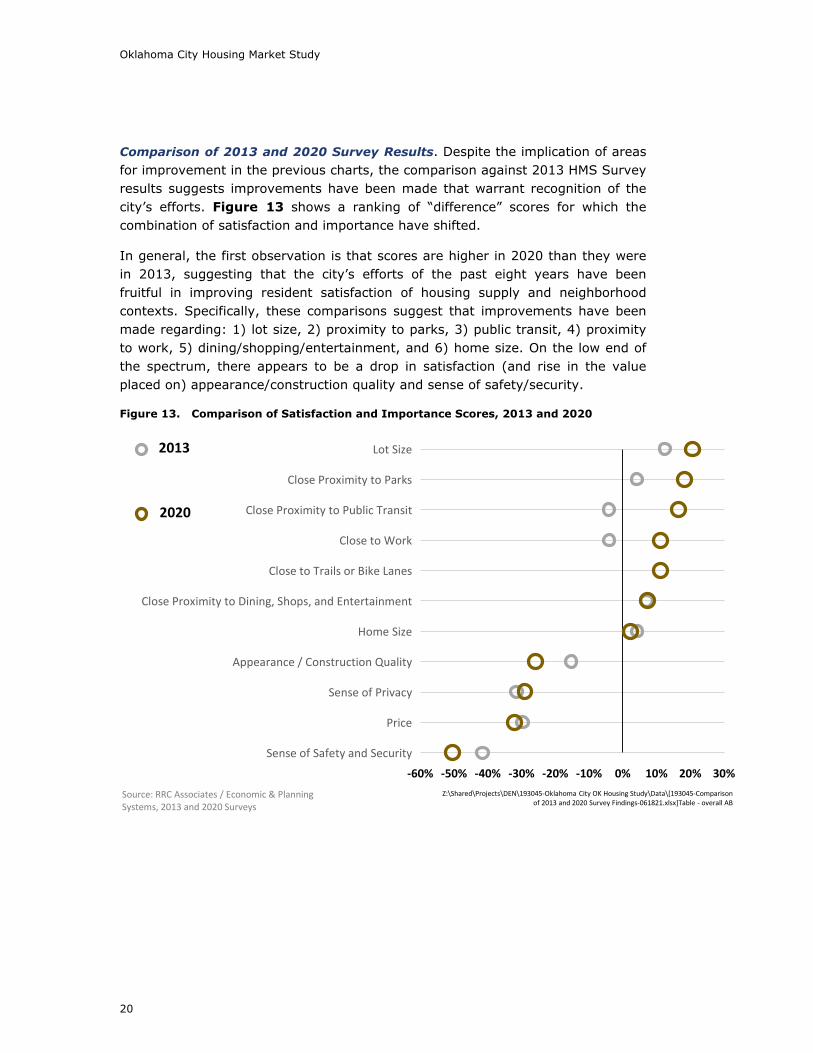
Comparison of 2013 and 2020 Survey Results. Despite the implication of areas for improvement in the previous charts, the comparison against 2013 HMS Survey results suggests improvements have been made that warrant recognition of the city’s efforts. Figure 13 shows a ranking of “difference” scores for which the combination of satisfaction and importance have shifted.
In general, the first observation is that scores are higher in 2020 than they were in 2013, suggesting that the city’s efforts of the past eight years have been fruitful in improving resident satisfaction of housing supply and neighborhood contexts. Specifically, these comparisons suggest that improvements have been made regarding: 1) lot size, 2) proximity to parks, 3) public transit, 4) proximity to work, 5) dining/shopping/entertainment, and 6) home size. On the low end of the spectrum, there appears to be a drop in satisfaction (and rise in the value placed on) appearance/construction quality and sense of safety/security.
Figure 13. Comparison of Satisfaction and Importance Scores, 2013 and 2020
-60% -50% -40% -30% -20% -10% 0% 10% 20% 30%
Lot Size
Close Proximity to Parks
Close Proximity to Public Transit
Close to Work
Close to Trails or Bike Lanes
Close Proximity to Dining, Shops, and Entertainment
Home Size
Appearance / Construction Quality
Sense of Privacy
Price
Sense of Safety and Security
Series1
Series2
2013
2020
Source: RRC Associates / Economic & Planning Systems, 2013 and 2020 Surveys
Z:\Shared\Projects\DEN\193045-Oklahoma City OK Housing Study\Data\[193045-Comparison of 2013 and 2020 Survey Findings-061821.xlsx]Table - overall AB

Economic & Planning Systems, Inc.
21
Proximity to Services – New Housing
Figure 14, an analysis of which is also discussed in the HAS, illustrates that most of Oklahoma City’s new housing has been built in peripheral parts of the city – Northwest-Rural (1), Northwest-Urban (4), Southwest-Urban (5), and Southwest-Rural (9).
Figure 14. New Residential Units by Subarea, 2010-2020

Oklahoma City Housing Market Study
22
Housing in Proximity to Services
The following looks at what portion of new and existing housing by subarea has been built in proximity (defined as a half-mile) to the following key locational services: transit stops, schools, restaurants, and grocery stores. Data used in this analysis came from two key sources: OKC Open Data (schools and transit) and the State of Oklahoma’s Business Permit Database (restaurants and grocery stores).
Proximity to Schools. Overall, 71 percent of all housing units in Oklahoma City are located within a one-half mile of a school. Figure 15 illustrates that housing in the more urban and suburban areas is more likely to be in walking distance to schools than housing in rural areas. Data used in this analysis was obtained from point-level data OKC Open Data and modified according to an updated list per the advice of City staff. The data consists of both public and private schools at the three major schooling levels: elementary, middle, and high. It should be noted, however, that the data in this analysis did not contain school quality or performance. The data could also not be used to identify specific catchment areas for different types and locations of schools. As such, the analysis uses a uniform catchment area of a half-mile as a visual proxy.
Figure 15. School Proximity and New Housing Construction
Economic & Planning Systems, Inc.
23
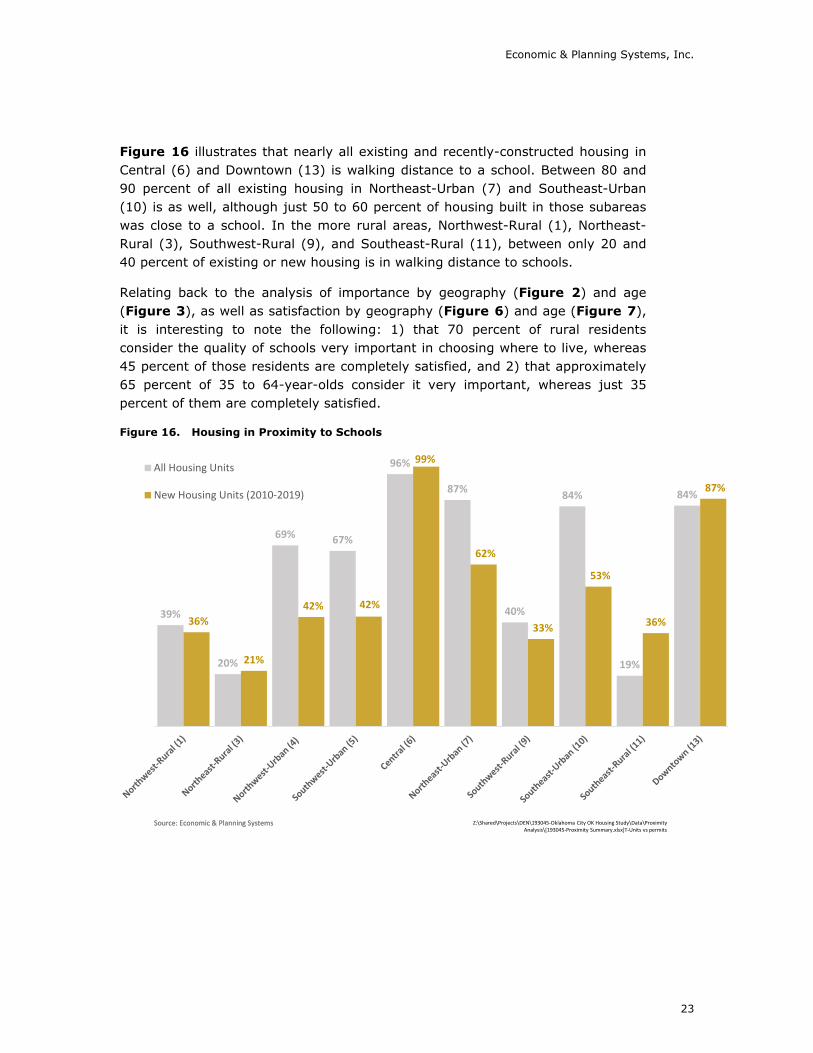
Figure 16 illustrates that nearly all existing and recently-constructed housing in Central (6) and Downtown (13) is walking distance to a school. Between 80 and 90 percent of all existing housing in Northeast-Urban (7) and Southeast-Urban (10) is as well, although just 50 to 60 percent of housing built in those subareas was close to a school. In the more rural areas, Northwest-Rural (1), Northeast-Rural (3), Southwest-Rural (9), and Southeast-Rural (11), between only 20 and 40 percent of existing or new housing is in walking distance to schools.
Relating back to the analysis of importance by geography (Figure 2) and age (Figure 3), as well as satisfaction by geography (Figure 6) and age (Figure 7), it is interesting to note the following: 1) that 70 percent of rural residents consider the quality of schools very important in choosing where to live, whereas 45 percent of those residents are completely satisfied, and 2) that approximately 65 percent of 35 to 64-year-olds consider it very important, whereas just 35 percent of them are completely satisfied.
Figure 16. Housing in Proximity to Schools
39%
20%
69% 67%
96%
87%
40%
84%
19%
84%
36%
21%
42% 42%
99%
62%
33%
53%
36%
87%
All Housing Units
New Housing Units (2010-2019)
Source: Economic & Planning Systems Z:\Shared\Projects\DEN\193045-Oklahoma City OK Housing Study\Data\Proximity Analysis\[193045-Proximity Summary.xlsx]T-Units vs permits
Source: Economic & Planning Systems

Oklahoma City Housing Market Study
24
Proximity to Transit. Citywide, 53 percent of existing housing is located within a half mile of a transit stop. Figure 17 illustrates, on the other hand, that much of new housing and especially new housing built on the city’s periphery, was not built within walking distance of transit stops. Data for this analysis were also obtained from the City Planning Department through OKC Open Data. The data consist of all lines and stops for both the bus and the streetcar systems.
Figure 17. Transit Proximity and New Housing Construction

Economic & Planning Systems, Inc.
25
The findings of the analysis, illustrated in Figure 18, indicate that existing housing in Central (6), Northeast-Urban (7), and Downtown (13) are well-served by transit, as is most of new construction in those three subareas. For the suburban areas, including Northwest-Urban (4), Southwest-Urban (5), and Southwest-Urban (10), between 40 and 70 percent of existing housing is within walking distance of transit, although eight (8) percent, two (2) percent, and 22 percent of new housing, respectively, was built near transit. With the exception of Northeast-Rural (3), the rural areas of the city have zero transit proximity.
This analysis can be related back to the examination of importance by geography (Figure 2) and age (Figure 3), as well as satisfaction by geography (Figure 6) and age (Figure 7). Among the city’s residents, this is relatively more important to urban dwellers (where 30 percent say it is very important in choosing where to live), compared to 20 percent of suburban residents, and five (5) percent of rural residents. Based on age, this is also most important to the younger ages (under 35 years) and least important to those over 65 years. Although satisfaction with this is fairly similar across age cohorts, the findings suggest that urban residents are also relatively more satisfied (45 percent) than rural residents (30 percent).
Figure 18. Housing in Proximity to Transit
0%
12%
42%
59%
93% 94%
0%
69%
0%
100%
0%
11%8%
2%
99%
69%
0%
22%
0%
100%All Housing Units
New Housing Units (2010-2019)
Source: Economic & Planning Systems Z:\Shared\Projects\DEN\193045-Oklahoma City OK Housing Study\Data\Proximity Analysis\[193045-Proximity Summary.xlsx]T-Units vs permits
Source: Economic & Planning SystemsSource: Economic & Planning SystemsSource: Economic & Planning Systems Z:\Shared\Projects\DEN\193045-Oklahoma City OK Housing Study\Data\Proximity Analysis\[193045-Proximity Summary.xlsx]T-Units vs permits
Source: Economic & Planning Systems
Oklahoma City Housing Market Study
26
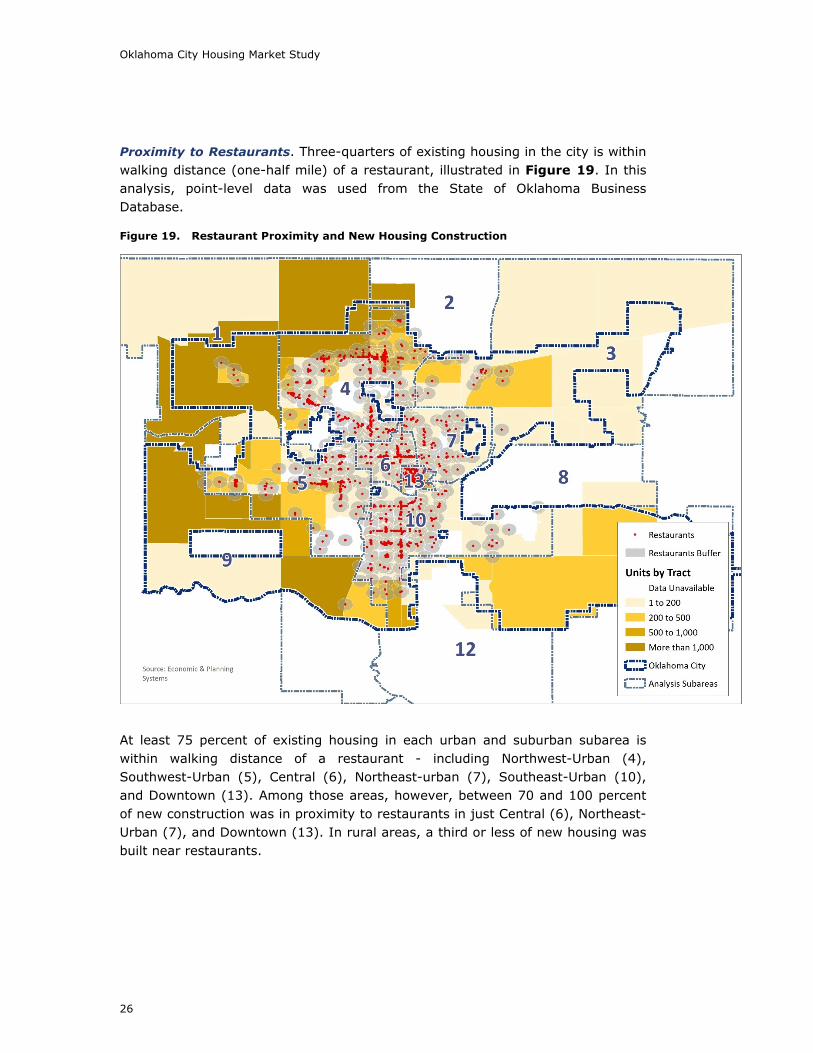
Proximity to Restaurants. Three-quarters of existing housing in the city is within walking distance (one-half mile) of a restaurant, illustrated in Figure 19. In this analysis, point-level data was used from the State of Oklahoma Business Database.
Figure 19. Restaurant Proximity and New Housing Construction
At least 75 percent of existing housing in each urban and suburban subarea is within walking distance of a restaurant - including Northwest-Urban (4), Southwest-Urban (5), Central (6), Northeast-urban (7), Southeast-Urban (10), and Downtown (13). Among those areas, however, between 70 and 100 percent of new construction was in proximity to restaurants in just Central (6), Northeast-Urban (7), and Downtown (13). In rural areas, a third or less of new housing was built near restaurants.

Economic & Planning Systems, Inc.
27
This analysis can also be related back to the examination of importance by geography (Figure 2) and age (Figure 3), as well as satisfaction by geography (Figure 6) and age (Figure 7). Being close to dining, shopping, and entertainment is very important to 46 percent of residents in choosing where to live. Differences do not emerge as a product of age, however, but as a product of where people live. Across the geographic divide, just 30 percent of rural residents say being in proximity to restaurants and shopping is very important in choosing where to live, compared to 45 percent of suburban residents and 65 percent of urban residents. Similarly, the levels of satisfaction align with this split – approximately 35 percent of rural residents are completely satisfied with their proximity to restaurants and shops, nearly 50 percent of suburban residents, and close to 65 percent of urban residents. When viewed from the perspective of age cohorts, each is clustered very narrowly around the overall average for both importance and satisfaction.
Figure 20. Housing in Proximity to Restaurants
27% 29%
78% 75%
98%
85%
20%
86%
4%
99%
15%
35% 37%
21%
93%
70%
16%
53%
0%
100%All Housing Units
New Housing Units (2010-2019)
Source: Economic & Planning Systems Z:\Shared\Projects\DEN\193045-Oklahoma City OK Housing Study\Data\Proximity Analysis\[193045-Proximity Summary.xlsx]T-Units vs permits
Source: Economic & Planning SystemsSource: Economic & Planning SystemsSource: Economic & Planning SystemsSource: Economic & Planning SystemsSource: Economic & Planning SystemsSource: Economic & Planning SystemsSource: Economic & Planning Systems Z:\Shared\Projects\DEN\193045-Oklahoma City OK Housing Study\Data\Proximity Analysis\[193045-Proximity Summary.xlsx]T-Units vs permits
Source: Economic & Planning SystemsSource: Economic & Planning SystemsSource: Economic & Planning SystemsSource: Economic & Planning SystemsSource: Economic & Planning Systems Z:\Shared\Projects\DEN\193045-Oklahoma City OK Housing Study\Data\Proximity Analysis\[193045-Proximity Summary.xlsx]T-Units vs permits
Source: Economic & Planning SystemsSource: Economic & Planning SystemsSource: Economic & Planning Systems Z:\Shared\Projects\DEN\193045-Oklahoma City OK Housing Study\Data\Proximity Analysis\[193045-Proximity Summary.xlsx]T-Units vs permits
Source: Economic & Planning Systems
Oklahoma City Housing Market Study
28
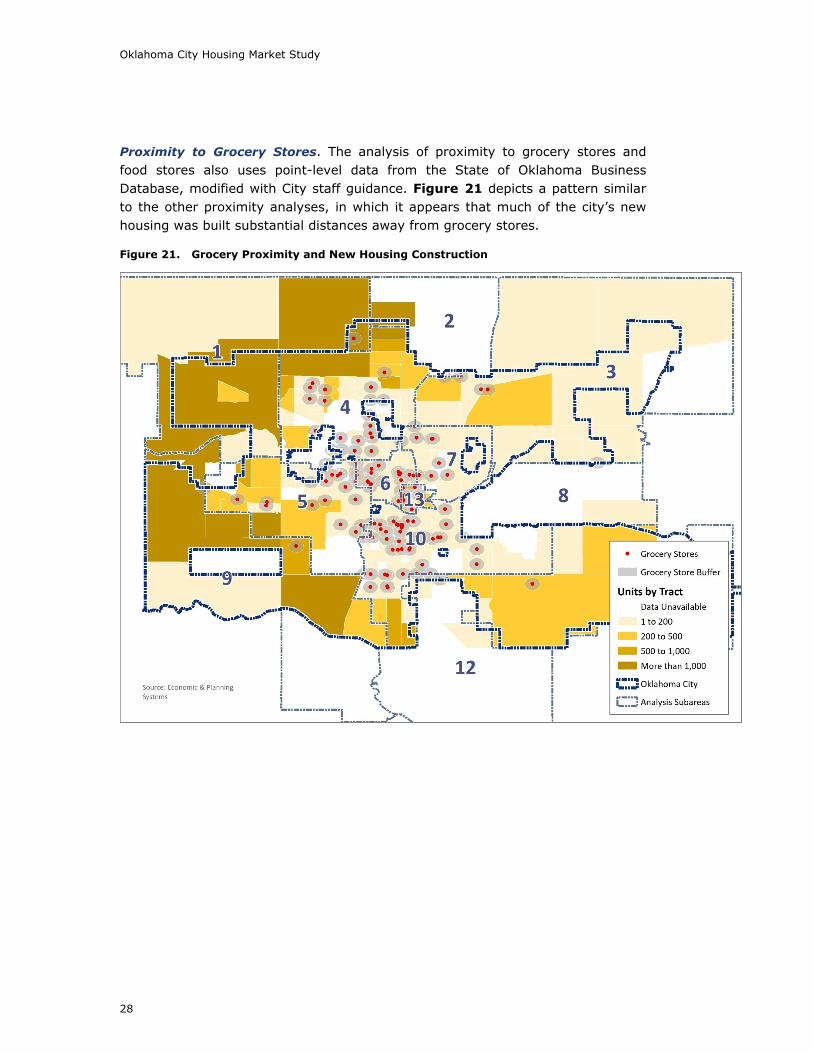
Proximity to Grocery Stores. The analysis of proximity to grocery stores and food stores also uses point-level data from the State of Oklahoma Business Database, modified with City staff guidance. Figure 21 depicts a pattern similar to the other proximity analyses, in which it appears that much of the city’s new housing was built substantial distances away from grocery stores.
Figure 21. Grocery Proximity and New Housing Construction

Economic & Planning Systems, Inc.
29
Figure 22 illustrates findings of the analysis that suggest most existing and new housing in Central (6) and Downtown (13) is within walking distance of grocery stores and other food stores. For the suburban areas, between 20 and 45 percent of existing housing is within walking distance (one-half mile) of grocery, but less than 20 percent of new housing was built within proximity. For households in rural areas, except for Northeast-Rural (3), less than three (3) percent of new or existing housing is in walking distance to grocery stores.
Being close to grocery stores is relatively important to how residents prefer to get there (walk, bike, transit, car, etc.). As such, some subjectivity is apparent in responses. Yet compared with 58 percent of residents saying that this is very important in considering where to live, just 50 percent of rural residents agree compared with 65 percent of both suburban and urban residents. As with proximity to dining, there is little difference among age groups, meaning that this consideration is more closely correlated with where a person lives than their age category. As for satisfaction levels, they also correlate to where a person lives. Figure 21 and Figure 22 align as a visual depiction of the early analysis on satisfaction levels that suburban residents are most satisfied (at 50 percent), followed by rural residents (40 percent), and urban residents (30 percent).
Figure 22. Housing in Proximity to Grocery Stores
2%
20%
34%
42%
68%
38%
2%
45%
2%
94%
1%
11%7% 5%
76%
7%3%
18%
0%
90%
All Housing Units
New Housing Units (2010-2019)
Source: Economic & Planning Systems Z:\Shared\Projects\DEN\193045-Oklahoma City OK Housing Study\Data\Proximity Analysis\[193045-Proximity Summary.xlsx]T-Units vs permits
Source: Economic & Planning SystemsSource: Economic & Planning SystemsSource: Economic & Planning SystemsSource: Economic & Planning SystemsSource: Economic & Planning SystemsSource: Economic & Planning SystemsSource: Economic & Planning SystemsSource: Economic & Planning SystemsSource: Economic & Planning SystemsSource: Economic & Planning SystemsSource: Economic & Planning SystemsSource: Economic & Planning SystemsSource: Economic & Planning Systems Z:\Shared\Projects\DEN\193045-Oklahoma City OK Housing Study\Data\Proximity Analysis\[193045-Proximity Summary.xlsx]T-Units vs permits
Source: Economic & Planning SystemsSource: Economic & Planning SystemsSource: Economic & Planning SystemsSource: Economic & Planning SystemsSource: Economic & Planning SystemsSource: Economic & Planning SystemsSource: Economic & Planning Systems Z:\Shared\Projects\DEN\193045-Oklahoma City OK Housing Study\Data\Proximity Analysis\[193045-Proximity Summary.xlsx]T-Units vs permits
Source: Economic & Planning SystemsSource: Economic & Planning SystemsSource: Economic & Planning SystemsSource: Economic & Planning SystemsSource: Economic & Planning Systems Z:\Shared\Projects\DEN\193045-Oklahoma City OK Housing Study\Data\Proximity Analysis\[193045-Proximity Summary.xlsx]T-Units vs permits
Source: Economic & Planning SystemsSource: Economic & Planning SystemsSource: Economic & Planning Systems Z:\Shared\Projects\DEN\193045-Oklahoma City OK Housing Study\Data\Proximity Analysis\[193045-Proximity Summary.xlsx]T-Units vs permits
Source: Economic & Planning Systems

THIS PAGE INTENTIONALLY LEFT BLANK

Economic & Planning Systems, Inc.
193045-Housing Market Study Final Report_10-11-21 31
Housing Density Analysis
In the 2013 Housing Market and Demand Preferences Study, an analysis of housing development density across periods of time was completed. This chapter updates that analysis with Oklahoma City Building Department and County Assessor information through the end of 2018 (to align with the time period of analysis of housing supply information presented in the HAS).
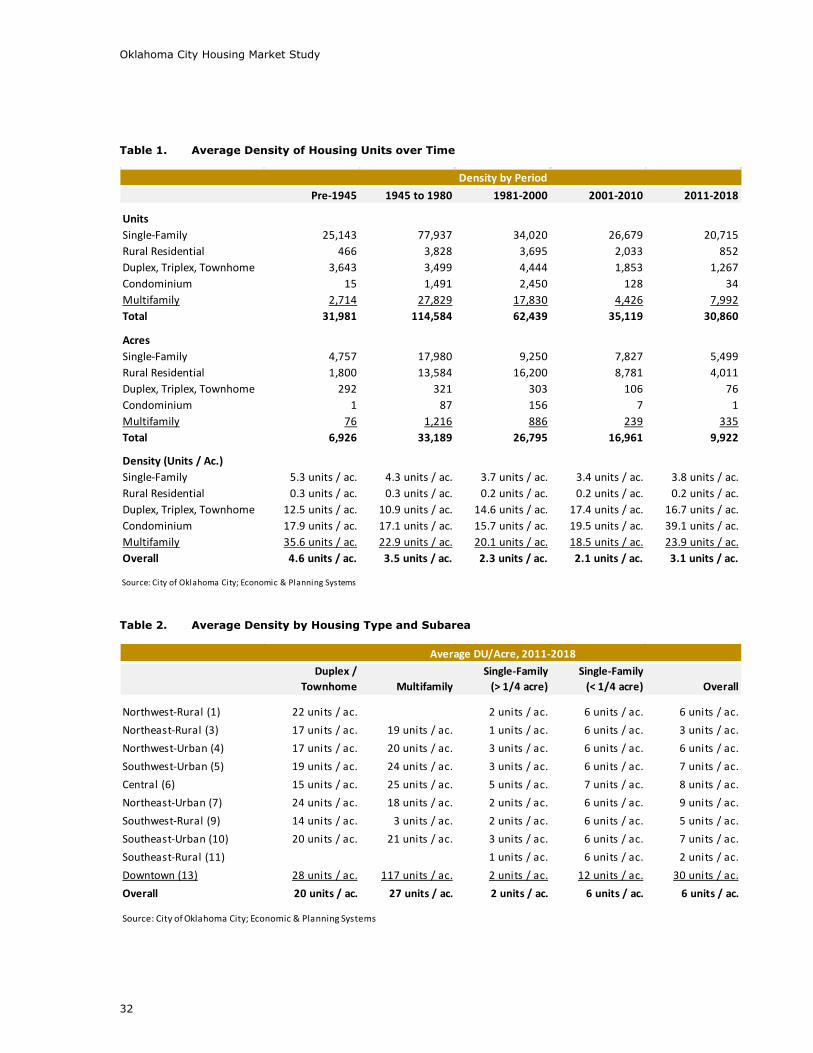
Table 1 on the page 32 illustrates the findings of the County Assessor parcel data analysis, which point toward a trend of declining housing development density (defined as housing units per acre) with the exception of the most recent decade.
• Pre-1945. Housing was built at an average 4.6 units per acre. Single-family was built at 5.3 units per acre, and multifamily (apartments) was built at 36 units per acre.
• 1945 to 1980. Housing during this time was built at 3.5 units per acre. Single-family was built at 4.3 units per acre, and multifamily was built 23 units per acre.
• 1981 to 2000. Housing was built at just 2.3 units per acre on average. Single-family housing averaged 3.7 units per acre, and multifamily averaged 20 units per acre.
• 2001 to 2010. Housing density averaged just 2.1 units per acre with single-family being built at 3.4 units per acre and multifamily at 19 units per acre.
• 2011 to 2018. For the first time in nearly 75 years, nearly all categories of housing built averaged a higher number of units per acre. Overall density increased to 3 units per acre, single-family increased to nearly 4 units per acre, and multifamily increased to 24 units per acre.
Table 2 on the following page shows the average housing density for houses built 2011 to 2018 by product type for all subareas. In spite of the increase in multifamily development, the city remains primarily low density with a gradient decreasing from the central subarea to the urban and rural subareas respectively.
Oklahoma City Housing Market Study
32
Table 1. Average Density of Housing Units over Time
Table 2. Average Density by Housing Type and Subarea
Pre-1945 1945 to 1980 1981-2000 2001-2010 2011-2018
UnitsSingle-Family 25,143 77,937 34,020 26,679 20,715Rural Residential 466 3,828 3,695 2,033 852Duplex, Triplex, Townhome 3,643 3,499 4,444 1,853 1,267Condominium 15 1,491 2,450 128 34Multifamily 2,714 27,829 17,830 4,426 7,992Total 31,981 114,584 62,439 35,119 30,860
AcresSingle-Family 4,757 17,980 9,250 7,827 5,499Rural Residential 1,800 13,584 16,200 8,781 4,011Duplex, Triplex, Townhome 292 321 303 106 76Condominium 1 87 156 7 1Multifamily 76 1,216 886 239 335Total 6,926 33,189 26,795 16,961 9,922
Density (Units / Ac.)Single-Family 5.3 units / ac. 4.3 units / ac. 3.7 units / ac. 3.4 units / ac. 3.8 units / ac.Rural Residential 0.3 units / ac. 0.3 units / ac. 0.2 units / ac. 0.2 units / ac. 0.2 units / ac.Duplex, Triplex, Townhome 12.5 units / ac. 10.9 units / ac. 14.6 units / ac. 17.4 units / ac. 16.7 units / ac.Condominium 17.9 units / ac. 17.1 units / ac. 15.7 units / ac. 19.5 units / ac. 39.1 units / ac.Multifamily 35.6 units / ac. 22.9 units / ac. 20.1 units / ac. 18.5 units / ac. 23.9 units / ac.Overall 4.6 units / ac. 3.5 units / ac. 2.3 units / ac. 2.1 units / ac. 3.1 units / ac.
Source: City of Oklahoma City; Economic & Planning Systems
Density by Period
Duplex / Townhome Multifamily
Single-Family (> 1/4 acre)
Single-Family (< 1/4 acre) Overall
Northwest-Rural (1) 22 units / ac. 2 units / ac. 6 units / ac. 6 units / ac.Northeast-Rural (3) 17 units / ac. 19 units / ac. 1 units / ac. 6 units / ac. 3 units / ac.Northwest-Urban (4) 17 units / ac. 20 units / ac. 3 units / ac. 6 units / ac. 6 units / ac.Southwest-Urban (5) 19 units / ac. 24 units / ac. 3 units / ac. 6 units / ac. 7 units / ac.Central (6) 15 units / ac. 25 units / ac. 5 units / ac. 7 units / ac. 8 units / ac.Northeast-Urban (7) 24 units / ac. 18 units / ac. 2 units / ac. 6 units / ac. 9 units / ac.Southwest-Rural (9) 14 units / ac. 3 units / ac. 2 units / ac. 6 units / ac. 5 units / ac.Southeast-Urban (10) 20 units / ac. 21 units / ac. 3 units / ac. 6 units / ac. 7 units / ac.Southeast-Rural (11) 1 units / ac. 6 units / ac. 2 units / ac.Downtown (13) 28 units / ac. 117 units / ac. 2 units / ac. 12 units / ac. 30 units / ac.Overall 20 units / ac. 27 units / ac. 2 units / ac. 6 units / ac. 6 units / ac.
Source: City of Oklahoma City; Economic & Planning Systems
Average DU/Acre, 2011-2018

Economic & Planning Systems, Inc.
193045-Housing Market Study Final Report_10-11-21 33
Housing Plans and Preferences
This chapter examines current residence types, future housing type preferences, plans for the future, likeliness to move, and locational preferences within the city. A comparison to the 2013 HMS Survey responses illustrates where and to what extent demand characteristics of the City’s residents have changed.
Interest in Housing Diversity
Interest in different housing types is the first perspective on residents’ future housing plans. Housing diversity is defined as an array of detached and attached housing types prevalent and not so prevalent in the city. To understand how to plan for evolving preferences, residents were asked in 2013 and 2020 what type of housing they currently live in and to rank the type of housing in which they would prefer to live.3
In both surveys, residents were allowed to select the same type of housing for any of the rankings (first, second, etc.), meaning that one could select ‘single-family’ for all ranks. While many residents did select ‘single-family’ for all of their preferences, the results below (Table 3 and Table 4) represent an aggregated distribution of the top two choices and reveal a greater diversity of housing type preferences than either currently exist or have been built in the last 10 years (see Figure 24).
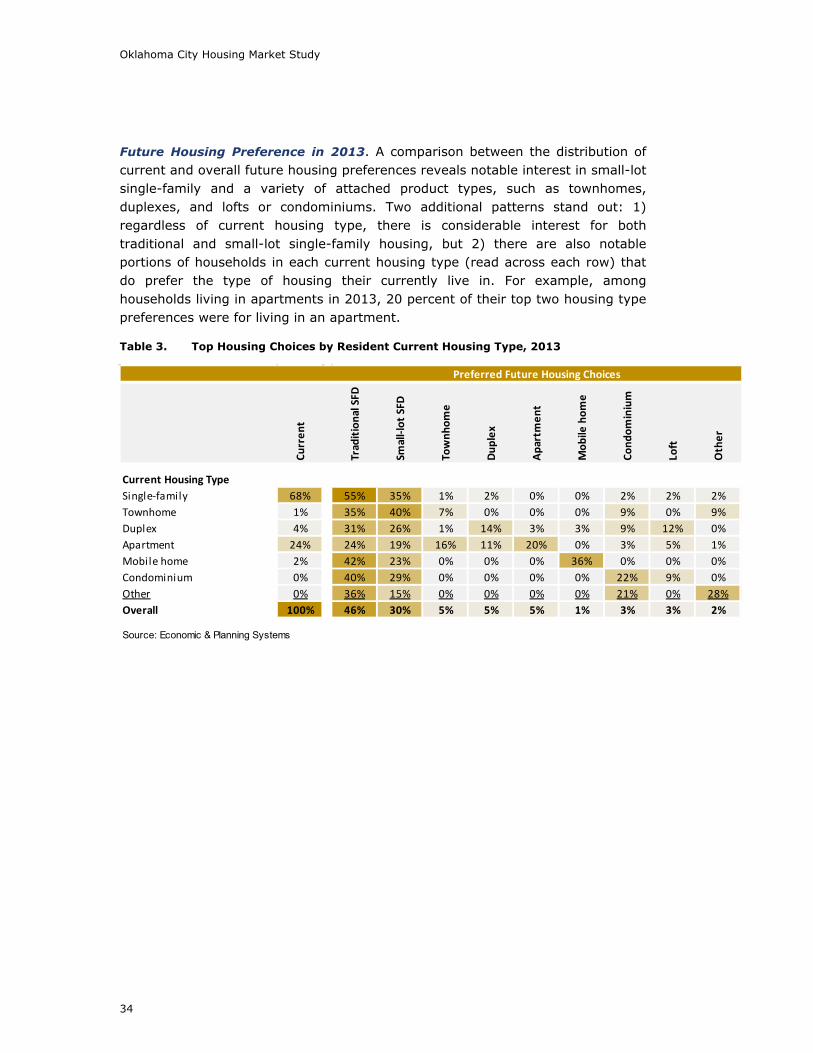
Each table illustrates the distribution of residents by their current housing type in the left-hand column. To the right is a distribution of the top two preferred housing choices for each subgroup of households. For example, Table 3 shows that 68 percent of households in the survey lived in a single-family home. Of that 68 percent, 55 percent of their top two choices were ‘single-family’, 35 percent were ‘small-lot single-family’, and small portions were other types. Small-lot single-family is defined as the minimum allowable under current code, 6,000 square feet.
3 In the 2013 survey, residents were asked to select their top two choices in rank order. In the 2020, because additional questions regarding other housing issues had added to its overall length and complexity, this particular question was abbreviated. It asked residents to select their top two housing choices but not rank them. A substantial portion of responses indicated a preference for only one type of housing. To ensure comparable weighting of the 2020 results to the 2013 results, single responses were weighted twice in the analysis.
Oklahoma City Housing Market Study
34
Future Housing Preference in 2013. A comparison between the distribution of current and overall future housing preferences reveals notable interest in small-lot single-family and a variety of attached product types, such as townhomes, duplexes, and lofts or condominiums. Two additional patterns stand out: 1) regardless of current housing type, there is considerable interest for both traditional and small-lot single-family housing, but 2) there are also notable portions of households in each current housing type (read across each row) that do prefer the type of housing their currently live in. For example, among households living in apartments in 2013, 20 percent of their top two housing type preferences were for living in an apartment.
Table 3. Top Housing Choices by Resident Current Housing Type, 2013
Curr
ent
Trad
ition
al S
FD
Smal
l-lot
SFD
Tow
nhom
e
Dupl
ex
Apar
tmen
t
Mob
ile h
ome
Cond
omin
ium
Loft
Oth
er
Current Housing TypeSingle-family 68% 55% 35% 1% 2% 0% 0% 2% 2% 2%Townhome 1% 35% 40% 7% 0% 0% 0% 9% 0% 9%Duplex 4% 31% 26% 1% 14% 3% 3% 9% 12% 0%Apartment 24% 24% 19% 16% 11% 20% 0% 3% 5% 1%Mobile home 2% 42% 23% 0% 0% 0% 36% 0% 0% 0%Condominium 0% 40% 29% 0% 0% 0% 0% 22% 9% 0%Other 0% 36% 15% 0% 0% 0% 0% 21% 0% 28%Overall 100% 46% 30% 5% 5% 5% 1% 3% 3% 2%
Source: Economic & Planning Systems
Preferred Future Housing Choices

Economic & Planning Systems, Inc.
35
Future Housing Preference in 2020. By 2020, some preferences seem to have evolved. A slightly larger portion of surveyed households were living in single-family units, townhomes, duplexes, and condominiums, whereas a smaller portion were living in apartments. Among future housing type choice, however, the preference for small-lot single-family seems to have declined and been replaced by noticeable increases in interest in townhomes and condominiums.
Table 4. Top Housing Choices by Resident Current Housing Type, 2020
Curr
ent
Trad
ition
al
SFD
Smal
l-lot
SFD
Tow
nhom
e
Dup
lex
Apar
tmen
t
Mob
ile h
ome
Cond
omin
ium
Loft
Oth
er
Current Housing TypeSingle-family 72% 54% 24% 6% 2% 3% 1% 4% 2% 6%Townhome 1% 21% 12% 38% 0% 17% 4% 4% 4% 0%Duplex 5% 33% 31% 7% 14% 5% 0% 5% 2% 3%Apartment 18% 32% 18% 11% 7% 18% 2% 7% 3% 1%Mobile home 1% 34% 18% 4% 0% 0% 36% 4% 0% 4%Condominium 1% 31% 18% 21% 3% 4% 0% 24% 0% 0%Other 1% 46% 8% 6% 6% 14% 0% 3% 6% 10%Overall 100% 48% 23% 7% 4% 6% 1% 5% 2% 5%
Source: Economic & Planning Systems
Preferred Future Housing Choices

Oklahoma City Housing Market Study
36
Comparison of 2013 and 2020 Preferences. To illustrate the significance of these shifts, Figure 23 shows overall preferences from Table 3 and Table 4. Considering the overall sample sizes (both surveys returned at least 2,300 responses) and the sampling within each subgroup, the results suggest an incremental shift in housing type preferences. While some shifts fall within margins of error, others are more substantial. Most notable are the shifts in townhome, condominium, and ‘other’. Among the ‘other’ responses, a text analysis reveals a few categories of housing types residents are looking for: large-lot single family, assisted living, independent living, retirement community, senior living, and patio homes.
Figure 23. Change in Preferred Future Housing Choices, 2013 and 2020
0% 10% 20% 30% 40% 50% 60%
Traditional SFD
Small-lot SFD
Townhome
Duplex
Apartment
Mobile home
Condominium
Loft
Other
Series1
Series2
2013
2020
Source: RRC Associates / Economic & Planning Systems, 2013 and 2020 Surveys
Z:\Shared\Projects\DEN\193045-Oklahoma City OK Housing Study\Data\[193045-Comparison of 2013 and 2020 Survey Findings-061821.xlsx]Table - Housing Prefs

Economic & Planning Systems, Inc.
37
Recent Development vs. Preferred Housing Types
While the previous discussion reveals something about the diversity of choices residents have made compared to the diversity of their preferences, the following examines what housing options residents actually had in the market for new residential construction. As noted in the analysis of housing types by year built (Table 1), the market has continuously trended toward lower density product types. Figure 24 compares the types of housing built in the last 10 years against resident preferences by type, and would indicate that there is greater demand for small-lot single-family, for example, than has been brought to the market.4
• Single-Family. The market built 63 percent traditional single-family and seven percent small-lot single-family, but resident preferences are split 43 percent traditional single-family and 25 percent small-lot single-family.
• Multifamily. While the market built 26 percent multifamily compared to 14 percent of resident housing preferences, there seemed to be alignment with duplex and triplex preferences and a potential unmet demand for townhomes.
Figure 24. Recent Development vs. Preferred Housing Types
4 This analysis uses County Assessor parcel data so that traditional single-family and small-lot single-family could be differentiated from one another. The findings of this analysis differ from the findings of the analysis of building permit data in the HAS, because building permit data does not consistently contain an indicator of lot size.
63%
7%
26%
4%< 1% < 1%
48%
23%
13%
4%7% 6%
Traditional SFD Small-lot SFD Apartment /Condo / Loft
Duplex / Triplex Townhome Mobile Home,Other
Housing Built in Last 10 Years
Preferred Housing Choice in Next 5 Years
Source: Oklahoma City Planning Department; Economic & Planning Systems
Z:\Shared\Projects\DEN\193045-Oklahoma City OK Housing Study\Data\[193045-Parcel Densities.xlsx]Table - Recent vs. Preferred
[Note 1] Defined as a lot size of 6,000 square feet, the minimum allowable under current code.
[1]
Oklahoma City Housing Market Study
38
Current vs. Preferred Location
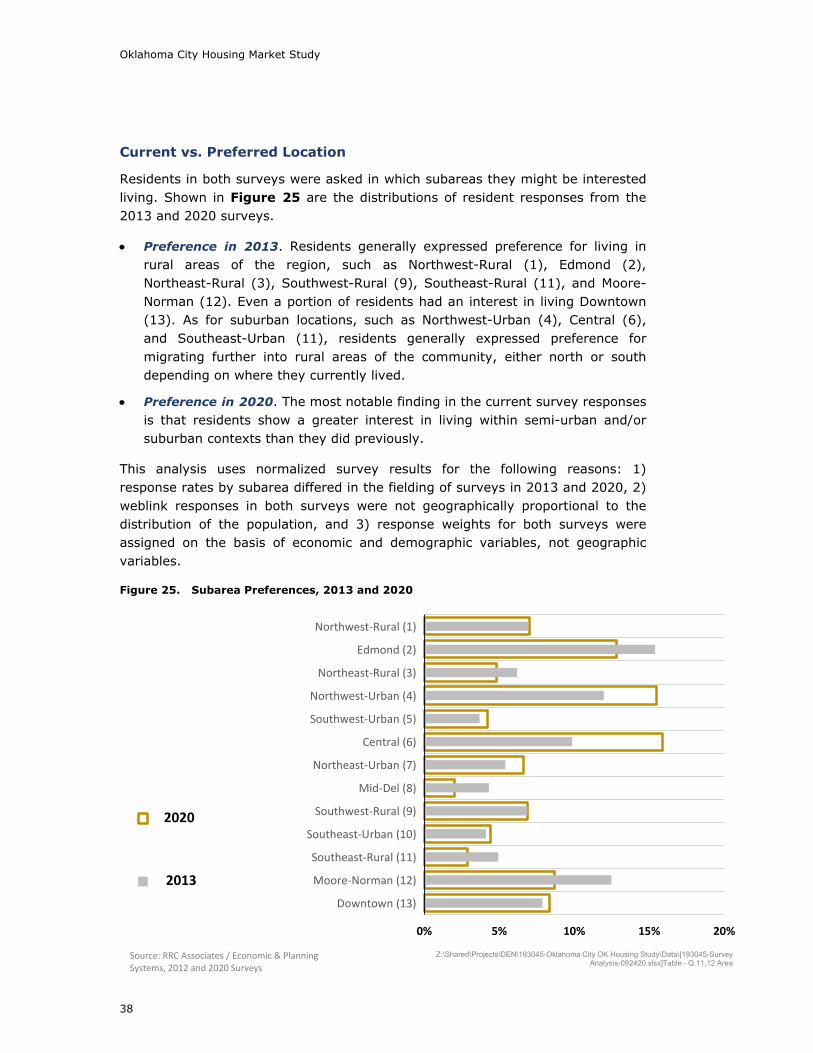
Residents in both surveys were asked in which subareas they might be interested living. Shown in Figure 25 are the distributions of resident responses from the 2013 and 2020 surveys.
• Preference in 2013. Residents generally expressed preference for living in rural areas of the region, such as Northwest-Rural (1), Edmond (2), Northeast-Rural (3), Southwest-Rural (9), Southeast-Rural (11), and Moore-Norman (12). Even a portion of residents had an interest in living Downtown (13). As for suburban locations, such as Northwest-Urban (4), Central (6), and Southeast-Urban (11), residents generally expressed preference for migrating further into rural areas of the community, either north or south depending on where they currently lived.
• Preference in 2020. The most notable finding in the current survey responses is that residents show a greater interest in living within semi-urban and/or suburban contexts than they did previously.
This analysis uses normalized survey results for the following reasons: 1) response rates by subarea differed in the fielding of surveys in 2013 and 2020, 2) weblink responses in both surveys were not geographically proportional to the distribution of the population, and 3) response weights for both surveys were assigned on the basis of economic and demographic variables, not geographic variables.
Figure 25. Subarea Preferences, 2013 and 2020
0% 5% 10% 15% 20%
Northwest-Rural (1)
Edmond (2)
Northeast-Rural (3)
Northwest-Urban (4)
Southwest-Urban (5)
Central (6)
Northeast-Urban (7)
Mid-Del (8)
Southwest-Rural (9)
Southeast-Urban (10)
Southeast-Rural (11)
Moore-Norman (12)
Downtown (13)
Series2
Series1
2020
2013
Source: RRC Associates / Economic & Planning Systems, 2012 and 2020 Surveys
Z:\Shared\Projects\DEN\193045-Oklahoma City OK Housing Study\Data\[193045-Survey Analysis-092420.xlsx]Table - Q.11,12 Area

Economic & Planning Systems, Inc.
39
Table 5 shows the detail within the 2019/2020 responses above. It shows the distribution of responses by current location and top choice of preferred location. As noted above, smaller portions of residents expressed an interest in living in Edmond and Moore-Norman, but showed that a greater portion of residents living in the central subareas might prefer to live in Northwest-Urban (4) or Central (6). (These results are displayed as raw results, not normalized as in the previous analysis.)
Table 5. First Choice for Where Residents Would Like to Live, 2020
Curr
ent
Nor
thw
est-
Rura
l (1)
Edm
ond
(2)
Nor
thea
st-R
ural
(3)
Nor
thw
est-
Urb
an (4
)
Sout
hwes
t-U
rban
(5)
Cent
ral (
6)
Nor
thea
st-U
rban
(7)
Mid
-Del
(8)
Sout
hwes
t-Ru
ral (
9)
Sout
heas
t-U
rban
(10)
Sout
heas
t-Ru
ral (
11)
Moo
re-N
orm
an (1
2)
Dow
ntow
n (1
3)
Where Residents LiveNorthwest-Rural (1) 2% 36% 17% 9% 10% 2% 12% 7% 0% 4% 0% 0% 0% 4%Edmond (2) 3% 5% 36% 6% 28% 0% 6% 14% 0% 0% 2% 0% 0% 3%Northeast-Rural (3) 2% 4% 28% 27% 7% 0% 15% 12% 0% 0% 0% 2% 0% 5%Northwest-Urban (4) 28% 12% 20% 5% 36% 3% 11% 4% 1% 1% 0% 1% 1% 6%Southwest-Urban (5) 9% 9% 6% 4% 26% 21% 14% 1% 1% 13% 1% 1% 2% 0%Central (6) 21% 1% 6% 4% 18% 4% 36% 8% 1% 2% 1% 1% 1% 16%Northeast-Urban (7) 7% 1% 10% 6% 14% 0% 15% 29% 9% 0% 1% 3% 4% 6%Mid-Del (8) 2% 4% 8% 0% 33% 3% 15% 2% 9% 4% 2% 0% 10% 9%Southwest-Rural (9) 4% 13% 6% 0% 7% 7% 5% 0% 0% 29% 4% 7% 18% 5%Southeast-Urban (10) 17% 2% 9% 1% 8% 5% 6% 2% 2% 14% 25% 8% 17% 1%Southeast-Rural (11) 2% 2% 14% 0% 4% 6% 4% 2% 2% 17% 4% 14% 26% 4%Moore-Norman (12) 2% 0% 2% 0% 7% 2% 21% 2% 0% 2% 12% 2% 33% 18%Downtown (13) 3% 3% 4% 0% 3% 3% 45% 4% 0% 3% 6% 0% 0% 30%Overall 100% 6% 12% 4% 21% 5% 17% 6% 2% 6% 5% 3% 6% 7%
Source: Economic & Planning Systems
1st Choice for Where Residents Would Like to Live

Oklahoma City Housing Market Study
40
Plans in Next 1 to 5 Years
This section of the chapter illustrates resident plans to move by tenure and by age category, as well as comparisons between responses in 2013 and 2020.
Likeliness of Moving in Next 1 to 5 Years by Tenure. The portion of residents very likely to move in the next 1 to 5 years is down to 27 percent in 2020 from 35 percent in 2013. Among both owners and renters, the portion very likely to move has dropped, although the portion of those indicating they are somewhat likely to move has increased.
Figure 26. Plans to Move in Next 1 to 5 Years by Tenure, 2013
Figure 27. Plans to Move in Next 1 to 5 Years by Tenure, 2020
47%
11%
34%
13%
8%
11%
19%
22%
20%
20%
60%
35%
Owner
Renter
Overall
Very unlikely Somewhat unlikely Somewhat likely Very likelySource: Economic & Planning Systems Z:\Shared\Projects\DEN\193045-Oklahoma City OK Housing Study\Data\[193045-Survey Analysis-092420.xlsx]Table - Q.4,18
44%
15%
33%
21%
12%
18%
22%
25%
23%
13%
47%
27%
Owner
Renter
Overall
Very unlikely Somewhat unlikely Somewhat likely Very likelySource: Economic & Planning Systems Z:\Shared\Projects\DEN\193045-Oklahoma City OK Housing Study\Data\[193045-Survey Analysis-092420.xlsx]Table - Q.4,18

Economic & Planning Systems, Inc.
41
Likeliness of Moving in Next 1 to 5 Years by Age. Figure 28 and Figure 29 illustrate likeliness to move by age category. Interesting among these findings is that the portion of residents under 35 years is relatively unchanged, whereas the level of uncertainty (somewhat likely or unlikely) among the older populations has increased. For example, the portion of residents 35 to 64 years old saying they were somewhat unlikely or likely to move increased to 47 percent from 32 percent in 2013. Also, the portion of residents 65 years or over in this uncertain category increased to nearly 40 percent from 30 percent in 2013 (the flip side is that just 49 percent of this age group was very unlikely to move in the next 1 to 5 years compared to 59 percent in 2013).
Figure 28. Plans to Move in Next 1 to 5 Years by Age, 2013
Figure 29. Plans to Move in Next 1 to 5 Years by Age, 2020
16%
45%
59%
34%
8%
14%
13%
11%
23%
18%
17%
20%
54%
23%
10%
35%
Under35
35 to 64
65 andover
Overall
Very unlikely Somewhat unlikely Somewhat likely Very likelySource: Economic & Planning Systems Z:\Shared\Projects\DEN\193045-Oklahoma City OK Housing Study\Data\[193045-Survey Analysis-092420.xlsx]Table - Q.4,18
13%
29%
49%
32%
9%
19%
21%
17%
22%
28%
18%
24%
56%
24%
12%
27%
Under35
35 to 64
65 andover
Overall
Very unlikely Somewhat unlikely Somewhat likely Very likelySource: Economic & Planning Systems Z:\Shared\Projects\DEN\193045-Oklahoma City OK Housing Study\Data\[193045-Survey Analysis-092420.xlsx]Table - Q.4,18

Oklahoma City Housing Market Study
42
Where Likeliest of Moving in Next 1 to 5 Years by Tenure. Residents were asked also where (inside versus outside the region) they were likely to move in the next 1 to 5 years. The results, shown in Figure 30 and Figure 31, do not reveal dramatic shifts in plans to move to either. As with the broader likeliness to move presented above, there are slightly smaller portions of owners and renters that are likely to stay in their current home (comparing 2013 against 2020 results). On the other hand, there are larger portions of residents who indicated they “don’t know” in 2020 compared to 2013.
Figure 30. Where Likely to Move in Next 1 to 5 Years by Tenure, 2013
Figure 31. Where Likely to Move in Next 1 to 5 Years by Tenure, 2020
61%
19%
46%
22%
49%
31%
10%
21%
14%
7%
11%
8%
Owner
Renter
Overall
Stay in current home Move within OKC Move out of OKC Don't knowSource: Economic & Planning Systems Z:\Shared\Projects\DEN\193045-Oklahoma City OK Housing Study\Data\[193045-Survey Analysis-092420.xlsx]Table - Q.4,18
54%
16%
39%
19%
54%
33%
15%
14%
15%
12%
16%
13%
Owner
Renter
Overall
Stay in current home Move within OKC Move out of OKC Don't knowSource: Economic & Planning Systems Z:\Shared\Projects\DEN\193045-Oklahoma City OK Housing Study\Data\[193045-Survey Analysis-092420.xlsx]Table - Q.4,19

Economic & Planning Systems, Inc.
43
Where Likeliest of Moving in Next 1 to 5 Years by Tenure. Residents were asked also where (inside versus outside the region) they were likely to move in the next 1 to 5 years. The results, shown in Figure 32 and Figure 33, do not reveal dramatic shifts in plans to move to either. As with the broader likeliness to move presented above, there are slightly smaller portions of owners and renters that are likely to stay in their current home (comparing 2013 against 2020 results). On the other hand, there are larger portions of residents who indicated they “don’t know” in 2020 compared to 2013.
Figure 32. Where Likely to Move in Next 1 to 5 Years by Age, 2013
Figure 33. Where Likely to Move in Next 1 to 5 Years by Age, 2020
26%
59%
71%
46%
44%
24%
16%
32%
20%
10%
7%
14%
10%
7%
6%
8%
Under35
35 to 64
65 andover
Overall
Very unlikely Somewhat unlikely Somewhat likely Very likelySource: Economic & Planning Systems Z:\Shared\Projects\DEN\193045-Oklahoma City OK Housing Study\Data\[193045-Survey Analysis-092420.xlsx]Table - Q.4,18
11%
37%
59%
38%
53%
36%
17%
34%
21%
14%
11%
15%
15%
13%
14%
14%
Under35
35 to 64
65 andover
Overall
Stay in current home Move within OKC Move out of OKC Don't knowSource: Economic & Planning Systems Z:\Shared\Projects\DEN\193045-Oklahoma City OK Housing Study\Data\[193045-Survey Analysis-092420.xlsx]Table - Q.4,18