Embed Size (px)
Citation preview

HOUSING ELEMENT
Data, Inventory & Analysis
2030 Planning Horizon


Housing Element
Data, Inventory & Analysis
i
TABLE OF CONTENTS
HOUSING DATA INVENTORY AND A NALYSIS, 9J -5.010, F .A.C. . . . . . . . . . . . . . . . . . . . . . . . . . . . . . . . . . . . . . . . . . 1
OVERVIEW OF LAKE COUNTY . . . . . . . . . . . . . . . . . . . . . . . . . . . . . . . . . . . . . . . . . . . . . . . . . . . . . . . . . . . . . . . . . . . . . . . . . . . . . . . . . . . . . 1
DIVERS ITY & POPU LA TI ON . . . . . . . . . . . . . . . . . . . . . . . . . . . . . . . . . . . . . . . . . . . . . . . . . . . . . . . . . . . . . . . . . . . . . . . . . . . . . . . . . . . . . . . . . . . . . . . . . . . . . . . 1
DIVERS ITY IN TH E COUN TY A ND WH ERE I S IT PREVA LEN T . . . . . . . . . . . . . . . . . . . . . . . . . . . . . . . . . . . . . . . . . . . . . . . . . . . . . . . . . . . . . . . 4
A COUNTY – STA TE COMPAR ISON . . . . . . . . . . . . . . . . . . . . . . . . . . . . . . . . . . . . . . . . . . . . . . . . . . . . . . . . . . . . . . . . . . . . . . . . . . . . . . . . . . . . . . . . . . . . . . 4
INCOME DISTRIBU TION S . . . . . . . . . . . . . . . . . . . . . . . . . . . . . . . . . . . . . . . . . . . . . . . . . . . . . . . . . . . . . . . . . . . . . . . . . . . . . . . . . . . . . . . . . . . . . . . . . . . . . . . . . . 5
Housing Stock .......................................................................................................................................................................... 6
DATA INVENTORY & ANALYSIS . . . . . . . . . . . . . . . . . . . . . . . . . . . . . . . . . . . . . . . . . . . . . . . . . . . . . . . . . . . . . . . . . . . . . . . . . . . . . . . . . . 8
COMPARISON OF HOU SIN G C HARACTERISTICS: . . . . . . . . . . . . . . . . . . . . . . . . . . . . . . . . . . . . . . . . . . . . . . . . . . . . . . . . . . . . . . . . . . . . . . . . . . . . . 8
A Regional Perspective ............................................................................................................................................................ 9
PROJECT ION OF HOU SEHOLD S 2025 . . . . . . . . . . . . . . . . . . . . . . . . . . . . . . . . . . . . . . . . . . . . . . . . . . . . . . . . . . . . . . . . . . . . . . . . . . . . . . . . . . . . . . . . . . 11
TENUR E OF HABITABLE H OMES . . . . . . . . . . . . . . . . . . . . . . . . . . . . . . . . . . . . . . . . . . . . . . . . . . . . . . . . . . . . . . . . . . . . . . . . . . . . . . . . . . . . . . . . . . . . . . . . . 11
THE VALUES OF HOMES IN THE COUN TY . . . . . . . . . . . . . . . . . . . . . . . . . . . . . . . . . . . . . . . . . . . . . . . . . . . . . . . . . . . . . . . . . . . . . . . . . . . . . . . . . . . . . 13
AGE OF HOU SING STOCK IN THE COUN TY . . . . . . . . . . . . . . . . . . . . . . . . . . . . . . . . . . . . . . . . . . . . . . . . . . . . . . . . . . . . . . . . . . . . . . . . . . . . . . . . . . . 15
LEAD -BASED PA INT HOU SIN G . . . . . . . . . . . . . . . . . . . . . . . . . . . . . . . . . . . . . . . . . . . . . . . . . . . . . . . . . . . . . . . . . . . . . . . . . . . . . . . . . . . . . . . . . . . . . . . . . . 16
RENTA L HOUSING IN TH E COUNTY . . . . . . . . . . . . . . . . . . . . . . . . . . . . . . . . . . . . . . . . . . . . . . . . . . . . . . . . . . . . . . . . . . . . . . . . . . . . . . . . . . . . . . . . . . . . 16
OWNER OCCUPIED HOU SI NG IN THE COUNTY . . . . . . . . . . . . . . . . . . . . . . . . . . . . . . . . . . . . . . . . . . . . . . . . . . . . . . . . . . . . . . . . . . . . . . . . . . . . . . 20
SUBSTANDARD HOUSING IN THE COUN TY . . . . . . . . . . . . . . . . . . . . . . . . . . . . . . . . . . . . . . . . . . . . . . . . . . . . . . . . . . . . . . . . . . . . . . . . . . . . . . . . . . . 25
AFFORDAB LE R ENTA L AN D H OME OWN ER SHIP PRO GRAMS IN TH E COUN TY . . . . . . . . . . . . . . . . . . . . . . . . . . . . . . . . . . . . . . . . 28
Section 8 Housing Choice Voucher Program ........................................................................................................................... 28
Poverty Guidelines and Income Distribution in Lake County ................................................................................................. 30
IMPEDIMEN TS TO FA IR HOU SING CHOICE . . . . . . . . . . . . . . . . . . . . . . . . . . . . . . . . . . . . . . . . . . . . . . . . . . . . . . . . . . . . . . . . . . . . . . . . . . . . . . . . . . . 30
HISTORIC HOU SIN G . . . . . . . . . . . . . . . . . . . . . . . . . . . . . . . . . . . . . . . . . . . . . . . . . . . . . . . . . . . . . . . . . . . . . . . . . . . . . . . . . . . . . . . . . . . . . . . . . . . . . . . . . . . . . . . 33
Group Homes ......................................................................................................................................................................... 34
MOBILE H OME PARK S . . . . . . . . . . . . . . . . . . . . . . . . . . . . . . . . . . . . . . . . . . . . . . . . . . . . . . . . . . . . . . . . . . . . . . . . . . . . . . . . . . . . . . . . . . . . . . . . . . . . . . . . . . . . 35
HOUSING NEEDS……………………………………………………………………………………..35
APPENDIX A . . . . . . . . . . . . . . . . . . . . . . . . . . . . . . . . . . . . . . . . . . . . . . . . . . . . . . . . . . . . . . . . . . . . . . . . . . . . . . . . . . . . . . . . . . . . . . . . . . . . . . . . . 63
TERMS DEFIN ED . . . . . . . . . . . . . . . . . . . . . . . . . . . . . . . . . . . . . . . . . . . . . . . . . . . . . . . . . . . . . . . . . . . . . . . . . . . . . . . . . . . . . . . . . . . . . . . . . . . . . . . . . . . . . . . . . . . . 63
APPENDIX B. MOBILE HOME PARKS IN LAKE COUNTY . . . . . . . . . . . . . . . . . . . . . . . . . . . . . . . . . . . . . . . . . . . . . . . . . 65

Lake County, Florida
Planning Horizon 2030
ii
Housing Element
Data, Inventory & Analysis
iii
LIST OF TABLES
Table 1 - Lake County Population Projections by Municipality 2000-2030 .......................................................................................... 3
Table 2 - Ethnic Distribution in Occupied Dwelling Units ..................................................................................................................... 4
Table 3 - Lake County & State Comparisons ....................................................................................................................................... 4
Table 4 - Ranking of Regional Counties by Count of Habitable Dwelling Units .................................................................................. 10
Table 5 - Projection of Households based on Historic Trends 1980-2030 .......................................................................................... 11
Table 6 - Tenure for Dwelling Units All Places, Lake County, 2000 ................................................................................................... 12
Table 7 - Tenure for Dwelling Units, Lake County, 2000 ................................................................................................................... 13
Table 8 - Median Value of Dwelling Units in Lake County, 2000 ....................................................................................................... 14
Table 9 - Distribution of Rental Rates in Lake County, 2000 ............................................................................................................. 16
Table 10 - Median Rent by Place. (Sorted by median rent high to low) ............................................................................................ 17
Table 11 - Percentage of Total Household (H/H) Income Used to Pay Rent. (Sorted by >50%) ........................................................ 18
Table 12 - Renter Costs as Percentage of Household Income, 1999.................................................................................................. 19
Table 13 - Count of Owner-Occupied Dwelling Units by Value and Place, 2000 ................................................................................. 20
Table 14 - Count of Top 5 Owner-Occupied Dwelling Units by Value and Place ................................................................................. 21
Table 15 - Monthly Costs of Owner-Occupied Dwelling Units by Place, Lake County, 2000 .............................................................. 21
Table 16 - Distribution of Owner Costs in Lake County, 2000 ........................................................................................................... 23
Table 17 - Owner Costs as Percentage of Household Income, 1999.................................................................................................. 23
Table 18 - Overcrowded Owner and Renter Occupied Dwelling Units by Municipality, 2000 ............................................................. 28
Table 19 - Allocation of SHIP Resources, 2008-2009 ........................................................................................................................ 29
Table 20 - Income Levels for a Typical Family of Four, 2000 ............................................................................................................ 29
Table 21 - Income Levels for a Typical Family of Four, 2009 ............................................................................................................ 29
Table 22 - Lake County Income Distributions, 1990 vs. 2000 ........................................................................................................... 30
Table 23 – List of Historic Sites in Lake County ............................................................................................................................... 33
Table 24 - Lake County Group Homes .............................................................................................................................................. 34
Table 25 - Lake County Housing Agency Waiting List Information .................................................................................................... 36
Table 26 – Household Types with Disproportionate Needs .............................................................................................................. 39
Table 27 – Priority Housing Needs .................................................................................................................................................. 40
Table 28 – Housing Problems Output for Hispanic Households ........................................................................................................ 41
Table 29 – Housing Problems for Black Non-Hispanic Households ................................................................................................... 42
Table 30 – Housing Problems Output for White Non-Hispanic Households ....................................................................................... 43
Table 31 – Housing Market Characteristics – Action Steps and Strategies ...................................................................................... 44
Table 32 - Lake County’s Housing Supply, 2000 ............................................................................................................................... 45
Table 33 – Vacancy Rates ................................................................................................................................................................ 45

Lake County, Florida
Planning Horizon 2030
iv
Table 34 – Census Substandard Criteria .......................................................................................................................................... 46
Table 35 – Units Available for Persons with Disabilities ................................................................................................................. 49
Table 36 – Units Targeted for Elderly Citizens and Families ........................................................................................................... 51
Table 37 – Housing Market Influences Rental, Production, Rehabilitation, or Acquisition ................................................................ 52
Table 38 – 2004-2010 Federal Fund Utilization ............................................................................................................................... 53
Table 39 – Federal, State, Local and Private Sector Resources ........................................................................................................ 53
Table 40 - Lake County Public Housing Units .................................................................................................................................... 53
Table 41 - Lake County Housing Agency Waiting List Information .................................................................................................... 54
Table 42 - Lake County Housing Agency’s Strategy .......................................................................................................................... 55
Table 43 – Public Policies that Pose Barriers ................................................................................................................................... 56
Table 44 – Public Policies that Pose Barriers ................................................................................................................................... 61
Table 45 – Mobile Home Parks in Lake County ................................................................................................................................ 65
Housing Element
Data, Inventory & Analysis
v
LIST OF FIGURES
Figure 1 - Lake County Diversity 2000 ............................................................................................................................................... 1
Figure 2 - Population Age Cohorts ..................................................................................................................................................... 2
Figure 3 - Lake County Population Trends, 2000-2030 ....................................................................................................................... 2
Figure 4 and Figure 5 - Lake County Cumulative Income Distribution Percentages, 1990 vs. 2000 .................................................... 5
Figure 6 - Income by Race in 1999 .................................................................................................................................................... 6
Figure 7 - State of Florida Income by Race in 1999 ........................................................................................................................... 6
Figure 8 - Count of dwelling units by Value, 2000 .............................................................................................................................. 7
Figure 9 - Affordable Housing Projected Construction Need (source: Shimberg Center) ...................................................................... 8
Figure 10 and Figure 11 - Lake County Dwelling Units by Type, 2000 ................................................................................................ 9
Figure 12 - Lake County Share of Regional Dwelling Units by Types, 2000 ........................................................................................ 9
Figure 13 - Dwelling Units by Type by County for Central Florida Region, Census 1980 ................................................................... 10
Figure 14 - Increases in Dwelling Units by Type by County for Central Florida Region, from 1980 to 2000 ...................................... 11
Figure 15 - Value of Dwelling Units in Lake County, Owner-Occupied Distribution, 2000 ................................................................. 14
Figure 16 - Age of Housing Stock, 2000 ............................................................................................................................................ 15
Figure 17 - Age of Housing Stock Occupied by Persons Below Poverty ............................................................................................ 16
Figure 18 - Occupied housing units (Owner and Renter) Lacking Plumbing Facilities. 2000 .............................................................. 25
Figure 19 - Occupied housing units (Owner and Renter) Lacking Kitchen Facilities, 2000 ................................................................. 26
Figure 20 and Figure 21 - Lake County Owner & Renter Occupied Unheated Homes as of 2000 Census ........................................... 27
Figure 22 - Lake County Projected Construction Demand ................................................................................................................. 36
Figure 23 - Lake County Cost Burden by Income .............................................................................................................................. 37
Figure 24 - Lake County Cost Burden 2000-2025 .............................................................................................................................. 37
Figure 25 - Lake County Owner & Renter Occupied Unheated Homes as of 2000 Census ................................................................. 38
Figure 26 – Projected Construction Need by Type............................................................................................................................ 45
Figure 27- Lake County Age of Housing Stock .................................................................................................................................. 46
Figure 28 - Lake County Owner & Renter Occupied Unheated Homes as of 2000 Census ................................................................. 47
Figure 29 - Lake County Renter Housing Costs ................................................................................................................................. 47
Figure 30 - Lake County Housing Values .......................................................................................................................................... 48
Figure 31 - Lake County Median Sale Prices by Year ........................................................................................................................ 48
Figure 32 - Lake County Low/Moderate Income & Areas of Minority Concentration by Block Group ................................................. 49

Lake County, Florida
Planning Horizon 2030
vi

Housing Element
Data, Inventory & Analysis
1
White83%
Black8%
Latino5%
Other4%
Diversity in Lake County
HOUSING DATA INVENTORY AND ANALYSIS, 9J-5.010, F.A.C.
The purpose of the Housing Element is to identify where surpluses and deficits exist in the current and future County housing supply and to develop the appropriate plans and policies which will guide the production of the quantity and types of housing units necessary to meet the identified demand. The Housing Element consists of two sections: a Data Inventory and Analysis (DIA) section; and a Goals, Objectives and Policies (GOPs) section. Below is the DIA section. The GOPs (found under separate cover) will be developed from the data presented here and will provide the actual methods to implement the strategies to achieve the housing goals of Lake County. Unless otherwise noted, all data discussed and described herein was obtained from the 2000 U.S. Census (www.factfinder.census.gov). All data, charts, and tables obtained from the U.S. Census will be updated when the 2010 data is available.
OVERVIEW OF LAKE COUNTY
DIVERSITY & POPULATION
Census 2000 showed that of the 67 counties within the state of Florida, Lake County was ranked 21st in total population with a total of 210,528 full time residents. Figure 1 provides a detailed breakdown by Race and Hispanic ethnicity of the population of the County. Please note that the sum of the various races in the figure below exceeds the total County population because Latinos are not a homogeneous racial group.
Figure 1 - Lake County Diversity 2000
White 184,138 Black 17,503 Latino 11,808 Other 8,887
Source: U. S. Bureau of the Census, Census 2000 Prepared by Lake County Planning and Community Design, 2008
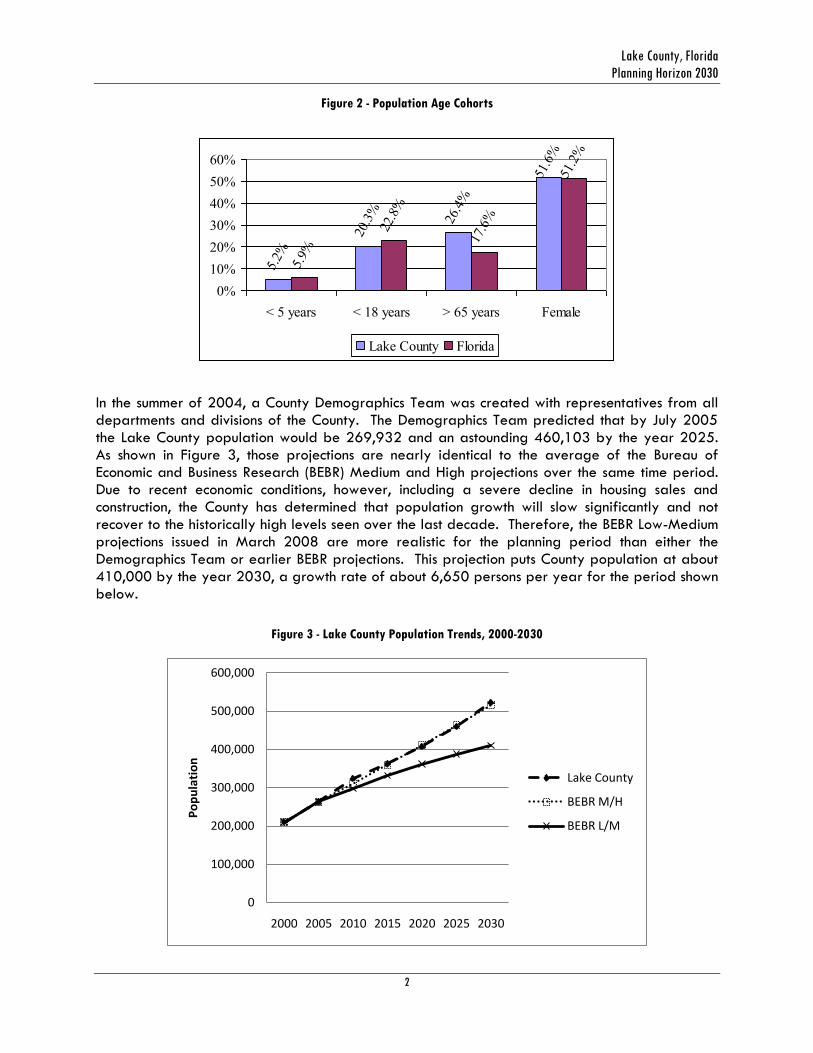
Of the 210,528 residents in the County, approximately 20% are under the age of 18 years and an additional 26% are over the age of 65, while women comprise 51.6% of the population at 108,632 (see Figure 2).
Lake County, Florida
Planning Horizon 2030
2
5.2%
20.3
%
26.4
%
51.6
%
5.9%
22.8
%
17.6
%
51.2
%
0%
10%
20%
30%
40%
50%
60%
< 5 years < 18 years > 65 years Female
Lake County Florida
0
100,000
200,000
300,000
400,000
500,000
600,000
2000 2005 2010 2015 2020 2025 2030
Po
pu
lati
on
Lake County
BEBR M/H
BEBR L/M
Figure 2 - Population Age Cohorts
In the summer of 2004, a County Demographics Team was created with representatives from all departments and divisions of the County. The Demographics Team predicted that by July 2005 the Lake County population would be 269,932 and an astounding 460,103 by the year 2025. As shown in Figure 3, those projections are nearly identical to the average of the Bureau of Economic and Business Research (BEBR) Medium and High projections over the same time period. Due to recent economic conditions, however, including a severe decline in housing sales and construction, the County has determined that population growth will slow significantly and not recover to the historically high levels seen over the last decade. Therefore, the BEBR Low-Medium projections issued in March 2008 are more realistic for the planning period than either the Demographics Team or earlier BEBR projections. This projection puts County population at about 410,000 by the year 2030, a growth rate of about 6,650 persons per year for the period shown below.
Figure 3 - Lake County Population Trends, 2000-2030
Housing Element
Data, Inventory & Analysis
3
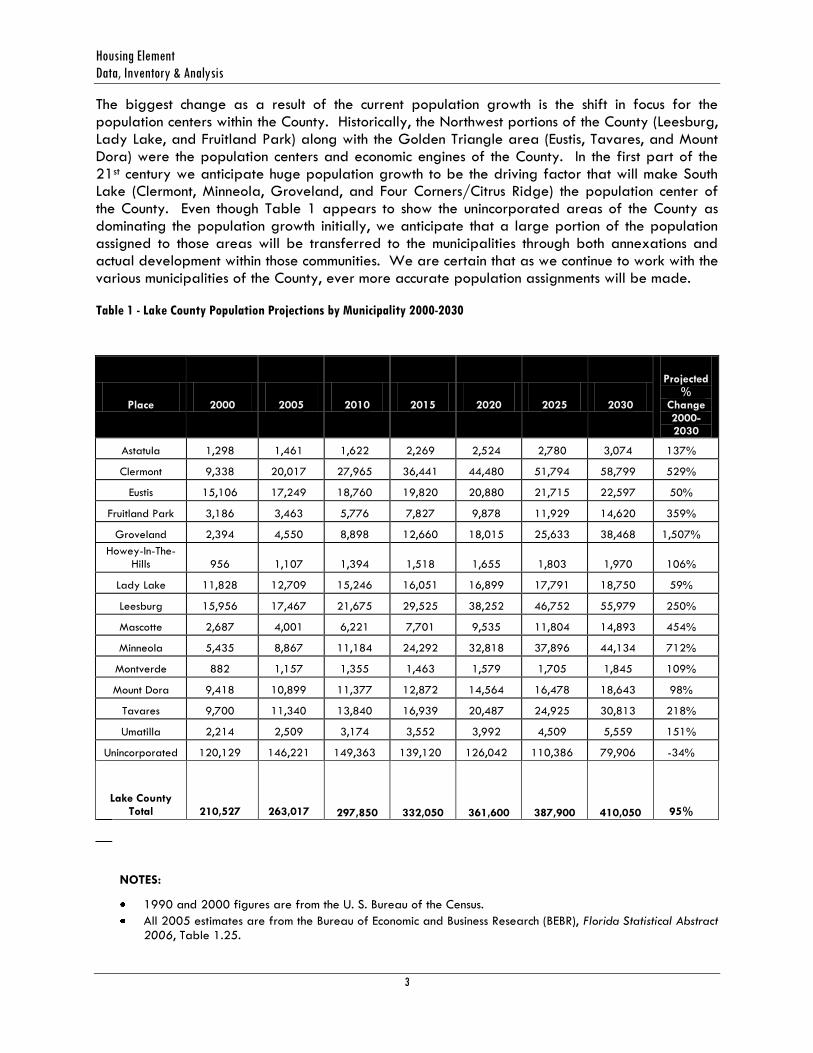
The biggest change as a result of the current population growth is the shift in focus for the population centers within the County. Historically, the Northwest portions of the County (Leesburg, Lady Lake, and Fruitland Park) along with the Golden Triangle area (Eustis, Tavares, and Mount Dora) were the population centers and economic engines of the County. In the first part of the 21st century we anticipate huge population growth to be the driving factor that will make South Lake (Clermont, Minneola, Groveland, and Four Corners/Citrus Ridge) the population center of the County. Even though Table 1 appears to show the unincorporated areas of the County as dominating the population growth initially, we anticipate that a large portion of the population assigned to those areas will be transferred to the municipalities through both annexations and actual development within those communities. We are certain that as we continue to work with the various municipalities of the County, ever more accurate population assignments will be made.
Table 1 - Lake County Population Projections by Municipality 2000-2030
Place 2000 2005 2010 2015 2020 2025 2030
Projected %
Change 2000-2030
Astatula 1,298 1,461 1,622 2,269 2,524 2,780 3,074 137%
Clermont 9,338 20,017 27,965 36,441 44,480 51,794 58,799 529%
Eustis 15,106 17,249 18,760 19,820 20,880 21,715 22,597 50%
Fruitland Park 3,186 3,463 5,776 7,827 9,878 11,929 14,620 359%
Groveland 2,394 4,550 8,898 12,660 18,015 25,633 38,468 1,507%
Howey-In-The-Hills 956 1,107 1,394 1,518 1,655 1,803 1,970 106%
Lady Lake 11,828 12,709 15,246 16,051 16,899 17,791 18,750 59%
Leesburg 15,956 17,467 21,675 29,525 38,252 46,752 55,979 250%
Mascotte 2,687 4,001 6,221 7,701 9,535 11,804 14,893 454%
Minneola 5,435 8,867 11,184 24,292 32,818 37,896 44,134 712%
Montverde 882 1,157 1,355 1,463 1,579 1,705 1,845 109%
Mount Dora 9,418 10,899 11,377 12,872 14,564 16,478 18,643 98%
Tavares 9,700 11,340 13,840 16,939 20,487 24,925 30,813 218%
Umatilla 2,214 2,509 3,174 3,552 3,992 4,509 5,559 151%
Unincorporated 120,129 146,221 149,363 139,120 126,042 110,386 79,906 -34%
Lake County Total 210,527 263,017
297,850
332,050
361,600
387,900
410,050 95%
NOTES:
1990 and 2000 figures are from the U. S. Bureau of the Census.
All 2005 estimates are from the Bureau of Economic and Business Research (BEBR), Florida Statistical Abstract 2006, Table 1.25.

Lake County, Florida
Planning Horizon 2030
4
Lake County total population is the Low-Medium ((L+M)/2) projection from BEBR, Projections of Florida Population by County, 2007 – 2035, Florida Population Studies Volume 41, Bulletin 150, March, 2008.
Unincorporated County population equals Total minus the sum of the municipalities.
Projections for Eustis were provided by the City of Eustis in 2009.
Projections for Minneola were provided by the City of Minneola in 2008.
Projections for Leesburg and Clermont were provided by the respective municipalities in 2009.
Montverde 2030 projection was provided by the Town of Montverde in 2008.
Umatilla 2030 projection was provided by the City of Umatilla in 2009.
Lady Lake 2030 projection is based on a 1.8% annual growth rate after 2025, per the Town of Lady Lake.
2030 municipal projections were calculated to maintain the same annual average percentage growth rate as the period from 2020-2025, except as noted.
All municipal projections not otherwise identified were provided by the respective municipalities in 2007 or earlier.
Prepared by: Lake County Planning and Community Design, September 8, 2009.
DIVERSITY IN THE COUNTY AND WHERE IT IS PREVALENT
Table 2 (below) denotes the racial diversity of Lake County. Other than the African American population of the County, which has chosen to reside primarily within the incorporated areas (78%), the other races are fairly evenly divided between the incorporated and unincorporated areas of the County. This holds true for the Latino population as well which can be of any race. The top five locations chosen by the five largest groups (White, African Americans, Native Americans, Asians, and Hispanics) in Lake County can be seen in Table 2, below.
Table 2 - Ethnic Distribution in Occupied Dwelling Units
AFRICAN
AMERICANS DU'S. WHITE DU'S
NATIVE
AMERICAN DU'S ASIAN DU'S LATINOS DU'S
Leesburg 1,599 Uninc.Lake County 41,316
Uninc. Lake County 122
Uninc. Lake County 237
Uninc. Lake County 1,413
Unincorporated Lake County 1,252 Lady Lake 5,876 Eustis 19 Leesburg 64 Mascotte 299
Eustis 977 Eustis 5,062 Leesburg 14 Clermont 25 Eustis 249
Mount Dora 595 Leesburg 4,864 Clermont 14 Minneola 24 Leesburg 178
Clermont 378 Tavares 4,139 Tavares 11 Eustis 23 Mount Dora 171
The dwelling units shown in Table 2 account for approximately 80% of the total occupied units-- 68,921 of the 88,413 units. From this data it can be seen that both Leesburg and Eustis had the greatest diversity as of the 2000 Census as both of these municipalities appear in each of the top five list. It should be noted that even though the unincorporated areas were number one in four of the areas (and second in the fifth), these areas cover the entire County and the diversity would not be as evident as a concentration within a municipal area.
A COUNTY – STATE COMPARISON
Several characteristics of Lake County residents differed markedly from those at the state level.
Table 3 - Lake County & State Comparisons

Housing Element
Data, Inventory & Analysis
5
Year 2000 Income Distribution P o v e r t y Le v e l = $ 17 , 0 5 0 , A MI = $ 4 9 , 6 0 0
27%
33%24%
16%
$50,000+ $30-50K $20-30K <$20K
1990 Income Distribution P o v e r t y Le v e l = $ 12 , 7 0 0 A MI = $ 3 7 , 5 0 0
17%
22%40%
21%
$40,000+ $30-39K $20-30K <$20K
DESCRIPTION LAKE COUNTY FLORIDA
Foreign Born 5.6% 16.7%
Spoke Other Language at Home 8.4% 23.1%
Aged 25+ years w/Earned Bachelors degree 16.6% 22.3%
High School graduates 79.8% 79.9%
Home Ownership 81.5% 70.1%
Occurrence of Multi-unit Dwellings 9.8% 29.9%
Retail Sales per Capita $7,781 $10,297
Minority-owned Businesses 7.5% 22%
Women-owned Businesses 27.2% 25.9%
Median Annual Income $36,903 $38,845
% At or Below Poverty Level 9.6% 12.5%
INCOME DISTRIBUTIONS
Figure 4 shows that in 1990 over 60% of all Lake County households (including those retired and unemployed) earned less than $30,000 per year, while in the year 2000, Figure 5, 60% of the households earned more than $30,000 per year. In 1990, over 22% of households were earning above the $37,500 AMI (Area Median Income, Orlando MSA) and in 2000 that percentage had increased to over 33% of area households earning above the AMI of $49,600. Clearly, the economic outlook of Lake County households increased considerably in the 10 year period of 1990 to 2000.
Figure 4 and Figure 5 - Lake County Cumulative Income Distribution Percentages, 1990 vs. 2000
Although the data presented in Figures 4 and 5 are optimistic from an overall County perspective, as shown in Figure 6 below, the African American community is still lagging behind considerably when it comes to income distribution. As of the Census 2000, 47% of the income earned by African American families was at or below $20,000 per year which is below the Very Low Income levels used by HUD and just $3,000 from the poverty line. At every income level reported, the African American community lags behind the Latino and White populations of Lake
Figure 5

Lake County, Florida
Planning Horizon 2030
6
Figure 6: Income by Race in 1999.
0.0%
10.0%
20.0%
30.0%
40.0%
<$20K $20K-
$29,999
$30K-
$49,999
$50K-
$74,999
$75K-
$99,999
$100K+
White Latino Black
County. The Latino community within Lake County, overall, is performing comparably to the income figures reported for the White community of Lake County.
Figure 6 - Income by Race in 1999
At the State level, disparities in income distribution for the African American community were noticeably less than at the County level. Only 36% of the African American population had incomes below the $20,000 mark and African Americans were the dominant group in the income range of $20,000 - $29,999 with 16.4%. At all income levels above $30,000 the African American community, however, once again fell to third place behind the Latino and White communities as noted in Figure 7. A positive point shown in Figure 7 is that the differences between the groups were considerably reduced at the income levels of $30,000 and above.
Figure 7 - State of Florida Income by Race in 1999
Housing Stock
As previously stated, there has been tremendous growth in Lake County which, if recent trends and demands continue, will see an increase of the 2000 population by 95 percent by 2030 (410,050). One of the biggest challenges going forward for the County will be its ability to provide adequate housing for all of its residents and especially for those struggling to maintain
0.0%
10.0%
20.0%
30.0%
40.0%
<$20K $20K-
$29,999
$30K-
$49,999
$50K-
$74,999
$75K-
$99,999
$100K+
White Latino Black

Housing Element
Data, Inventory & Analysis
7
8632,5418,788
14,726
17,173
27,956
< $50,000 $50,000 - $99,999 $100,000 - $149,999
$150,000 - $249,999 $250,000 - $399,000 $400,000 +
their families intact while earning wages which are considerably lower than the Orlando MSA Area Median Income (AMI) of $49,600 for a family of four.
The Census 2000 provided us with a breakout of the 72,047 homes located within the county. As shown in Figure 8, homes valued at under $100,000 accounted for 63% of all homes at 45,129.
Figure 8 - Count of dwelling units by Value, 2000
Over the past several years we have seen a significant decline in the construction of new homes due to the economic times. In 2007, in the unincorporated areas of Lake County 745 certificates of occupancies (CO’s) were issued for site-built single-family residences, in 2008, 343 CO’s were issued, and in 2009, 136 CO’s were issued.
Along with the decline in new home starts, there has been a significant increase in home foreclosures within the last three years. In 2007 there were 2080 foreclosure cases filed in Lake County. 4,801 cases were filed in 2008, and 5,874 cases were filed in 2009.
Using the example of a household earning $46,000 per year, the recommended 30% of gross monthly income (which should be used to pay for a mortgage) would allow this family to take on a debt payment of approximately $1,150/month. Depending on the interest rate at the time (7% was used in this example), this mortgage payment would be in keeping with the mean and median values noted above. The problem with this scenario is that it would disqualify about half of the residents of Lake County who according to the 2000 Census (Figure 4 above) earn less than $46,000 per year. According to the Shimberg Center for Affordable Housing, by 2025 the County will need an additional 67,189 "affordable" single-family homes and an additional 5,844 "affordable" multi-family units to meet the projected demands based on our current population growth trends (see Figure 9). Of the additional 73,033 "affordable" units identified by the researchers at the Shimberg Center that the County will need by 2025, and based on current County projections, nearly 68.5% of all future homes built in the County should meet the definition for affordable housing if they are to be made available for county residents. ―Affordable housing,‖ means housing for which monthly rents or monthly mortgage payments, including taxes, insurance, and utilities, do not exceed 30% of that amount which represents the percentage of the median adjusted gross income for the households or person indicated in Section 420.004, F.S. Affordable housing definitions that are prescribed by other affordable housing programs administered by either the US Department of Housing and Urban Development or the

Lake County, Florida
Planning Horizon 2030
8
State of Florida may be used by local governments if such programs are implemented by them to provide affordable housing. 9J-5.003(1), F.A.C.
Figure 9 - Affordable Housing Projected Construction Need (source: Shimberg Center)
DATA INVENTORY & ANALYSIS
This section of the element presents an inventory of the housing trends and characteristics. Based primarily on datasets from the 2000 Decennial Census (available at www.factfinder.census.gov), our analysis will focus on both the incorporated and unincorporated areas of Lake County.
COMPARISON OF HOUSING CHARACTERISTICS:
Figures 10 and 11 provide a countywide breakout of the three types of habitable (but not necessarily occupied) dwelling units found within Lake County. Single family residences continue to dominate the County where the incorporated areas have 27,211 units for 62% of their total and the unincorporated areas have 34,283 single family units for 59% of their total.
Mobile homes accounted for 21,720 units within the unincorporated areas (37% of their total) while in the incorporated areas there were 8,829 (20% of their total). Multi-family structures are more of an incorporated area occurrence as noted by their 18% prevalence (8,126 units) as compared to only 4% in the unincorporated areas (1,921 units). Figures 5-12 and 5-13 clearly demonstrate that 80% of the multi-family structures are within the incorporated areas of the County while 71% of the mobile homes can be found in the unincorporated parts of the County. Over half of the mobile homes in Lake County (approximately 16,166) are located within one of the 152 mobile home parks that are in the County. According to the State of Florida there are 55 mobile home parks in Lake County that are restricted to those citizens who are 55+ years young. Specific information for 116 mobile home parks was available and is attached as Appendix B.
6,907
21,074
35,788
51,500
67,189
595 1,833 3,101 4,486 5,844
0
10,000
20,000
30,000
40,000
50,000
60,000
70,000
80,000
2005 2010 2015 2020 2025
Single Family
Multi Family

Housing Element
Data, Inventory & Analysis
9
63% 67
%
62%
60%
32%
22%
10%
6%
9%
12%
28%
30%
0%
10%
20%
30%
40%
50%
60%
70%
80%
Orange Volusia Marion Lake
Single Family Multi-Family Mobile Homes
Incorporated Dwelling Units
8 ,12 6
8 ,82 9
2 7,2 11
Single Family Multi-family Mo bile Ho me
Unincorporated Dwelling Units
3 4 ,28 3
1,98 1
2 1,72 0
Single Family Multi-family Mo bile Ho me
Figure 10 and Figure 11 - Lake County Dwelling Units by Type, 2000
*Does not include 680 boats, RV's, vans, etc., used as dwelling units.
A Regional Perspective
From a regional perspective, as noted below in Figure 12, Lake County dwelling units represent approximately 8% of the whole at 102,150. Orange County leads the region in both the number of single family units (227,164 for 28.49% of the total) and multi-family units (113,760 for 42.87% of the total).
Figure 12 - Lake County Share of Regional Dwelling Units by Types, 2000
When compared to its seven neighbor counties (Marion, Orange, Osceola, Polk, Seminole, Sumter, and Volusia), Lake County ranks 6th in the total number of habitable dwellings (see Table 4). As shown in Figure 12 (above), our regional counties have single-family homes as the dominant
Total Units= 57,984*
Total Units = 44,166

Lake County, Florida
Planning Horizon 2030
10
119,8
77
51,30
0
12,19
6
79,88
8
28,06
8
13,57
6
50,55
6
13,75
8
3,230
31,22
9
5,530 13,
059
13,55
3
4,137
5,256
0
20,000
40,000
60,000
80,000
100,000
120,000
140,000
Single Family Multi-Family Mobile Homes
Orange County Volusia County Seminole County Lake County Osceola County
Table 4 - Ranking of Regional Counties by Count of Habitable Dwelling Units
RANK COUNTY DWELLING UNITS
1 Orange County 360,992 25.58%
2 Polk County 223,342 17.69%
3 Volusia County 211,029 16.71%
4 Seminole County 146,899 11.63%
5 Marion County 121,854 9.65%
6 Lake County 102,150 8.09%
7 Osceola County 71,806 5.69%
8 Sumter County 24,817 1.97%
Regional Totals: 1,262,889 100%
dwelling unit type. There is also an inverse relationship between the percentage of mobile homes and the percentage of multi-family units within the counties. Those counties with the highest number of multi-family units have the lowest count of mobile homes. A follow-up regional analysis should be performed to assess the socio-economic characteristics of the multi-family residents as compared to the residents in the mobile home communities. The investigation needs to address if these are alternative paths addressing affordable housing, whether they are self-directed or government induced, whether they are adequately addressing the needs of the respective residents or whether some other phenomenon is causing this observed relationship.
For comparison purposes we obtained the dwelling unit figures from the 1980 Census which were used in the previous iteration of the Comprehensive Plan. As noted in Figure 13 (below) the ranking of the five counties for which data was available are the same as noted above in Table 4 with Orange County at the top and Osceola County with the lowest count of dwelling units. Overall, however, Osceola County was the only local regional County that more than tripled their count of single family and multi-family units while also doubling their count of mobile homes (see Figure 14 below). Lake County nearly doubled both their single-family and multi-family units while also more than doubling its count of mobile homes.
Figure 13 - Dwelling Units by Type by County for Central Florida Region, Census 1980

Housing Element
Data, Inventory & Analysis
11
189.5
% 221.8
%
164.6
%
176.3
%
163.5
%178
.8%
272.3
%
196.9
%
182.8
%
341.9
%
349.9
%
156.8
%206.4
%
233.9
%
209.1
%
0.00%
100.00%
200.00%
300.00%
400.00%
Single Family Multi-Family Mobile Homes
Orange County Volusia County Seminole County Lake County Osceola County
Figure 14 - Increases in Dwelling Units by Type by County for Central Florida Region, from 1980 to 2000
PROJECTION OF HOUSEHOLDS 2030
Based on the best available data of the count of households within Lake County, Table 5 (below) summarizes our forecasted growth in the number of households in single family homes, multi-family homes, and mobile homes. Based on this forecast we can anticipate that the total number of households within the county will nearly double by 2030.
Table 5 - Projection of Households based on Historic Trends 1980-2030
YEAR POPULATION H/H SIZE
H/H TOTAL
SINGLE FAMILY
MULTI-FAMILY
MOBILE HOMES
TOTAL UNITS
1980 104,900 2.47 41,650 31,229 5,530 13,059 49,818
1990 152,104 2.39 63,616 39,995 8,365 26,877 75,237
2000 210,528 2.34 88,413 61,494 10,107 30,549 102,150
2005 263,017 2.34 112,400 83,679 15,879 31,046 130,603
2010 297,850 2.34 127,286 99,345 18,091 31,796 149,232
2015 332,050 2.34 141,901 112,737 20,448 33,138 166,325
2020 361,600 2.34 154,530 124,771 22,552 33,761 181,083
2025 387,900 2.34 165,769 135,831 24,473 33,908 194,211
2030 410,050 2.34 175,235 143,587 25,870 35,844 205,301
TENURE OF HABITABLE HOMES
Tables 6 and 7 (below) provide a detailed count, by Place, of owner and renter occupied dwellings along with a count of vacant units. Overall, 70% (72,047) of the units are owner-

Lake County, Florida
Planning Horizon 2030
12
occupied and 16% (16,636) are occupied by renters. The balance of the habitable homes, 14% (14,417), was vacant during the Census 2000 count.
The Top 10 Places with available and habitable homes in Lake County for the year 2000 were also the only 10 Places that had total counts in excess of 1,000:
1. Leesburg (7,742) 6. Clermont (4,368)
2. Eustis (7,322) 7. Minneola (2,032)
3. Lady Lake (6,998) 8. Fruitland Park (1,288)
4. Tavares (5,475) 9. Mount Plymouth (1,171)
5. Mount Dora (4,630) 10. Astor (1,027)
Table 6 - Tenure for Dwelling Units All Places, Lake County, 2000
PLACE OWNER
OCCUPIED
% OWNER
OCCUPIED
RENTER
OCCUPIED
% RENTER
OCCUPIED VACANT % VACANT TOTAL
Astatula 410 75% 72 13% 64 12% 546
Astor 541 53% 100 10% 386 38% 1,027
Clermont 2,834 65% 1,161 27% 373 9% 4,368
Eustis 4,350 59% 2,021 28% 951 13% 7,322
Ferndale 71 78% 12 13% 8 9% 91
Fruitland Park 874 68% 318 25% 96 7% 1,288
Groveland 582 63% 263 29% 76 8% 921
Howey 327 73% 58 13% 65 14% 450
Lady Lake 5,616 80% 509 7% 873 12% 6,998
Lake Kathryn 293 64% 51 11% 112 25% 456
Lake Mack 323 67% 73 15% 89 18% 485
Leesburg 3,973 51% 2,802 36% 967 12% 7,742
Lisbon 83 56% 24 16% 40 27% 147
Mascotte 600 70% 203 24% 55 6% 858
Minneola 1,537 76% 392 19% 103 5% 2,032
Montverde 302 74% 49 12% 59 14% 410
Mount Dora 2,680 58% 1,443 31% 507 11% 4,630
Mount Plymouth 974 83% 106 9% 91 8% 1,171
Okahumpka 72 64% 36 32% 5 4% 113
Paisley 277 70% 40 10% 79 20% 396
Pine Lakes 227 66% 55 16% 63 18% 345
Pittman 58 68% 11 13% 16 19% 85
Silver Lake 622 71% 188 22% 62 7% 872

Housing Element
Data, Inventory & Analysis
13
PLACE OWNER
OCCUPIED
% OWNER
OCCUPIED
RENTER
OCCUPIED
% RENTER
OCCUPIED VACANT % VACANT TOTAL
Sorrento 195 68% 74 26% 17 6% 286
Tavares 3,579 65% 892 16% 1,004 18% 5,475
Umatilla 600 61% 267 27% 120 12% 987
Yalaha 464 77% 57 9% 80 13% 601
Unincorporated LC 39,557 75% 5,076 10% 8,046 15% 52,679
Place Totals 32,490 65% 11,290 23% 6,371 13% 50,151
County Totals: 72,047 70% 16,366 16% 14,417 14% 102,830
Table 7 - Tenure for Dwelling Units, Lake County, 2000
TENURE UNINCORPORATED #S % PLACE #S % TOTAL COUNTY
Owner Occupied 39,557 75% 32,490 65% 72,047
Renter Occupied 5,076 10% 11,290 22% 16,366
Vacant 8,046 15% 6,371 13% 14,417
TOTALS: 52,679 100% 50,151 100% 102,830
The count of habitable homes was nearly evenly split with the unincorporated County holding 51% (52,679) and the remaining 49% (50,151) being found in the named Places of Lake County (Table 6).
THE VALUES OF HOMES IN THE COUNTY
As shown in Figure 15, the sector with the largest percentage, 39%, of the Owner Occupied homes are those valued between $50,000 and $99,999. In second place with 24% of the owner occupied homes are those valued under $50,000. The balance of Owner Occupied homes, 37%, are valued greater than $100,000. Of these 26,918 homes valued more than $100,000, 16,681 are located in unincorporated Lake County.

Lake County, Florida
Planning Horizon 2030
14
10.0
%
21.2
%
8.4%
4.4%
1.0%
0.4%
0%
5%
10%
15%
20%
25%
< $
50,0
00
$50,
000
- $9
9,99
9$1
00,0
00 - $
149,
999
$150
,000
- $
249,
999
$250
,000
- $
399,
000
$400
,000
- $
1,00
0,00
0 +
Unincorporated LC Place Totals
Figure 15 - Value of Dwelling Units in Lake County, Owner-Occupied Distribution, 2000
Table 8 (below) provides detailed information of the median value of homes throughout Lake County.
Table 8 - Median Value of Dwelling Units in Lake County, 2000
PLACE MEDIAN VALUE IN DOLLARS PLACE MEDIAN VALUE IN DOLLARS
Altoona CDP $100,000 Mascotte $ 74,000
Astatula $68,400 Minneola $105,500
Astor CDP $90,800 Montverde $102,800
Citrus Ridge CDP $117,400 Mount Dora $110,700
Clermont $113,700 Mt Plymouth CDP $95,200
Eustis $ 81,400 Okahumpka CDP $55,000
Ferndale CDP $159,200 Paisley CDP $79,400
Fruitland Park $71,400 Pine Lakes CDP $ 44,500
Groveland $ 75,300 Pittman CDP $66,400
Howey-in-the-Hills $114,500 Silver Lake CDP $138,900
Lady Lake $92,400 Sorrento CDP $66,200
Lake Kathryn CDP $61,300 Tavares $78,300
Lake Mack CDP $61,200 Umatilla $69,800
Leesburg $ 70,400 Yalaha CDP $107,500
Lisbon CDP $ 88,300
Housing Element
Data, Inventory & Analysis
15
16.7%
26.7%
6.9%
2.0%
11.4%
5.2%
7.8%
24.5%
0%
5%
10%
15%
20%
25%
30%
1995 to 1998 1980 to 1989 1960 to 1969 1940 to 1949
Owners
Renters
AGE OF HOUSING STOCK IN THE COUNTY
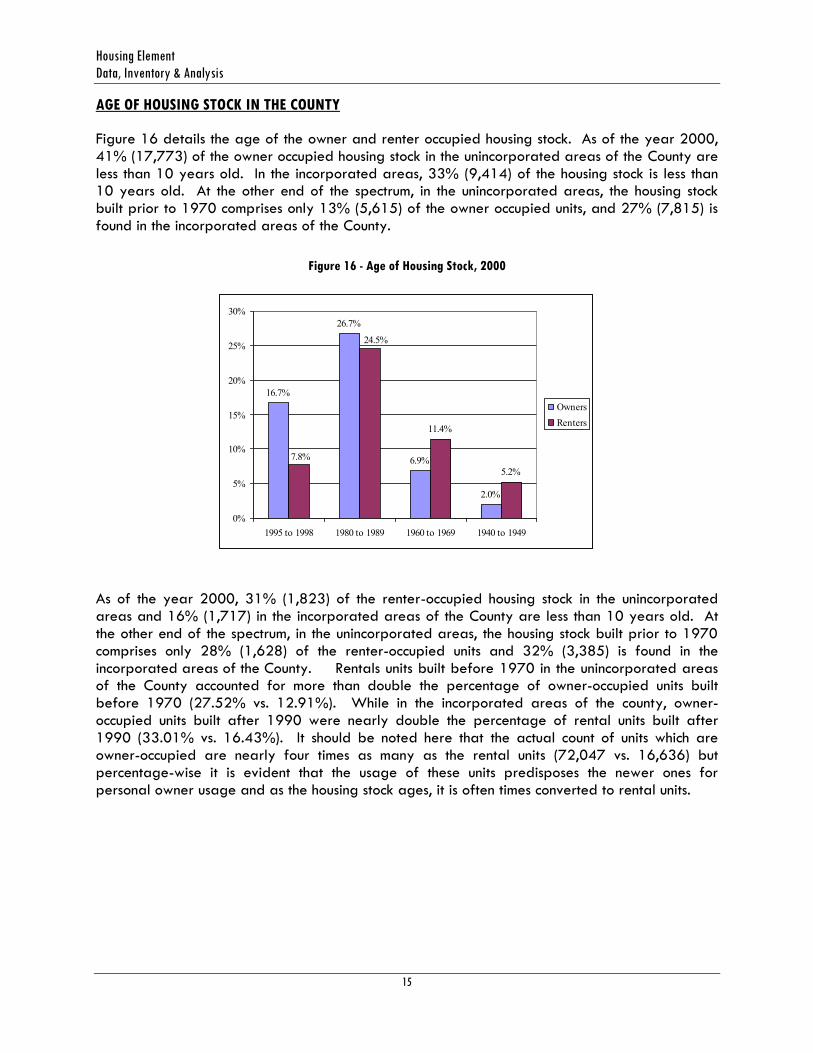
Figure 16 details the age of the owner and renter occupied housing stock. As of the year 2000, 41% (17,773) of the owner occupied housing stock in the unincorporated areas of the County are less than 10 years old. In the incorporated areas, 33% (9,414) of the housing stock is less than 10 years old. At the other end of the spectrum, in the unincorporated areas, the housing stock built prior to 1970 comprises only 13% (5,615) of the owner occupied units, and 27% (7,815) is found in the incorporated areas of the County.
Figure 16 - Age of Housing Stock, 2000
As of the year 2000, 31% (1,823) of the renter-occupied housing stock in the unincorporated areas and 16% (1,717) in the incorporated areas of the County are less than 10 years old. At the other end of the spectrum, in the unincorporated areas, the housing stock built prior to 1970 comprises only 28% (1,628) of the renter-occupied units and 32% (3,385) is found in the incorporated areas of the County. Rentals units built before 1970 in the unincorporated areas of the County accounted for more than double the percentage of owner-occupied units built before 1970 (27.52% vs. 12.91%). While in the incorporated areas of the county, owner-occupied units built after 1990 were nearly double the percentage of rental units built after 1990 (33.01% vs. 16.43%). It should be noted here that the actual count of units which are owner-occupied are nearly four times as many as the rental units (72,047 vs. 16,636) but percentage-wise it is evident that the usage of these units predisposes the newer ones for personal owner usage and as the housing stock ages, it is often times converted to rental units.
Lake County, Florida
Planning Horizon 2030
16
0%
5%
10%
15%
20%
25%
30%
1999
to 2
000
1995
to 1
998
1990
to 1
994
1980
to 1
989
1970
to 1
979
1960
to 1
969
1950
to 1
959
1940
to 1
949
1939
or e
arlie
r
% Owner Occupied Units % Renter Occupied Units
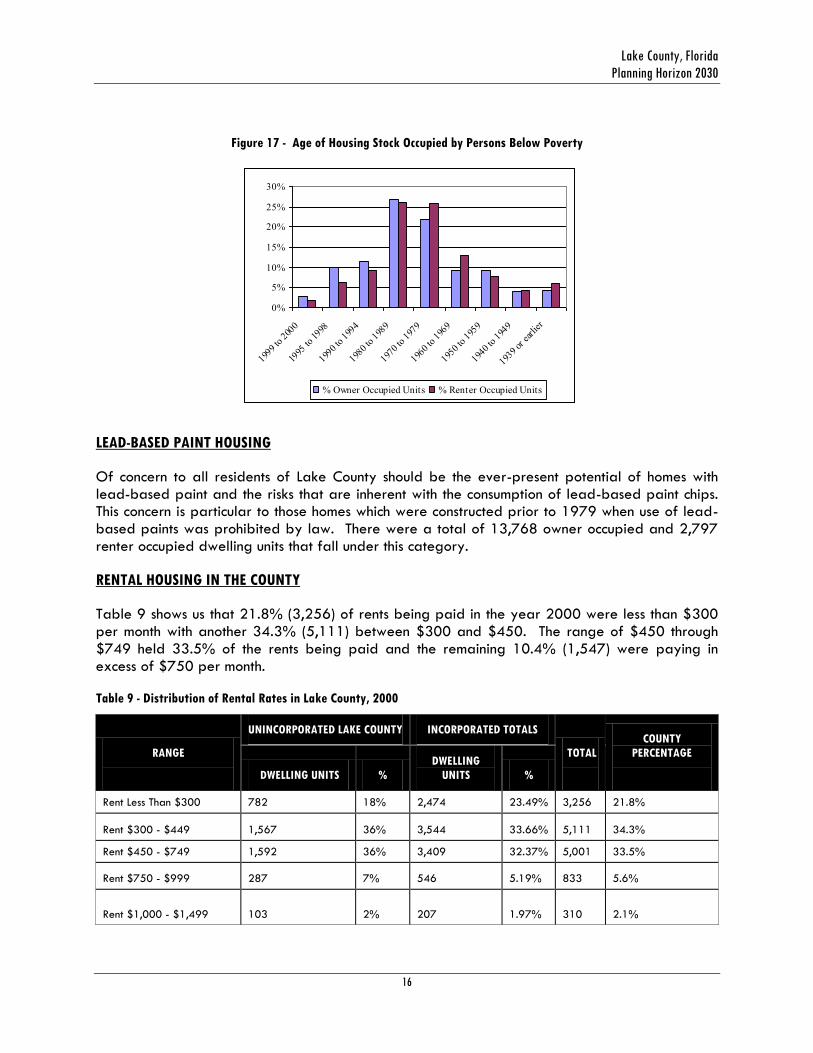
Figure 17 - Age of Housing Stock Occupied by Persons Below Poverty
LEAD-BASED PAINT HOUSING
Of concern to all residents of Lake County should be the ever-present potential of homes with lead-based paint and the risks that are inherent with the consumption of lead-based paint chips. This concern is particular to those homes which were constructed prior to 1979 when use of lead-based paints was prohibited by law. There were a total of 13,768 owner occupied and 2,797 renter occupied dwelling units that fall under this category.
RENTAL HOUSING IN THE COUNTY
Table 9 shows us that 21.8% (3,256) of rents being paid in the year 2000 were less than $300 per month with another 34.3% (5,111) between $300 and $450. The range of $450 through $749 held 33.5% of the rents being paid and the remaining 10.4% (1,547) were paying in excess of $750 per month.
Table 9 - Distribution of Rental Rates in Lake County, 2000
RANGE
UNINCORPORATED LAKE COUNTY INCORPORATED TOTALS
TOTAL
COUNTY
PERCENTAGE
DWELLING UNITS %
DWELLING
UNITS %
Rent Less Than $300 782 18% 2,474 23.49% 3,256 21.8%
Rent $300 - $449 1,567 36% 3,544 33.66% 5,111 34.3%
Rent $450 - $749 1,592 36% 3,409 32.37% 5,001 33.5%
Rent $750 - $999 287 7% 546 5.19% 833 5.6%
Rent $1,000 - $1,499 103 2% 207 1.97% 310 2.1%

Housing Element
Data, Inventory & Analysis
17
Rent $1,500 - $2,000 or more 54 1% 350 3.32% 404 2.7%
Totals: 4,385 29% 10,530 71% 14,915 100%
Median Rent values for Lake County are shown in Table 10. The top 10 median rents being charged in the County as of the 2000 Census are highlighted in gray. Mount Plymouth's 85 rental units had the highest median rent at $627/month. The overall County median was ranked 10th with a rent of $424/month.
Table 10 - Median Rent by Place. (Sorted by median rent high to low)
PLACE NAME 2000 MEDIAN CONTRACT
RENT PLACE NAME
2000 MEDIAN
CONTRACT RENT
Mount Plymouth $627 Lake Kathryn $390
Howey-in-the-Hills $583 Sorrento $388
Minneola $581 Leesburg $380
Clermont $505 Okahumpka $375
Montverde $504 Groveland $351
Mount Dora $487 Lisbon $340
Silver Lake $457 Astor $335
Yalaha $450 Paisley $325
Lady Lake $431 Umatilla $323
County Median $424 Altoona $296
Mascotte $416 Lake Mack $288
Tavares $411 Pine Lakes $275
Eustis $401 Ferndale NA
Astatula town $400 Pittman NA
Fruitland Park $398
The unincorporated areas of the County had the highest incidence of rentals (4,385) then Leesburg (2,687), Eustis (1,984), Mount Dora (1,406), Clermont (1,141), and Tavares (858).
As shown in Table 11, overall in Lake County 19.2% (2,810 out of 14,607) of the households renting were paying 50% or more of their monthly income for rent. The #1 spot was held by Pines Lakes where 15 of its 15 rentals were all at 50% or greater. Unincorporated Lake County did not make the top 10 list with regards to percent of households per area that were renting but was #1 in terms of sheer number of households paying 50% or greater of their monthly income in rent with 720 households.

Lake County, Florida
Planning Horizon 2030
18
Table 11 - Percentage of Total Household (H/H) Income Used to Pay Rent. (Sorted by >50%)
PLACE TOTAL # OF H/H % OF H/H W/RENT
< 25% OF INCOME
% OF H/H W/RENT
25% - 50%
OF INCOME
% OF H/H
W/RENT > 50%
OF INCOME
% H/H WITH
NO DATA
Lake County 14,607 42% 30% 17% 10%
Pine Lakes CDP 15 0% 0% 50% 50%
Lake Kathryn CDP 71 42% 15% 27% 15%
Lisbon CDP 19 68% 0% 32% 0%
Silver Lake CDP 152 51% 13% 29% 7%
Mount Dora 1,360 39% 30% 25% 6%
Tavares 858 37% 35% 24% 4%
Lady Lake 439 33% 35% 20% 13%
Leesburg 2,594 41% 32% 19% 8%
Groveland 204 22% 48% 17% 12%
Clermont 1,102 51% 25% 17% 6%
Eustis 1,956 43% 34% 17% 5%
Astatula 62 49% 25% 16% 10%
Howey-in-the-Hills 46 62% 14% 16% 8%
Astor CDP 82 22% 37% 12% 29%
Lake Mack CDP 84 17% 54% 14% 15%
Yalaha CDP 55 39% 33% 14% 14%
Mascotte 185 55% 21% 15% 8%
Umatilla 246 37% 45% 14% 4%
Fruitland Park 241 49% 29% 12% 10%
Mt. Plymouth CDP 85 44% 22% 10% 24%
Montverde 30 30% 18% 5% 46%
Minneola 317 41% 41% 4% 15%
Altoona CDP 22 28% 33% 0% 39%
Ferndale CDP 0% 0% 0% 0%
Okahumpka CDP 10 0% 43% 0% 57%
Paisley CDP 12 0% 31% 0% 69%
Pittman CDP 0% 0% 0% 100%
Sorrento CDP 63 100% 0% 0% 0%
Unincorporated LC 4,297 45% 27% 15% 13%
Incorporated Totals: 10,310 41% 32% 19% 9%
Total: 14,607 42% 30% 17% 10%

Housing Element
Data, Inventory & Analysis
19
Forty-two percent (6,801) of the renting households had incomes of less than $20,000 and an overwhelming 71% of those (4,853/6,801) were experiencing rental costs of 30% or greater of their monthly household income. No other income bracket came close to these percentages. The income bracket of $20,000-$34,999 was next with 28% of their households (1,175/4,205) paying monthly rents in excess of 30% of their income.
Table 12 - Renter Costs as Percentage of Household Income, 1999
TOTAL # H/H
W/RENTER
COSTS
< 20%
TOTAL # H/H
W/RENTER COSTS
20 - 29.9%
TOTAL # H/H
W/RENTER COSTS
30% & >
UNASSIGNED
H/H
# H/H w/ Income < $19,999 Count % Count % Count % Count / %
Incorporated LC 4,702 213 5% 654 14% 3,455 73% 380 / 8%
Unincorporated LC 2,099 36 2% 282 13% 1,398 67% 383 / 18%
Subtotals: 6,801 249 4% 936 14% 4,853 71% 763 / 11%
# H/H w/ Income $20,000 - $34,999
Incorporated LC 2,605 684 26% 973 37% 754 29% 194 / 7%
Unincorporated LC 1,600 359 22% 650 41% 421 26% 170 / 11%
Subtotals: 4,205 1,043 25% 1,623 39% 1,175 28% 364 / 9%
# H/H w/ Income $35,000 - $49,999
Incorporated LC 1,509 867 57% 414 27% 116 8% 112 / 7%
Unincorporated LC 990 609 62% 175 18% 68 7% 138 / 14%
Subtotals: 2,499 1,476 59% 589 24% 184 7% 250 / 10%
# H/H w/ Income $50,000 - $74,999
Incorporated LC 1,117 945 85% 82 7% 46 4% 44 / 4%
Unincorporated LC 702 508 72% 71 10% 18 3% 105 / 15%
Subtotals: 1,819 1,453 80% 153 8% 64 4% 149 / 8%
# H/H w/ Income $75,000 - $99,999
Incorporated LC 298 238 80% 34 11% 10 3% 16 / 5%
Unincorporated LC 241 224 93% 0 0% 0 0% 17 / 7%
Subtotals: 539 462 86% 34 6% 10 2% 33 / 6%
# H/H w/ Income $100,000 >
Incorporated LC 187 137 73% 18 10% 0 0% 32 / 17%
Unincorporated LC 155 148 95% 0 0% 0 0% 7 / 5%
Subtotals: 342 285 83% 18 5% 0 0% 39 / 11%
Incorporated Totals 10,418 3,084 30% 2,175 21% 4,381 42% 778 / 7%
Unincorporated Totals 5,787 1,884 33% 1,178 20% 1,905 33% 820 / 14%
County Totals: 16,205 4,968 31% 3,353 21% 6,286 39% 1,598 / 10%
Lake County, Florida
Planning Horizon 2030
20
OWNER OCCUPIED HOUSING IN THE COUNTY
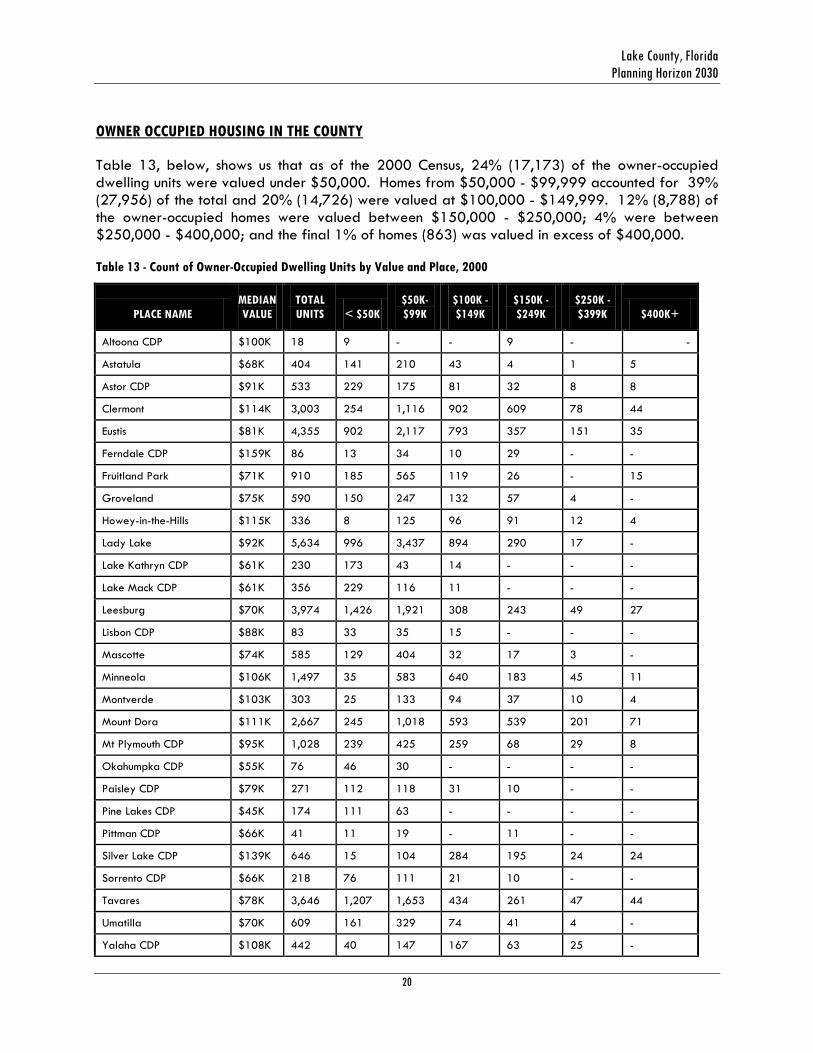
Table 13, below, shows us that as of the 2000 Census, 24% (17,173) of the owner-occupied dwelling units were valued under $50,000. Homes from $50,000 - $99,999 accounted for 39% (27,956) of the total and 20% (14,726) were valued at $100,000 - $149,999. 12% (8,788) of the owner-occupied homes were valued between $150,000 - $250,000; 4% were between $250,000 - $400,000; and the final 1% of homes (863) was valued in excess of $400,000.
Table 13 - Count of Owner-Occupied Dwelling Units by Value and Place, 2000
PLACE NAME
MEDIAN
VALUE
TOTAL
UNITS < $50K
$50K-
$99K
$100K -
$149K
$150K -
$249K
$250K -
$399K $400K+
Altoona CDP $100K 18 9 - - 9 - -
Astatula $68K 404 141 210 43 4 1 5
Astor CDP $91K 533 229 175 81 32 8 8
Clermont $114K 3,003 254 1,116 902 609 78 44
Eustis $81K 4,355 902 2,117 793 357 151 35
Ferndale CDP $159K 86 13 34 10 29 - -
Fruitland Park $71K 910 185 565 119 26 - 15
Groveland $75K 590 150 247 132 57 4 -
Howey-in-the-Hills $115K 336 8 125 96 91 12 4
Lady Lake $92K 5,634 996 3,437 894 290 17 -
Lake Kathryn CDP $61K 230 173 43 14 - - -
Lake Mack CDP $61K 356 229 116 11 - - -
Leesburg $70K 3,974 1,426 1,921 308 243 49 27
Lisbon CDP $88K 83 33 35 15 - - -
Mascotte $74K 585 129 404 32 17 3 -
Minneola $106K 1,497 35 583 640 183 45 11
Montverde $103K 303 25 133 94 37 10 4
Mount Dora $111K 2,667 245 1,018 593 539 201 71
Mt Plymouth CDP $95K 1,028 239 425 259 68 29 8
Okahumpka CDP $55K 76 46 30 - - - -
Paisley CDP $79K 271 112 118 31 10 - -
Pine Lakes CDP $45K 174 111 63 - - - -
Pittman CDP $66K 41 11 19 - 11 - -
Silver Lake CDP $139K 646 15 104 284 195 24 24
Sorrento CDP $66K 218 76 111 21 10 - -
Tavares $78K 3,646 1,207 1,653 434 261 47 44
Umatilla $70K 609 161 329 74 41 4 -
Yalaha CDP $108K 442 40 147 167 63 25 -

Housing Element
Data, Inventory & Analysis
21
PLACE NAME
MEDIAN
VALUE
TOTAL
UNITS < $50K
$50K-
$99K
$100K -
$149K
$150K -
$249K
$250K -
$399K $400K+
Place Totals 32,715 7,200 15,278 6,047 3,182 708 300
Unincorporated LC 39,332 9,973 12,678 8,679 5,606 1,833 563
Totals: 72,047 17,173 27,956 14,726 8,788 2,541 863
Table 14 provides the Top 5 cities within in each value category of owner-occupied dwelling units. Mount Dora placed 1st in the two highest categories and was second in the third category ($150,000-$249,999) and fifth in the fourth category. Clermont and Eustis had the next best two records for top home values. These cities were followed by Lady Lake which also had the largest count of moderately priced homes (4,433 under $100,000).
Table 14 - Count of Top 5 Owner-Occupied Dwelling Units by Value and Place
PLACE NAME $400,000 + PLACE NAME $250,000 - $399,000 PLACE NAME $150,000 - $249,999
Mount Dora 71 Mount Dora 201 Clermont 609
Clermont 44 Eustis 151 Mount Dora 539
Tavares 44 Clermont 78 Eustis 357
Eustis 35 Leesburg 49 Lady Lake 290
Leesburg 27 Tavares 47 Tavares 261
Place Name $100,000 - $149,999 Place Name $50,000 - $99,999 Place Name < $50,000
Clermont 902 Lady Lake 3,437 Leesburg 1,426
Lady Lake 894 Eustis 2,117 Tavares 1,207
Eustis 793 Leesburg 1,921 Lady Lake 996
Minneola 640 Tavares 1,653 Eustis 902
Mount Dora 593 Clermont 1,116 Clermont 254
Table 15 (below) details the monthly costs (inclusive of real estate taxes, fire, hazard, and flood insurance, utilities-electrical, gas, and water and sewer, etc.) of home-owners throughout the County with mortgaged homes. Of this group of home-owners, 61% of the home-owners have incurred costs under $1.000 and 39% were paying over $1,000 per month.
Table 15 - Monthly Costs of Owner-Occupied Dwelling Units by Place, Lake County, 2000
PLACE
MORTGAGED
HOMES < $500 $500 - $699 $700 - $999
$1,000 -
$1,249
$1,250 -
$1,999 > $2,000
Altoona CDP 9 - 9 - - - -
Astatula 107 14 42 38 7 6 -
Astor CDP 97 - 43 22 24 8 -
Clermont 1,620 72 278 550 286 369 65
Eustis 2,383 207 582 887 347 339 21

Lake County, Florida
Planning Horizon 2030
22
Table 16 shows us that the majority of owner costs were found in the range of $700-$999, with a total of 10,039 units representing 32% of the units in the unincorporated areas and 33% (5,145) of the units in the incorporated areas (4,894). The unincorporated areas were found to have a tendency towards higher owner-costs, 27% of the dwelling units (4,234) had costs greater than $1,000. On the other end of the spectrum, in the incorporated areas, 35% of the units (5,168) have total monthly costs under $1,000.
Ferndale CDP 34 - 5 - 9 20 -
Fruitland Park 549 53 223 160 68 45 -
Groveland 325 49 56 104 61 45 10
Howey-in-the-Hills 217 7 24 69 44 67 6
Lady Lake 1,300 282 490 380 99 32 17
PLACE
MORTGAGED
HOMES < $500 $500 - $699 $700 - $999
$1,000 -
$1,249
$1,250 -
$1,999 > $2,000
Lake Mack CDP 60
- 21 30
- 9
-
Leesburg 1,696 328 599 448 147 128 46
Lisbon CDP 16 -
- 9 7
-
-
Mascotte 408 49 143 155 33 22 6
Minneola 1,214 10 167 526 272 194 45
Montverde 196 5 25 96 33 37 -
Mount Dora 1,357 82 180 455 254 279 107
Mt Plymouth CDP 600 51 92 302 74 74 7
Okahumpka CDP 13
- 13
-
-
-
-
Paisley CDP 74 - 34 23 17
-
-
Pine Lakes CDP 53 10 32 11 - - -
Pittman CDP 8 - - 8 - - -
Silver Lake CDP 434 7 29 98 94 146
60
Sorrento CDP 92 12 34 34 12 - -
Tavares 1,211 141 422 302 190 142 14
Umatilla 333 53 104 102 35 34 5
Yalaha CDP 189 16 45 85 28 - 15
Place Totals 14,632 1,476 3,692 4,894 2,150 1,996 424
Unincorporated LC 15,798 1,110 2,165 5,145 3,144 3,467 767
Totals: 30,430 2,586 5,857 10,039 5,294 5,463 1,191

Housing Element
Data, Inventory & Analysis
23
Table 16 - Distribution of Owner Costs in Lake County, 2000
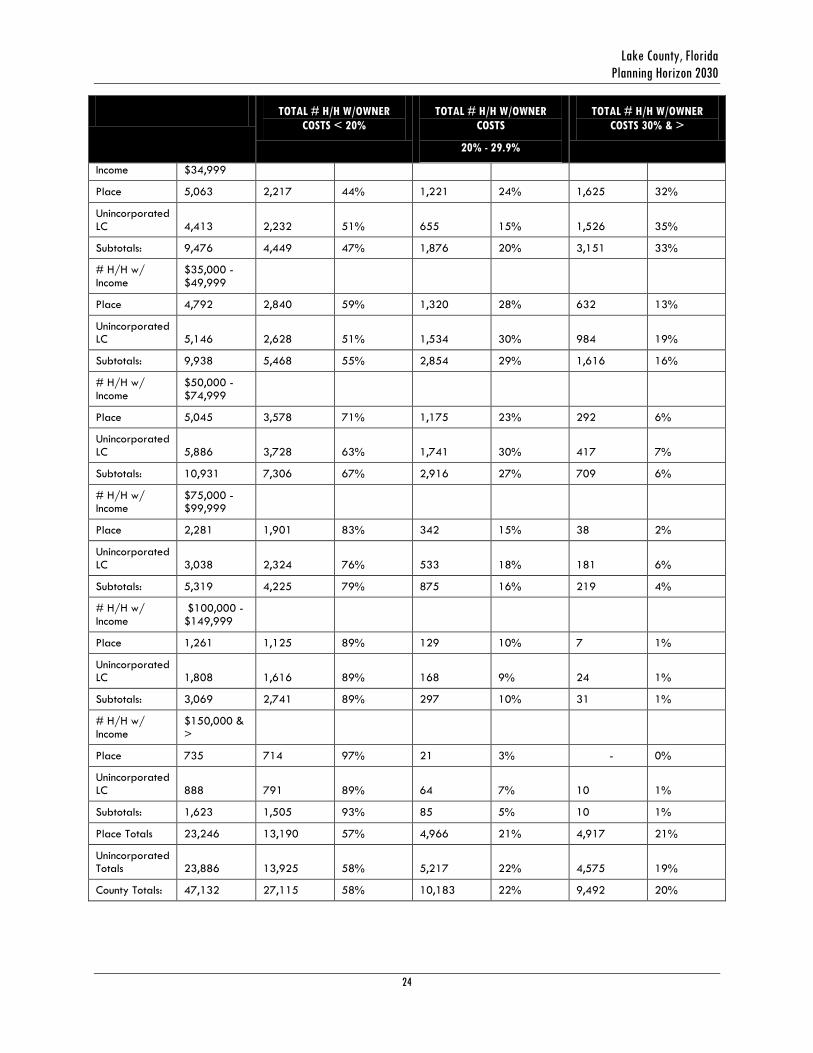
Table 17 (below) shows that a trend first observed in renter-occupied housing is also occurring with owner-occupied housing. Like the lower income renters, lower income home-owners also used a greater share of their income to pay for housing expenses. In the income brackets of less than $20,000 there are 6,776 persons (14.4%) and of those, 3,756, or 55%, were paying 30% or more of their monthly income for housing costs. The income bracket of $20,000-$34,999 which consisted of 9,476 (20%) home-owners had 33% of their ranks (3,151) paying over 30% of their monthly income towards their housing costs. The next five income brackets demonstrated that successively decreasing shares of their rank were paying 30% or more towards their monthly housing expenses. Specifically, the five income brackets over $35,000 had shares of 16%, 6%, 4%, 1%, and 1%. Overall, the County had 20% (9,492) of its home-owners spending 30% or more of their income on housing costs while 58% (27,115 out of 47,132) were only spending 20% or less of their monthly income on housing costs.
Table 17 - Owner Costs as Percentage of Household Income, 1999
TOTAL # H/H W/OWNER
COSTS < 20%
TOTAL # H/H W/OWNER
COSTS
20% - 29.9%
TOTAL # H/H W/OWNER
COSTS 30% & >
Owner Costs as % of Household Income
# H/H w/ Income
< $19,999 Count % Count % Count %
Place 4,069 815 20% 758 19% 2,323 57%
Unincorporated LC 2,707 606 22% 522 19% 1,433 53%
Subtotals: 6,776 1,421 21% 1,280 19% 3,756 55%
# H/H w/ $20,000 -
RANGE
OF OWNER COSTS
UNINCORPORATED LAKE COUNTY INCORPORATED TOTALS TOTAL
DWELLING UNITS % DWELLING UNITS %
< $500 1,110 7% 1,476 10% 2,586
$500 - $699 2,165 14% 3,692 25% 5,857
$700 - $999 5,145 32% 4,894 33% 10,039
$1,000 - $1,249 3,144 20% 2150 15% 5,294
$1,250 - $1,999 3,467 22% 1996 14% 5,463
> $2,000 767 5% 424 3% 1,191
Totals: 15,798 52% 14,632 48% 30,430
Lake County, Florida
Planning Horizon 2030
24
TOTAL # H/H W/OWNER
COSTS < 20%
TOTAL # H/H W/OWNER
COSTS
20% - 29.9%
TOTAL # H/H W/OWNER
COSTS 30% & >
Income $34,999
Place 5,063 2,217 44% 1,221 24% 1,625 32%
Unincorporated LC 4,413 2,232 51% 655 15% 1,526 35%
Subtotals: 9,476 4,449 47% 1,876 20% 3,151 33%
# H/H w/ Income
$35,000 - $49,999
Place 4,792 2,840 59% 1,320 28% 632 13%
Unincorporated LC 5,146 2,628 51% 1,534 30% 984 19%
Subtotals: 9,938 5,468 55% 2,854 29% 1,616 16%
# H/H w/ Income
$50,000 - $74,999
Place 5,045 3,578 71% 1,175 23% 292 6%
Unincorporated LC 5,886 3,728 63% 1,741 30% 417 7%
Subtotals: 10,931 7,306 67% 2,916 27% 709 6%
# H/H w/ Income
$75,000 - $99,999
Place 2,281 1,901 83% 342 15% 38 2%
Unincorporated LC 3,038 2,324 76% 533 18% 181 6%
Subtotals: 5,319 4,225 79% 875 16% 219 4%
# H/H w/ Income
$100,000 - $149,999
Place 1,261 1,125 89% 129 10% 7 1%
Unincorporated LC 1,808 1,616 89% 168 9% 24 1%
Subtotals: 3,069 2,741 89% 297 10% 31 1%
# H/H w/ Income
$150,000 & >
Place 735 714 97% 21 3% - 0%
Unincorporated LC 888 791 89% 64 7% 10 1%
Subtotals: 1,623 1,505 93% 85 5% 10 1%
Place Totals 23,246 13,190 57% 4,966 21% 4,917 21%
Unincorporated Totals 23,886 13,925 58% 5,217 22% 4,575 19%
County Totals: 47,132 27,115 58% 10,183 22% 9,492 20%

Housing Element
Data, Inventory & Analysis
25
SUBSTANDARD HOUSING IN THE COUNTY
Figure 18 provides us with a graphic representation of where in the county the dwelling units lacking plumbing are located in comparing 1980 and 2000, there was a nearly 50% reduction in the number of units that lacked plumbing in 1980 (526) as compared to present day (279). The Census, however, does not tell us whether the reduction was a result of the units being improved or demolished.
Figure 18 - Occupied housing units (Owner and Renter) Lacking Plumbing Facilities. 2000
Lake County, Florida
Planning Horizon 2030
26
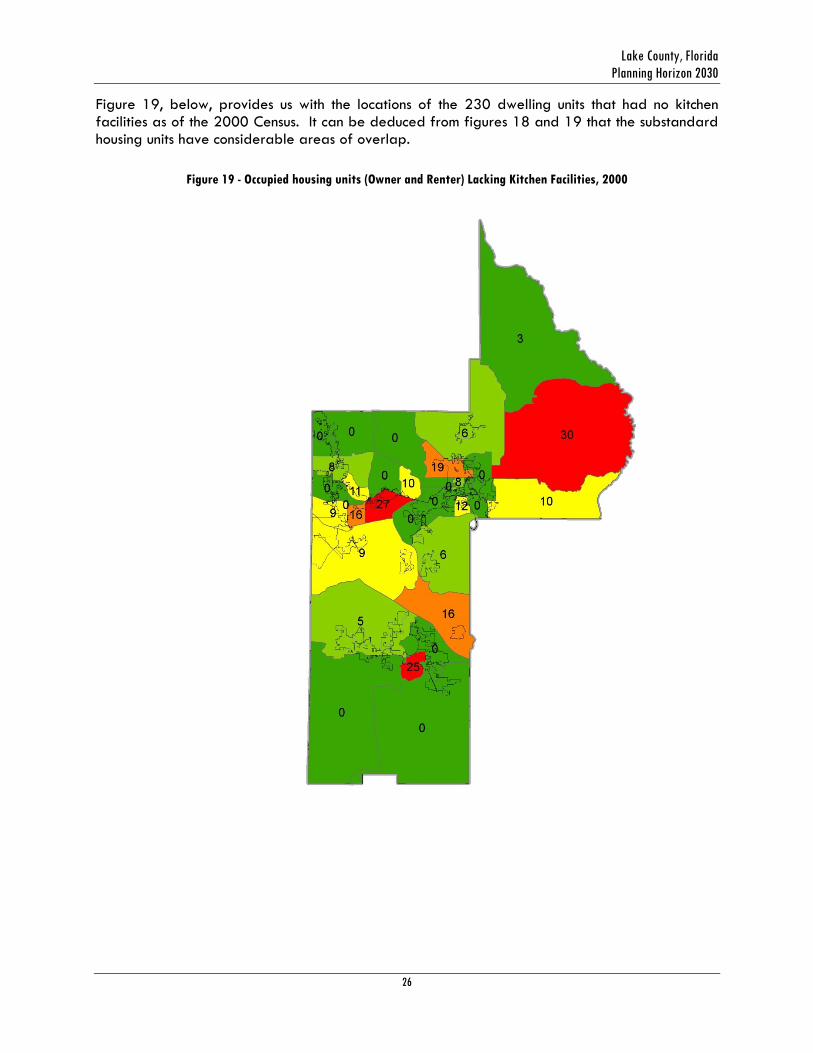
Figure 19, below, provides us with the locations of the 230 dwelling units that had no kitchen facilities as of the 2000 Census. It can be deduced from figures 18 and 19 that the substandard housing units have considerable areas of overlap.
Figure 19 - Occupied housing units (Owner and Renter) Lacking Kitchen Facilities, 2000

Housing Element
Data, Inventory & Analysis
27
Owner Occupied
Lake County
Unheated Homes
9 136
7
14
8
51
129
Eustis Fruitland Park Groveland Lady Lake Leesburg Mascotte Tavares Unincorporated LC
Renter Occupied
Lake County
Unheated Homes
56
39
71917
5
97
2
4
Eustis Groveland Howey-in-the-Hills
Leesburg Mascotte Mount Dora
Tavares Umatilla Unincorporated LC
Figures 20 and 21, below, show the distribution throughout the County of the 483 dwelling units that have no provisions for heat.
Figure 20 and Figure 21 - Lake County Owner & Renter Occupied Unheated Homes as of 2000 Census
Tavares
237 Total Units
246 Total Units

Lake County, Florida
Planning Horizon 2030
28
Overcrowding, typically defined as having more than one person per room, is more prevalent in four types of counties: (1) large multi-ethnic urban counties; (2) counties in the West and Upper Midwest with large populations of American Indians and Native Alaskans; (3) predominantly Latino communities; and (4) one which has historically described Lake County, namely agricultural counties. Lake County overall had a 2.73% overcrowding rate, or 2,417 dwelling units out of the 88,413 in the County, were overcrowded for the Census 2000 count. Mascotte, Groveland and Astatula have the largest concentration of overcrowded housing and also have larger Latino populations that supported the agricultural communities of Lake County. Table 18 details all occurrences of overcrowded housing in the County.
Table 18 - Overcrowded Owner and Renter Occupied Dwelling Units by Municipality, 2000
AFFORDABLE RENTAL AND HOME OWNERSHIP PROGRAMS IN THE COUNTY
Section 8 Housing Choice Voucher Program
Landlords of privately owned rental units (which can be single family homes, apartment units, etc.) participating in the low-income rental assistance program, receive subsidies on behalf of qualified low-income tenants, allowing the tenants to pay a limited proportion (usually about 30%) of their income toward the rent. The Lake County Housing Agency presently assists 425 low-income families through the federally supported (U.S. Department of Housing & Urban Development) Section 8 Housing Choice Voucher program.
OWNER & RENTER OCCUPIED OWNER OCCUPIED RENTER OCCUPIED
Place Name
Total Dwelling Units
Overcrowded Dwelling Units
% Overcrowded Housing
Dwelling Units
> 1 Person per Room
% Over-crowded Housing
Dwelling Units
> 1 Person per Room
% Over-crowded Housing
Lake County 88,413 2,417 2.73% 72,047 1,210 1.68% 16,366 1,207 7.38%
Astatula 479 28 5.85% 404 10 2.48% 75 18 24.00%
Clermont 4,180 141 3.37% 3,003 58 1.93% 1,177 83 7.05%
Eustis 6,419 252 3.93% 4,355 85 1.95% 2,064 167 8.09%
Fruitland Park 1,179 27 2.29% 910 16 1.76% 269 11 4.09%
Groveland 823 55 6.68% 590 31 5.25% 233 24 10.30%
Howey-in-the-Hills 390 10 2.56% 336 8 2.38% 54 2 3.70%
Lady Lake 6,136 22 0.36% 5,634 16 0.28% 502 6 1.20%
Leesburg 6,802 343 5.04% 3,974 102 2.57% 2,828 241 8.52%
Mascotte 787 127 16.14% 585 68 11.62% 202 59 29.21%
Minneola 1,869 60 3.21% 1,497 41 2.74% 372 19 5.11%
Montverde 359 6 1.67% 303 2 0.66% 56 4 7.14%
Mount Dora 4,129 147 3.56% 2,667 42 1.57% 1,462 105 7.18%
Tavares 4,544 120 2.64% 3,646 68 1.87% 898 52 5.79%
Umatilla 866 4 0.46% 609 4 0.66% 257 0.00%
Unincorporated LC 49,451 1,075 2.17% 43,534 659 1.51% 5,917 416 7.03%
Housing Element
Data, Inventory & Analysis
29
SHIP and Florida Homebuyer Opportunity Program (FL HOP)
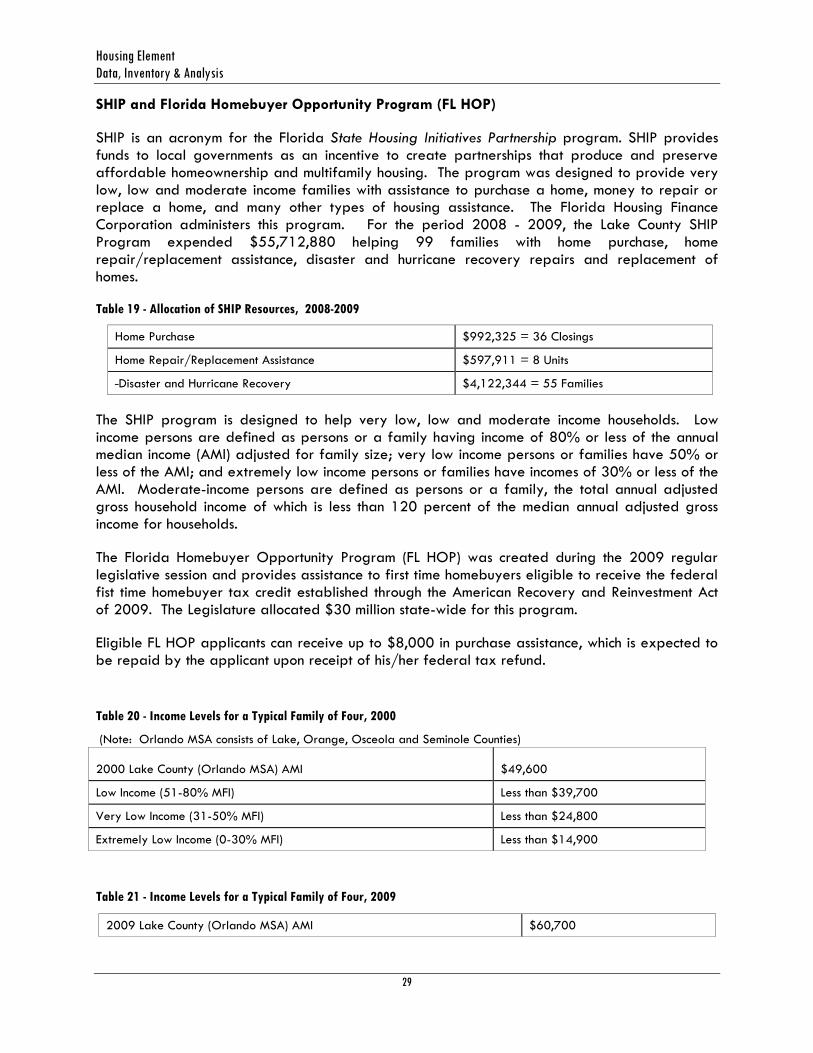
SHIP is an acronym for the Florida State Housing Initiatives Partnership program. SHIP provides funds to local governments as an incentive to create partnerships that produce and preserve affordable homeownership and multifamily housing. The program was designed to provide very low, low and moderate income families with assistance to purchase a home, money to repair or replace a home, and many other types of housing assistance. The Florida Housing Finance Corporation administers this program. For the period 2008 - 2009, the Lake County SHIP Program expended $55,712,880 helping 99 families with home purchase, home repair/replacement assistance, disaster and hurricane recovery repairs and replacement of homes.
Table 19 - Allocation of SHIP Resources, 2008-2009
Home Purchase $992,325 = 36 Closings
Home Repair/Replacement Assistance $597,911 = 8 Units
Disaster and Hurricane Recovery $4,122,344 = 55 Families
The SHIP program is designed to help very low, low and moderate income households. Low income persons are defined as persons or a family having income of 80% or less of the annual median income (AMI) adjusted for family size; very low income persons or families have 50% or less of the AMI; and extremely low income persons or families have incomes of 30% or less of the AMI. Moderate-income persons are defined as persons or a family, the total annual adjusted gross household income of which is less than 120 percent of the median annual adjusted gross income for households.
The Florida Homebuyer Opportunity Program (FL HOP) was created during the 2009 regular legislative session and provides assistance to first time homebuyers eligible to receive the federal fist time homebuyer tax credit established through the American Recovery and Reinvestment Act of 2009. The Legislature allocated $30 million state-wide for this program.
Eligible FL HOP applicants can receive up to $8,000 in purchase assistance, which is expected to be repaid by the applicant upon receipt of his/her federal tax refund.
Table 20 - Income Levels for a Typical Family of Four, 2000
(Note: Orlando MSA consists of Lake, Orange, Osceola and Seminole Counties)
Table 21 - Income Levels for a Typical Family of Four, 2009
2000 Lake County (Orlando MSA) AMI $49,600
Low Income (51-80% MFI) Less than $39,700
Very Low Income (31-50% MFI) Less than $24,800
Extremely Low Income (0-30% MFI) Less than $14,900
2009 Lake County (Orlando MSA) AMI $60,700

Lake County, Florida
Planning Horizon 2030
30
Poverty Guidelines and Income Distribution in Lake County
According to the 20010 Federal Poverty Guidelines, a family of four earning $22,050 and below is considered to be in poverty.
Table 22 (below) shows us that for the year 2000 there were more than 13,809 (15.6%) families in Lake County that fell below the Federal poverty level, about 1 out of every 6 households. In 1990, when the poverty level was $12,700, Lake County had over 14,289 (22%) families below the national poverty level. In 1990 this accounted for 1 out of every 5 households.
Table 22 - Lake County Income Distributions, 1990 vs. 2000
IMPEDIMENTS TO FAIR HOUSING CHOICE
In a report entitled, Impediments to Fair Housing Choice in Lake County, staff of the Community Development Block Grant division of the Department of Community services identified
Low Income, 80% or < $48,550
Very Low Income, 50% or < $30,350
Extremely Low Income, 30% or < $18,200
1990
(POVERTY LEVEL $12,700; AMI $37,500)
2000
(POVERTY LEVEL $17,050; AMI $49,600)
Income Range # of H/Hs % of H/H Income Range # of H/Hs % of H/H
Less than $10,000 9998 15.4% Less than $10,000 7,414 8.4%
$10,000 to $14,999 7845 12.1% $10,000 to $14,999 6,395 7.2%
$15,000 to $19,999 8292 12.8% $15,000 to $19,999 6,922 7.8%
$20,000 to $24,999 7932 12.2% $20,000 to $24,999 7,130 8.1%
$25,000 to $29,999 5924 9.1% $25,000 to $29,999 7,095 8.0%
$30,000 to $34,999 5530 8.5% $30,000 to $34,999 6,660 7.5%
$35,000 to $39,999 5530 8.5% $35,000 to $39,999 6,210 7.0%
$40,000 to $44,999 3222 5.0% $40,000 to $44,999 5,790 6.6%
$45,000 to $49,999 2410 3.7% $45,000 to $49,999 5,205 5.9%
$50,000 to $59,999 3096 4.8% $50,000 to $59,999 7,994 9.0%
$60,000 to $74,999 2504 3.9% $60,000 to $74,999 8,173 9.2%
$75,000 to $99,999 1476 2.3% $75,000 to $99,999 7,085 8.0%
$100,000 to $124,999 574 0.9% $100,000 to $124,999 2,907 3.3%
$125,000 to $149,999 244 0.4% $125,000 to $149,999 1,225 1.4%
$150,000+ 415 0.6% $150,000+ 2,178 2.5%
Total # of H/H: 64,992 100% Total # of H/H: 88,383 100%

Housing Element
Data, Inventory & Analysis
31
impediments to fair housing choice. Below is a summary, both positive and negative, of their findings:
All of the complaints received by the Department of Community Services since 2002 involved alleged violations of the familial status exemption.
The Lake County Fair Housing Ordinance was updated in 2002 to reflect changes in the federal law about accommodating handicapped persons.
Since the Fair Housing Ordinance was updated, most fair housing questions have been handled by the Department of Community Services and the few complaints received referred to the U. S. Department of Housing and Urban Development (HUD) and/or the Florida Commission on Human Relations. Also, all fair housing information disseminated by the County has come through Community Services.
The number of developments now specifying an age limitation for occupancy in their advertising and prospectuses has increased significantly since 2002.
The LDR's tend to segregate housing by density and separate residential districts from other land uses. Segregation by density and use artificially increases costs to develop and maintain housing, and thus reduces housing choices for lower income households. Land acquisition and site development costs are inflated because of the need to achieve minimum lot sizes, structure sizes, and right-of-way widths, and to observe required setbacks and frontages with resultant need to extend infrastructure.
Maximum allowable densities are seldom achieved due to the stringent requirements of the residential density point system.
Segregation of land uses by density also tends to concentrate low income housing. This is contrary to the goals of fair housing legislation, which seeks to disperse low income housing.
Segregation of land uses lowers accessibility and increases automobile dependency.
In March 2008, the Lake County Board of County Commissioners raised residential impact fees, the fees range from $11,769 to $12,710 for a site built single-family dwelling unit. The impact fees for mobile, manufactured, or modular homes range from $5,420 to $6,361 on lots that are not within a mobile home park. The impact fees on lots within a mobile home park are $4,637. The increase will in turn be passed on to new home buyers, thus raising new home prices and further restricting housing choices for lower income households.
The County may need to amend its Code of Ordinances to require that the racial makeup of lay advisory boards reflects the racial composition of the general population. This needs to be accompanied by increased outreach to recruit minority members.
The Lake County Housing Assistance Plan, prepared pursuant to the requirements of the State Housing Incentives Partnership (SHIP) program, outlines existing regulatory and administrative incentives to promote development of affordable housing. These include: 1) expedited permitting for affordable housing projects; 2) housing cost impact analyses of proposed ordinances, policies, regulations and Comprehensive Plan amendments which could increase

Lake County, Florida
Planning Horizon 2030
32
housing costs; 3) awarding of residential density points for affordable housing; and 4) allowance of cluster and zero lot line configurations.
The County offers impact fee waivers of 50 or 75 percent to encourage development of housing affordable to very low and low income households, if funds are available in the Impact Fee Interest Account.
Group homes for up to six residents are allowed by right in all residential districts; larger facilities housing 7 to 14 residents are permitted in high density residential and in commercial districts. There are no separation requirements for group homes.
Lake County uses State Housing Initiatives Partnership (SHIP) funds to assist low income households to purchase homes. All applicants are required to complete ten (10) hours of homebuyer education and home care and maintenance classes as part of the application process. The homeownership training includes a fair housing module informing them of their rights to obtain housing free from discrimination.
There is no bias inherent in the Section 8 tenant selection process; however, the potential for discrimination exists when tenants attempt to select housing. Two such instances have been reported in recent years.
Broadening of housing choice opportunities within Community Enhancement Areas should be an outcome of the CEA program.
There continue to be inequities in the distribution of the County’s infrastructure. Infrastructure deficits are most pronounced in the northern and most sparsely settled half of the County.
Transportation and employment/housing linkages still pose housing choice impediments that disproportionately impact low/moderate income households including minorities. County residents are almost completely dependent upon automobiles to get around. However, LakeXpress, a fixed route service was started in May, 2007. LakeXpress operates Monday – Friday from Lady Lake to Zellwood. The fixed route service currently provides over 800 trips per day.
The fact that automobile dependency is so prevalent in Lake County led County government to now include linkages to employment and commercial centers as a factor in approvals of new residential developments.
Many owners of low cost housing pay little or no property taxes. The homestead exemption was doubled in 1999 for property owners over 65 whose annual income is less than $20,000. The second exemption does not apply to younger low income households who may be just as needy and have to struggle to pay property taxes.
The Save Our Homes tax cap can impose a potentially insurmountable housing choice impediment to lower income prospective buyers, whose incomes are barely enough to qualify for a home purchase.
Percentages of loans approved in the Orlando MSA increases with relative affluence of the borrower. However, approval rates for minorities (African-Americans and Hispanics) are lower than those for Whites in the same income categories. Approval rates for African-Americans are

Housing Element
Data, Inventory & Analysis
33
below those for Hispanics in all income categories but one; the difference narrows as household affluence increases.
There appears to be very little difference in percentages of loans originated between males and females in the Orlando MSA.
There appears to be no correlation between relative affluence and percentages of loans originated by census tract.
The home maintenance classes required to participate in the SHIP Home Purchase Assistance program do not include a module on predatory lending. However, there has been enough predatory lending that the County does not subordinate unless the refinancing will result in a lower interest rate.
HISTORIC HOUSING
Twenty sites have been identified within the borders of Lake County and are included in the National Registry of Historical Places.
Table 23 – List of Historic Sites in Lake County
SITE NAME ADDRESS CITY LISTED
Bowers Bluff Middens Archeological District Address Restricted Astor 2/1/1980
Kimball Island Midden Archeological Site Address Restricted Astor 12/11/1979
Clermont Woman's Club 655 Broome St. Clermont 1/7/1993
Clifford House 536 N. Bay St. Eustis 4/4/1975
Ferran Park and the Alice McClelland Memorial Bandshell
Jct. of Ferran Park Rd. and Orange Ave. Eustis 6/23/1994
Norton, Gould Hyde, House 1390 E. Lakeview Dr. Eustis 5/16/1997
Pendleton, William Kimbrough, House 1208 Chesterfield Rd. Eustis 1/13/1983
Taylor, Moses J., House 117 Diedrich St. Eustis 8/1/1997
Woman's Club of Eustis 227 N. Center St. Eustis 8/5/1991
Holy Trinity Episcopal Church Spring Lake Rd. Fruitland Park 12/27/1974
Howey House Citrus St. Howey in the Hills 1/27/1983
Lee School 207 N. Lee St. Leesburg 2/17/1995
Mote--Morris House 1021 N. Main St. Leesburg 12/27/1974
Donnelly House Donnelly Ave. Mount Dora 4/4/1975
Lakeside Inn 100 N. Alexander St. Mount Dora 3/19/1987
Mount Dora A. C. L. Railroad Station, Old 341 Alexander St. Mount Dora 3/5/1992
Campbell House 3147 Co. Rd. 470 Okahumpka 11/12/1999
Duncan, Harry C., House 426 Lake Dora Dr. Tavares 8/8/1997
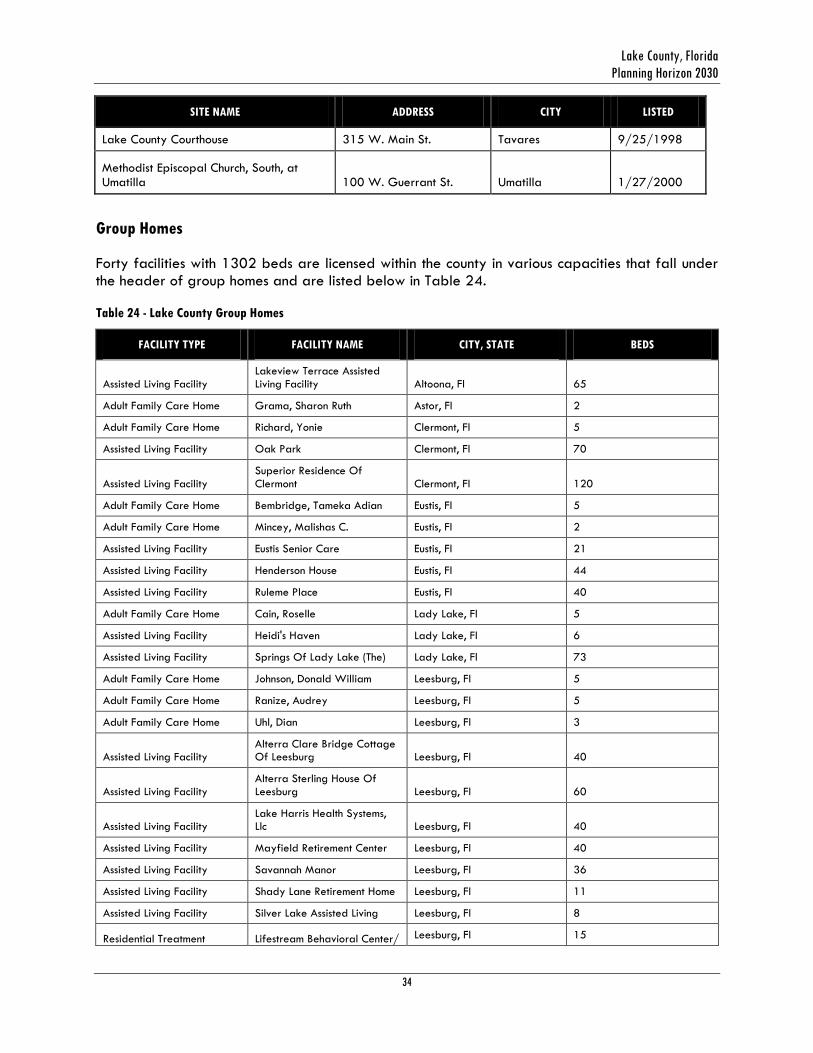
Lake County, Florida
Planning Horizon 2030
34
SITE NAME ADDRESS CITY LISTED
Lake County Courthouse 315 W. Main St. Tavares 9/25/1998
Methodist Episcopal Church, South, at Umatilla 100 W. Guerrant St. Umatilla 1/27/2000
Group Homes
Forty facilities with 1302 beds are licensed within the county in various capacities that fall under the header of group homes and are listed below in Table 24.
Table 24 - Lake County Group Homes
FACILITY TYPE FACILITY NAME CITY, STATE BEDS
Assisted Living Facility Lakeview Terrace Assisted Living Facility Altoona, Fl 65
Adult Family Care Home Grama, Sharon Ruth Astor, Fl 2
Adult Family Care Home Richard, Yonie Clermont, Fl 5
Assisted Living Facility Oak Park Clermont, Fl 70
Assisted Living Facility Superior Residence Of Clermont Clermont, Fl 120
Adult Family Care Home Bembridge, Tameka Adian Eustis, Fl 5
Adult Family Care Home Mincey, Malishas C. Eustis, Fl 2
Assisted Living Facility Eustis Senior Care Eustis, Fl 21
Assisted Living Facility Henderson House Eustis, Fl 44
Assisted Living Facility Ruleme Place Eustis, Fl 40
Adult Family Care Home Cain, Roselle Lady Lake, Fl 5
Assisted Living Facility Heidi's Haven Lady Lake, Fl 6
Assisted Living Facility Springs Of Lady Lake (The) Lady Lake, Fl 73
Adult Family Care Home Johnson, Donald William Leesburg, Fl 5
Adult Family Care Home Ranize, Audrey Leesburg, Fl 5
Adult Family Care Home Uhl, Dian Leesburg, Fl 3
Assisted Living Facility Alterra Clare Bridge Cottage Of Leesburg Leesburg, Fl 40
Assisted Living Facility Alterra Sterling House Of Leesburg Leesburg, Fl 60
Assisted Living Facility Lake Harris Health Systems, Llc Leesburg, Fl 40
Assisted Living Facility Mayfield Retirement Center Leesburg, Fl 40
Assisted Living Facility Savannah Manor Leesburg, Fl 36
Assisted Living Facility Shady Lane Retirement Home Leesburg, Fl 11
Assisted Living Facility Silver Lake Assisted Living Leesburg, Fl 8
Residential Treatment Lifestream Behavioral Center/ Leesburg, Fl 15

Housing Element
Data, Inventory & Analysis
35
FACILITY TYPE FACILITY NAME CITY, STATE BEDS
Facility Grts -- East
Residential Treatment Facility
Lifestream Behavioral Center/ Grts -- West Leesburg, Fl 15
Residential Treatment Facility
Lifestream Behavioral Center/ Lake Region Homes Leesburg, Fl 20
Assisted Living Facility Leisure Manor Minneola, Fl 24
Adult Family Care Home Johnson, Patricia Ann Mount Dora, Fl 4
Assisted Living Facility Bridgewater At Waterman Village Mount Dora, Fl 100
Assisted Living Facility Kiva Of Mount Dora Mount Dora, Fl 32
Assisted Living Facility Laurel Springs Of Mount Dora Mount Dora, Fl 8
Assisted Living Facility Pleasantville, Alf Mount Dora, Fl 14
Assisted Living Facility Sutton Homes #7 Mount Dora, Fl 5
Residential Treatment Facility National Deaf Academy Mount Dora, Fl 36
Assisted Living Facility Alterra Sterling House Of Tavares Tavares, Fl 60
Assisted Living Facility Grand Court Tavares (The) Tavares, Fl 65
Assisted Living Facility Heritage Alf, Inc. (The) Tavares, Fl 34
Assisted Living Facility Somerset Tavares, Fl 66
Assisted Living Facility Sunshine Christian Homes, Inc. Tavares, Fl 94
Adult Family Care Home Mazanski, Patricia Umatilla, Fl 4
MOBILE HOME PARKS
An inventory of mobile home parks and the dwelling units therein have accounted for 17,840 unit spaces as detailed in Appendix B.
HOUSING NEEDS
An update of the Housing Needs will be completed by 2012 and will provide information to 2030.
1. Describe the estimated housing needs projected for the next five year period for the following categories of persons: extremely low-income, low-income, moderate-income, and middle-income families, renters and owners, elderly persons, persons with disabilities, including persons with HIV/AIDS and their families, single persons, large families, public housing residents, victims of domestic violence, families on the public housing and section 8 tenant-based waiting list, and discuss specific housing problems, Including: cost-burden, severe cost-burden, substandard housing, and overcrowding (especially large families). 2. To the extent that any racial or ethnic group has a disproportionately greater need for any income category in comparison to the needs of that category as a whole, the jurisdiction must complete an assessment of that specific need. For this purpose, disproportionately greater need

Lake County, Florida
Planning Horizon 2030
36
exists when the percentage of persons in a category of need who are members of a particular racial or ethnic group is at least ten percentage points higher than the percentage of persons in the category as a whole. 3-5 Year Strategic Plan Housing Needs response: 1. Specific information as to the housing needs by income range, family type and size and persons with special needs is currently not available for Lake County. More specific information is available however, as to the housing needs of families currently on Lake County's Section 8 waiting lists. This information is displayed in the following table.
Table 25 - Lake County Housing Agency Waiting List Information
The chart below projects construction needs by housing type between 2005 and 2025:
Figure 22 - Lake County Projected Construction Demand
The greatest increases are in the number of single family homes: an almost 160% increase in 15 years. The table below compares housing costs as a percentage of income for owners and renters.

Housing Element
Data, Inventory & Analysis
37
Figure 23 - Lake County Cost Burden by Income
As would be expected, owners and renters in higher Income brackets are less likely to experience cost burdens of over 35% or their incomes. The greatest numbers of households experiencing cost burdens have incomes below $49,999. Projected trends in cost burden are shown in the chart below.
Figure 24 - Lake County Cost Burden 2000-2025

Lake County, Florida
Planning Horizon 2030
38
The number of households paying over 50% of the incomes for housing will double between 2000 and 2025. The chart below displays the numbers of families living in substandard housing by housing costs as a percentage of income in 2000. The greatest number of families living in substandard housing are paying less than 30% of their incomes for housing.
Figure 25 - Lake County Owner & Renter Occupied Unheated Homes as of 2000 Census
2. Shaded cells in the Housing Data Tables on pages 22-26 indicate disproportionate need. The table below outlines household types within racial and ethnic groups that have disproportionate needs.

Housing Element
Data, Inventory & Analysis
39
Table 26 – Household Types with Disproportionate Needs
Priority Housing Needs (91.215 (b) 1. Identify the priority housing needs and activities in accordance with the categories specified in the Housing Needs Table (formerly Table 2A). These categories correspond with special tabulations of the U.S. census data provided by HUD for the preparation of the Consolidated Plan. 2. Provide an analysis of how the characteristics of the housing market and the severity of housing problems and needs of each category of residents provided the basis for determining the relative priority of each priority housing need category. Note: Family and income types may be grouped in the case of closely related categories of residents where the analysis would apply to more than one family or income type. 3. Describe the basis for assigning the priority given to each category of priority needs. 4. Identify any obstacles to meeting underserved needs. 3-5 Year Strategic Plan Priority Housing Needs response: 1. The tables on the next pages identify the priority housing needs by categories specified in the Housing Needs Table.
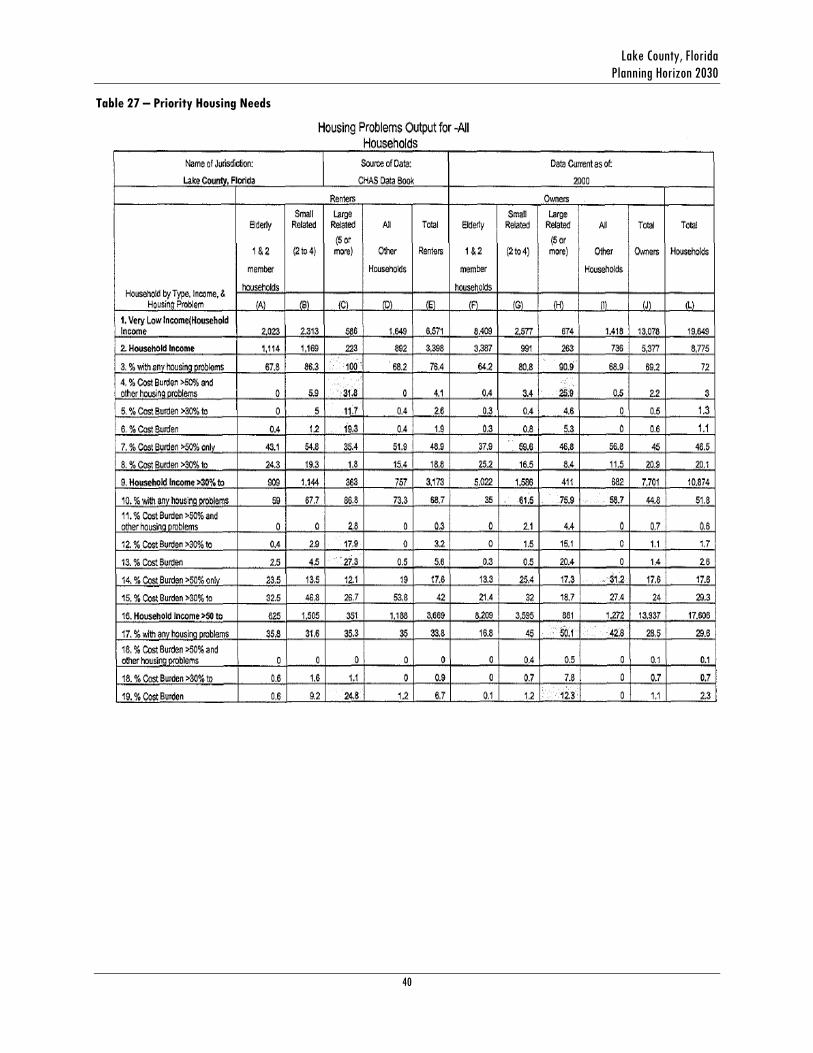
Lake County, Florida
Planning Horizon 2030
40
Table 27 – Priority Housing Needs

Housing Element
Data, Inventory & Analysis
41
Table 28 – Housing Problems Output for Hispanic Households
SOCDS CHAS Data: Housing Problems Output for Hispanic Households

Lake County, Florida
Planning Horizon 2030
42
Table 29 – Housing Problems for Black Non-Hispanic Households
SOCDS CHAS Data: Housing Problems Output for Black Non-Hispanic Households
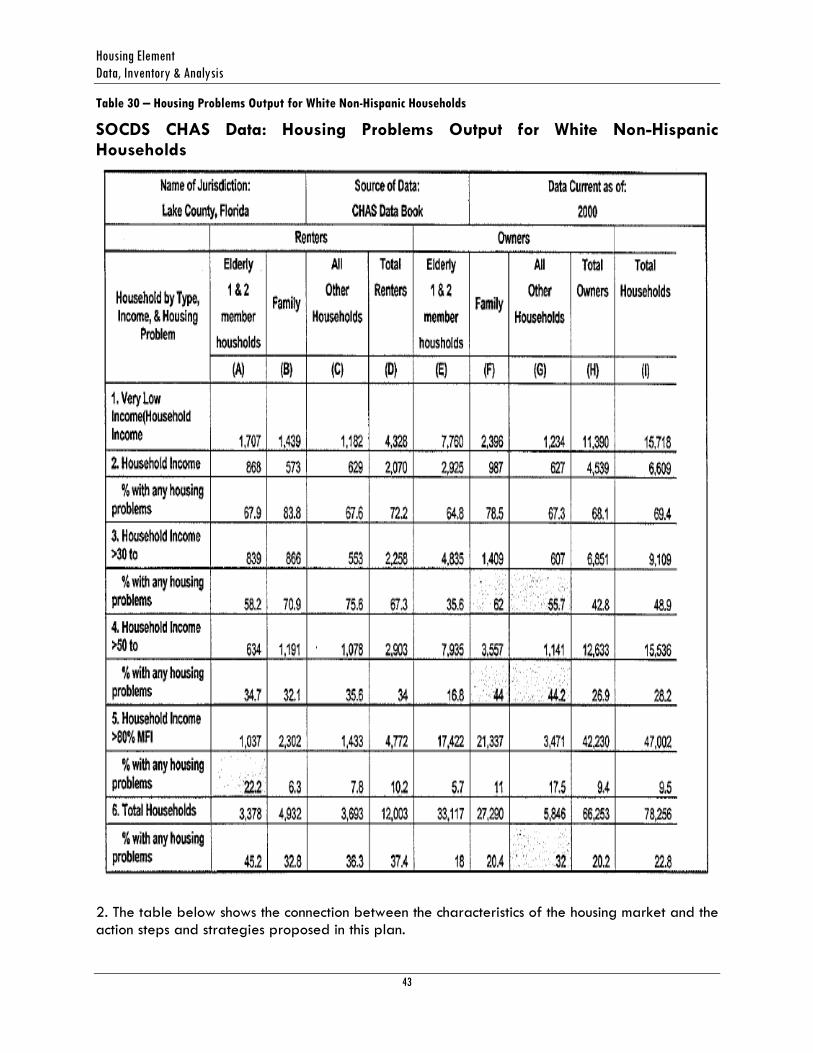
Housing Element
Data, Inventory & Analysis
43
Table 30 – Housing Problems Output for White Non-Hispanic Households
SOCDS CHAS Data: Housing Problems Output for White Non-Hispanic Households
2. The table below shows the connection between the characteristics of the housing market and the action steps and strategies proposed in this plan.
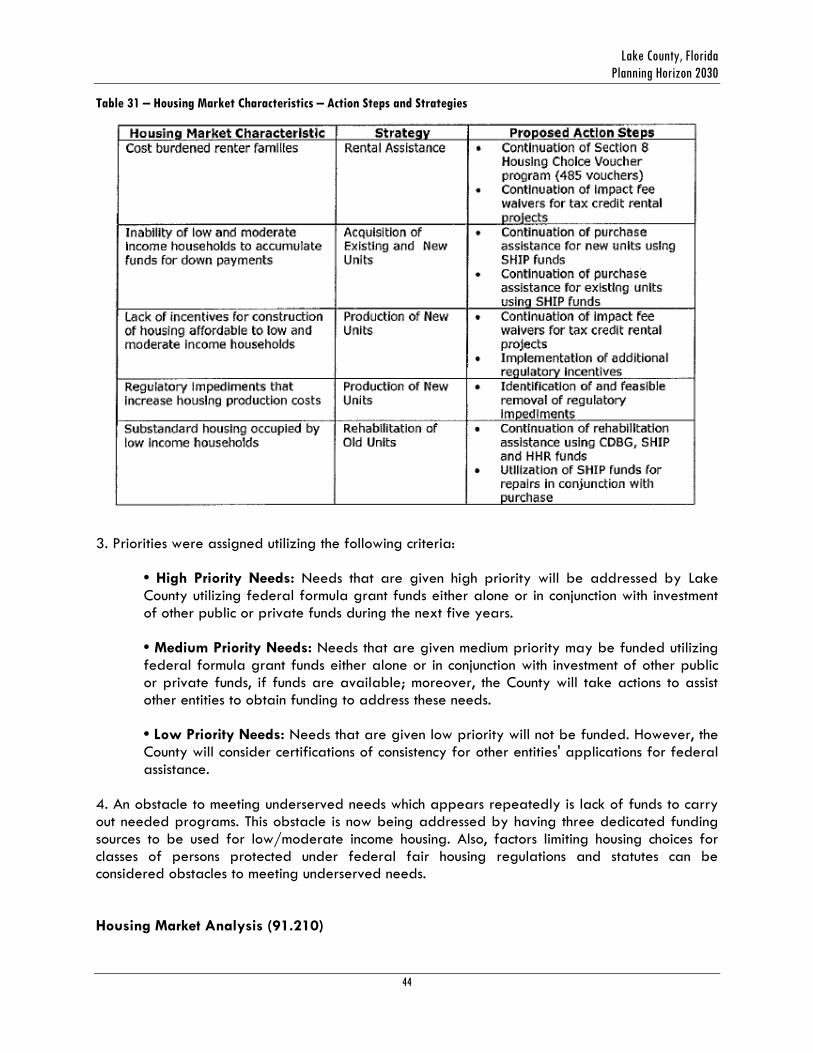
Lake County, Florida
Planning Horizon 2030
44
Table 31 – Housing Market Characteristics – Action Steps and Strategies
3. Priorities were assigned utilizing the following criteria:
• High Priority Needs: Needs that are given high priority will be addressed by Lake County utilizing federal formula grant funds either alone or in conjunction with investment of other public or private funds during the next five years. • Medium Priority Needs: Needs that are given medium priority may be funded utilizing federal formula grant funds either alone or in conjunction with investment of other public or private funds, if funds are available; moreover, the County will take actions to assist other entities to obtain funding to address these needs. • Low Priority Needs: Needs that are given low priority will not be funded. However, the County will consider certifications of consistency for other entities' applications for federal assistance.
4. An obstacle to meeting underserved needs which appears repeatedly is lack of funds to carry out needed programs. This obstacle is now being addressed by having three dedicated funding sources to be used for low/moderate income housing. Also, factors limiting housing choices for classes of persons protected under federal fair housing regulations and statutes can be considered obstacles to meeting underserved needs. Housing Market Analysis (91.210)

Housing Element
Data, Inventory & Analysis
45
1. Based on information available to the jurisdiction, describe the significant characteristics of the housing market in terms of supply, demand, condition and the cost of housing; the housing stock available to serve persons with disabilities; and to serve persons with HIV/AIDS and their families. Data on the housing market should include, to the extent Information is available, an estimate of the number of vacant or abandoned buildings and whether units in these buildings are suitable for rehabilitation. 2. Describe the number and targeting (income level and type of household served) of units currently assisted by local, state, or federally funded programs, and an assessment of whether any such units are expected to be lost from the assisted housing inventory for any reason, (i.e. expiration of Section 8 contracts). 3. Indicate how the characteristics of the housing market will influence the use of funds made available for rental assistance, production of new units, rehabilitation of old units, or acquisition of existing units. Please note, the goal of affordable housing is not met by beds in nursing homes. 3-5 Year Strategic Plan Housing Market Analysis responses: 1. The table below displays the composition of Lake County's housing supply in 2000.
Table 32 - Lake County’s Housing Supply, 2000
Almost 60% are single family homes and 30% mobile homes. Multifamily units make up most of the remainder. The table below displays vacancy rates. Information is not available as to whether these units are suitable for rehabilitation:
Table 33 – Vacancy Rates
The chart below projects the number of units that will be needed by 2025.
Figure 26 – Projected Construction Need by Type
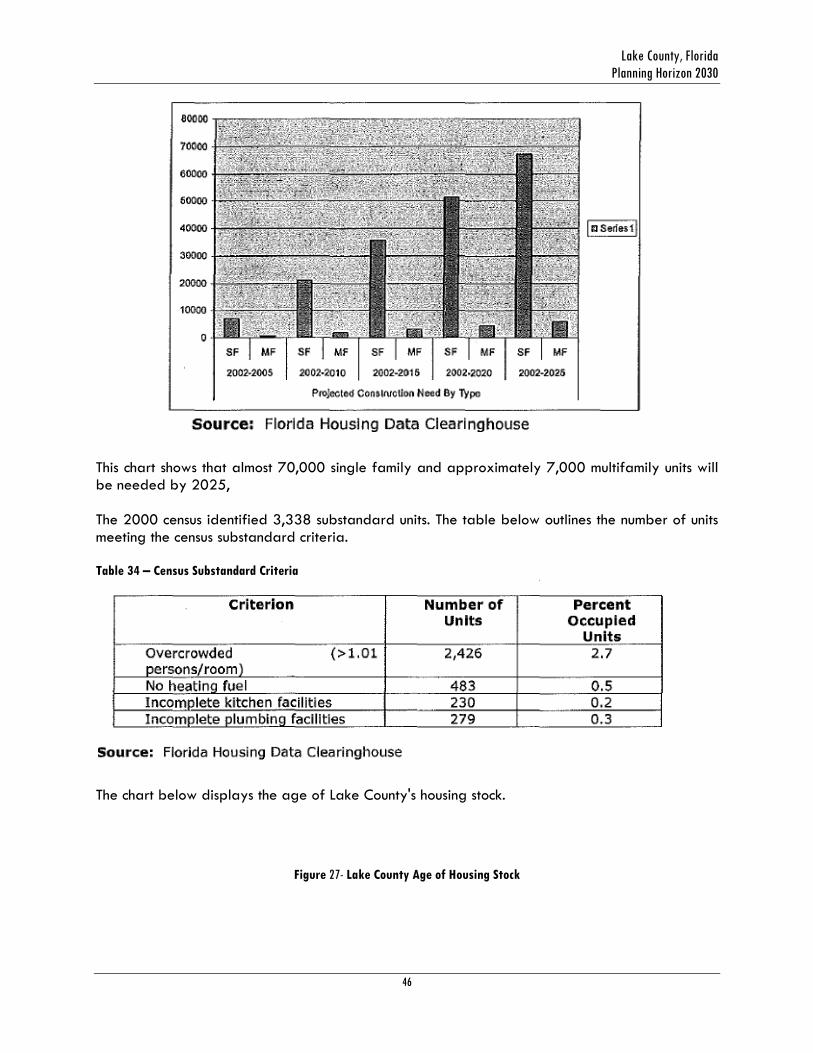
Lake County, Florida
Planning Horizon 2030
46
This chart shows that almost 70,000 single family and approximately 7,000 multifamily units will be needed by 2025, The 2000 census identified 3,338 substandard units. The table below outlines the number of units meeting the census substandard criteria. Table 34 – Census Substandard Criteria
The chart below displays the age of Lake County's housing stock.
Figure 27- Lake County Age of Housing Stock

Housing Element
Data, Inventory & Analysis
47
Slightly over one-third of the units were built during the 1990's. The chart below displays monthly housing costs for all units, with over 5,000 units costing in the $1,000 to $1,249 range, and a smaller peak of nearly 4,000 units in the $700 to $799 range.
Figure 28 - Lake County Owner & Renter Occupied Unheated Homes as of 2000 Census
Monthly costs for renters are correspondingly lower as shown in the chart below.
Figure 29 - Lake County Renter Housing Costs
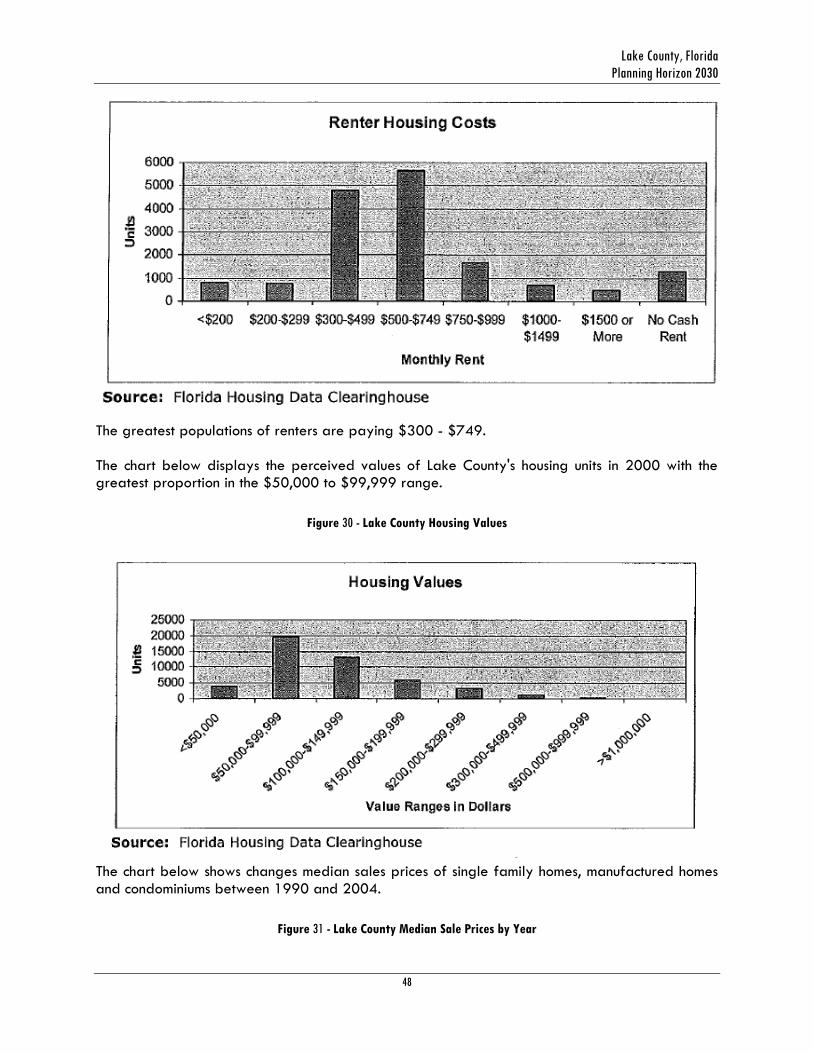
Lake County, Florida
Planning Horizon 2030
48
The greatest populations of renters are paying $300 - $749. The chart below displays the perceived values of Lake County's housing units in 2000 with the greatest proportion in the $50,000 to $99,999 range.
Figure 30 - Lake County Housing Values
The chart below shows changes median sales prices of single family homes, manufactured homes and condominiums between 1990 and 2004.
Figure 31 - Lake County Median Sale Prices by Year

Housing Element
Data, Inventory & Analysis
49
The prices of single family homes increased 50% between 1990 and 2004, while the prices of condominiums and manufactured homes remained relatively flat. There are no units specifically set aside In Lake County to serve persons with HIV/AIDS. The units available for persons with disabilities are listed in the table below. Table 35 – Units Available for Persons with Disabilities
All units reported are HUD-assisted. The map on the next page displays Lake County's low and moderate income block groups and areas of minority concentration. 2. See the table above for the units specifically targeted toward persons with disabilities. The
next table lists units specifically targeted toward elderly persons and families. No units are expected to be lost from the Inventory.
Figure 32 - Lake County Low/Moderate Income & Areas of Minority Concentration by Block Group

Lake County, Florida
Planning Horizon 2030
50

Housing Element
Data, Inventory & Analysis
51
Table 36 – Units Targeted for Elderly Citizens and Families
3. The table below indicates how the characteristics of the housing market will influence the use of funds made available for rental assistance, production of new units, rehabilitation of old units, or acquisition of existing units.

Lake County, Florida
Planning Horizon 2030
52
Table 37 – Housing Market Influences Rental, Production, Rehabilitation, or Acquisition
Specific Housing Objectives (91.215 (b) 1. Describe the priorities and specific objectives the jurisdiction hopes to achieve over a specified time period. 2. Describe how Federal, State, and local public and private sector resources that are reasonably expected to be available will be used to address identified needs for the period covered by the strategic plan. 3-5 Year Strategic Plan Specific Housing Objectives response:
1. Most of Lake County's housing projects will be funded from State Housing Initiatives Partnership (SHIP) funds. The table below is excerpted from the Executive Summary and describes the objectives the Lake County hopes to achieve utilizing federal funds during the period 2004-2010.

Housing Element
Data, Inventory & Analysis
53
Table 38 – 2004-2010 Federal Fund Utilization
2, The table below describes Federal, State, and local public and private sector resources that are reasonably expected to be available will be used to address identified housing needs for the period covered by the strategic plan.
Table 39 – Federal, State, Local and Private Sector Resources
Needs of Public Housing (91.210 (b) In cooperation with the public housing agency or agencies located within its boundaries, describe the needs of public housing, including the number of public housing units in the jurisdiction, the physical condition of such units, the restoration and revitalization needs of public housing projects within the jurisdiction, and other factors, including the number of families on public housing and tenant-based waiting lists and results from the Section 504 needs assessment of public housing projects located within its boundaries (i.e. assessment of needs of tenants and applicants on waiting list for accessible units as required by 24 CFR 8.25). The public housing agency and jurisdiction can use the optional Priority Public Housing Needs Table (formerly Table 4) of the Consolidated Plan to identify priority public housing needs to assist in this process. 3-5 Year Strategic Plan Needs of Public Housing response: The table below outlines the number of public housing units within Lake County. Table 40 - Lake County Public Housing Units

Lake County, Florida
Planning Horizon 2030
54
Lake County does not own nor operate any public housing. All units operated by the Eustis Housing Authority are in good condition and on line. The following table is repeated and describes the composition of the Lake County Housing Agency waiting list. The composition of the Eustis Housing Authority waiting list is unknown. Table 41 - Lake County Housing Agency Waiting List Information
Public Housing Strategy (91.210) 1. Describe the public housing agency's strategy to serve the needs of extremely low-income, low-income, and moderate-income families residing in the jurisdiction served by the public housing agency (including families on the public housing and section 8 tenant-based waiting list), the public housing agency's strategy for addressing the revitalization and restoration needs of public housing projects within the jurisdiction and improving the management and operation of such public housing, and the public housing agency's strategy for improving the living environment of extremely low-income, low-income, and moderate-income families residing in public housing. 2. Describe the manner in which the plan of the jurisdiction will help address the needs of public housing and activities it will undertake to encourage public housing residents to become more involved in management and participate in homeownership. (NAHA Sec, 105 (b)(l) and (91.215 (k)) 3. If the public housing agency is designated as "troubled" by HUD or otherwise is performing poorly, the jurisdiction shall describe the manner in which it will provide financial or other assistance in Improving its operations to remove such designation. (NAHA Sec. 105 (g)) 3-5 Year Strategic Plan Public Housing Strategy response:

Housing Element
Data, Inventory & Analysis
55
Public Housing Strategy (91.210) 1. The table below describes the Lake County Housing Agency's strategy to serve the needs of extremely low-income and low-income families residing in the jurisdiction served by the public housing agency (including families on the public housing and section 8 tenant-based waiting list), the public housing agency's strategy for addressing the revitalization and restoration needs of public housing projects within the jurisdiction and improving the management and operation of such public housing, and the public housing agency's strategy for improving the living environment of extremely low-income, low-income, and moderate-income families residing in public housing. Table 42 - Lake County Housing Agency’s Strategy
2. Lake County does not own nor operate any public housing. The Lake County Housing Agency maintains a Residents' Board, which is consulted on any proposed policy changes. A member of this Board votes with the Board of County Commissioners to make decisions on policy changes. In addition to countywide citizen participation efforts, grantees are required to make special efforts to encourage participation by public housing residents in the consolidated planning process, as well as other activities. The County notifies public housing authorities of public hearings and any other relevant community meetings, and invites them to participate. It is the responsibility of the Public Housing Agency to make this information available to the residents. 3. The Lake County Housing Agency is not designated as "troubled".
Barriers to Affordable Housing (91.210 (e) and 91.215 (f)
Lake County, Florida
Planning Horizon 2030
56
1. Explain whether the cost of housing or the incentives to develop, maintain, or improve affordable housing are affected by public policies, particularly those of the local jurisdiction. Such policies include tax policy affecting land and other property, land use controls, zoning ordinances, building codes, fees and charges, growth limits, and policies that affect the return on residential investment.
2. Describe the strategy to remove or ameliorate negative effects of public policies that serve as
barriers to affordable housing, except, if a State requires a unit of general local government to submit a regulatory barrier assessment that is substantially equivalent to the information required under this part, as determined by HUD, the unit of general local government may submit that assessment to HUD and it shall be considered to have complied with this requirement,
3-5 Year Strategic Plan Barriers to Affordable Housing response:
1. The table on the next three pages is excerpted from the Action Plan section of the Lake County Analysis of Impediments to Fair Housing Choice. It outlines public policies that pose barriers to development, acquisition and/or occupancy of housing affordable to low and moderate-income households and outlines action steps Lake County is implementing or plans to implement to reduce those barriers.
Table 43 – Public Policies that Pose Barriers

Housing Element
Data, Inventory & Analysis
57

Lake County, Florida
Planning Horizon 2030
58

Housing Element
Data, Inventory & Analysis
59
2. Lake County's FY 2006-09 Local Housing Assistance Plan assesses policies that potentially pose regulatory barriers that artificially increase the cost of producing housing. The assessment is quoted below. III. LHAP INCENTIVE STRATEGIES Section 420.9071(16), F.S.
A. Name of the Strategy: Expedited Permitting
a. Established policy and procedures: The expedited review processes described below assumes that all required information, i.e. survey, flood zone determination etc., will be provided by the applicant at the time the application is filed. The process also assumes that the Growth Management Department is fully staffed and that there are no extenuating circumstances. To qualify for an expedited review process as an Affordable Housing Project; the application must be for the construction or renovation of dwelling units at or below 80% of the median price of a home in the Orlando Metropolitan Statistical Area (MSA).
• Building Permits: If the combined value of the land and the dwelling unit is 80% of the median price of a home or less, it qualifies for an expedited plan review and data entry process. The sales price (amount on the executed sales contract) of any unit must include the value of the land. In the case of rehabilitation or emergency repair of an existing unit, sales price or value must also include the cost of the improvements. The expedited process reduces the processing time from three working days to one working day. However, review by Environmental Health (outside the jurisdiction of the County) may still take up to three days.
• Zoning Permits: Prior to obtaining a building permit, applicants are required to obtain a zoning permit, which confirms that the proposed development is consistent with the County's Land Development Regulations.· Since the current process is reasonably expeditious, current procedures are adequate. • Platting, Site Plan, Subdivision and other Residential Applications requiring DRS (Development Review Staff) Approval: Development Review Staff (DRS) are the staff persons from County departments and State agencies that are responsible for reviewing and making recommendations on development proposals prior to project approval. For residential subdivisions or Planned Unit Developments (PUD's) outside the Wekiva River Protection Area, thirty percent (30%) of the dwelling units in each phase of the development must be affordable housing. This figure is drawn from the Lake County Land Development Regulations Section 3.03.03 as eligible for the maximum number of points under the Urban Area Residential Density Point System. Residential subdivisions or PUD's in the Wekiva River Protection area must have fifteen percent (15%) of the dwelling units in each phase of the development reserved for affordable housing. This figure is drawn from the Lake County Land Development Regulations Section 7.00.06 as eligible for the maximum number of affordable housing points under the Residential Development Point System. Applications for projects that meet affordable housing criteria can be submitted up to two weeks in advance of a DRS meeting instead of the 30 day period required of conventional applications.

Lake County, Florida
Planning Horizon 2030
60
• Zoning Board/ Board of County Commissioners: Applications for rezoning, conditional use, and Planned Unit Development (PUD) require approval of both the Zoning Board and the Board of County Commissioners. The normal processing time for these applications is three months. The Growth Management Department has reduced the processing schedule for affordable housing projects from three months to two months. Applicants will be given an additional 15 days in which to file their applications. • Board of Adjustment: The Board of Adjustment is authorized to grant variances and waivers to requirements of the Land Development Regulations (LDR's), when it can be demonstrated that the purpose of the LDR's will be or has been achieved by other means, or when application of these Regulations would create a substantial hardship or violate principles of fairness. The Growth Management Department has reduced the processing schedule for affordable housing projects to one month. Applicants will be given an additional 15 days in which to file their applications. • Lot Line Deviations: To create a lot that conforms to the County's Land Development Regulations, the County allows an administrative process to adjust lot lines. The processing time for Lot Line Deviations for affordable housing projects has been reduced from three weeks to two weeks. • Lot Splits: To create lot(s) that conform to the LDR's, the County allows an administrative minor subdivision referred to as a lot split. Lot Splits for affordable housing projects take no longer than 30 days.
As other procedures and applications that affect affordable housing are identified, similar and appropriate measures will be taken to expedite the review process.
B. Name of the Strategy: Ongoing Review Process
a. established policy and procedures: Provide Description
Growth Management staff prepares reports that analyze proposed policies, procedures, ordinances, regulations, codes, rezonings and Comprehensive Plan Amendments. The staff reports are prepared for use by the various advisory boards and the Board of County Commissioners, and may or may not serve as a basis of their decision. The reports include a section in all relevant staff reports that analyzes the impact of the proposed action on the cost of housing. The potential to increase the cost of housing shall not in itself be sufficient to recommend denial of any proposed changes to existing policies, procedures, ordinances, regulations, or plan provisions.
Homeless Needs (91.205 (b) and 91.215 (e) Homeless Needs- The jurisdiction must provide a concise summary of the nature and extent of homelessness in the jurisdiction, (Including rural homelessness and chronic homelessness where applicable), addressing separately the need for facilities and services for homeless persons and homeless families with children, both sheltered and unsheltered and homeless sub-populations, in accordance with the Table. The summary must include the characteristics and needs of low-income individuals and children, (especially extremely low-income) who are currently housed but are at imminent risk of either residing in shelters or becoming unsheltered. In addition, to the extent
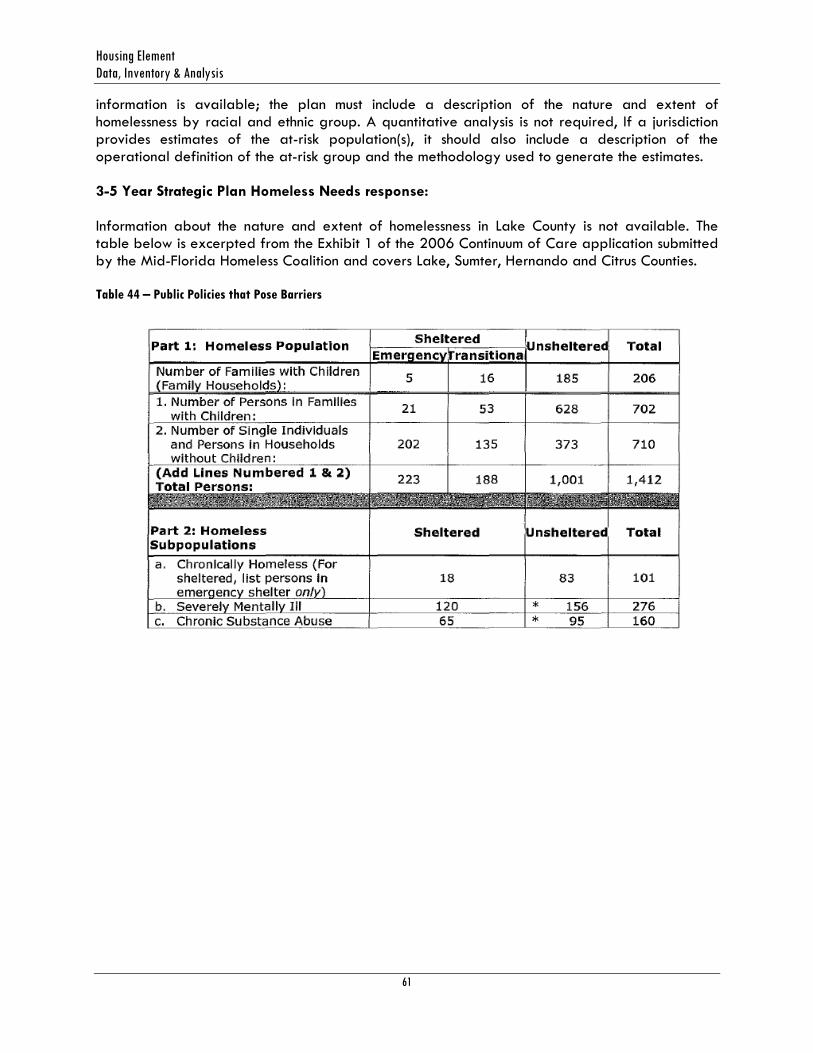
Housing Element
Data, Inventory & Analysis
61
information is available; the plan must include a description of the nature and extent of homelessness by racial and ethnic group. A quantitative analysis is not required, If a jurisdiction provides estimates of the at-risk population(s), it should also include a description of the operational definition of the at-risk group and the methodology used to generate the estimates. 3-5 Year Strategic Plan Homeless Needs response: Information about the nature and extent of homelessness in Lake County is not available. The table below is excerpted from the Exhibit 1 of the 2006 Continuum of Care application submitted by the Mid-Florida Homeless Coalition and covers Lake, Sumter, Hernando and Citrus Counties. Table 44 – Public Policies that Pose Barriers

Lake County, Florida
Planning Horizon 2030
62
Housing Element
Data, Inventory & Analysis
63
APPENDIX A
TERMS DEFINED
Below are definitions of commonly used terms included within this document.
Affordable housing, means housing for which monthly rents or monthly mortgage payments, including taxes, insurance, and utilities, do not exceed 30% of that amount which represents the percentage of the median adjusted gross income for the households or person indicated in Section 420.004, F.S. Affordable housing definitions that are prescribed by other affordable housing programs administered by either the US Department of Housing and Urban Development or the State of Florida may be used by local governments if such programs are implemented by the to provide affordable housing. 9J-5.003(1), F.A.C.
Dwelling Unit: A house, an apartment, a mobile home or trailer, a group of rooms, or a single room occupied as separate living quarters, or if vacant, intended for occupancy as separate living quarters and for year-round housing. Separate living quarters are those in which the occupants live separately from any other individuals in the building and which have direct access from outside the building or through a common hall.
Hispanic or Latino: People who identify with the terms "Hispanic" or "Latino" are those who classify themselves in one of the specific Hispanic or Latino categories listed on the Census 2000 or ACS questionnaire—"Mexican," "Puerto Rican," or "Cuban"—as well as those who indicate that they are "other Spanish, Hispanic, or Latino." Origin can be viewed as the heritage, nationality group, lineage, or country of birth of the person or the person's parents or ancestors before their arrival in the United States. People who identify their origin as Spanish, Hispanic, or Latino may be of any race.
Household: A household includes all the people who occupy a dwelling unit as their usual place of residence.
Household size: The total number of people living in a dwelling unit.
Incorporated Totals: Refers to the total sum of items being referenced that lie within the municipal limits of the 14 cities and towns of Lake County.
Low Income: means one or more natural persons or a family, the total annual adjusted gross household income of which does not exceed 80 percent of the median annual adjusted gross income for households within the State, or 80 percent of the median annual adjusted gross income for households within the metropolitan statistical area (MSA) or, if not within an MSA, within the County in which the person or family resides, whichever is greater. Section 420.0004 (9), F.S.
Median Rent: The value at which half of the rents paid are higher and the other half is lower; also known as the middle-most value when they are sorted.
Moderate Income: means one or more natural persons or a family, the total annual adjusted gross household income of which is less than 120 percent of the median annual adjusted gross income for households within the state, or 120 percent of the median annual adjusted gross income for

Lake County, Florida
Planning Horizon 2030
64
households within the metropolitan statistical area (MSA) or, if not within an MSA, within the county in which the person or family resides, whichever is greater. Section 420.0004 (10), F.S.
Multi-Family Unit: A building that contains more than one dwelling unit (for example, an apartment building).
Place Totals: Refers to the total sum of items being referenced that lie within all incorporated areas as well as all Census Designated Places (CDPs) within Lake County. A Census Designated Place is a statistical entity, defined for each decennial census according to Census Bureau guidelines, comprising a densely settled concentration of population that is not within an incorporated place, but is locally identified by a name. CDPs are delineated cooperatively by state and local officials and the Census Bureau, following Census Bureau guidelines. Beginning with Census 2000 there are no size limits.
Single Family Unit: A structure containing one dwelling unit, designed for one family or household.
Unincorporated Lake County: Refers to all those areas of Lake County which have not previously been defined as being within the legal limits of the 14 incorporated municipalities of the County.
Very Low Income: means one or more natural persons or a family, not including students, the total annual adjusted gross household income of which does not exceed 50 percent of the median annual adjusted gross income for households within the state, or 50 percent of the median annual adjusted gross income for households within the metropolitan statistical area (MSA) or, if not within an MSA, within the county in which the person or family resides, whichever is greater. Section 420.0004 (14), F.S..

Housing Element
Data, Inventory & Analysis
65
APPENDIX B. MOBILE HOME PARKS IN LAKE COUNTY
Table 45 – Mobile Home Parks in Lake County
FACILITY ADDRESS CITY MH COUNT
Harbor Oaks Co-Op, Inc. 03990 Picciola Rd. Fruitland Park 204
Hawthorne 100 Hawthorne Blvd. Leesburg 1800
Water Oak Country Club Estates 106 Evergreen Lane Lady Lake 1300
Clerbrook RV Resort 20005 US 27N Clermont 1257
Mid-Florida Lakes Yacht Club 201 Forest Dr. Leesburg 1226
Lakes at Leesburg 10701 US HWY 441 S Leesburg 640
Sunlake Estates Mobile Home Park CR 452 Eustis 496
Lake Griffin Isles 200 Orchid Lane Fruitland Park 488
Oak Springs Mobile Home Court 12 Highland Ave. Sorrento 438
Grand Island Resort 36151 Citrus Blvd. Grand Island 395
Lake Griffin Harbor 33399 Water View Lane Leesburg 350
Chain O'Lakes (see Grand Island Resort) 308
Country Club Manor Co-Op, Inc. 1701 N Hwy 19, Ste 1 Eustis 299
Haselton Village 14 Coral Street Eustis 292
Molokai Co-Op 1 Hawaiian Way Leesburg 272
Palm Ridge Adult Village 1806 Timber Ridge Circle Leesburg 262
Country Squire Mobile Home Park 6 Country Squire Rd. Paisley 250
Orange Lake Mobile Community 15840 HWY 50 Clermont 242
Lakeside Terrace 24 Sunrise Lane Fruitland Park 241
Bonfire Cooperative Assoc., INC. 620 Misti Dr. Leesburg 230
Leesburg Landing 86 Dockside Dr. Leesburg 230
Spanish Village 25501 Hwy 27 S Leesburg 224
Woodlands at Church Lake Mobile Home Park 1124 Heritage Drive Groveland 220
Lakeside Village 2580 Lakeside Dr. Leesburg 216
Brittany Estates RO Assoc, Inc. 1000 Mark Rd Leesburg 213
Emerald Lakes Co-op 1401 W Hwy 50-office Clermont 211
Coachwood Colony MHP, LLC 2610 W Dogwood Pl. Leesburg 207
Tiki Village Mobile Home 1300 Dead River Road Tavares 206
Leesburg Lakeshore Mobile Home Park 1208 N Lee Street Leesburg 184
Sandpiper Mobile Home Manor 1412 Azalea Dr. Leesburg 184
The Meadows 25115 Alamanda Dr. Astatula 178
Holiday Mobile Park 561 East Burleigh Blvd. Tavares 160
Lady Lake Mobile Home Park 2934 Griffin View Rd. Lady Lake 158
Lake Harris Landing, Ltd. 28340 River Run Drive Leesburg 154
Corley Island Mobile Manor 138 Kings Blvd. Leesburg 150

Lake County, Florida
Planning Horizon 2030
66
FACILITY ADDRESS CITY MH COUNT
Shangri-La By the Lake 100 Shangri-La Blvd. Leesburg 146
Hibiscus Mobile Home Community 1 Hibiscus Ave. Mt. Dora 144
Cypress Creek Mobile Home Park 28944 Hubbard St. Leesburg 142
Leisure Meadows Mobile Home Park 1920 Marion County Rd. Lot 10 Weirsdale 127
Riverest Mobile Home Community 49 Crescent Dr. Tavares 126
Hickory Hollow Estates 9705-31 Hickory Hollow Rd. Leesburg 125
Riley's Park 3401 N. HWY 19A Mt. Dora 122
Sharp's Mobile Park 43 Sharp Circle Eustis 115
Southernaire, LLC 1700 Sanford Rd. Mount Dora 107
Tara Village 10630 HWY 44 Leesburg 106
Lake Griffin Mobile Park 104 Christine Drive Leesburg 100
Ridgecrest RV & Mobile Home Park 26125 US HWY 27 S Leesburg 100
Timber Village Mobile Home Park 15130-6 Timber Village Rd. Groveland 100
Country Life Park #1 3813 Victor Blvd. Leesburg 99
Country Life Park #2 Victor Blvd. Leesburg 98
El Red Manor 451 E. Burleigh Blvd. Tavares 95
Palm Gardens Mobile Home 11801 HWY 441 Tavares 89
Sunshine Mobile Home Park 401 Sunshine Boulevard Lady Lake 84
Golden Estates Mobile Home Park 22 Golden Gem Rd. Umatilla 80
Midway Manor MH/RV Resort 36033 Emeralda Ave. Leesburg 75
Griffwood Co-Op, Inc. 03896 Picciola Rd. Fruitland Park 72
Mid Lakes Resort 317 S Lake Ave. Tavares 68
Highlands Mobile Home Park 17730 US HWY 27 Clermont 66
Marietta Mobile Home Park 1911 N. Citrus Blvd. Leesburg 66
Eagles Nest Mobile Home Estates 05519 Eagles's Nest Rd. Fruitland Park 65
Oak Lane Mobile Home Park 14238 Max Hooks Rd. Clermont 62
Lake Yale Estates 11630 Martell Ct. Leesburg 60
Picciola Landing 200 Orchid Dr. Fruitland Park 60
Fisherman's Wharf 5101 Eagle's Nest Rd. Fruitland Park 59
Morgan's Mobile Home Park 04056 Picciola Rd. Fruitland Park 58
Torchlite Travel Trailer 10201 HWY 27 S Clermont 54
Beach Mobile Home Park 32405 Beach Park Rd., #77 Leesburg 51
Orange Blossom Court 912 Linden St. Lady Lake 48
Lake Saunders Mobile Home Park 4301 HWY 19A Mt. Dora 47
Minnehaha Trailer Park 660 Hook St. Clermont 45
Lake Harris Hideaway 10550 Holloway Drive Leesburg 44
Lake Dora Trailer Park 120 Dora Ave. Tavares 42
Tween Waters 210 S. Lake Ave. Tavares 42
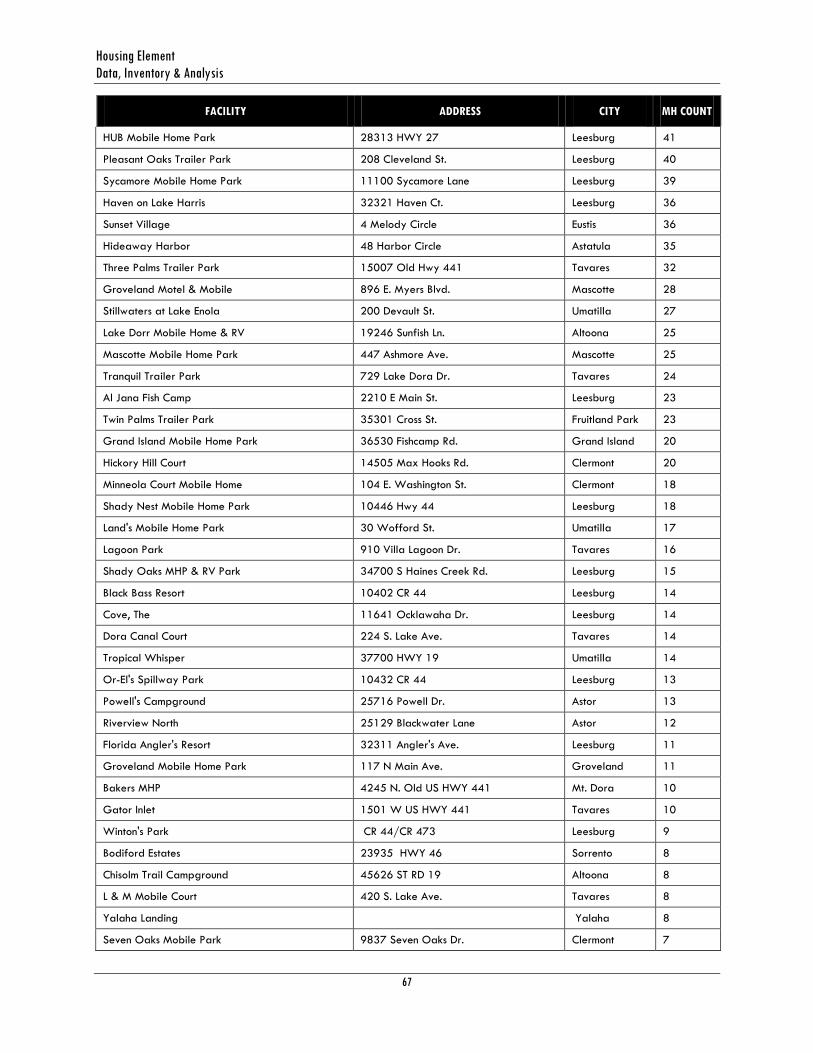
Housing Element
Data, Inventory & Analysis
67
FACILITY ADDRESS CITY MH COUNT
HUB Mobile Home Park 28313 HWY 27 Leesburg 41
Pleasant Oaks Trailer Park 208 Cleveland St. Leesburg 40
Sycamore Mobile Home Park 11100 Sycamore Lane Leesburg 39
Haven on Lake Harris 32321 Haven Ct. Leesburg 36
Sunset Village 4 Melody Circle Eustis 36
Hideaway Harbor 48 Harbor Circle Astatula 35
Three Palms Trailer Park 15007 Old Hwy 441 Tavares 32
Groveland Motel & Mobile 896 E. Myers Blvd. Mascotte 28
Stillwaters at Lake Enola 200 Devault St. Umatilla 27
Lake Dorr Mobile Home & RV 19246 Sunfish Ln. Altoona 25
Mascotte Mobile Home Park 447 Ashmore Ave. Mascotte 25
Tranquil Trailer Park 729 Lake Dora Dr. Tavares 24
Al Jana Fish Camp 2210 E Main St. Leesburg 23
Twin Palms Trailer Park 35301 Cross St. Fruitland Park 23
Grand Island Mobile Home Park 36530 Fishcamp Rd. Grand Island 20
Hickory Hill Court 14505 Max Hooks Rd. Clermont 20
Minneola Court Mobile Home 104 E. Washington St. Clermont 18
Shady Nest Mobile Home Park 10446 Hwy 44 Leesburg 18
Land's Mobile Home Park 30 Wofford St. Umatilla 17
Lagoon Park 910 Villa Lagoon Dr. Tavares 16
Shady Oaks MHP & RV Park 34700 S Haines Creek Rd. Leesburg 15
Black Bass Resort 10402 CR 44 Leesburg 14
Cove, The 11641 Ocklawaha Dr. Leesburg 14
Dora Canal Court 224 S. Lake Ave. Tavares 14
Tropical Whisper 37700 HWY 19 Umatilla 14
Or-El's Spillway Park 10432 CR 44 Leesburg 13
Powell's Campground 25716 Powell Dr. Astor 13
Riverview North 25129 Blackwater Lane Astor 12
Florida Angler's Resort 32311 Angler's Ave. Leesburg 11
Groveland Mobile Home Park 117 N Main Ave. Groveland 11
Bakers MHP 4245 N. Old US HWY 441 Mt. Dora 10
Gator Inlet 1501 W US HWY 441 Tavares 10
Winton's Park CR 44/CR 473 Leesburg 9
Bodiford Estates 23935 HWY 46 Sorrento 8
Chisolm Trail Campground 45626 ST RD 19 Altoona 8
L & M Mobile Court 420 S. Lake Ave. Tavares 8
Yalaha Landing Yalaha 8
Seven Oaks Mobile Park 9837 Seven Oaks Dr. Clermont 7

Lake County, Florida
Planning Horizon 2030
68
FACILITY ADDRESS CITY MH COUNT
Sparky's Fish Camp 11711 Ocklawaha Dr. Leesburg 7
Bay Island Cottages 11325 Ocklawaha Dr. Leesburg 5
Three Lakes Park Co-Op, Inc. 12315 US Hwy 441 Tavares 5
Cissne Trailer Park 4
Spillway Park 10432 HWY 44 Leesburg 3


