Embed Size (px)
Citation preview

HOUSING CONDITIONS
OF MIGRANT AND SEASONAL FARMWORKERS
Prepared by
C. Theodore Koebel, Ph.D. and Michael P. DanielsCenter for Housing Research
Virginia Polytechnic Institute and State University
for the
Virginia Department of Labor and IndustryVirginia Department of Housing and Community Development
Virginia Migrant and Seasonal Farmworkers Board
and the
Virginia Interagency Migrant Worker Policy Committee
May, 1997

Housing Conditions of Migrant and Seasonal Farmworkers Center for Housing Research
1
Introduction
Migrant, seasonal workers are a critical labor force for planting and harvesting a variety of
agricultural products in Virginia. Seasonal surges in demand for such labor are largely met by
migrant workers who come from outside the United States in search of temporary employment.
Within the agricultural economy, the farmer and the migrant worker have a symbiotic relationship
that is structured by several important constraints. The most important of these are the seasonality
of the work, the low skill level of the work, and wages set by a competitive market ultimately
driven by a price-conscious consumer.
The living conditions of migrant farmworkers have always been difficult. This is no less
so for the condition of their housing. During the work season, labor camps must find inexpensive
housing for a surge of workers. By its nature, the demand for this housing is temporary; but
temporary shelter is difficult to provide. Housing is capital intensive, which means it is expensive
compared to most other products. Providing decent quality housing for permanent residents with
low incomes in American communities is an ongoing unmet challenge. Providing decent quality
migrant housing is an even greater challenge, one which concerns not only the grower and the
worker, but the state. Reflecting this concern, the Virginia Department of Labor and Industry, the
Virginia Department of Housing and Community Development, and the Migrant and Seasonal
Farmworkers Board commissioned the Virginia Tech Center for Housing Research to study
migrant farmworker housing conditions within the Commonwealth. In addition to surveying the
quality of housing of migrant workers, the Center was asked to determine the magnitude of need
and level of interest among growers for a housing loan program to assist growers in upgrading
farmworker housing.
The difficulties surrounding the provision of migrant housing are paralleled in studying that
housing. The first challenge is determining how to gather information about migrant housing
conditions. Site visits are inordinately expensive except on a very selective basis--too selective to
provide reliable estimates for state planning purposes. Conducting telephone or mailed surveys of
migrant farmworkers would face numerous problems: most of the workers are only available
Housing Conditions of Migrant and Seasonal Farmworkers Center for Housing Research
2
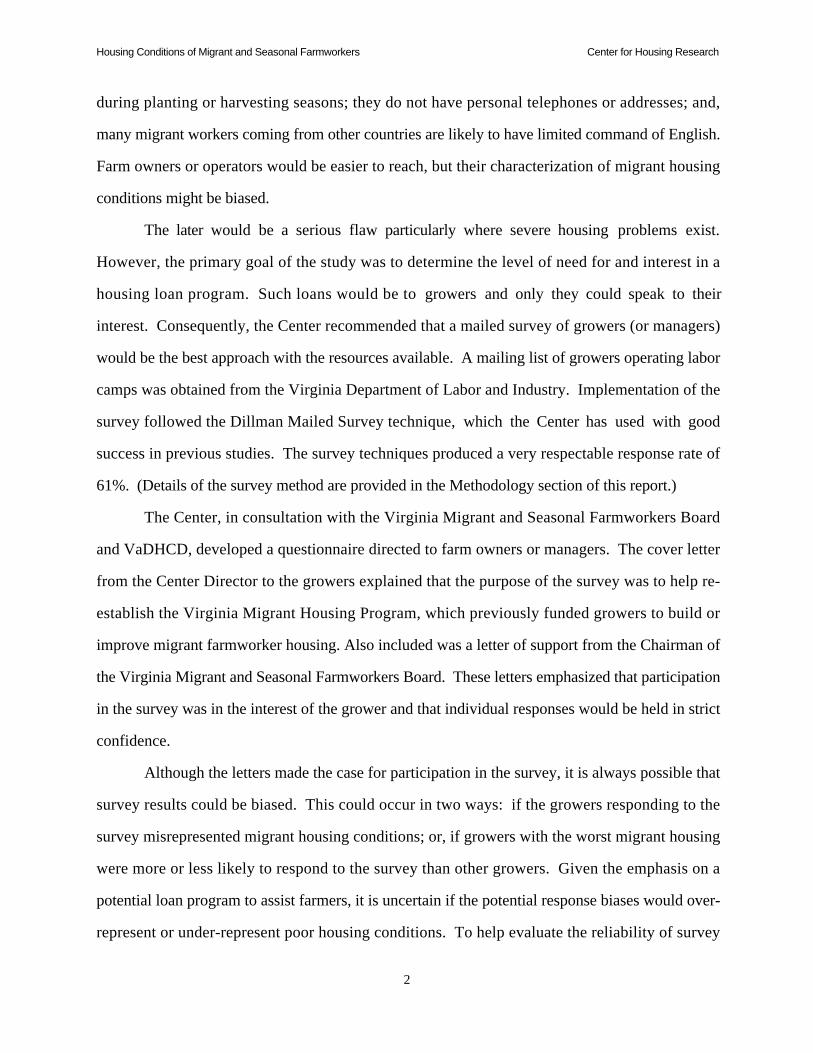
during planting or harvesting seasons; they do not have personal telephones or addresses; and,
many migrant workers coming from other countries are likely to have limited command of English.
Farm owners or operators would be easier to reach, but their characterization of migrant housing
conditions might be biased.
The later would be a serious flaw particularly where severe housing problems exist.
However, the primary goal of the study was to determine the level of need for and interest in a
housing loan program. Such loans would be to growers and only they could speak to their
interest. Consequently, the Center recommended that a mailed survey of growers (or managers)
would be the best approach with the resources available. A mailing list of growers operating labor
camps was obtained from the Virginia Department of Labor and Industry. Implementation of the
survey followed the Dillman Mailed Survey technique, which the Center has used with good
success in previous studies. The survey techniques produced a very respectable response rate of
61%. (Details of the survey method are provided in the Methodology section of this report.)
The Center, in consultation with the Virginia Migrant and Seasonal Farmworkers Board
and VaDHCD, developed a questionnaire directed to farm owners or managers. The cover letter
from the Center Director to the growers explained that the purpose of the survey was to help re-
establish the Virginia Migrant Housing Program, which previously funded growers to build or
improve migrant farmworker housing. Also included was a letter of support from the Chairman of
the Virginia Migrant and Seasonal Farmworkers Board. These letters emphasized that participation
in the survey was in the interest of the grower and that individual responses would be held in strict
confidence.
Although the letters made the case for participation in the survey, it is always possible that
survey results could be biased. This could occur in two ways: if the growers responding to the
survey misrepresented migrant housing conditions; or, if growers with the worst migrant housing
were more or less likely to respond to the survey than other growers. Given the emphasis on a
potential loan program to assist farmers, it is uncertain if the potential response biases would over-
represent or under-represent poor housing conditions. To help evaluate the reliability of survey
Housing Conditions of Migrant and Seasonal Farmworkers Center for Housing Research
3
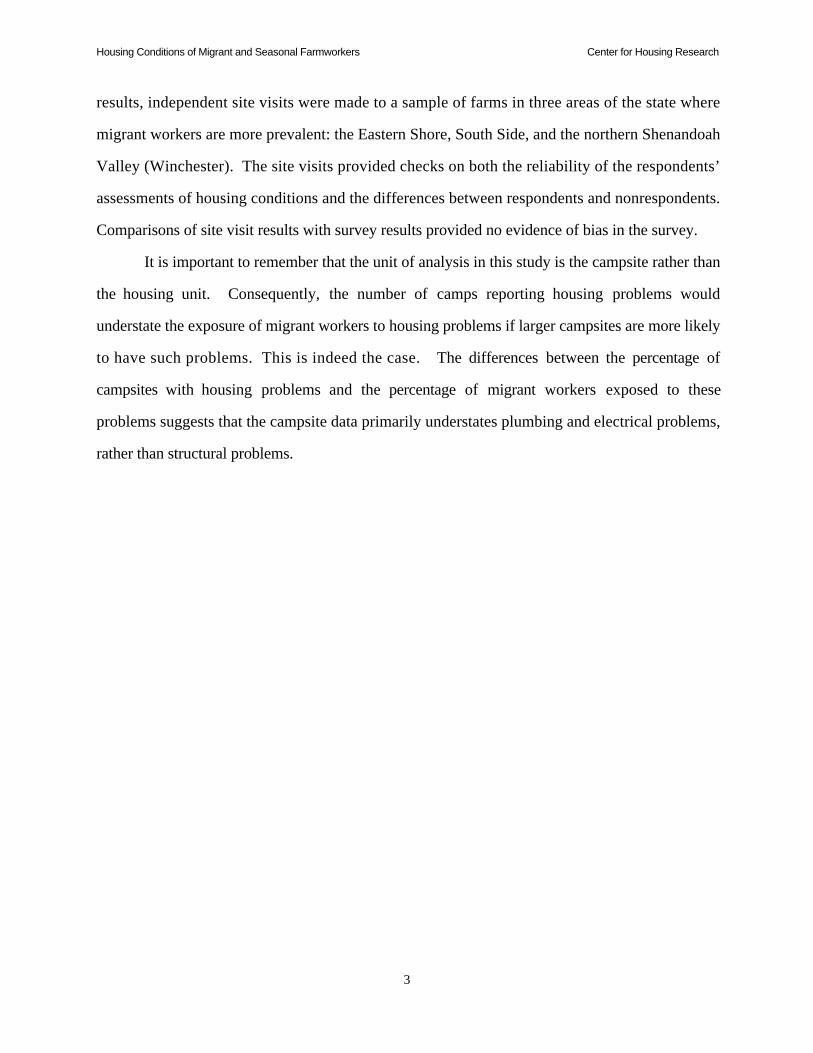
results, independent site visits were made to a sample of farms in three areas of the state where
migrant workers are more prevalent: the Eastern Shore, South Side, and the northern Shenandoah
Valley (Winchester). The site visits provided checks on both the reliability of the respondents’
assessments of housing conditions and the differences between respondents and nonrespondents.
Comparisons of site visit results with survey results provided no evidence of bias in the survey.
It is important to remember that the unit of analysis in this study is the campsite rather than
the housing unit. Consequently, the number of camps reporting housing problems would
understate the exposure of migrant workers to housing problems if larger campsites are more likely
to have such problems. This is indeed the case. The differences between the percentage of
campsites with housing problems and the percentage of migrant workers exposed to these
problems suggests that the campsite data primarily understates plumbing and electrical problems,
rather than structural problems.
Housing Conditions of Migrant and Seasonal Farmworkers Center for Housing Research
4
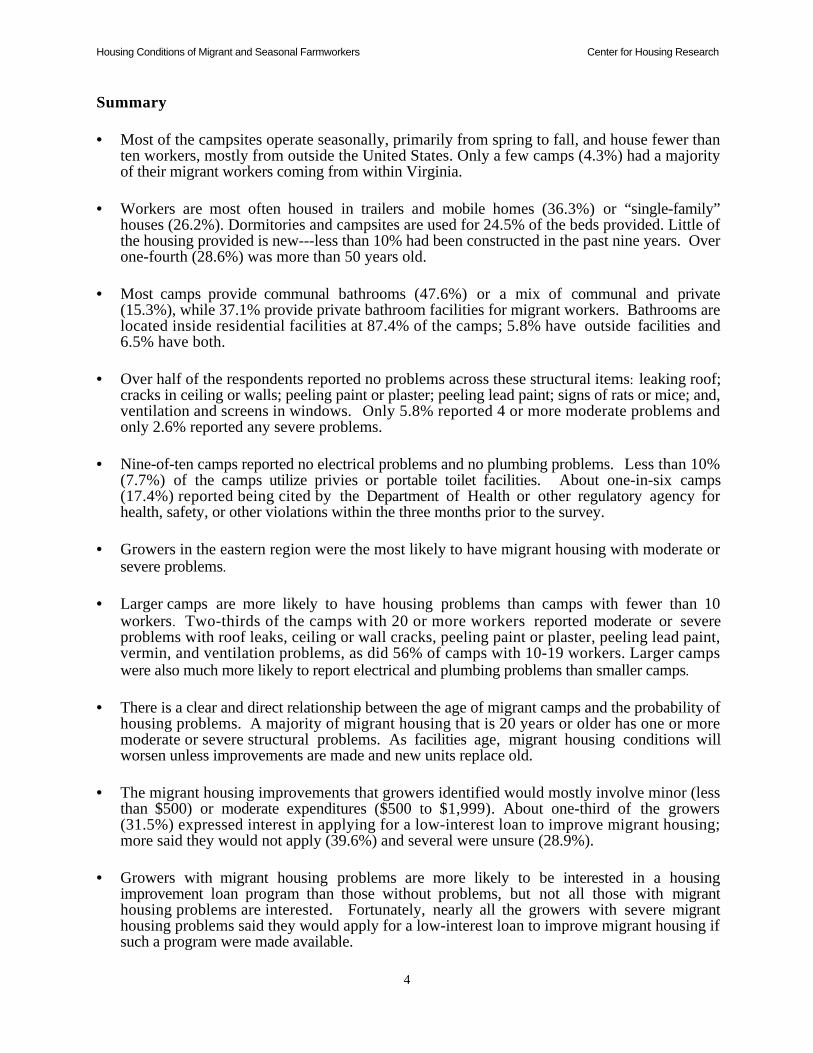
Summary
• Most of the campsites operate seasonally, primarily from spring to fall, and house fewer thanten workers, mostly from outside the United States. Only a few camps (4.3%) had a majorityof their migrant workers coming from within Virginia.
• Workers are most often housed in trailers and mobile homes (36.3%) or “single-family”houses (26.2%). Dormitories and campsites are used for 24.5% of the beds provided. Little ofthe housing provided is new---less than 10% had been constructed in the past nine years. Overone-fourth (28.6%) was more than 50 years old.
• Most camps provide communal bathrooms (47.6%) or a mix of communal and private(15.3%), while 37.1% provide private bathroom facilities for migrant workers. Bathrooms arelocated inside residential facilities at 87.4% of the camps; 5.8% have outside facilities and6.5% have both.
• Over half of the respondents reported no problems across these structural items: leaking roof;cracks in ceiling or walls; peeling paint or plaster; peeling lead paint; signs of rats or mice; and,ventilation and screens in windows. Only 5.8% reported 4 or more moderate problems andonly 2.6% reported any severe problems.
• Nine-of-ten camps reported no electrical problems and no plumbing problems. Less than 10%(7.7%) of the camps utilize privies or portable toilet facilities. About one-in-six camps(17.4%) reported being cited by the Department of Health or other regulatory agency forhealth, safety, or other violations within the three months prior to the survey.
• Growers in the eastern region were the most likely to have migrant housing with moderate orsevere problems.
• Larger camps are more likely to have housing problems than camps with fewer than 10workers. Two-thirds of the camps with 20 or more workers reported moderate or severeproblems with roof leaks, ceiling or wall cracks, peeling paint or plaster, peeling lead paint,vermin, and ventilation problems, as did 56% of camps with 10-19 workers. Larger campswere also much more likely to report electrical and plumbing problems than smaller camps.
• There is a clear and direct relationship between the age of migrant camps and the probability ofhousing problems. A majority of migrant housing that is 20 years or older has one or moremoderate or severe structural problems. As facilities age, migrant housing conditions willworsen unless improvements are made and new units replace old.
• The migrant housing improvements that growers identified would mostly involve minor (lessthan $500) or moderate expenditures ($500 to $1,999). About one-third of the growers(31.5%) expressed interest in applying for a low-interest loan to improve migrant housing;more said they would not apply (39.6%) and several were unsure (28.9%).
• Growers with migrant housing problems are more likely to be interested in a housingimprovement loan program than those without problems, but not all those with migranthousing problems are interested. Fortunately, nearly all the growers with severe migranthousing problems said they would apply for a low-interest loan to improve migrant housing ifsuch a program were made available.
Housing Conditions of Migrant and Seasonal Farmworkers Center for Housing Research
5
Detailed Results
Characteristics of Campsites
As anticipated, most of the campsites operate seasonally, primarily from spring to fall
(78.1%). Another 13.2% operate summer to fall. Only 3.5% operate year round. The campsites
are also small, with a large majority housing less than 10 workers (71.5%). Only a few camps
house more than 20 workers (12.3%). Corresponding to the relatively small number of workers
housed, nearly 90 percent of the camps provide less than 3000 square feet of residential building
space and about two-thirds provide less than 1500 square feet of living space.
Most of the workers are from outside the United States. Over half the camps (57.0%)
reported that all their workers were from outside the U.S. and two-thirds of the camps had 90% or
more of the workers coming from outside the U.S. About one-in-five camps employ workers
coming mostly from within the U.S., mainly from Florida. Only a few camps (13 or 4.3%) had a
majority of their migrant workers coming from within Virginia.
Workers are typically housed in trailers and mobile homes (36.3%) or “single-family”
homes (26.2%)---each unit is used, of course, to house several workers. Dormitories and
campsites are used for 24.5% of the beds provided. Apartments are rarely used (only 2.7% of all
beds provided), as are a variety of miscellaneous housing options (10.3% of all beds provided).
Little of the housing provided is new---less than 10% had been constructed in the past nine years,
but more was within 10 and 19 years old (21.2%). More than seven-in-ten units were 20 or more
years old, with over one-fourth (28.6%) more than 50 years old. Although these are not
exceptional ages for normal housing, they are for mobile homes and trailers. Many of the mobile
homes in use were probably constructed prior to the current HUD code regulating the
manufactured housing industry.
For most respondents, the availability of migrant housing is not a problem. Slightly over
three-fourths reported that the capacity of the available housing facilities is never exceeded.
Nonetheless, about 10 percent of the respondents reported a lack of migrant housing capacity at
Housing Conditions of Migrant and Seasonal Farmworkers Center for Housing Research
6
least once every five years, including 3.9% (12 respondents) who reported housing shortages once
a year or more often.
Except for one-in-ten campsites, the housing provided is only for workers, rather than for
families. However, of the few campsites housing families, only half provided sleeping areas for
children over 6 years of age which were partitioned off from their parents, which is required by
federal regulation. Although relatively infrequent, the housing needs of migrant families with
children would appear to be particularly acute.
Virtually all the units (99.7%) have a stove, refrigerator, kitchen sink, and bathtub or
shower accessible to all the workers. Flush toilets and laundry equipment were less likely to be
accessible to all workers, at 93.1% and 91.9% respectively. Most camps provide communal
bathrooms (47.6%) or a mix of communal and private (15.3%) bathrooms, while 37.1% provide
private bathroom facilities for migrant workers. Bathrooms are located inside residential facilities
at 87.4% of the camps; 5.8% have outside facilities and 6.5% have both. Three-fourths of the
camps provide workers access to a private phone, another 16.6% to a public phone, and 9.4%
have no phone available to workers.
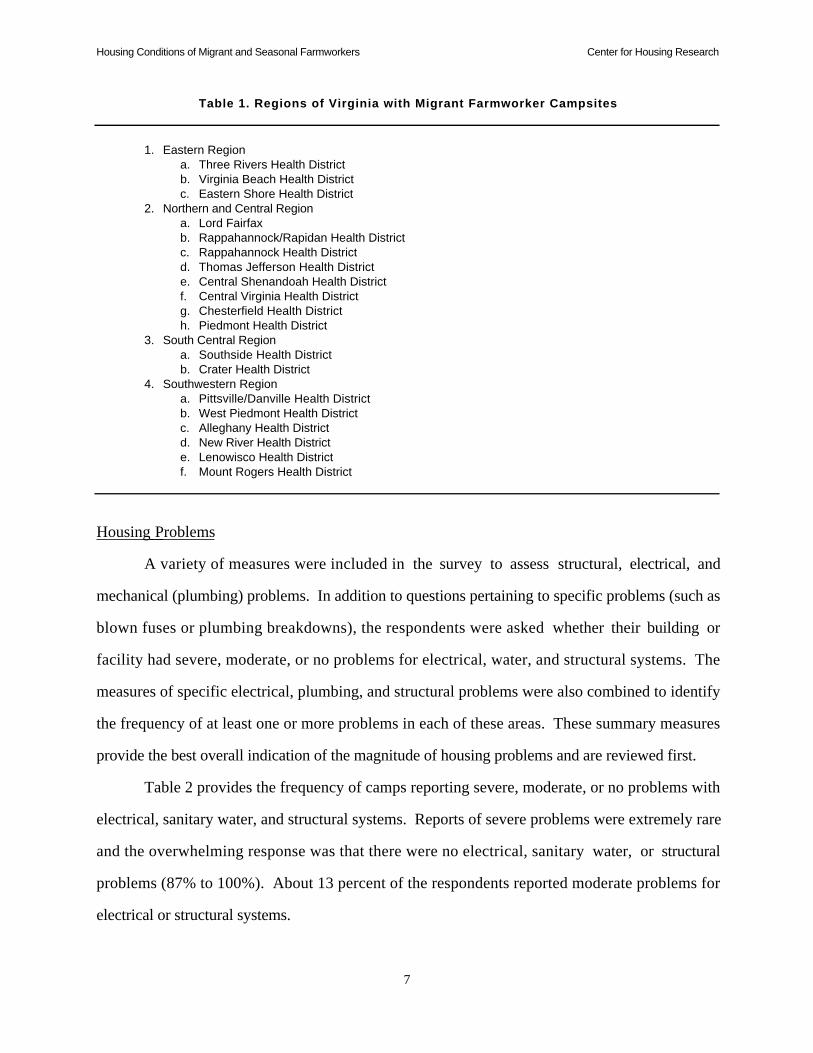
Classifying the state into the four regions described in Table 1, the largest number of
respondents (110 or 35.4%) was from the southwestern region, followed by south-central (98 or
31.5%), north-central (71 or 22.8%), and eastern (32 or 10.3%). Weighted by number of
workers, regional dominance shifts to the north-central, which has 40.2% of the migrant workers,
with the other three regions much closer to each other.
Housing Conditions of Migrant and Seasonal Farmworkers Center for Housing Research
7
Table 1. Regions of Virginia with Migrant Farmworker Campsites
1. Eastern Regiona. Three Rivers Health Districtb. Virginia Beach Health Districtc. Eastern Shore Health District
2. Northern and Central Regiona. Lord Fairfaxb. Rappahannock/Rapidan Health Districtc. Rappahannock Health Districtd. Thomas Jefferson Health Districte. Central Shenandoah Health Districtf. Central Virginia Health Districtg. Chesterfield Health Districth. Piedmont Health District
3. South Central Regiona. Southside Health Districtb. Crater Health District
4. Southwestern Regiona. Pittsville/Danville Health Districtb. West Piedmont Health Districtc. Alleghany Health Districtd. New River Health Districte. Lenowisco Health Districtf. Mount Rogers Health District
Housing Problems
A variety of measures were included in the survey to assess structural, electrical, and
mechanical (plumbing) problems. In addition to questions pertaining to specific problems (such as
blown fuses or plumbing breakdowns), the respondents were asked whether their building or
facility had severe, moderate, or no problems for electrical, water, and structural systems. The
measures of specific electrical, plumbing, and structural problems were also combined to identify
the frequency of at least one or more problems in each of these areas. These summary measures
provide the best overall indication of the magnitude of housing problems and are reviewed first.
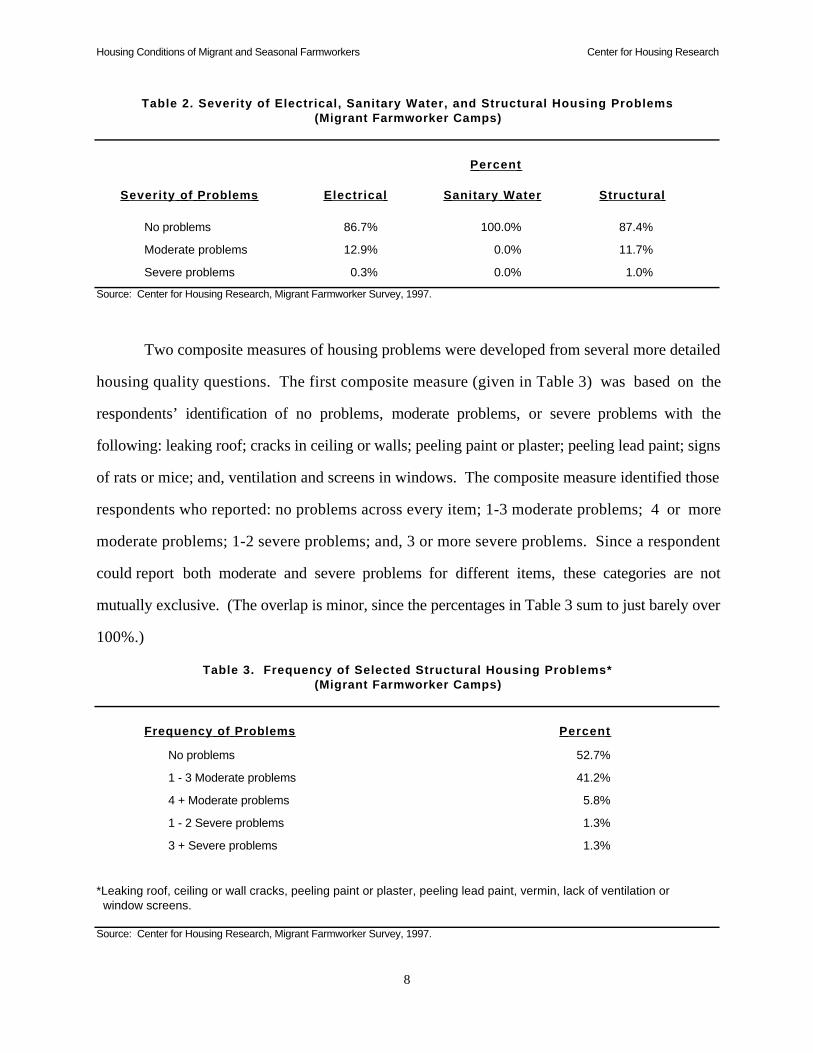
Table 2 provides the frequency of camps reporting severe, moderate, or no problems with
electrical, sanitary water, and structural systems. Reports of severe problems were extremely rare
and the overwhelming response was that there were no electrical, sanitary water, or structural
problems (87% to 100%). About 13 percent of the respondents reported moderate problems for
electrical or structural systems.
Housing Conditions of Migrant and Seasonal Farmworkers Center for Housing Research
8
Table 2. Severity of Electrical, Sanitary Water, and Structural Housing Problems(Migrant Farmworker Camps)
Percent
Severity of Problems Electrical Sanitary Water Structural
No problems 86.7% 100.0% 87.4%
Moderate problems 12.9% 0.0% 11.7%
Severe problems 0.3% 0.0% 1.0%
Source: Center for Housing Research, Migrant Farmworker Survey, 1997.
Two composite measures of housing problems were developed from several more detailed
housing quality questions. The first composite measure (given in Table 3) was based on the
respondents’ identification of no problems, moderate problems, or severe problems with the
following: leaking roof; cracks in ceiling or walls; peeling paint or plaster; peeling lead paint; signs
of rats or mice; and, ventilation and screens in windows. The composite measure identified those
respondents who reported: no problems across every item; 1-3 moderate problems; 4 or more
moderate problems; 1-2 severe problems; and, 3 or more severe problems. Since a respondent
could report both moderate and severe problems for different items, these categories are not
mutually exclusive. (The overlap is minor, since the percentages in Table 3 sum to just barely over
100%.)
Table 3. Frequency of Selected Structural Housing Problems*(Migrant Farmworker Camps)
Frequency of Problems Percent
No problems 52.7%
1 - 3 Moderate problems 41.2%
4 + Moderate problems 5.8%
1 - 2 Severe problems 1.3%
3 + Severe problems 1.3%
*Leaking roof, ceiling or wall cracks, peeling paint or plaster, peeling lead paint, vermin, lack of ventilation or window screens.
Source: Center for Housing Research, Migrant Farmworker Survey, 1997.

Housing Conditions of Migrant and Seasonal Farmworkers Center for Housing Research
9
Over half of the respondents reported no problems across all items covered in composite
measure one. Nearly all of those identifying problems reported 1-3 moderate problems (41.2% of
all campsites). Only 5.8% reported 4 or more moderate problems and only 2.6% reported any
severe problems.
Similar to the first composite measures, the second composite measure (Table 4) identifies
the prevalence of electrical and plumbing problems. The indicators of electrical problems were the
lack of outlets in every room; lack of concealed wiring; and, two or more blown fuses in an
average month. The indicators of plumbing problems were a complete lack of running water for 6
or more consecutive hours in an average month; one or more flush toilet breakdowns per toilet
during an average month of use; toilet breakdowns going unrepaired for 12 or more hours. The
composite measure provides the proportion of respondents with no electrical problems, no
plumbing problems, or one or more electrical or plumbing problems. Nine-of-ten camps reported
no electrical problems and no plumbing problems based on this composite measure.
Table 4. Frequency of Electrical and Plumbing Problems(Migrant Farmworker Camps)
Percent
Frequency of Problems Electrical* Plumbing**
No problems 90.3% 91.3%
1 or more problems 9.7% 8.7%
* Lack of outlets in every room; exposed wiring; two or more blown fuses per month.**Complete lack of running water for 6+ hours in average month; one or more flush toilet breakdowns per toilet per month; toilets unrepaired for 12+ hours.
Source: Center for Housing Research, Migrant Farmworker Survey, 1997.
The more detailed measures (provided in the Appendix) reveal the following. The most
frequent individual problems are vermin (24.1%), peeling paint or plaster (21.5%), ceiling or wall

Housing Conditions of Migrant and Seasonal Farmworkers Center for Housing Research
10
cracks (21.3%), ventilation and window screens (19.2%). Other problems of note include two or
more blown fuses in an average month (7.9%) and one or more flush toilet breakdowns per toilet
during an average month of use (6.7%). In addition, 7.7% of the camps utilize privies or portable
toilet facilities. About one-in-six camps (17.4%) reported being cited by the Department of Health
or other regulatory agency for health, safety, or other violations within the three months prior to
the survey.
Cost of Needed Improvements and Interest in Loan Program
The migrant housing improvements that growers identify would mostly involve minor
expenditures (less than $500) or moderate expenditures ($500 to $1,999), rather than more costly
improvements. Table 5 provides the growers’ estimates of costs for electrical, plumbing, and
structural improvements. Structural improvements are the most often required (35.5%) and the
most likely to exceed $2,000 (6.9%). Camps requiring moderate electrical, plumbing or structural
repairs represent between 8 to 10% of all camps; between 12 to 18% require minor repairs.
Table 5. Cost of Needed Electrical, Plumbing, and Structural Improvements(Migrant Farmworker Camps)
Percent
Needed Improvements Electrical Plumbing Structural
None needed 72.5% 77.2% 64.5%
Minor (< $500) 16.6% 12.1% 18.4%
Moderate ($500 - $1,999) 8.6% 7.5% 10.2%
Intermediate ($2,000 - $10,000) 1.7% 2.6% 4.9%
Major (> $10,000) 0.7% 0.7% 2.0%
Source: Center for Housing Research, Migrant Farmworker Survey, 1997.
About one-third of the growers (31.5%) expressed interest in applying for a low-interest
loan to improve migrant housing; more said they would not apply (39.6%) and several were
unsure (28.9%).
Housing Conditions of Migrant and Seasonal Farmworkers Center for Housing Research
11
Variations in Housing Pro blems by Region, Camp Size and Age
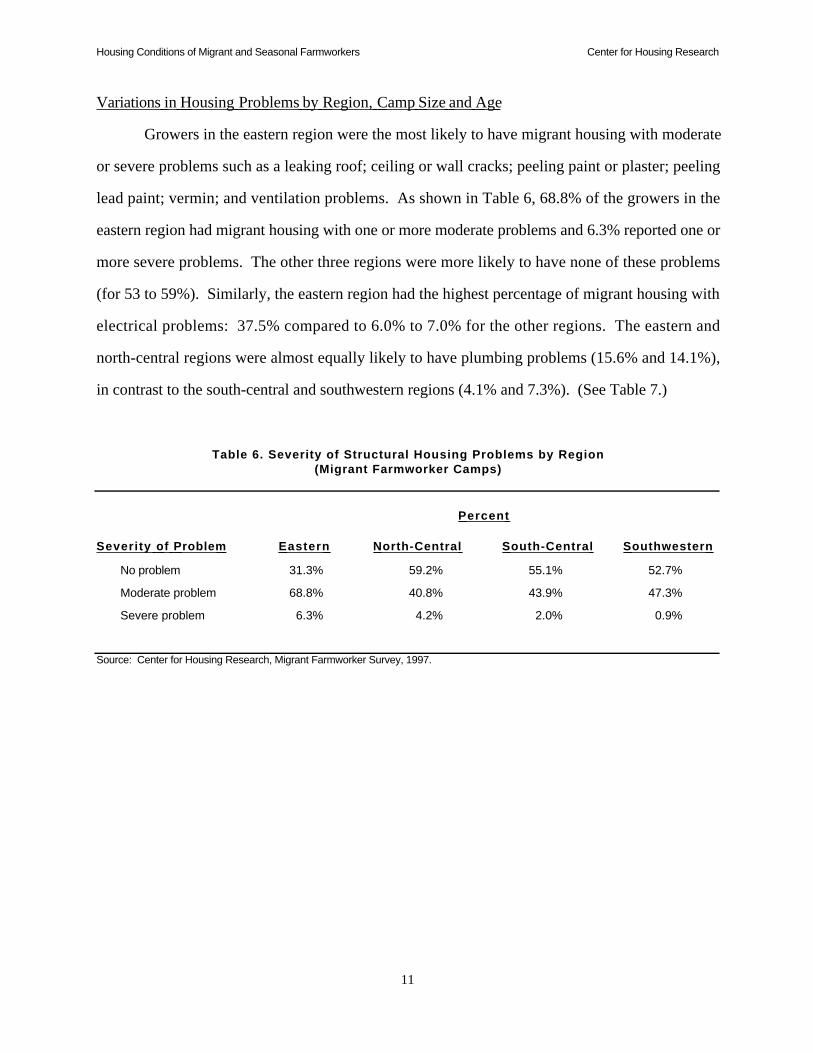
Growers in the eastern region were the most likely to have migrant housing with moderate
or severe problems such as a leaking roof; ceiling or wall cracks; peeling paint or plaster; peeling
lead paint; vermin; and ventilation problems. As shown in Table 6, 68.8% of the growers in the
eastern region had migrant housing with one or more moderate problems and 6.3% reported one or
more severe problems. The other three regions were more likely to have none of these problems
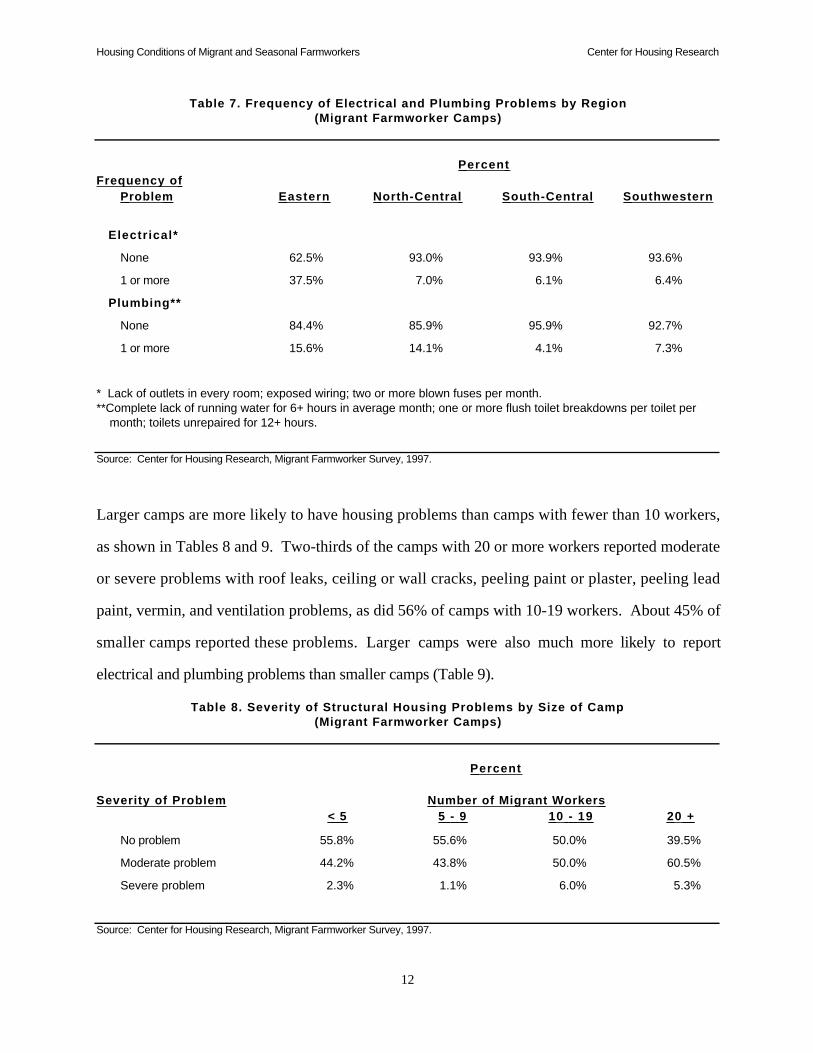
(for 53 to 59%). Similarly, the eastern region had the highest percentage of migrant housing with
electrical problems: 37.5% compared to 6.0% to 7.0% for the other regions. The eastern and
north-central regions were almost equally likely to have plumbing problems (15.6% and 14.1%),
in contrast to the south-central and southwestern regions (4.1% and 7.3%). (See Table 7.)
Table 6. Severity of Structural Housing Problems by Region(Migrant Farmworker Camps)
Percent
Severity of Problem Eastern North-Central South-Central Southwestern
No problem 31.3% 59.2% 55.1% 52.7%
Moderate problem 68.8% 40.8% 43.9% 47.3%
Severe problem 6.3% 4.2% 2.0% 0.9%
Source: Center for Housing Research, Migrant Farmworker Survey, 1997.
Housing Conditions of Migrant and Seasonal Farmworkers Center for Housing Research
12
Table 7. Frequency of Electrical and Plumbing Problems by Region(Migrant Farmworker Camps)
Percent Frequency of
Problem Eastern North-Central South-Central Southwestern
Electrical*
None 62.5% 93.0% 93.9% 93.6%
1 or more 37.5% 7.0% 6.1% 6.4%
Plumbing**
None 84.4% 85.9% 95.9% 92.7%
1 or more 15.6% 14.1% 4.1% 7.3%
* Lack of outlets in every room; exposed wiring; two or more blown fuses per month.**Complete lack of running water for 6+ hours in average month; one or more flush toilet breakdowns per toilet per month; toilets unrepaired for 12+ hours.
Source: Center for Housing Research, Migrant Farmworker Survey, 1997.
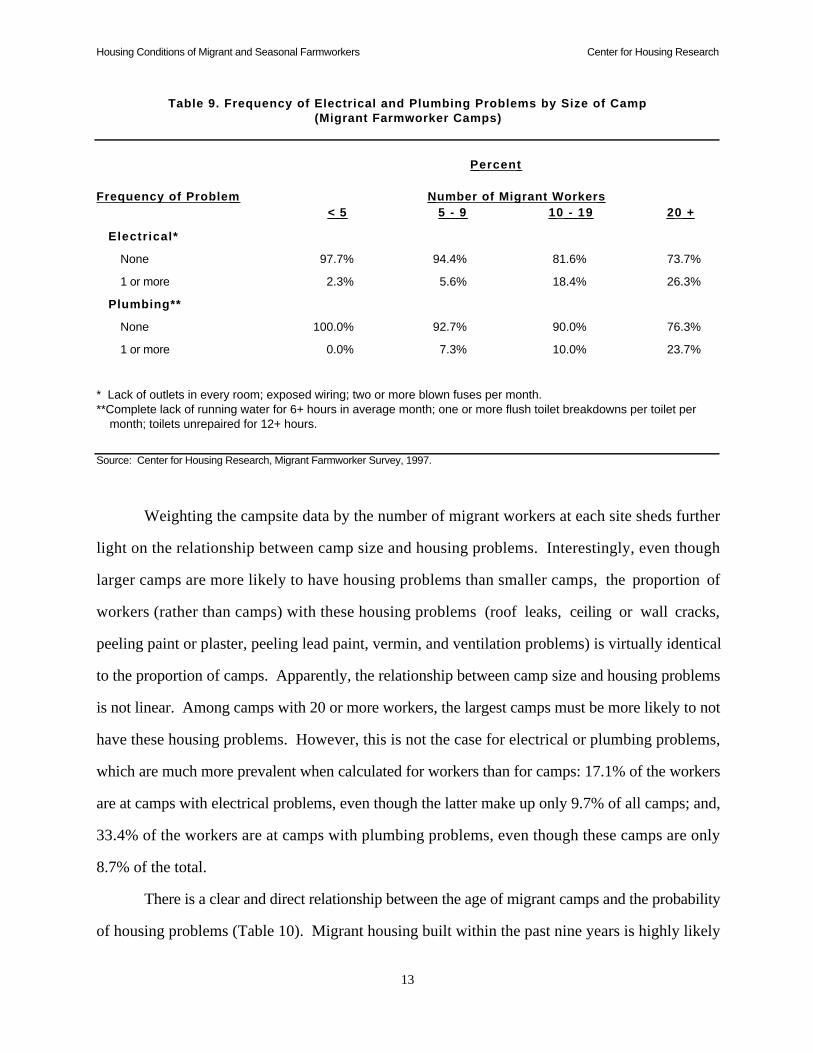
Larger camps are more likely to have housing problems than camps with fewer than 10 workers,
as shown in Tables 8 and 9. Two-thirds of the camps with 20 or more workers reported moderate
or severe problems with roof leaks, ceiling or wall cracks, peeling paint or plaster, peeling lead
paint, vermin, and ventilation problems, as did 56% of camps with 10-19 workers. About 45% of
smaller camps reported these problems. Larger camps were also much more likely to report
electrical and plumbing problems than smaller camps (Table 9).
Table 8. Severity of Structural Housing Problems by Size of Camp(Migrant Farmworker Camps)
Percent
Severity of Problem Number of Migrant Workers < 5 5 - 9 10 - 19 20 +
No problem 55.8% 55.6% 50.0% 39.5%
Moderate problem 44.2% 43.8% 50.0% 60.5%
Severe problem 2.3% 1.1% 6.0% 5.3%
Source: Center for Housing Research, Migrant Farmworker Survey, 1997.
Housing Conditions of Migrant and Seasonal Farmworkers Center for Housing Research
13
Table 9. Frequency of Electrical and Plumbing Problems by Size of Camp(Migrant Farmworker Camps)
Percent
Frequency of Problem Number of Migrant Workers < 5 5 - 9 10 - 19 20 +
Electrical*
None 97.7% 94.4% 81.6% 73.7%
1 or more 2.3% 5.6% 18.4% 26.3%
Plumbing**
None 100.0% 92.7% 90.0% 76.3%
1 or more 0.0% 7.3% 10.0% 23.7%
* Lack of outlets in every room; exposed wiring; two or more blown fuses per month.**Complete lack of running water for 6+ hours in average month; one or more flush toilet breakdowns per toilet per month; toilets unrepaired for 12+ hours.
Source: Center for Housing Research, Migrant Farmworker Survey, 1997.
Weighting the campsite data by the number of migrant workers at each site sheds further
light on the relationship between camp size and housing problems. Interestingly, even though
larger camps are more likely to have housing problems than smaller camps, the proportion of
workers (rather than camps) with these housing problems (roof leaks, ceiling or wall cracks,
peeling paint or plaster, peeling lead paint, vermin, and ventilation problems) is virtually identical
to the proportion of camps. Apparently, the relationship between camp size and housing problems
is not linear. Among camps with 20 or more workers, the largest camps must be more likely to not
have these housing problems. However, this is not the case for electrical or plumbing problems,
which are much more prevalent when calculated for workers than for camps: 17.1% of the workers
are at camps with electrical problems, even though the latter make up only 9.7% of all camps; and,
33.4% of the workers are at camps with plumbing problems, even though these camps are only
8.7% of the total.
There is a clear and direct relationship between the age of migrant camps and the probability
of housing problems (Table 10). Migrant housing built within the past nine years is highly likely

Housing Conditions of Migrant and Seasonal Farmworkers Center for Housing Research
14
(90.5%) to not have problems with roof leaks, ceiling or wall cracks, peeling paint or plaster,
peeling lead paint, vermin, and ventilation problems. The probability of no housing problems
shifts dramatically downward with slightly older housing--10 to 19 years old--(57.8%) and
progresses downward to 43.0% for migrant housing that is 50 years or older. A majority of
migrant housing that is 20 years or older has one or more moderate or severe housing problems.
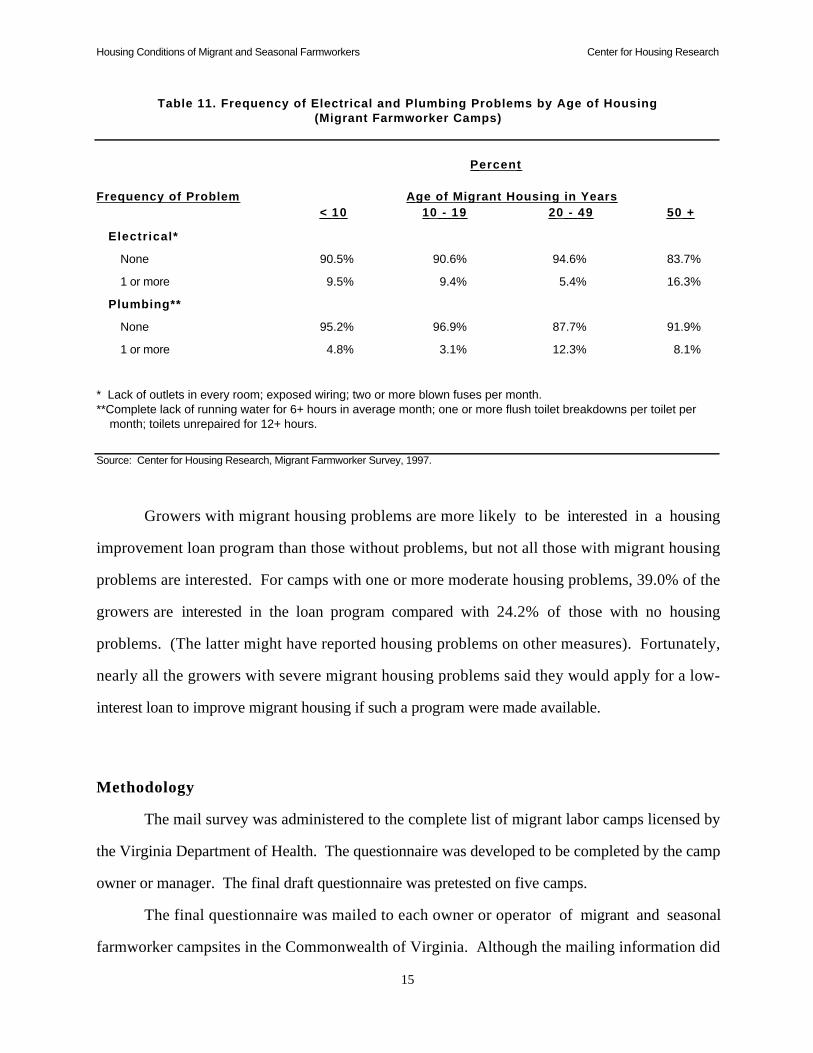
The relationship between facility age and housing problems, however, does not hold for electrical
and plumbing problems (Table 11).
Table 10. Severity of Structural Housing Problems by Age of Housing(Migrant Farmworker Camps)
Percent
Severity of Problem Age of Migrant Housing in Years < 10 10 - 19 20 - 49 50 +
No problem 90.5% 57.8% 49.2% 43.0%
Moderate problem 9.5% 42.2% 50.8% 55.8%
Severe problem 0.0% 1.6% 2.3% 4.6%
Source: Center for Housing Research, Migrant Farmworker Survey, 1997.
Housing Conditions of Migrant and Seasonal Farmworkers Center for Housing Research
15
Table 11. Frequency of Electrical and Plumbing Problems by Age of Housing(Migrant Farmworker Camps)
Percent
Frequency of Problem Age of Migrant Housing in Years < 10 10 - 19 20 - 49 50 +
Electrical*
None 90.5% 90.6% 94.6% 83.7%
1 or more 9.5% 9.4% 5.4% 16.3%
Plumbing**
None 95.2% 96.9% 87.7% 91.9%
1 or more 4.8% 3.1% 12.3% 8.1%
* Lack of outlets in every room; exposed wiring; two or more blown fuses per month.**Complete lack of running water for 6+ hours in average month; one or more flush toilet breakdowns per toilet per month; toilets unrepaired for 12+ hours.
Source: Center for Housing Research, Migrant Farmworker Survey, 1997.
Growers with migrant housing problems are more likely to be interested in a housing
improvement loan program than those without problems, but not all those with migrant housing
problems are interested. For camps with one or more moderate housing problems, 39.0% of the
growers are interested in the loan program compared with 24.2% of those with no housing
problems. (The latter might have reported housing problems on other measures). Fortunately,
nearly all the growers with severe migrant housing problems said they would apply for a low-
interest loan to improve migrant housing if such a program were made available.
Methodology
The mail survey was administered to the complete list of migrant labor camps licensed by
the Virginia Department of Health. The questionnaire was developed to be completed by the camp
owner or manager. The final draft questionnaire was pretested on five camps.
The final questionnaire was mailed to each owner or operator of migrant and seasonal
farmworker campsites in the Commonwealth of Virginia. Although the mailing information did
Housing Conditions of Migrant and Seasonal Farmworkers Center for Housing Research
16
not permit a personalized letter to the owner, the cover letter was designed to explain the purpose
of the survey, the importance of every grower’s participation, and the confidentiality of their
response. A letter was also included from the chairman of the Virginia Migrant and Seasonal
Farmworkers Board encouraging growers to participate. All mailings were done with first class
postage and a stamped, addressed return envelope was provided.
The initial mailing was followed by a postcard reminder sent to nonrespondents after three
weeks. A letter from the Center Director was mailed to any remaining nonrespondents after the
sixth week.
Completed questionnaires were received by the Center for Housing Research and logged
into a database. Frequencies and cross-tabulations were prepared utilizing SAS, a statistical
analysis software package.
The initial mailing list included 597 campsites. Thirty-three of the questionnaires were
returned to the Center as undeliverable or because migrant and seasonal farmworkers were no
longer employed at these farms. Out of the remaining 564 migrant campsites, completed
questionnaires were received from 342 owners and operators for a response rate of 60.6%.
Some of the owners or operators of campsites owned or operated more than one campsite.
In one case, the owner completed a single questionnaire for all campsites. Although such
responses were treated as a single camp in the results presented here, the total number of campsites
run by this owner were counted in the response rate.
In order to evaluate the reliability of the survey results, site visits were conducted at 48
campsites in three different areas of the state: the Eastern Shore (17), Southside (19) and
Winchester (12). A representative of the Center for Housing Research observed and recorded the
housing conditions at the camps visited. In accordance with University and Center protocols,
survey responses and site information are completely confidential and only aggregate results are
provided herein.
During the site visits, the type and structural quality of housing was recorded from personal
observation. In addition, the size of the camp was obtained from local officials or the owner. The
Housing Conditions of Migrant and Seasonal Farmworkers Center for Housing Research
17
site visit data and survey responses were very comparable and did not suggest any bias problems
with survey responses. Likewise, comparisons of site visit data for respondents and
nonrespondents revealed very similar distributions for housing quality measures. Although
nonrespondents were somewhat more likely to have severe housing problems than respondents,
the difference was well within an acceptable range given the small number of cases.

Housing Conditions of Migrant and Seasonal Farmworkers Center for Housing Research
18
APPENDIX: SURVEY QUESTIONNAIRE AND RESPONSES
YOUR OPINIONS ARE EXTREMELY IMPORTANT TO US. Answering thesequestions should only take 15 to 20 minutes of your time. This survey must be filled out by theowner or operator of the migrant farmworker campsite. Your answers will be totally confidentialand will not be associated with you personally. Your participation in this project will be held instrict confidence by the staff of the Center for Housing Research. THANK YOU FOR YOURHELP.
1. Who owns the housing provided at this camp?
_______________________________________________________________
2. What is the time period of use for the camp each year? (List first and last month of use)
_______________--_______________
Grouped results:
Year Round (3.5%)Spring to Fall (78.1%)Spring to Summer (1.6%)Summer to Fall (13.2%)Winter to Summer (.6%)Winter to Spring (2.2%)Fall to Winter (.6%)
Codebook:Spring-- March, April, MaySummer--June, July, AugustFall--September, October, NovemberWinter--December, January, February
3. What is the approximate age in years of the housing/buildings for migrant farmworkers? (Ifmore than one building, specify range from most recent to oldest) ______________ years old
Grouped results:
Less than 10 years old (7.0%)Between 10 and 19 years old (21.2%)Between 20 and 49 years old (43.2%)More than 50 years old (28.6%)
4. Do you have a problem finding adequate housing for your workers? 1) Yes (11.9%) 2) No (88.1%)
5. How often does the number of farmworkers exceed the capacity of the housing facilitiesprovided? (Check the most appropriate response)1) Very Often (1 time or more a year) (3.9%)2) Sometimes (1 time every five years) (8.5%)3) Hardly ever (over five years between occurrences) (10.1%)4) Never (77.2%)
Housing Conditions of Migrant and Seasonal Farmworkers Center for Housing Research
19
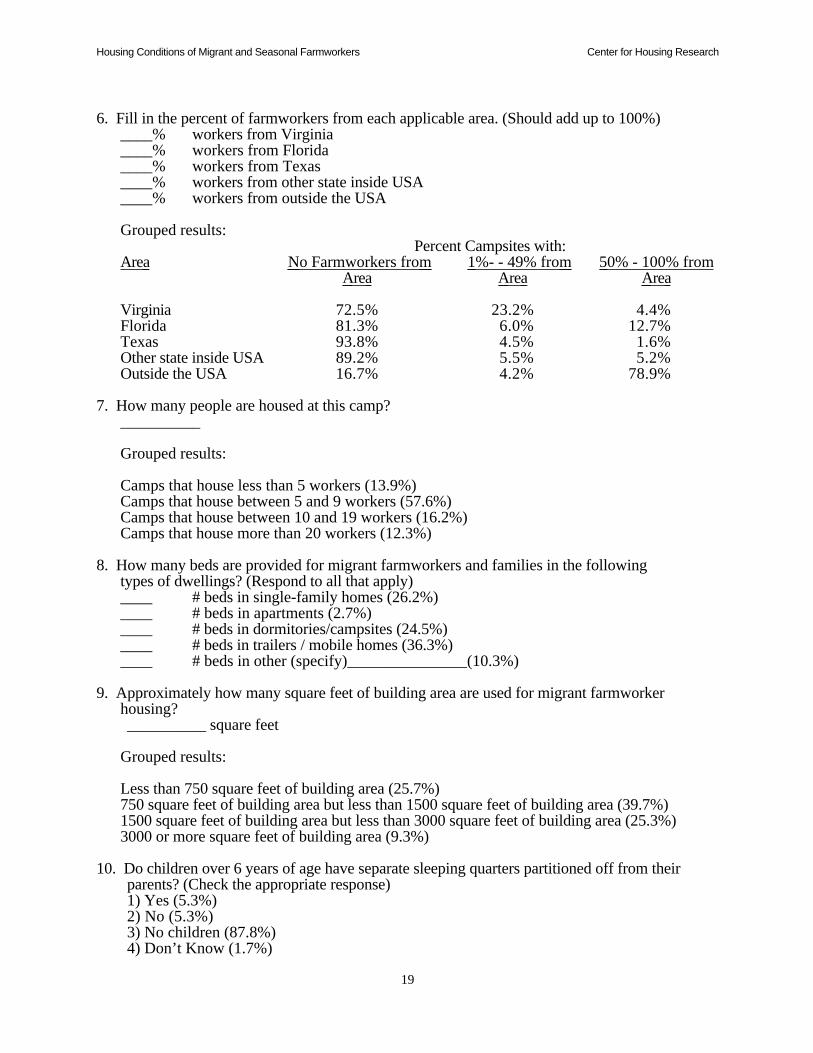
6. Fill in the percent of farmworkers from each applicable area. (Should add up to 100%)____% workers from Virginia____% workers from Florida____% workers from Texas____% workers from other state inside USA____% workers from outside the USA
Grouped results:Percent Campsites with:
Area No Farmworkers from 1%- - 49% from 50% - 100% from Area Area Area
Virginia 72.5% 23.2% 4.4%Florida 81.3% 6.0% 12.7%Texas 93.8% 4.5% 1.6%Other state inside USA 89.2% 5.5% 5.2%Outside the USA 16.7% 4.2% 78.9%
7. How many people are housed at this camp? __________
Grouped results:
Camps that house less than 5 workers (13.9%)Camps that house between 5 and 9 workers (57.6%)Camps that house between 10 and 19 workers (16.2%)Camps that house more than 20 workers (12.3%)
8. How many beds are provided for migrant farmworkers and families in the followingtypes of dwellings? (Respond to all that apply)
____ # beds in single-family homes (26.2%) ____ # beds in apartments (2.7%) ____ # beds in dormitories/campsites (24.5%) ____ # beds in trailers / mobile homes (36.3%) ____ # beds in other (specify)_______________(10.3%)
9. Approximately how many square feet of building area are used for migrant farmworkerhousing?
__________ square feet
Grouped results:
Less than 750 square feet of building area (25.7%)750 square feet of building area but less than 1500 square feet of building area (39.7%)1500 square feet of building area but less than 3000 square feet of building area (25.3%)3000 or more square feet of building area (9.3%)
10. Do children over 6 years of age have separate sleeping quarters partitioned off from theirparents? (Check the appropriate response)
1) Yes (5.3%) 2) No (5.3%) 3) No children (87.8%) 4) Don’t Know (1.7%)
Housing Conditions of Migrant and Seasonal Farmworkers Center for Housing Research
20
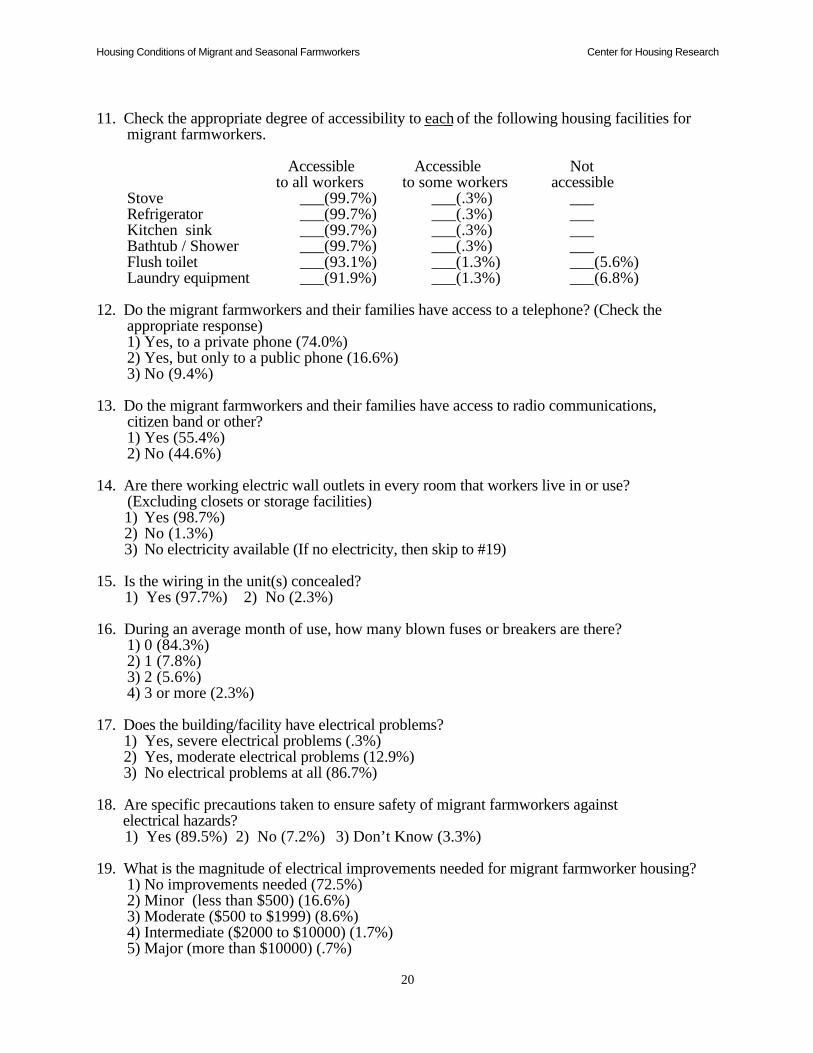
11. Check the appropriate degree of accessibility to each of the following housing facilities formigrant farmworkers.
Accessible Accessible Notto all workers to some workers accessible
Stove ___(99.7%) ___(.3%) ___Refrigerator ___(99.7%) ___(.3%) ___Kitchen sink ___(99.7%) ___(.3%) ___Bathtub / Shower ___(99.7%) ___(.3%) ___Flush toilet ___(93.1%) ___(1.3%) ___(5.6%)Laundry equipment ___(91.9%) ___(1.3%) ___(6.8%)
12. Do the migrant farmworkers and their families have access to a telephone? (Check theappropriate response)
1) Yes, to a private phone (74.0%) 2) Yes, but only to a public phone (16.6%) 3) No (9.4%)
13. Do the migrant farmworkers and their families have access to radio communications, citizen band or other?
1) Yes (55.4%)2) No (44.6%)
14. Are there working electric wall outlets in every room that workers live in or use? (Excluding closets or storage facilities) 1) Yes (98.7%) 2) No (1.3%) 3) No electricity available (If no electricity, then skip to #19)
15. Is the wiring in the unit(s) concealed? 1) Yes (97.7%) 2) No (2.3%)
16. During an average month of use, how many blown fuses or breakers are there?1) 0 (84.3%)
2) 1 (7.8%)3) 2 (5.6%)4) 3 or more (2.3%)
17. Does the building/facility have electrical problems? 1) Yes, severe electrical problems (.3%) 2) Yes, moderate electrical problems (12.9%) 3) No electrical problems at all (86.7%)
18. Are specific precautions taken to ensure safety of migrant farmworkers against electrical hazards? 1) Yes (89.5%) 2) No (7.2%) 3) Don’t Know (3.3%)
19. What is the magnitude of electrical improvements needed for migrant farmworker housing? 1) No improvements needed (72.5%)
2) Minor (less than $500) (16.6%)3) Moderate ($500 to $1999) (8.6%)4) Intermediate ($2000 to $10000) (1.7%)5) Major (more than $10000) (.7%)

Housing Conditions of Migrant and Seasonal Farmworkers Center for Housing Research
21
20. During an average month of use, is there a complete lack of running water for 6 or moreconsecutive hours?
1) Yes (96.8%) 2) No (3.2%) 3) Running water not provided (If no running water, skip to #25)
21. Are the bathrooms:1) Private for each family unit (37.1%)2) Communal (47.6%)3) Mix of Both (15.3%)
22. Are bathrooms located: 1) Inside (87.4%)
2) Outside (5.8%) 3) Both (6.5%) 4) Other (Explain)____________________________ (.3%)
23. During an average month of use, is there one or more flush toilet breakdown per toilet?
1) Yes (93.3%) 2) No (6.7%)
24. Once a flush toilet breakdown has been reported, how long does it usually take before it is repaired? 1) Within 6 hours (65.5%)
2) 6 to 12 hours (26.8%)3) 13 to 24 hours (6.4%)4) More than 24 hours (1.4%)
25. What is the means of sewage disposal? (Check all that apply)1) Public Sewer (.6%)2) Septic Tank / Cesspool (88.7%)3) Privy or Outhouse / Port-o-John (7.7%)4) Other
26. If you receive services from a public sewer, during an average month of use, is there a public sewer breakdown? 1) Yes (.6%) 2) No (If no public sewer, skip to # 28) (99.4%)
27. During an average month of use, is there a public sewer breakdown of 6 or more consecutive hours? 1) Yes (100%) 2) No
28. If you receive services from a septic tank system or other method, is there a breakdown during an average month of use? 1) Yes (2.1%) 2) No (89.5) 3) Not Applicable (8.4%)
29. Are there health hazards due to unsanitary water associated with the living quarters?1) Yes, severe health problems due to unsanitary water2) Yes, moderate health problems due to unsanitary water3) Yes, occasional problems due to unsanitary water but rare (4.2%)4) No health problems due to unsanitary water (95.8%)
Housing Conditions of Migrant and Seasonal Farmworkers Center for Housing Research
22
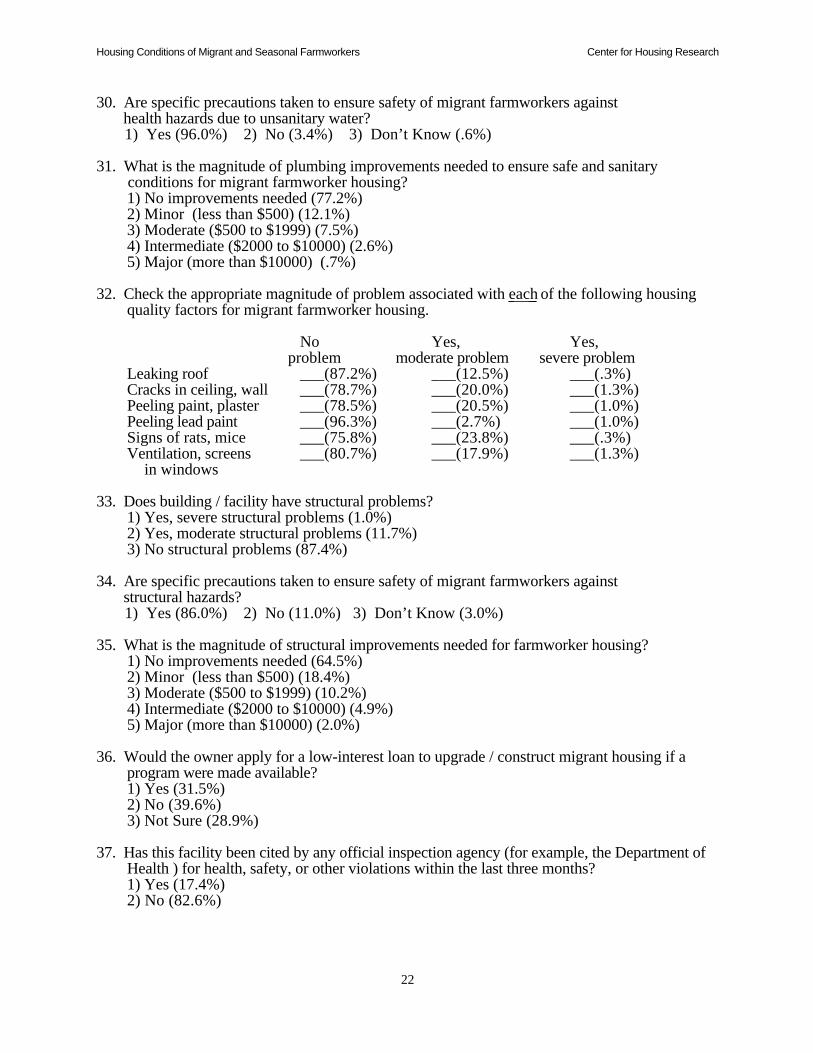
30. Are specific precautions taken to ensure safety of migrant farmworkers against health hazards due to unsanitary water? 1) Yes (96.0%) 2) No (3.4%) 3) Don’t Know (.6%)
31. What is the magnitude of plumbing improvements needed to ensure safe and sanitary conditions for migrant farmworker housing?
1) No improvements needed (77.2%)2) Minor (less than $500) (12.1%)3) Moderate ($500 to $1999) (7.5%)4) Intermediate ($2000 to $10000) (2.6%)5) Major (more than $10000) (.7%)
32. Check the appropriate magnitude of problem associated with each of the following housingquality factors for migrant farmworker housing.
No Yes, Yes,problem moderate problem severe problem
Leaking roof ___(87.2%) ___(12.5%) ___(.3%)Cracks in ceiling, wall ___(78.7%) ___(20.0%) ___(1.3%)Peeling paint, plaster ___(78.5%) ___(20.5%) ___(1.0%)Peeling lead paint ___(96.3%) ___(2.7%) ___(1.0%)Signs of rats, mice ___(75.8%) ___(23.8%) ___(.3%)Ventilation, screens ___(80.7%) ___(17.9%) ___(1.3%)
in windows
33. Does building / facility have structural problems?1) Yes, severe structural problems (1.0%)2) Yes, moderate structural problems (11.7%)3) No structural problems (87.4%)
34. Are specific precautions taken to ensure safety of migrant farmworkers against structural hazards? 1) Yes (86.0%) 2) No (11.0%) 3) Don’t Know (3.0%)
35. What is the magnitude of structural improvements needed for farmworker housing?1) No improvements needed (64.5%)2) Minor (less than $500) (18.4%)3) Moderate ($500 to $1999) (10.2%)4) Intermediate ($2000 to $10000) (4.9%)5) Major (more than $10000) (2.0%)
36. Would the owner apply for a low-interest loan to upgrade / construct migrant housing if aprogram were made available?1) Yes (31.5%)2) No (39.6%)3) Not Sure (28.9%)
37. Has this facility been cited by any official inspection agency (for example, the Department ofHealth ) for health, safety, or other violations within the last three months?1) Yes (17.4%)2) No (82.6%)