Embed Size (px)
Citation preview

1
HOUSING AND LABOR MARKET CONNECTIONS IN PORTUGAL - Challenges for the XXI Century -
PEDRO GUEDES DE CARVALHO Universidade da Beira Interior � Covilhã September 2002
From past research to the new questions
In a former research group1 where I worked (1996 to 1999), the core of the
study was to compare the four southern European housing systems - Portugal, Spain,
Italy and Greece � under the assumption that they had a different path other than
northern European countries. We had the personal intuition that something could be
different �at home�. People, history, household structure, life pattern, consumer
preferences and even the weather, social communication style and custom traditions
would play an important role on housing provision. We tried to understand at what
extent could those several differences play a distinctive influence on housing
practices, considering the development lag between northern and southern Europe
post-II World War.
In the first half of that group research period, we characterised each country
situation using an in-depth approach on each housing system and we set up an
analytical framework considering housing provision, financing, tenure, prices,
diversity, urban change processes, social housing and so forth. We wanted to know
more about ourselves2.
In the second half period, the group co-ordinators3 introduced a new viewpoint
on the theme, opening the group to other colleagues and shifting the research core to
the transition in European welfare system. Housing provision �became� part of the
broader welfare delivery policy.
In December 1998 we underlined the importance of this shift. Housing system
is not seen 'anymore' as a question of database comparison but an important territorial
and social issue. We needed to stress and understand at what extent the founded
1 �Housing in Southern European Countries: a different path?� - a ENHR working group - European Network for Housing Research. 2 Full text in Carvalho, P. G. (1998). Public intervention on housing: the Portuguese Case, ENHR Working Group Conference: "Housing in southern Europe: a different path?". . 3 Liliana Padovani (ITA) and Jesus Maldonado Leal (SP).

2
differences could lead us to different (best or worst) global country reactions facing
the EU welfare challenges. Some of the invited experts (Hugo Priemus � NL and
Bengt Turner, SE) devaluated those differences between N-S housing systems,
claiming that the focus should be centred on the historical development lag that EU
economic convergence will solve sooner or later (close to the neoclassical approach).
The research evolved then within a different framework analysis. As Judith
Allen - UK wrote in her presented draft (February 1999) �...the biggest conceptual
problem is to move from a fairly descriptive concept about the interrelationship
between family and housing to a more analytical concept of society and welfare�.
The research questions for that group became then:
- "Taking into account the differences in each country ability for social
regeneration, could southern European countries have a comparative advantage in
housing and social welfare delivery?"
- "Which outcome could be predicted in order to achieve a better
adaptation/reaction facing the general shift in the EU welfare policies?"
Conclusions pointed out to a positive answer to both questions, meaning that
housing delivery in these countries has much more to do with higher family network
support than in other countries. In a certain sense, these family and friendship
networking replaced for a long time, the absence of a strong public intervention after
the II World War, which not happened in the northern European countries.
In this actual research group - �HOSE project� - started at York (October
2000), we were asked slightly different questions, expressing ideas about the possible
relation between housing markets, labour markets and social welfare provision.
The following text will try to express my knowledge about these issues,
considering the background accumulated over the two research periods and following
the main guidelines we established for this HOSE project.
The remaining of this chapter will appear as follows: First we show some structural developments considering the Portuguese settlement,
its housing policy and urban changes from the 70s till recent policy measures; secondly we
focus on household life conditions and the employment structure. After this brief
characterization we look for changes in behavioural responses and the new risks we could

3
predict facing globalisation changes. We finish with some policy implications and concluding
remarks, related with the HOSE research questions.

4
1. Structural Developments
Globalisation has different impacts on housing, labour and welfare systems.
The spatial organisation of economic activity changed rapidly with new technology
jobs, capital and labour mobility. Owning a home is therefore an important issue, once
it can (not) constraint individual mobility needed for new labour market functioning.
Looking at home tenure practices one could expect that the rental market is becoming
more important than homeownership; however it looks like this is not the main trend
occurring within European countries, which raises an important research question.
Historical path is important in each country trying to know how many people they
have, where do they live, work, how much they earn, in order to understand their
settlement style. Each country reaction is also related with their growth rate,
specialisation, development strategy and international trade share. Urban renewal is
happening in several rhythms and patterns, influencing housing-labour market
connections in a different way.
1.2. Housing policy and urban change in Portugal
Housing system analysis must consider explicit (enforced) and implicit
(absence) housing policies, in order to stress the main consequences in housing
provision and in social structure (Allen, Maldonado et al. 1998).
Housing construction is a complex process in the country. This complexity is
due on one side, to the late (60s) and incipient industrialisation process, which caused
an important traditional self-construction sector; on the other side, it is also the result
of a strong centralisation in housing policy, which developed a peculiar informal and
individual practice in house provision at the local level.
In fact, Portugal has a centralised policy over time. There are no regional or
intermediate public administrative levels and therefore it emerged a practice of
diversified and asymmetric housing provision at the local level. Moreover, Portuguese
emigration flows originated during the 60s and early 70s in the rural areas, allowed
capital inflows that were the basis for diverse kinship and family networks tied with
housing self-provision. People always counted on themselves to build or find their
shelter, largely supported by emigrant capital inflows.

5
Although local policies in Europe (after the 80s) progressively rely upon
market forces, housing is still a very speculative business in a great part of Portugal.
Due to the implicit policy of non-severe inspection upon housing construction and the
incipient urban planning practices at the local level, households and constructors were
stimulated to follow self-promotion practices, using their social links and looking
after tax evasion benefits. The social cost of these procedures can be measured by a
general low quality in housing supply, an increase in environmental costs and a
pattern of spatial segregation and social exclusion expressed through the absence of
maintenance and repair works. Beyond this, informal market practices also lowered
demand exigency and created a considerable economic loss expressed in lower city
competitiveness and sustainability, harming them to respond to global challenges.
Within this housing development pattern, a double negative effect occurred in
different cities: over-agglomeration and periphery struggles claiming for different
social and welfare policies. In the 90s the Portuguese Housing �map� underlines the
dualist side of the problem, with a predominantly rural territory, regardless of 67% of
the total population living in the two main cities � Lisbon and Oporto.
According to these previous statements it seems strategically inappropriate to
consider rural and urban issues separately as central policy tends to do. Urban centres
are very dependent on the quality of their closest rural areas. Portugal and Greece
show, in a major extent, a higher dependency ratio (Allen, Maldonado et al. 1998) and
we know that this fact corresponds to the territorial pattern associated with rural areas,
suggesting different and concentrated territorial policies. Of course these policies will
produce different impacts, depending on the age structure of the population living
there.
Let�s see how did Portuguese population settled over the last decades.
1.2.1. Portuguese settlement Portugal location on the extreme western Atlantic arch of the European
continent deeply influenced its past, pushing Portuguese people to cross overseas.
Traveling across the sea belongs to the Portuguese history since the XVth century.
With its colonial past, Portugal influenced the architectural heritage of many cities
around the world (in India, Macao, Japan, Brazil, Angola and Mozambique, etc.) and,
at the same time, determined its continental urban settlement.

6
In fact, Lisbon and Oporto grew as port towns and they are the main
Portuguese metropolitan areas at the present, where over 37% of the total resident
population is living, representing over 67% of the total urban population. The other
Portuguese cities were always abandoned by central governments because Portugal
growth was predominantly directed to foreign countries and therefore submitted to
strong emigration pressures along different periods (the 40' to America and the 60's to
Europe). Lisbon was the main sink for capital and human resources, creating twofold
disequilibria on urban development: (i) fast urbanization with overcrowding problems
on the main cities and (ii) desertification with scattered settlement in the most part of
the national territory.
Democracy recovery, thought as an opening door for new settlement
perspectives, was a delayed event in Portugal (1974), hence responsible for a delayed
(ongoing) urbanization process.
At the same time, Portugal is one of the less urbanized4 and one of the last
centralized5 countries in EU. These two characteristics explain why central
government still have the leader role in housing policy (and others), although
nowadays we have an increasing State-local authority co-operation on housing
improvement programs.
Portuguese population stabilized at the 9,862,559 inhabitants in the last decade
and do live in an asymmetric space: (i) the metropolitan areas with about 3,650,000
people; (ii) three 100,000 inhabitants cities - Funchal, Braga and Coimbra and (iii)
only two 45,000 inhabitants cities - Faro and Évora. If we exclude about nine other
40,000 inhabitants coast towns, the most part of the urban centers have less than
20,000 people usually equipped to supply the minimum localized functions.
The recent trend in Portuguese demography expresses that although with
stabilized population, the interior territory is still losing people to the coast urban
centers, except in a few cities that still play the anchor role for its hinterland
development. People look for working places and then housing constructed area is a
4 The Ministry of Equipment, Planning and Territory Administration estimated about 49% urbanised population in metropolitan and places with more than 2000 residents or, at most, 55% urban residents if we also consider the most intensive scattering urbanised councils MEPAT (1999). Plano Nacional de Desenvolvimento Económico-Social 2000-2006. Lisboa, Governo. . 5 Regionalization process submitted to a national referendum 8 November 1996 was denied by people wish. In fact, more than 60% of the population answered "No" to the model presented by socialist and communist parties, proposing 8 new administrative regions.

7
dependant variable on population, income and place, which turns housing policy on a
regional issue asking for regional and local policies (Carvalho 1998).
Between 1981 and 1991, Lisbon metropolitan area presented a population
increase rate of 1,3% while in Oporto metropolitan area the rate reached up to 3,1%.
These indicators mean that the urbanization process is still going although in a
decreasing way.
In the rest of the continent we can observe two types of demographic patterns.
First, the increasing importance of some mid-size towns that in the interior east
territory, is pulling rural neighborhoods; secondly, a scattered urban process, in the
other west spaces, where industrialization is penetrating the rural space since the 70's.
This settlement pattern strongly conditioned housing State intervention.
1.2.2. Different phases on housing policy
Acquisition was the way out for low social cohorts, lefting public house
provision to the poorest population living in the two main towns - Lisbon and Oporto
- as we can see.
In table 1 we can state that social housing provided by national government is
spatially confined to the two main metropolitan areas and it represents a very small
percentage of the whole housing stock.
Table 1 - Social housing* in total housing stock (%)
Census Year Lisbon Oporto Others % in Total stock
1950 3.6 1.6 0.2 0.8 1960 5.0 2.5 0.3 1.5 1970 7.0 5.1 0.7 2.7 1981 8.2 5.9 1.4 3.9 1991 5.9 3.8 3.2 4.4 2001 na na na 6,6
Source: adapted (INE 2001) *Considering social housing as INE - (INE 1991) defines it, i.e., dwellings built by public institutions and administration. We can also summarize some other important conclusions:
1. 2001 data is not available on the same basis although we know it shows the same pattern.
2. The percentage of social housing provision is not that great, although it is 8.25 times higher in half a century.

8
3. The 2 metropolitan areas reveal a net increase above average of 16.4 in Lisbon and 5.6 in Oporto (until 1991).
4. At the local level, most of the communities are shifting to a selling policy of their social housing stocks.
5. There is a special program (PER) started in 1995, which goal is to reallocate the fringe of the households still living in metropolitan shanties. The housing start is being accomplished within a short 2 years delay.
Looking now at Table 2 we can see that private sector covers, in average, 90%
of total housing provision, while public sector only surpasses one digit percentage in
1966, 1970, 1972-73 and from 1977 up to 1984. This last indicator reveals an
important fact: we have a housing deficit creating people's pressure over the
government during crisis or democratisation periods; a return to market solutions
appears after the mid-80's liberalisation process. We can say that housing provision is
mainly a private business in Portugal.
The small increase in the co-operative sector can be explained by the after 90's
legislation produced to develop this sector and to promote a central/local government
co-operation although in a very segmented social belt (upper-middle class).
Table 2 – Total Housing provision (1960-1999)
Year Total Private sector
%
Public sector
%
Co-operative sector
%
1960 26.660 24.290 91.1 1.995 7.5 375 1.4 1961 29.803 27.688 92.9 1.759 5.9 356 1.2 1962 29.666 27.908 91.1 1.501 5.1 257 0.9 1963 29.710 28.070 94.5 1.319 4.4 321 1.1 1964 34.944 32.327 92.5 2.386 6.8 231 0.7 1965 34.940 31.575 90.4 3.077 8.8 288 0.8 1966 35.891 31.532 87.9 4.143 11.5 216 0.6 1967 41.328 38.721 93.7 2.368 5.7 239 0.6 1968 39.231 36.180 92.2 2.882 7.3 168 0.4 1969 38.593 n.a. n.a. 135 0.3 1970 27.875 24.570 88.1 3.221 11.6 84 0.3 1971 36.007 32.409 90.0 3.453 9.6 145 0.4 1972 40.611 35.421 87.2 4.895 12.1 295 0.7 1973 41.933 37.141 88.6 4.559 10.9 233 0.6 1974 43.402 40.810 94.0 2.339 5.4 253 0.6 1975 31.967 29.563 92.5 2.180 6.8 224 0.7 1976 30.028 28.569 95.1 1.296 4.3 163 0.5 1977 34.893 28.896 82.8 5.848 16.8 149 0.4 1978 34.379 30.043 87.4 4.235 12.3 101 0.3 1979 36.430 31.136 85.5 5.154 14.1 140 0.4 1980 38.231 32.084 88.9 5.665 14.8 482 1.3 1981 38.632 32.226 88.4 5.490 14.2 916 2.4 1982 39.857 33.207 83.3 6.060 15.2 590 1.5 1983 38.191 31.917 83.6 5.525 14.5 749 2.0 1984 41.250 32.739 79.4 7.278 17.6 1.233 3.0

9
1985 35.475 31.738 89.5 2.127 6.0 1.610 4.51986 37.274 34.455 92.4 1.416 3.8 1.403 3.8 1987 38.833 34.777 89.0 1.391 3.6 2.665 6.9 1988 45.974 42.414 92.3 1.186 2.0 2.374 5.2 1989 58.152 50.703 87.2 4.029 6.9 3.420 5.9 1990 62.081 55.207 88.9 3.460 5.6 3.414 5.5 1991 63.229 57.808 91.4 1.599 2.5 3.822 6.0 1992 52.185 46.191 88.5 2.434 4.7 3.560 6.8 1993 63.199 57.310 90.7 1.602 2.5 4.287 6.8 1994 59.353 n.a. n.a. n.a. 1995 65.304 n.a. n.a. n.a. 1996 65.607 n.a. n.a. n.a. 1997 70.515 n.a. n.a. n.a. 1998 88.962 n.a. n.a. n.a. 1999 105.962 n.a. (a) n.a. n.a. 2000 107.900 n.a. n.a. n.a.
Source: buildt upon INE - Estatísticas da Construção e da Habitação (INE 1960-1999) (a) Another source (INE 2000) indicates 99%. After the II World War, housing construction/per year average rounded the
10/1000 inhabitants in the three main affected countries - France, Great Britain and
Germany. In the same period Portugal has 4/1000 average and recently 6,4 in 1991
and 6,6 in 1996. In fact, the post-war period was determinant to the modernization of
the construction sector that benefited from the Keynesian European macro policies,
which did not happen in Portugal.
The history of Portuguese housing economy evidences that the main public
interventions were carried out as a consequence of health reasons and as an
instrument for social control, minimizing the socio-economic effects of the low salary
policy implemented during the dictatorship in order to benefit the industrial sector. At
the late 60s, urbanization and industrialization intensified and the State was pushed to
create the first public institution in 1969 - F.F.H.6 - to inspect co-participated housing
construction.
In the first half of the XXth century the State played the regulatory role in
order to guarantee the accomplishment of the broad capital accumulation strategy. We
can point out two main characteristics in this period: special programs to build Casas
Económicas (economic houses - 1933) and rent freezing in the cities (1940). Although
rent freeze was relevant during the dictatorship phase, the first law conditioning rent
updating was introduced in the 1st Republic (1910-28)7. This rent freeze was a stop
6 People could ask for public help paying a mortgage rent, and kitchen and bathroom were under State responsibility; the remaining construction area suffered strong control creating a very strong informal provision. We had a dualist market with about 30% luxury formal sector and 70% informal. 7 The rent updating could be done from ten to ten years within a 10% limit; it was repealed the March, 30, 1928 (Decreto 15289) and recovered in 1940. For more details Carvalho, P. G. (1995). O Mercado
10
and go process in Portugal and, together with land ownership concentration in a small
social group, could be pointed out as responsible for the huge homeownership rate in
the country. The rent market could not be profitable while the income per capita was
low and none investor would be interested to apply their savings in cheap house
building.
We can date from 1970 the first legislation that paid important attention on
housing problems8 and we name it because these laws still regulate our local
authorities practice focusing on three important features in housing provision: need of
planning, land acquisition and technical expertise.
After the beginning of the democratization process (April 1974), 1976 can be
considered as the crucial year for housing legislation. The informal housing market in
the surroundings of Lisbon has already reached its peak and the Government needed
to cover the infrastructure lack in housing buildings. Some administrative power was
transferred to local authorities in order to enable them to expropriate land and to
provide technical advice to private owners.
Land becomes an important resource for housing markets, nevertheless neither
central nor local power were successful when organizing a coherent and needed
housing policy. Popular pressure was always stronger raising two important political
movements: uncontrolled occupation of vacant houses and stronger housing rent
freezing. In the period between 1974-76 we had the reinforcement of the direct public
provision (from 1.104 to 9.000 and 14.795 dwellings each year), immediately
followed by a financial reduction imposed to local authorities and the weaker
importance given to public housing institutions.
The F.F.H. was extinct in 1982, which means that central government
definitely gave up from direct intervention on housing, preferring that market forces
could answer to the problem. At the same time ancient political promises of
decentralization and regionalization did not came up, turning local authorities less
able to promote social housing programs as they did it before. This means the
beginning of the global liberalization consequences.
de Habitação em Portugal: uma análise cross-section para os 305 concelhos. Economics. Coimbra, Coimbra. :cap 7. 8 Such as: the need for land expropriation, the redefinition of hierarchical competences and the creation of special services for local authorities (DL 576/70 and DL560/71).
11
The deep economic crisis in the very beginning of the 80's brought higher
interest rates and budget deficits, which switched government intervention from
housing provision to credit and fiscal policies. From 1982 to 1985, the Portuguese
Government created two public institutions, the F.A.I.H. and the I.N.H., to co-
ordinate credit supply operations and to control the construction process of State
casas económicas9.
Although Portuguese integration in ECC reports to 1986, only in 1990 the
National Bank dropped credit rationing and just in 1991 credit supply through
commercial banking system was possible.
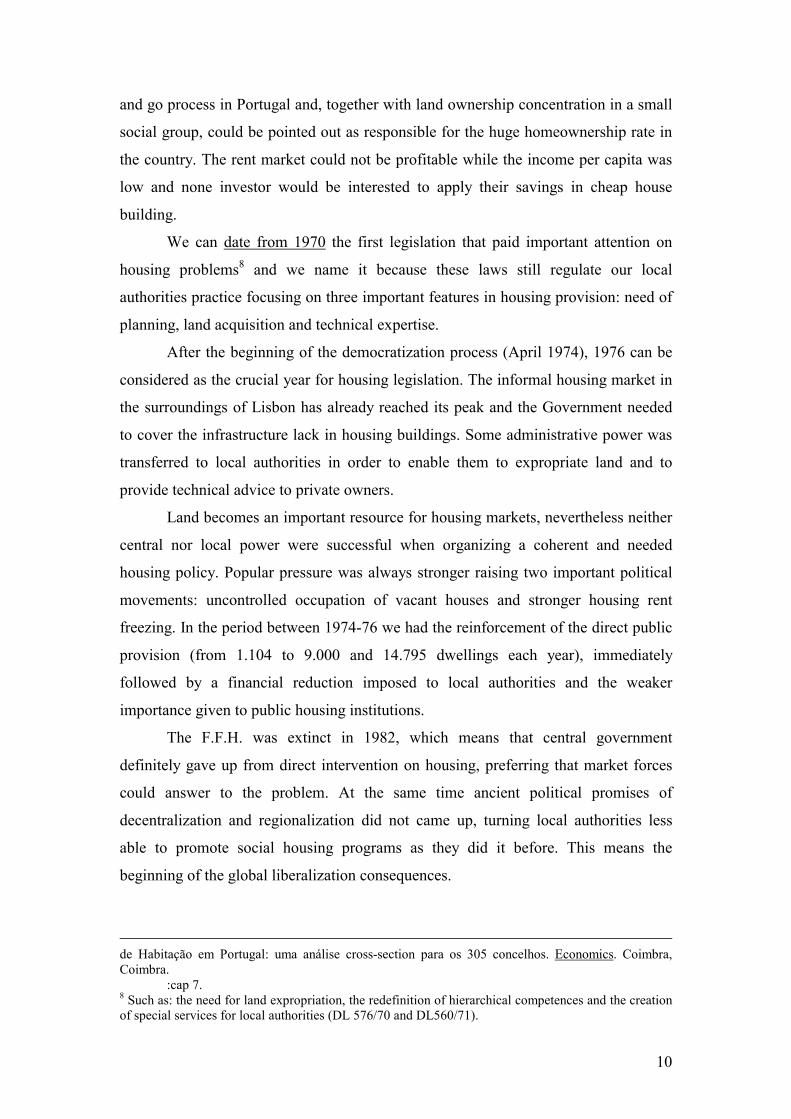
In what housing tenure concerns we can say that rental housing market in
Portugal is not dynamic. Let's have a look on Table 3:
Table 3 - Concluded-housing buildings Housing destination 1984 1992 Average %
1984 1992Free rent houses 188 302 0.96 → 1.49 Houses for sale 2.215 3.911 11.38 → 19.34 Owner occupied Houses 15.312 15.314 78.67 → 75.74 Owner occupied and others Houses 412 486 2.11 → 2.40 Housing buildings supported by SAAL 8 0 0.04 → 0.00 Casas Económicas 5 10 0.02 → 0.04 Casas Económicas in rent system 83 12 0.42 → 0.05 Casas Económicas in the mortgage system 21 1 0.10 → 0.00 Houses with limited rent 11 0 0.05 → 0.00 Houses for poor families 0 1 0.00 → 0.00 Houses with development agreements 26 4 0.13 → 0.01 Other 1.182 178 6.07 → 0.88 TOTAL 19.463 20.219 Dwellings 41.250 52.185
Source: adapted from (INE 1993-1999)
Homeownership share is over 80% of the total destiny of housing buildings in
1984 and a little less (78%) in 1992. This trend is becoming stronger as a result of the
progressive rental market liberalization and interest rate lowering. Housing represents
the most important asset in family patrimony, absorbing almost the household
savings10.
9 The main goal of both institutions was to guarantee interest bonus and the control of house dimensions built with special credit conditions ("casas de custos controlados"= controlled cost houses). 10 In Portugal, B. d. (1996). �Riqueza e Rendimento em Portugal: primeira abordagem do IPEF.� Boletim Económico(Junho): 55-71. , the table and graphic in pp. 57:60 show that housing represents 70% of the global household wealth.

12
The poorest fringe of the Portuguese society remains therefore the focus for
special housing programs once people are not able to rent, even the supplied houses in
controlled cost systems.
Summing up, the direct role of the State was to regulate social relations, to
validate the informal processes and to intervene only in extreme cases of poverty,
funding local authorities in partnership programs11.
Indirect housing policy was the main trend, acting through easing credit
procedures (= higher household effort rates), introducing several interest rate bonus
(=interest and instalments are tax deductible) and allowing different income (=saving
accounts for housing purposes) and property tax (= ten years exemption)12.
Recent shifts in housing policy and household practices
In order to fulfil Maastricht convergence criteria, Portuguese government
pushed public expenditure reduction since 1993, privatising national monopolies
(cement, electricity, telephone, mail), enforcing tax evasion, shifting school
maintenance and children transport from central to the local level. Moreover, local
authorities do need funds to support the 25% of national participation in EU funding
for infrastructure and developing programs. Due to weak regional administration in
Portugal, only the top personality-based local authorities achieve to absorb the great
amount of EU subsidies13. This means that regional disparities increased and the coast
cities keep pulling people, running after new job opportunities.
The main outcome of such national policy was the increasing of the housing
needs, the rise of more shanties in the main metropolitan areas and the promotion of a
huge percentage of family credit indebtedness shrinking national savings. According
to the report of the National Bank (Portugal 1996) household indebtedness is now
higher than the total amount of the Portuguese enterprises deficit14. Banks became the
real managers of household savings. People look at owning as a safe decision against
future uncertainty, expecting that real estate never depreciate.
11 Since 1995 it is being applied a special program (P.E.R.) to reinstall a great number of families still living in shanties in the suburbs of the main towns (near 10.000 new dwellings). 12 Recent government measures (September 2002) point out for ending interest rate bonus for youth and enlarging the mortgage period behind 30 years. 13 Those were the main conclusions of the research I carried out on �spatial pattern in FEDER�. 14 As over 76% is due to housing mortgage responsibilities, we could raise the question of what�s the real meaning of homeownership: bank or family owners?

13
The report also states that the increase in the household disposable income is
greater in the upper level classes. According to this, the Minister of Labour and
Solidarity published recent measures (MEPAT 1999) revealing the shift in housing
and household policies as a consequence of indebtedness rise, summarized as follows:
- to reinforce bank inspection, asking for accountability on how much are they
really lending through housing special credit
- to improve the distribution of the minimum safety individual salary
- to create a family protection institution in order to re-evaluate family indebtedness
- to improve the homeowner protection on mortgage contracts, even when he is not
legally married (people living together)
- to stimulate and legalise atypical work, increasing single work opportunities
- to change the average week work time, stimulating the part-time jobs.
Unlikely, the amount of disposable money for the minimum safety individual
salary was not fully distributed in 1998 due to insufficient demand (will it be just an
asymmetric information problem?).
With the increase of divorce rate, houses usually are �given� in Court to the
wife and children, protected in their ownership, which probably increases the
maintenance financing problems. At the same time, houses are still over dimensioned
to those households (Tables 4a, b), obliging a sharing or renting system in order to
buy a smaller apartment (taking advantage from mortgage credit re-negotiation)15.
Numbers and comments on tables 4 a, b intend to give a broad sense of
housing characteristics in the recent years:
Table 4a – Single and multifamily buildings 1993 1994 1995 1996 1997 1998
Total buildings 23129 22484 26691 25765 28064 35046 1 dwellings 18903 18438 22051 21229 23101 28759 2 dwellings 852 943 1140 1117 1311 1721
% 85.4 86.2 86.9 86.7 87.0 87.0 3-11 dwellings 2200 2001 2317 2181 2338 2899 12-30 dwellings 980 907 1004 1046 1149 1428 > 30 dwellings 194 195 179 192 165 239
% 14.6 13.8 13.1 13.3 13.0 13.0
15 Although in 1997 there is a sign of behaviour shift while people are choosing smaller houses (nº divisions).

14
Table 4b – Housing characteristics 1995 1997
Year of unity: %
construction <1918 14.4 16.9 1918-1945 13 11.7 1946-60 11.3 13.2 1961-1970 15.1 14.2 1971-1980 25.3 21 1981-1990 19.4 20.5 >1990 1.5 2.3 Typology % 1995 1997
kind of building Single 63 64.6 Multifamily 37 33.9 Other na 1.4 Size %
Nº divisions <3 5.8 9.8 3 10.6 27.9 4 29.4 33 5 31.7 17.2 >5 22.5 12 Area %
M2 <20 1.3 0.9 20-29 3.3 2.6 30-39 6.9 6.9 40-59 21.2 20.5 60-79 23.5 23.7 >79 43.8 45.5 Infrastructure %
they have kitchen 98.4 99.3 electricity 99.4 99.3 water 97 97.9 shower 87 89.1
Sources: (INE 1993-1999), (INE 1993-1999), (INE 1995)
Main Changes in household situation
Household structure is mostly dependent on each member project of life.
Among other reasons, employment expectations, divorce/marriage rates, number of
children, family extension, housing attributes are, hence, an important feature. The
main changes occur in the bigger cities, but there is a general trend to diminish the
extension of the nuclear household as a consequence of the increasing expenses
related to job training needs, new consumption preferences and job/social mobility.
1. Construction of single housing largely exceeds the multifamily dwellings, apparently revealing the urban sprawl and higher demand for private and qualified places
. 2. There is a sign about
housing stock renewal (houses built after 1981) and also some rebuilding of old houses (1997).
3. The number of divisions in
new houses indicates the shift to a small family size although within larger spaces (≥80 m2) and better facilities.
4. Most part of the houses are
being constructed with regular equipments and infrastructures, pushing away 60s and 70s style of construction.
15
Housing mortgage is a huge restriction to new projects of life, because
sometimes people need to move quickly, even if they only achieve to sell the house
later on. This could be another explanation for social exclusion, once only the
members of the upper class households can afford to move and pay for training or to
buy/rent a second home in the city where they found the new job.
The diversity in the income sources we have described above will tend to
diminish as long as the economic integration process goes on. During the 60s, family
neighbourhood was decisive to establish kinship relations; nowadays, individual
labour solutions gives rise to different location choices that, adding to the increased
rupture in family structure, will worst off a lot of household situations.
For all these reasons we think that kinship networks will only be useful and
constitute a comparative advantage if social policy shifts from housing to labour/
education/health and training issues, trying to offset the natural real income decrease
for lower class households (though it shows a smooth average increasing).
It will be also useful to fix population in the rural areas surrounding the cities,
stimulating them to guarantee their self subsistence and to resist to the urban
temptation of selling the land for a new house they will not be able to maintain,
avoiding to move away at places where they have neither identity values nor qualified
skills to work.
Anyway, according to the 2001 Portuguese Census, housing stock represents a
number over 5,36 million for 3,7 million households, which represents a ratio of 1,34
houses per household. This is a huge number considering that in earlier 90s, we had a
large house deficit. In the last decade, an average of 84 thousand dwellings per year
were built, reaching over the 100 thousand in 1999 and 2000, which means an year
average of 8,4 dwellings concluded per each 1000 inhabitant.
At the end of the 70s, the housing stock was close to 3,4 million dwellings and
new construction was far from household growth, increasing the incentive to informal
market to grow (inter census data revealed that the lag between housing stock and
permits was over the 87%).
During the 80s, the average of constructed dwellings per 1000 inhabitants was
7,5, when the household growth reached the 226 thousands, though the
desequilibrium yet remained.

16
Informal sector represented 43% of new houses and from the whole
construction just 37% was occupied for permanent shelter, while 31% was reserved to
temporary occupation or just vacant. This was the period where credit was rationed
and rental market was frozen leaving over one third of the houses for no use at all.
Only in the 90s, as a consequence of the junction in four important economic
factors (credit liberalization; rent liberation; inflation stabilization and employment
growth), households absorbed 70% of the built houses.
Employment structure and labour market trends
During 1999 we can state an apparently positive situation in employment
conditions. As a matter of fact, in spite of the decreasing rate in GDP growth, total
employment has grown 2 points in the last year and unemployment stabilized at a
4.5% of total active population. At the same time, Working Population also increased
around 1 point, which reveals a strong sensibility to the expansionist economic cycle.
According to recent published data by the National Statistic Institute (INE 1999) the
increase in dependent jobs is higher than average (3.4% against 1.9%), with different
rates on non-permanent (12.3%) and permanent contracts (1.4%)(Tables 5a, b).
The National Bank (BP) explains this effect as an outcome of the expected
labour reallocation facing the higher rigidity of national labour legislation. Workers
are progressively tied to international weekly timetable, considering the total amount
of those who worked more than 40 hours a week (28.3 in 1998 to 24.2% in 1999.
Table 6a - Weekly Work Time CLASSES 1995 % 1996 % 1997 % 1998 % 1999 %
TOTAL EMPLOYED 4218.3 4264.3 4358.2 4735.9 4840.1 1 to 15 106.5 2.5 125.6 3.0 159.8 3.8 153.9 3.6 149.4 3.5 16 to 25 230.0 5.5 246.1 5.8 273.2 6.5 262.0 6.2 276.5 6.6 26 to 35 551.9 13.1 566.9 13.4 572.0 13.6 591.9 14.0 616.4 14.6 36 to 40 1216.3 28.8 1267.2 30.0 1594.3 37.8 2386.1 56.6 2621.2 62.1 41 to 45 1197.5 28.4 1155.3 27.4 894.2 21.2 516.0 12.2 431.3 10.2 >45 916.0 21.7 903.3 21.4 864.7 20.5 816.0 19.3 734.6 17.4 Source: (INE 1999).
Employment growth, produced a structural change; actually, Construction,
Electricity, Gas and Water increased at a rate of 7%, as well as Public Administration,
Education and Health (6.9%) and Other Services (4.7%); meanwhile, there is a
decrease in Manufacturing Industry (- 2.4), Agriculture and Fishermen (- 4.4) and
Mining Industry (- 16.6). (Table 5c).

17
Table 5c – Employment structure 1993 % 1994 % 1995 % 1996 % 1997 % 1998 % 1999 %
EMPLOYED POPULATION T 4240.
6 4275.
4 4218.
3 4264.
3 4358.
2 4735.
9 4840.
1
M 2355 55.5 2370.
8 55.5 2323.
3 55.1 2354.
5 55.2 2393.
2 54.9 2633.
9 55.6 2653.
3 54.8
F 1885.
7 44.5 1904.
6 44.5 1894.
9 44.9 1909.
8 44.8 1965 45.1 2102 44.4 2186.
8 45.2 AGRICULTURE AND FISHERMEN T 480.8 11.3 496.1 11.6 484.8 11.5 535.5 12.6 604.9 13.9 635.2 13.4 612.4 12.7
M 236.3 49.1 239.2 48.2 241.8 49.9 260 48.6 286.9 47.4 315.5 49.7 297.1 48.5
F 244.5 50.9 256.9 51.8 243 50.1 275.5 51.4 318 52.6 319.7 50.3 315.3 51.5 TRANSFORMATION, BUILDING, ELECTR. & GAS T
1393.8 32.9
1411.8 33.0
1353.6 32.1 1339 31.4
1389.5 31.9
1707.4 36.1 1702 35.2
M 946.2 67.9 948.6 67.2 924.5 68.3 923.1 68.9 986.6 71.0 1190.
3 69.7 1173 68.9
F 447.6 32.1 463.2 32.8 429.1 31.7 415.9 31.1 402.9 29.0 517.1 30.3 529 31.1
SERVICES T 2366 55.8 2367.
5 55.4 2379.
9 56.4 2389.
8 56.0 2363.
7 54.2 2393.
3 50.5 2525.
7 52.2
M 1172.
5 49.6 1183 50.0 1157 48.6 1171.
4 49.0 1119.
7 47.4 1128.
1 47.1 1183.
1 46.8
F 1193.
6 50.4 1184.
5 50.0 1229.
9 51.7 1218.
4 51.0 1244.
1 52.6 1265.
2 52.9 1342.
6 53.2
Table 5a - Working Contract 1993 % 1994 % 1995 % 1996 % 1997 % 1998 %
EMPLOYMENT contract T 4240.6 4275.4 4218.4 4264.3 4358.2 4735.9
M 2355 55.5 2370.7 55.4 2323.3 55.1 2354.4 55.2 2393.2 54.9 2633.9 55.6
F 1885.5 44.5 1904.5 44.5 1895 44.9 1909.8 44.8 1965 45.1 2102 44.4 Working for
other T 3112.2 73 3062.3 72 3041.6 72 3036.1 71 3082.4 70 3386 71.5
M 1709.2 54.9 1673.4 55 1635.8 53.8 1648.9 54.3 1672.2 54.2 1865.3 55.1
F 1403 45.1 1388.9 45 1405.7 46.2 1387.2 45.7 1410.3 45.8 1520.7 44.9 Single
self work T 763.8 18 823.3 19.2 825.4 19.5 890 20.8 941.6 21.6 930.7 19.6
M 403 52.8 440.4 53 450.5 54.6 472 53.0 502.8 53.4 505 54.3
F 360.8 47.2 382.9 47 374.9 45.4 418 47.0 438.8 46.6 425.7 45.7 Self work & employer T 281.7 6.6 286.7 6.7 268.7 6.3 262.7 6.1 261.1 5.9 278.1 5.8
M 209.4 74.3 213.3 74 200.9 74.8 197.5 75.2 186.9 71.6 204.9 73.7
F 72.3 25.7 73.3 26 67.8 25.2 65.1 24.8 74.2 28.4 73.2 26.3 Family non paid
worker T 82.9 1.9 103.1 2.4 82.7 1.9 75.5 1.7 73.1 1.6 141.1 2.9
M 33.4 40.3 43.6 42 36.1 43.7 36 47.7 31.3 42.8 58.7 41.6
F 49.4 59.6 59.4 58 46.6 56.3 39.5 52.3 41.7 57.0 82.4 58.4 Other
T 250.2 5.9 310.8 7.2 310.8 7.3 324.5 7.6 310.8 7.1 231.8 4.8
M 117.1 46.8 155.7 50 157 50.5 156.8 48.3 149.4 48.1 98.2 42.4
F 133.2 53.2 155.4 50 153.9 49.5 167.8 51.7 161.4 51.9 133.6 57.6 1. Almost 3 quarters of the total contracts concern people working for other; around 1/5 is the
number of self-workers; the share of people working at home without salary is lower and unstable, offsetting the periods of work-off.
2. The sexual structure of employment reveals the expected tendency for male predominance in self-work & employer, while female dominance emerges in non-paid work at home.
Table 5 b – Employment type of contract

18
EMPLOYMENT CONTRACT - 1999 T 3508.2
%
TERM T 483.3
%
13.7
NO TERM
T 2819.4
%
80
M 1898.7 54.1 M 218.4 45.2 M 1557.8 55.3
F 1609.6 45.9 F 265 54.8 F 1261.6 44.7 Source: (INE 1999)
According to a control sample built by INE, employment rotation by trimester
is lowering; just 0.7% is moving from employment to unemployment and 1.5% from
employment to inactivity. We can also conclude that 22.4% of the unemployment
stock moved to inactivity and the conversion from temporary in permanent contracts
reached the 6.8%, while the reverse rotation reached but the 0.5%.
Another interesting remark is that in spite of the decreasing unemployment
rate, it is not that clear that the number of subsidized people also decreased, even
considering the universe of unemployed people and subsidized unemployed is not the
same16. The rise in subsidized unemployment highlights the important role of
subsidies determining the unemployment average and long-term unemployment
duration. Furthermore following the same INE survey, unemployed population
received a subsidy representing 62.6% of the net average salary in 1998�s contracted
work, against 60.2% in 1999. This amount can be seen as a great incentive to diminish
demand in the labour market and for this reason, acts as an instrument to reduce the
intensity of unemployment-employment rotation.
The real wage consequence is a total increase of 3% (similar to 1998), which
is a little bit higher in Public Administration than in private firms. It is the fourth year
in a row of real wage increase at a higher rate than per capita productivity increase.
Finally we shall say that there is a strong (negative) correlation between self-
employment and unemployment rates, which partially explains the power to reallocate
the work force even within rigid labour market conditions. The full explanation could
be asserted as the ��junction between the high employment rule protection with the
tax and social insurance contribution incentives given to self-employment unlike other
alternative employment opportunities� (Portugal 1999):136.
Summing up, there is plain evidence that self-employment is playing an
important role in labour market dynamics, mainly within labour segments, which
show higher unemployment rates � under qualified workforce � thus contributing to a
low global unemployment rate in Portugal (last number November 2001 - 4%). But 16 From all the registered unemployed people, those who receive the subsidies represent 27% because the other 73% either were not eligible or had overcome the maximum unemployment period to be eligible.

19
using a more qualitative approach to this low unemployment rate we can state a link
between this rate level and the slow level in industrial restructuring and salary level,
which means that there will be no way out to long-term employment. The
unemployment rate is being sustained through a stronger subsidy17 and low salaries
policies, which pushes public expenditure to dangerous levels18.
Within the EU context, national governments have lost the exchange rate
policy instrument, meaning that the macroeconomic adjustments should be nowadays
achieved through other instruments. Among these other possibilities we have the
stock foreign sales, the unemployment rate and also the private indebtedness level.
Looking at the Portuguese foreign accounts (Table 7) we see that either the
Import/Export balance or the current deficit are negative, reaching over the 8% of the
GDP in 1999, against the 2% in Austria and the substantial surplus in Ireland and
Spain. In a 2-decade analysis Portugal reached the same deficit level than in the early
80s, which means Portugal is losing national competitiveness and comparing to the
rest of the EU-15 countries is living an advanced stage in the economic cycle (open
economy consequence).
(Portugal 2000)
17 In a recent Economics undergraduate research I have been supervising, there is strong evidence that Training Programs funded by European Funds achieve more Social goals than new employment places. Following the life track of those workers we cannot find an important market absorption rate. Training Programs are not territorial-based and not submitted to a competitive strategy planning. 18 September 2002, the new government presented legislation in order to turn labour market more flexible, easing the firing and stimulating horizontal and spatial mobility.
Table 7 – Portuguese Foreign Accounts – Principal Components (Net values)
1997 1998 1999 1998 1999 2000 1998 1999 2000 Jan-Mar Jan-Mar Jan-Mar Mar Mar Mar 1. Current Account -5309.9 -
7053.8 - 9373.2
- 1749.7
- 2030.8
- 3341.7
- 701.4 - 936.3
- 1230.9
2. Capital Account 2327.1
2246.8
2303.1
534.9
335.3
264.4
168.4
46.6
125.7
3. Financial Account 4392.9
4684.0
9482.6
2531.0
400.6
3374.2
1643.8
- 9.5
1127.6
3.1 Direct investment 518.7
- 18.6
- 2029.1
- 34.0
- 63.7
- 518.6
- 82.0
24.1
- 290.1
3.1.1 Abroad - 1471.0
- 2563.7
- 2547.7
- 385.9
- 276.2
- 981.6
- 142.7
78.4
- 318.0
3.1.2 In Portugal 1989.7
2545.1
518.6
351.6
212.6
463.0
60.7
- 44.3
27.9
5. Current + Capital Accounts
- 2982.9
- 4807.1
- 7070.1
- 1214.8
- 1695.5
- 3077.3
- 533.0
- 889.7
- 1105.1
Source: Banco de Portugal, Indicadores de Conjuntura, Maio 2000:15.

20
In the short run we should be �glad� for this data information; nevertheless it
could be illusory, once in the EU monetary environment all the economic adjustments
will be achieved in the long run, which turns the revert effect task more difficult.
21
BEHAVIOURAL RESPONSES - Changing attitudes - Risk reduction strategies - Housing mobility - More prudent lending and borrowing
There are recent studies and newspaper interviews published in Portugal
((Marques 1999), (Mateus 1999)) highlighting some dangerous consequences for the
Portuguese economy as a consequence of the rise in household indebtedness levels.
The first quoted study considers that Portugal is expanding to �European open credit
society’ in a path they call the �Northern American matrix’.
Private credit sharply grew in the 90s as a result of two convergent effects: the
supply side � liberalisation and financial innovation, housing credit support and
interest rate decrease � and the demand side for credit - changes in consumption
behaviour, cultural shift in credit and increase in disposable income.
Housing credit for homeownership is the main indebtedness source (76%19 in
1998. In 1997 the indebtedness imbalance due to housing credit is 37% of the
disposable income against 15% in 1990; the consumption credit also raised 10 points
in the same period (13 against 3%). The total amount of the household indebtedness
represents 50% in 1997 against 18% in the beginning of the 90s.
Nevertheless Portuguese household indebtedness is still lower comparing to
the European average and we cannot firmly assert that the Portuguese cost will be
higher than in some Northern European countries (e.g., UK, Sweden). However there
is some evidence that habits and attitudes towards credit are changing once young
people is the most indebted group.
Data from the National Bank (Portugal 1999), suggests that only 2.5% of the
bank private indebtedness imbalance is �risky or doubtful� (1.2% in housing credit
and 4.5% in consumption). The other available information gathered from the 2 main
Portuguese financial institutions, reveals that only 4.1% of the total contracted credit
had more than 3 months repayment delay. (Marques 1999) refers to the UK as an
19 There is no coincidence in the number. Marques, M. M. e. N., Vítor (1999). Endividamento in Dossier Investimento. Economia Pura: 46-49. refer to 76%; a national newspaper �Diário de Notícias June, 1st, 1999, refers to 71% and Mateus, A. (1999). Dossier "Essencial"; entrevista com consultor do BP. Semanário Económico: 4-8. refer to 80%. The 76.7% is our own result based in financial tables for 1997.
22
important advisor example, because from the same 3.9% level in 1989 the > 2 months
repayment delay it reached the 9.3% two years later!!!
(Mateus 1999) enhances the comprehension of this phenomenon when he
alerts to the difference between the 2 increase levels � 30% in the household credit
against the 5-6% increase in the disposable income. Furthermore this has been a quick
change, which doesn�t allow short run comparisons and suggests more cautious
analysis because per capita Portuguese income is 50% of the American citizens,
which means a completely different share for households with housing credit
affordability.
A personal survey just made near the main Portuguese housing credit
institutions, which represent 65% share of the housing credit market, shows that
household indebtedness is mainly due to extra commodity consumption, rather than
from housing repayments. With the last interest rate decade decrease, people suddenly
expected they could afford to improve their life standards and were tempted to ask for
credit beyond their saving capacities20. Anyway, all of the surveyed institutions
confirmed that is not a problematic issue till now, which did not avoid they are
studying security measures to those risks mostly based on the management of
personal and local credit situations.
In spite of the global structural changes, Portuguese population doesn�t look
like to diminish the demand for new homes as owners. We do not have deep
sociological studies providing us a satisfactory explanation, nevertheless we can feel
that being a homeowner is sooner or later an important goal for everyone and three
economic factors can underpin these behaviour: (i) first, rent level for new homes is
very high attending to the interest rate performance; buying a house it�s still a rational
choice, once equity level will offset credit cost, due to housing market volatility; (ii)
secondly, the late urbanization processes and the road infrastructure investment is still
going on, raising the opportunities to suddenly raise housing prices across the country
and allow people to expect returns wherever they buy; (iii) finally, facing job
uncertainty and national growth lag, people look at their home as the main wealth
asset and decide to deliver their savings management to the banking system because,
20 A research centre in real estate evaluation in U. Politecnica de Valencia � Spain - concludes, after a long-term study, that household behaviour related with home buying is very stable over time and constant in the percentage they could save after basic needs provision. When people save more than before, they spend it on housing improvement or higher quality houses purchases.

23
as an excellent internationalised sector, it is more likely it could be more efficient and
safe.
In few years we think that leadership of housing promoters will decrease and
then housing quality will be the break point to understand who wins and loses in the
process.
Another interesting issue about these markets is the heterogeneity of the
housing/labour processes across the territory. Recent published data on overall
housing prices is a remarkable confirmation of this situation, while for a national
average index 100, we have 134 in Lisbon metropolitan area, 107.5 in Algarve, 104 in
Oporto metropolitan area, while in the interior country the index goes over the 67.521.
Further research based on more appropriated surveys are needed, in order to
have a deeper understanding of behavioural answers to these issues, mainly because
we have any information that relates labour and housing tenure to household
responses.
Summing up, it is possible to state that in last XXth century decade, Portugal
revealed a sustained economic growth, where the housing sector was one of the most
dynamic sectors within the whole economy. Till the end of 2000, Portugal built an
average of 11 dwelling per 1000 inhabitants/year, which represents over the double of
EU rhythm (5,5) from 1990/1998 (graphic 1)
Graphic 1 – Average permits/1000 inhabitants
21 INE (2001). Sistemas de Indicadores de Preços na Construção e Habitação, Instituto Nacional de Estatística. .

24
Housing credit still holds at a very high level, rising inversely compared to the
interest rate trend (graphic 2). The housing construction represents something like 14
months of future construction business and over 80% of the whole construction
sector. From this amount, housing rehabilitation, transformation and improvement
holds a stable share of 17%, although we can predict some increase in the next
decade. In fact, we assist to a number of urban renewal projects in the inner cities of
the main towns, as a consequence of new legislation on rental markets and new
initiatives on inner city renewal.
Graphic 2 - Housing Credit and average interest rate
Source: (Portugal 2000)
We think that the main reason for this incredibly high level of new housing is
correlated with four main factors: (i) the lack of housing (quantity and quality); (ii)
the interest rate decrease; (iii) the stable level of low unemployment and (iv) urban
policies at the local level.
The first reason concerns the traditional lack of housing provision during
several decades in the recent past of the country; the second and third are
macroeconomic reasons concerning the EU convergence and inflation policies and
still low salary specialization; finally, all those factors acted as main incentives to
promoters and developers expectations in the absence of industrial diversification; at
the same time, local authorities looked at housing as an important asset to raise the
level of their budget revenues, once all the housing taxes revert to the local
administration level.

25
New Risks (based on Last Housing Secretary of State interview – Feb 2002)
There are some several risks we have to face in the next decades, mostly
related to the increase on migration inflows from eastern and African countries.
Shanty neighborhoods are a politically assumed risk for the next future. Not all the
municipalities are well equipped on human resources and there�s a serious risk that a
number of new illegal neighborhoods start to raise again while immigration can be
exploited by less scrupulous administrative public officers at the local level,
stimulating people to start building expecting that government will pay future re-
building and qualification (based on the late 60�s experience).
The delay in fiscal policy reform and the asymmetric income redistribution are
major concerns on housing policies. Nevertheless there�s a slow increase on the rental
market share.
The last 2001 Census refers to a number of 5.000 households reallocated from
shanties to decent and legal housing; the shanties lowered about an average of 25%,
depending on local policies. Since 1995 we passed from a 100.000 unsheltered
families to a lack of 30.000 decent houses supplied by a partnership between State
and local governments.
Paradoxically we still count 560.000 vacant dwellings and the municipalities
are being stimulated to re-build and reallocate people in those new buildings
(REHABITA program).
Building owners are receiving incentives to make renewal construction,
risking loosing their full property rights if they don�t. At the same time, rented house
before 1990 decreased over 50% (800 to 400 thousands) and new rental house raised
up to 300 thousand dwellings.
Housing prices are not that expensive (around 450 euros/square meter) but
the great volatility in prices is introduced through speculative land prices, which arte
not favored by fiscal policy measures upon speculators.
Social Security system
There is no special housing protection.

26
The social security system provides an income subsidy to all the unemployed,
which is roughly 65% of his (her) salary on the basis of the last two-month wage,
which cannot be either higher than 3 times the national minimum wage or lower than
the minimum wage. This subsidy holds during 12 months for unemployed <30 years
old; 18 months to unemployed >=30 and < 40; 24 months to unemployed >= 40 and <
45 and 30 months to unemployed >= 45. After the 45 years old there is a 2-month
wage add/each 5 years of worker social security contribution. If 55, the unemployed
gets the right to anticipate his(her) retirement.
All the unemployed household credit duties to financial institutions and rent
duties to owners will be re-scheduled and renegotiated on a personal customer basis.
After 6 months it is common to apply for court always counting on public
condescendence and support.
POLICY IMPLICATIONS
According to everything we were able to show, housing and labour markets as
well as social welfare issues reveals a high correlation and imply a cautious cross
analysis between micro and macro levels as well as to international conceptualisation.
Globalisation is a very quick phenomenon with important lag reactions in each
country, depending on its particular ranking at the international competition game.
Belonging to the EU gives higher confidence to reach the main development
goals; being a small and open economy brings higher risks to deal with the economic
cycle; looking at housing and labour market functioning as a strict social and short run
issue is a dangerous and lead to unsustainable policies.
It is therefore important to underline that socio-economic policies shifted a lot
with the globalisation process within the EU. It changed from the national to the
global level and at the same time, within each country, from the national to the local
level; the focus shifted from the short to the long run effects and, consequently, from
the State to the citizen level. The best each country is able to define its long run
policies, the more it can prepare a citizen answer to this global challenge. Of course
we consider that educational, health and training policies are, nowadays, territorial
issues asking for network approaches.
These are the challenges to following research work.

27
CONCLUSIONS
The main conclusions in UK case applies to the Portugal, namely asserting
that housing policies promoted homeownership and recent financial pressure over
government expenditure tended to diminish subsidies and risk insurance of the
indebted.
Unlikely the UK we have no available data to confirm the exact link between
the labour situation of the indebted and the housing mortgage arrears. In Portugal, the
main financial institutions and the Consumer Observatory say that indebtedness is not
a dangerous problem yet, although it has been increasing in the last 2 years at the
same time that housing transactions increase in number and value. These facts enable
us to predict that heterogeneity (both social and geographical) is an important
phenomenon in a country where unemployment is rather stable and low considering
the EU context.
Behavioural responses facing these trends also need further research and data
provided by the financial institutions just allow us to say that people tend to incur in
longer term mortgages and banks force them to pay considerable mortgage insurance
costs. Anytime repayment difficulties happen, negotiations about delaying mortgage
duration are found. Housing is a very important cyclical business, which makes
difficult to disentangle changes due to structural causes and ask for very cautious
research methodologies considering that average indicators give rise to a number of
considerable misinterpretations.
Covilhã, UBI, September 18th, 2002

28
Bibliography
Allen, J., J. Maldonado, et al. (1998). Housing market and welfare provision. "Housing in southern Europe: a different path?", Madrid, ENHR.
Carvalho, P. G. (1995). O Mercado de Habitação em Portugal: uma análise cross-section para os 305 concelhos. Economics. Coimbra, Coimbra.
Carvalho, P. G. (1998). The need of a regional housing policy: some researchbased arguments. Analysing Housing Patchworks in Europe. A. S. a. T. Traerup. Utrecht, Danish Building Institute.
Carvalho, P. G. (1998). Public intervention on housing: the Portuguese Case, ENHR Working Group Conference: "Housing in southern Europe: a different path?".
INE (1960-1999). Estatísticas da Construção e Habitação, INE.
INE (1991). Censos Definitivos, INE.
INE (1993-1999). Estatísticas da Construção de Edifícios, INE.
INE (1993-1999). Indicadores de Conforto, INE.
INE (1995). Anuário Estatístico, INE.
INE (1999). Estatísticas de Emprego 1995-1999, Instituto Nacional de Estatística.
INE (2000). Anuário Estatístico. Lisboa, Instituto Nacional de Estatística.
INE (2001). Censos Preliminares, INE.
INE (2001). Sistemas de Indicadores de Preços na Construção e Habitação, Instituto Nacional de Estatística.
Marques, M. M. e. N., Vítor (1999). Endividamento in Dossier Investimento. Economia Pura: 46-49.
Mateus, A. (1999). Dossier "Essencial"; entrevista com consultor do BP. Semanário Económico: 4-8.
MEPAT (1999). Plano Nacional de Desenvolvimento Económico-Social 2000-2006. Lisboa, Governo.
Portugal, B. d. (1996). �Riqueza e Rendimento em Portugal: primeira abordagem do IPEF.� Boletim Económico(Junho): 55-71.
Portugal, B. d. (1999). Relatório Anual. Lisboa, Banco de Portugal: 136.
Portugal, B. d. (2000). Indicadores de Conjuntura, Banco de Portugal: 15.