Embed Size (px)
Citation preview

HOUSES, HORSES, AND HALLS OF LEARNING: DO FINANCIAL INCENTIVES MATTER?
Glenn BoyleExecutive Director,
NZ Institute for the Study of Competition and Regulation

THE ISSUE
The predicted effect of financial incentives on human behavior is a sharp theoretical dividing line between economics and …psychology. (Colin Camerer & Robin Hogarth)
ECONOMICSIncentives are the essence of economics. (Candice Prendergast)
Most of economics can be summarized in four words: People respond to incentives. The rest is commentary (Steven Landsburg)
PSYCHOLOGYMoney is not a motivator.(I)ndividuals who are committed to excellence… are particularly unlikely to respond to financial incentives. (Alfie Kohn)

• Evidence on power of financial incentives inwork/employment situations primarily relates to simple/manual tasks where performance is measured by quantity.- financial incentives matter.
• But what about quality-oriented tasks of so-called ‘experts’? Intrinsic motivation and ‘professional pride’seem likely to be more important here.
• Laboratory evidence suggests financial incentives have little or no effect on performance quality.
THE EVIDENCE

1.Do experts exploit situations that allow them to extract rents from clients?
2. Can self-interested reputational concerns discipline expert behaviour?
3. Do experts put more ‘effort’ into tasks offering greater financial gain?
4. If you pay peanuts, do you get monkeys for experts?
FOUR QUESTIONS

QUESTION 1
Do experts exploit situations that allow them to extract rents from clients?

SETTING
• REAL ESTATE AGENT-CLIENT RELATIONSHIPNet marginal return to agent is about 1.5%
Suppose additional effort by agent would yield extra $10,000 in price. Opportunity cost to agent is $200, so has incentive not to expend extra effort.
But would do if also the owner.
• Compare sales prices of client- and agent-owned houses

DATA
• 100,000 home sales in Illinois 1992-2002 (Levitt & Syverson, 2005)
• 307,000 home sales in Texas 1998-2002 (Rutherford et al, 2005)
• Collected information on home characteristics, location, marketing strategy, agent experience etc

RESULTS
After controlling for house characteristics etc
• On average, agent-owned houses sell for 3.7% more than client-owned houses in Illinois
• On average, agent-owned houses sell for 4.5% more than client-owned houses in Texas
Economically Plausible
• For the median house, premium corresponds to$7700 in Illinois and $6000 in Texas.

CONCLUSION ON QUESTION 1
• Real estate agents obtain higher prices for own houses than for otherwise-equivalent client-owned houses.
• Apparently an example of a response to financial incentives that disadvantages clients - cannot rely on ‘professional pride’ for discipline.

QUESTION 2
Can self-interested reputational concerns discipline experts?
It is maddening that society confers its blessings on traditional academic pursuits but views the study of horseracing as utter frivolity.(Andrew Beyer)

SETTING
• RACEHORSE OWNER-TRAINER RELATIONSHIPClient-owned: trainers receives fixed daily fee + 10%
of winningsTrainer-owned: trainers receive 100% of winnings
• Tradeoff between short- and long-run – REPUTATION
• Compare performance of client- and trainer-owned horses

DATA
• Every harness horse that raced in NZ at least once during 1997-98 and 2002-03 seasons
• 1997-98: 4087 horses, 27451 horse-races, and 984 trainers2002-03: 3861 horses, 27126 horse-races, and 852 trainers
• Tracked performance, ownership and training details of every horse over entire season
• Also collected info on horse and trainer characteristics.

PERFORMANCE MEASURES
9*number of firsts + 5*number of seconds + 3*number of thirdsconsistency ratio =
9*Number of races during season
Stake earnings during the seasonearnings ratio = Sum of winning stakes from all races during season

RESULTS
B. Controlled for horse and trainer characteristics
Trainer-Owned Client-Owned Diff
Consistency Ratio 0.136 0.155 ***
Earnings Ratio 0.109 0.124 ***
A. Uncontrolled
Trainer-Owned Client-Owned Diff
Consistency Ratio 0.120 0.162 ***
Earnings Ratio 0.095 0.126 ***

0
0.01
0.02
0.03
0.04
0.05
0.06
Reputational Incentives (stable size)
WHAT DOES THIS HAVE TO DO WITH REPUTATION?
• Similar results with age/license proxies for reputation importance.

ECONOMIC INTERPRETATION
• Every $10K earned by typical horse when trainer-owned becomes $11220 when client-owned.
• But all ownership ‘action’ occurs in stables with strong reputational incentives.
• Every $10K won by typical client-owned horse in small stable (weak reputation incentives) becomes $13400 in large stable (strong reputation incentives).
• Mean performance of client-owned horses is approximately 12% better than that of trainer-owned horses.

CONCLUSION ON QUESTION 2
• On average, client-owned horses do better than trainer-owned horses
• But this advantage is apparent only in stables with strong reputational incentives
• The ability of long-term reputational incentives to discipline agents cannot simply be dismissed as a theoretical curiosity
• Most labour markets aren’t allowed to work as efficiently as that for horse trainers.

QUESTION 3Do experts put more ‘effort’ into tasks
offering greater financial gain?
• Or does ‘professional pride’ motivate them to treat all clients equally?
• Particularly germane to money managers, lawyers etc, butdata not available.

SETTING
• STAY AT THE RACETRACKSome horses race for much higher stakes than others
Trainers have incentive to devote extra effort to horses in high-stakes races.
Compare trainer effort/performance in high-stakes races with that in low-stakes races.

HOW CAN TRAINER EFFORT BE OBSERVED OR INFERRED?
• Punters set odds using available information.
• Can observe horse, trainer, driver quality etc, but don’t know how much effort stable has put in.
• If significant variation in trainer effort, then odds will be noisy estimate of true probabilities.
• High stakes races - all trainers put in optimal effort.
• So would see lower dividends on average in high-stakes races

DATA
• 30,450 harness races in NZ between 1993 and 2006.
• Collected information on:Race stake Race dividends - win, quinella, trifectaRace characteristics - field size, track surface &
condition, dispatch method, distance

RESULTS(including controls for field size and race ‘unpredictability’)
STAKE PERCENTILE20th 80th 20% higher stake
WIN $6.00 $5.65 -1.6%
QUINELLA $23.45 $22.00 -2.0%
TRIFECTA $342.50 $313.45 -2.8%
(races for experienced horses only)WIN $6.30 $5.90 -2.0%
QUINELLA $25.60 $23.90 -2.2%
TRIFECTA $391.55 $352.40 -3.2%

CONCLUSION ON QUESTION 3
• Market odds a better predictor of outcomes when stakes are high.
• Suggests that there is less ‘inside information’ to beutilised in high stakes races.
• Consistent with experts choosing to prioritise high-payoff tasks.

QUESTION 4
⇒
?
If you pay peanuts, do you getmonkeys for experts?

THE GENERAL IDEA
• NZ academic pay depends only on rank, not on discipline
If a university went ahead and paid equally,lowering economists' pay and raising Frenchprofessors' pay, it would have a great French staff and a dreadful bunch of economists.(Hamermesh, 2004, p180)
If peanuts beget monkeys, then the disciplines that are most ‘underpaid’ should have the weakest research performance on average.

IDENTIFYING PEANUTS & MONKEYS
Monkeys (PBRF)• Average Quality Score
- arithmetical average of discipline-researcherscores
• Proportion of R grades- ‘prevalence of monkeys’ in discipline
Peanuts• Available proxy: US discipline-specific academic salaries
‘Underpayment’ = average US salary - average NZ salary

SOME SIMPLE NUMBERS: I
MEAN MAX MIN
Average Quality Score
Proportion of ‘R’ grades 0.36 0.87 0.08
2.79 4.74 0.34
DISCIPLINE CHARACTERISTIC
‘Underpayment’ $20,910 $90520 -$340

SOME SIMPLE NUMBERS: II
Top-5 Average Quality Score
Discipline ‘Underpayment’ ranking
Philosophy 36
Anthropology and Archaeology 35
Earth Sciences 23
Ecology, Evolution and Behaviour 21
Biomedical 14
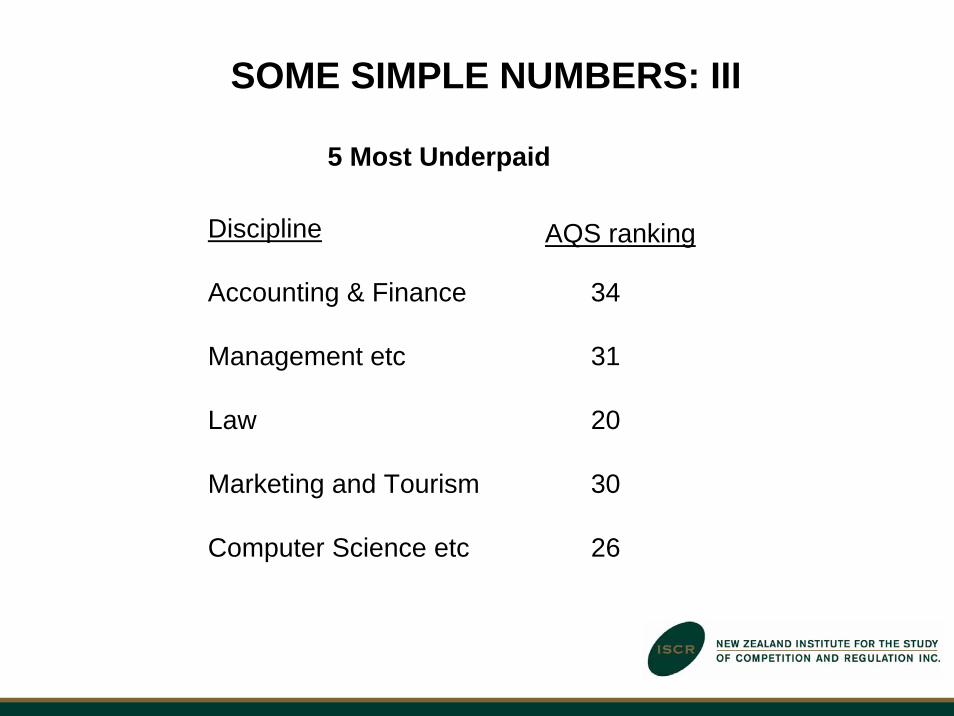
SOME SIMPLE NUMBERS: III
5 Most Underpaid
Discipline AQS ranking
Accounting & Finance 34
Management etc 31
Law 20
Marketing and Tourism 30
Computer Science etc 26

1
1.5
2
2.5
3
3.5
0 6 12 18 24 30 36 42 48 54 60 66 72 78 84 90
'Underpayment' ($000)
• Moving from most to least underpaid decile predicts a rise inaverage quality score of about 0.73 points, approximately 27% of the sample mean
RESULTS: I(controlling for other determinants of research performance)

RESULTS: II(controlling for other determinants of research performance)
0
0.1
0.2
0.3
0.4
0.5
0.6
0.7
0 6 12 18 24 30 36 42 48 54 60 66 72 78 84 90
'Underpayment' ($000)
• Moving from least to most underpaid decile predicts a 14 percentage point increase in the number of ‘R’ grades, approximately 39% of the sample mean

MONKEY ECONOMICS?
• Part-time workers
• New researcher bias
• Workload
• “Teaching matters too!”
• ‘Monkey-mimicking’ behaviour

CONCLUSION 4
• The greater a discipline's average salary in US universities, the weaker its research performance in NZ universities.
• NZ universities apparently get what they pay for: disciplines in which compensation is high relative to opportunity cost are best able to recruit high-quality researchers.
• Paying (relative) peanuts attracts mainly monkeys.

FINAL REMARKS
• Experts respond to financial incentives!
• Quality of performance is money-sensitive.
• But unknown whether this can be successfully exploited- decrease intrinsic motivation- unforseen consequences, e.g., ‘multitasking’