Embed Size (px)
Citation preview

Household Food Security and Nutrition Assessment
in BangladeshNovember 2008 – January 2009
World Food Programme (WFP)United Nations Children’s Fund (UNICEF)Institute of Public Health Nutrition (IPHN)

Acknowledgements
Respondents; Households; Communities
National, division, district, Upazila, and village authorities, including MOHFW, MOFDM
Joint Technical Committee: IPHN, UNICEF, WFP, FAO, BBS, DGHS, MOHFP, Mitra and HKI
MITRA – sampling framework, training, data collection and data entry/cleaning
Centre for Disease Control (CDC) Atlanta - informal technical support

Outline of Presentation1. Background
2. Survey Methodology
3. Results: 3.1. Demography and Gender3.2. Food Markets 3.3. Household Food Security3.4. Nutrition, Health, Water/Sanitation3.5. Malnutrition and Household Food Security
Linkages
4. Conclusions
5. Recommendations

1. Background Food Price Shock … and macro-econ. context

Timing: Food Price Shock…
Inflation rising mid 2006…
Inflation rate… > 7%
Food Inflation…
Rapid Rise begins mid 2007

Magnitude of domestic prices increases?Long term time Series: July ’95 thru Jan. 2009
Wholesale prices of rice (Real)

Price rise causes…
Global: Crop failures, oil price rise, bio-fuels…
Regional: Trade barriers, export bans …
Domestic:Natural disasters
2007 Floods2007 Cyclone Sidr

Food Grain Imports rise dramatically…2007-08
Source: Bangladesh Bank, Economic Trends (2009). P= Provisional estimates up to Feb.2009
90%
92%
94%
96%
98%
100%
Non-food grain Import Food grain Import
Value of Food Grain imports as percent total imports…2007-08 reaches 6%, vs. 3% in previous years

Trade barriers with IndiaRice*; “Minimum Export Price” set artificially high
Exports later banned: April 2008$U
SD/M
T
Oct. 2007
Dec. 2007
mid Mar. 2008
late Mar. 2008
* Rice: non-Basmati Rice
$425$505
$650
$1000

Bangladesh rice price De-links from India…
late2007
Dhaka Delhi
Taka
per
kg.
Source: India Ministry of Consumer Affairs, Food and Public Distribution; modified by WFP

Background… Economic Performance…
Moderately high GDP growth rates
FY 2006-07: 6.5%FY 2007-08 : 6.2%
Remittances strong…

Food Availability: Cereals, rice…
Rice… FY 2007-08 …close to rice self sufficient
29.8 Million MTs of food grain
Up 6.1% from previous year
Despite major natural disasters, Floods, Cyclone
Bumper Boro major factor; 17.8 Million MTs18.7% increase vs. previous year

2. Survey Objectives and Methodology
Primary Survey Objectives
Food Security
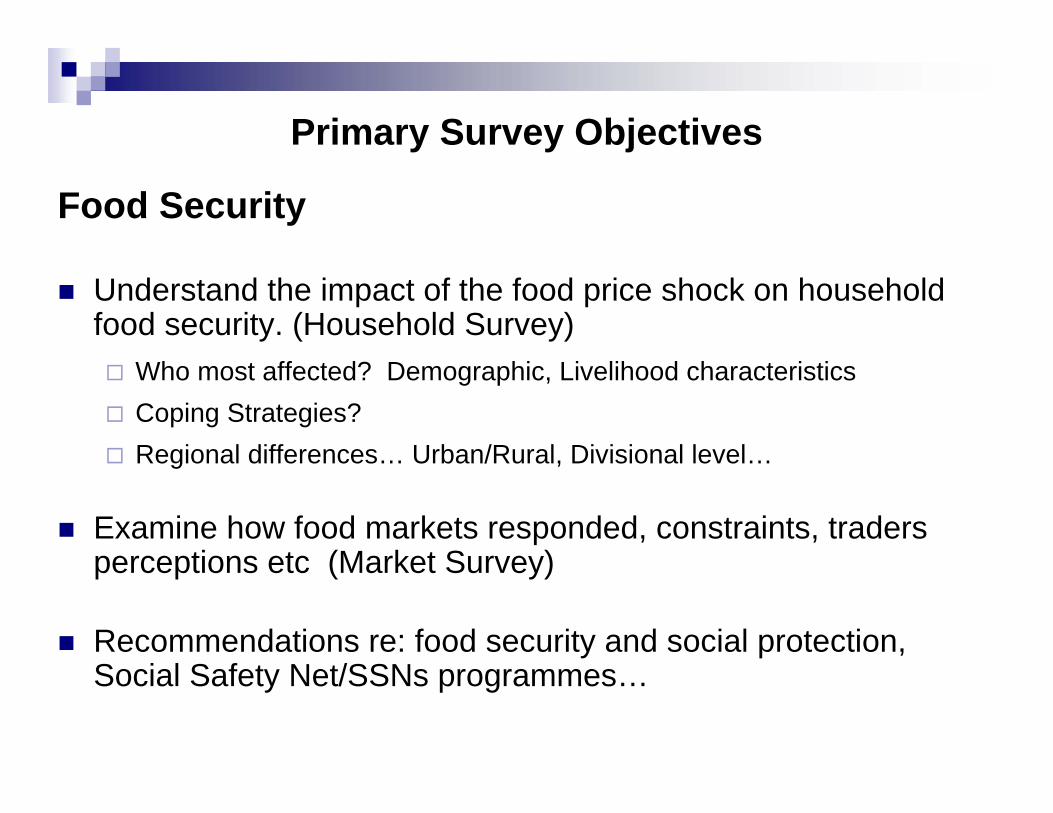
Understand the impact of the food price shock on household food security. (Household Survey)
Who most affected? Demographic, Livelihood characteristicsCoping Strategies?Regional differences… Urban/Rural, Divisional level…
Examine how food markets responded, constraints, traders perceptions etc (Market Survey)
Recommendations re: food security and social protection, Social Safety Net/SSNs programmes…

Objectives Cont-----
Nutrition, Health, Water and Sanitation
Nutritional StatusDetermine prevalence of acute malnutrition, underweight and stunting in children 6-59 months
Determine prevalence of MUAC in mothers of children < 5 years
Infant and Young Child FeedingGain better understanding of IYCF practices for children < 24 months

Objectives Cont-----Nutrition, Health, Water and Sanitation
Illness and MortalityDetermine crude and U5 mortality rates in 6 months prior to the survey Determine prevalence of diarrhea, fever, and ARI in children 6-59 months in 2 weeks prior to the survey and health seeking
Access To Services Estimate proportion of children 6-59 months in past 6 months and postpartum women who received Vitamin A in first 6 weeks after delivery Estimate proportion of pregnant women who received iron/folate supplementation
Water and SanitationEstimate the coverage of latrines and access to safe water amonghouseholds

Survey Design and Data CollectionWFP & UNICEF - Survey protocol and questionnaires design.
Technical Committee: IPHN, UNICEF, WFP, FAO, BBS, DGHS, MOHFP, MITRA and HKI provided inputs on entire survey process
Training and pilot-survey/pre-test conducted around Dhaka
Data collection - November 11, 2008 - January 19 2009, during the Aman harvest season by MITRA Associates
12 survey teams (2 supervisors, 6 interviewers, 6 quality control officers) and a supervisory team from IPHN and WFP field staff.
The food security component and market analysis was led by WFP and nutrition component led by UNICEF/IPHN

Sampling FrameDerived from the sample clusters of the 2007 BDHS survey
Sampling frame -Enumeration Areas (EA) and Sampling unit - Household.
A representative sample for the country as a whole, for the urban and the rural areas separately, and for each of the six divisions.
Sample Design - Two-stage, stratified sampleStage One – 361 clusters were selected randomly
Stage Two –Selection of households within a cluster – Goal - 30 HHs per cluster and about 10,000 households in total.
Adequacy of HH number per indicator was checked with CDC, Atlanta
Within a cluster, all HH were selected with a fixed interval from the enumeration area list
Interviewer collected data from the selected household only – No replacement of household

Markets/Trade
180 Markets - every other cluster
Markets selected randomly and proportionally to the distribution of the clusters among rural and urban areas.
Maximum of 5 traders – systematic random selection of 2 wholesalers and 3 retailers/shop keepers.

Assumptions used for Sample Size Calculations per
division/Rural/Urban/National
4354353922± 515%MUAC
4141372± 1095%Vitamin A last 6 months
8548547692± 550Underweight(WAZ <-2)
8548547692± 550Stunting(HAZ <-2)
3443443101.5± 516%GAM (<-2 z score + edema)
Number of households needed
1 child/HH
10%Non-response
Sample sizeDesign Effect
Desired Precision
Estimated Prevalence
Indicator

Sampling Size
10378361Total
2289134Urban
8089227Rural
63247Sylhet
267369Rajshahi
131957Khulna
324278Dhaka
185962Chittagong
65448Barisal
HHsClustersSamples:
For Market/Trade survey, 180 markets and 900 traders were interviewed

3. Results

3.1. Demography and Gender

Demography and GenderAverage household size: 5 persons
% of households with dependents: 40%
% of female-headed households: 8%
% of heads of household that never attended school: 43%
(Dependency is the ratio between the active population and inactive (below 15-years and 60+ years) population, i.e. those that are not working

3.2. Results/Highlights Food Markets Survey

Traders Perceptions, Market constraints:Low consumer purchasing power, a major constraint
35%
26%
11%
% o
f tra
ders
35% traders: “low purchasing power” the major constraintSource: survey, HHFSNA 2008

Traders Perceptions: Main Causes High Food Prices
HoardingStock building
High Price atSource Market
IncreaseTransport
Costs
24% 23%
11%
Source: survey, HHFSNA 2008

Traders identify more customers requesting credit
Requests for creditPercent of Traders indicating Change
More requests
Less requests
Same/No change
95% of traders extend credit to compensate for low demand…
43%
31%
26%
Source: survey, HHFSNA 2008

3.3. Results/Highlights Household Food Security

Households more dependant on the market…
Number of market participants grows
“Net food buyers” group expands most (+28%)
Urban (+35%)
Female headed HHs (+68%)
Livelihood Groups becoming more dependant…Wage laborers (Non-Ag) +59%Casual Workers +55%Remittance earners +53%

Impact on household income…
Real Income per HH drops by 12%HIES 2005: 4533 (BDT)
HHFSN 2008: 4000 (BDT)
Nominal income, 2008 vs. 2007 2008 increases by 11%
2.0
3.0
4.0
5.0
6.0
7.0
8.0
Lean season(March-April)
2007
Boro season(May-June)
2007
Aman season(Nov.-Dec.)
2007
Lean season(March-April)
2008
Boro season(May-June)
2008
Term
s of
Tra
de (D
aily
/Kg
of R
ice)
Agric. Rural Agric. Urban Agric. TotalNon-agric. Rural Non-agric. Urban Non-agric. Total
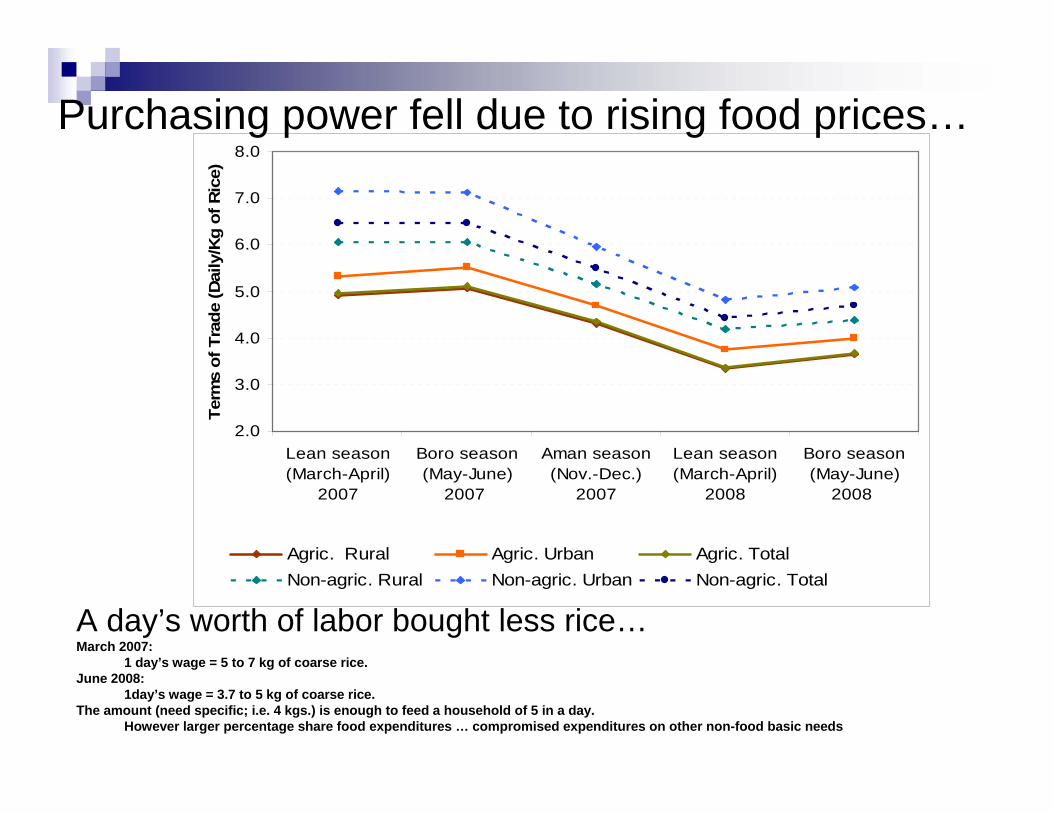
Purchasing power fell due to rising food prices…
A day’s worth of labor bought less rice…March 2007:
1 day’s wage = 5 to 7 kg of coarse rice.June 2008:
1day’s wage = 3.7 to 5 kg of coarse rice. The amount (need specific; i.e. 4 kgs.) is enough to feed a household of 5 in a day.
However larger percentage share food expenditures … compromised expenditures on other non-food basic needs

Households spend more on food…
Cause for concernLess money for other basic needsPotential impact on development, and MDGs
2000HIES
2005HIES
2008HFSNA
51% 52%
62%Food Expenditures; as Percent of Total

Households spend more on food…
•Highest shares… by Division • Sylhet 67.7%, Chittagong (64%) and Dhaka
(62.2%)
•Female-headed households 64 %
• Vs. 62% MHH
• Unlike past expenditure patterns …• not much difference between rural urban food
expenditures

Borrow MoneyFamily, Friends
Borrow MoneyBanks, Micro-credit
Reduce healthexpenditures
34% 33%
22%
Coping by Taking on debt, and reducing health expenditures
Most common coping strategies last 12 months
% o
f Hou
seho
lds
Source: survey, HHFSNA 2008

14
23
1512
2015 13 16 14 13 15
0.0
5.0
10.0
15.0
20.0
25.0M
ale
Fem
ale
Rur
al
Urb
an
Baris
hal
Chi
ttago
ng
Dha
ka
Khul
na
Raj
shah
i
Sylh
et
Aver
age
Sex ofhousehold
head
Area Division National
CSI
Female Headed Households Struggling to Cope
Coping Strategies Index; Results
On average…Female headed hhs had comparatively much higher; 64% higher… CSI scores vs. HHs headed by males.

27%
17%
26% 25%
20%
25%
31%
23%
38%
24% 25.0%
0%
5%
10%
15%
20%
25%
30%
35%
40%
45%
50%
Rura
l
Urb
an
BA
RIS
AL
CH
ITTA
GO
DH
AK
A
kH
ULN
A
RA
JSH
AH
I
SYLH
ET
Bangla
desh
Male
Fem
ale
Type of area Division Sex ofhousehold
head
Percent Food Insecure based on Food Consumption Scores
One in four (25%) of households are food insecure

Who are the most affected households?% Food Insecure
(Food Consumption Scores)
%Spent on food
Coping Strategies Index
Scores
Non-agric. labourers
38% 69% 23
Agric. labourers 45% 69% 27
Casual workers 56% 76% 26
Average 25% 62% 14

3.4. Nutrition, Health, Water and Sanitation

Child Nutrition

2009 National Estimates:Child Malnutrition, Wasting, Stunting, Underweight
6 – 59 months (WHO standards)
12.3%(CI 10.9-13.8)
20.1%(CI 18.4-21.8)
3.4%(CI 2.8-4.2)
SevereMalnutrition:
37.4%(CI 35.4-39.5)
48.6%(CI 46.5-50.6)
13.5%(CI 12.1-15.0)
GlobalMalnutrition:
Underweight (WAZ)
Stunting (HAZ)
Wasting(WHZ)
Children 6 – 59 months
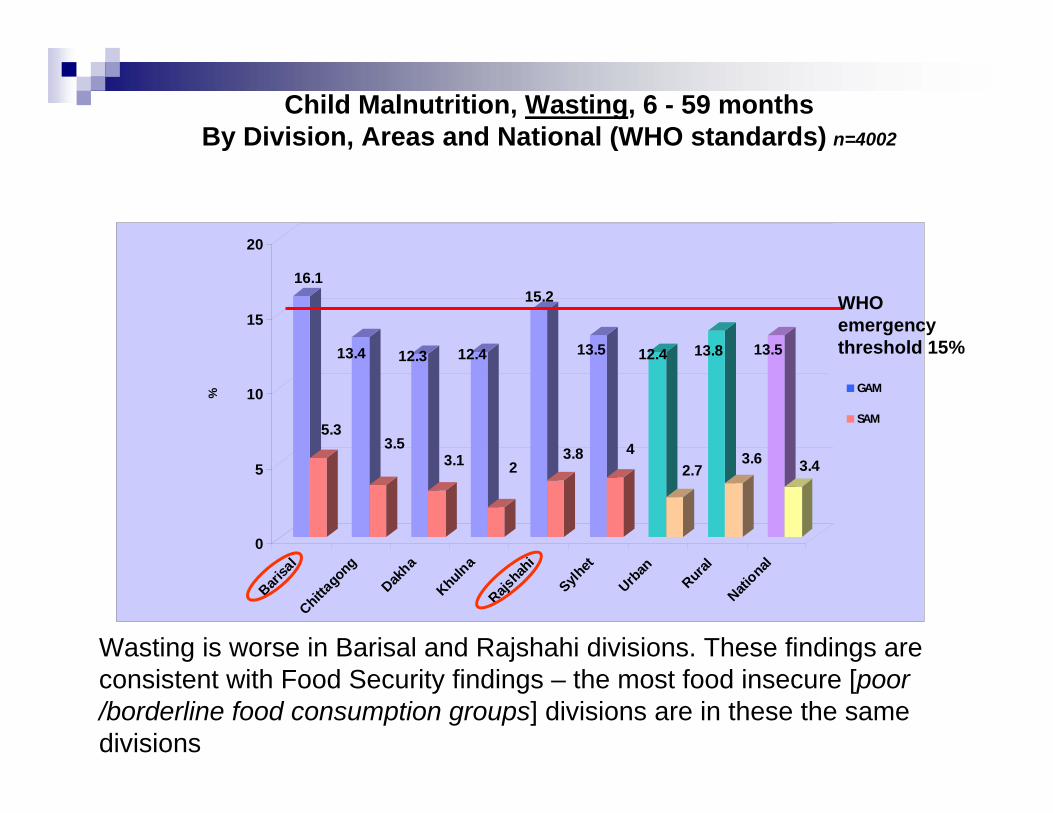
Child Malnutrition, Wasting, 6 - 59 monthsBy Division, Areas and National (WHO standards) n=4002
16.1
5.3
13.4
3.5
12.3
3.1
12.4
2
15.2
3.8
13.5
4
12.4
2.7
13.8
3.6
13.5
3.4
0
5
10
15
20
%
Barisa
lChitta
gong
Dakha
KhulnaRajs
hahi
Sylhet
Urban
RuralNati
onal
GAM
SAM
WHO emergency threshold 15%
Wasting is worse in Barisal and Rajshahi divisions. These findings are consistent with Food Security findings – the most food insecure [poor /borderline food consumption groups] divisions are in these the same divisions

Child Malnutrition, Wasting, 6 - 59 months, by Age Group (WHO standards) n=4002
19.5
7.2
16.1
5.5
11.8
3.7
11.8
2.1
12.1
1.3
0
5
10
15
20
(6-11) (12-23) (24-35) (36-47) (48-60)
GlobalSevere
WHO emergency threshold 15%
More children aged 6-23 months are malnourished than children aged 24-59 months and this is closely linked to the poor feeding practices.

Child Malnutrition, Stunting, 6 - 59 monthsBy Division, Areas and National (WHO standards) n=3931
49.4 49.6 51.3
40.1 44.2
56.6
45.450.4
48.6
0
10
20
30
40
50
60
70
80%
Barisal
Chittagong
Dhaka
Khulna
Rajshah
i
SylhetUrban
Rural
National
WHO threshold 40%
Overall, stunting remains high across all divisions. Sylhet has the highest stunting rate while Dhaka, Barisal and CHT are higher than the national average. Sylhet has a high increase of food expenditures and it is also one of the divisions affected by price transmissions.

42.3 41.736.9
29.633.8
42.834.3 38.3 37.4
0
10
20
30
40
50
60
70
80
%
Barisal
Chittag
ong
Dhaka
KhulnaRajsha
hi
Sylhet
Urban
Rural
Nationa
l
Child Malnutrition, Underweight, 6 - 59 monthsBy Division, Areas and National (WHO standards) n=4175
WHO threshold 30%
Levels of underweight are all above the 30% WHO threshold with exception of Khulna division. Barisal and Sylhet have shown high rates of underweight which are consistent with the food security situation in those two divisions

National Estimates:Child Malnutrition, Wasting, 2005 - 2009 (WHO standards)
14.5
2.9
17.4
2.9
13.5
3.4
0
2
4
6
8
10
12
14
16
18
2005 CMNS 2007 BDHS 2009 HFSNA
GAMSAM
WHO emergency threshold 15%
Levels of acute malnutrition has decreased – compared to BDHS 2007. However, since this survey was conducted during the best period of the year, GAM rate of 13.5% (which is just below the emergency threshold) indicates a serious nutritional situation.

National Estimates:Child Malnutrition, Stunting
2005 - 2009 (WHO standards)
46.2
19
43.2
16.1
48.6
20.1
05
101520253035404550
CMNS 2005 BDHS 2007 HFSNA 2009
GlobalSevere
WHO threshold 40%
Stunting levels have increased – but remain stable in comparison to 2005. This is in harmony with the analysis of the food consumption groups and dietary intake

National Estimates:Child Malnutrition, Underweight
2005 - 2009 (WHO standards)
39.9
10.9
41
11.8
37.4
12.3
05
1015202530354045
CMNS 2005 BDHS 2007 HFSNA 2009
GlobalSevere
WHO threshold 30%
Underweight has decreased a little, but it still remains above the WHO thresholds – however, survey conducted during the harvest season, thus this explains the “improvement”

Infant & Young Child Feeding Practices Exclusive Breastfeeding 0- 6 Months, by Age and Area
Poor infant and young child feeding practices with limited practice of exclusive breastfeeding to 6 months
61.4
49 51.941.2
48.5 47.343.3
46.6 45.950 48 48.6
010203040506070
0-1.9 mths 2-3.9 mths 4-5.9 mths Total: 0-5.9mths
UrbanRuralNational

Infant & Young Child Feeding PracticesPercentage of children 6 - 23.9 months that received a minimum diet diversity
Min. 4 food groups/day from 7 different food groups
23.626.237.344.2
33.729.839.4
31.933.5
0
10
20
30
40
50
Barisa
lDha
kaRajs
hahi
Urban
Nation
al
Over 60% of the children age 6-24 months did not received theminimum diet of at least 4 food groups a day

42,8 47,853,5
65,5
53,445,2
52,7 52,1 52,2
0
10
20
30
40
50
60
70
Barisa
lChitta
gong
Dhaka
Khulna
Rajshahi
Sylhet
Urban
RuralNatio
nal
Percentage of children 6-24 months that received a minimum meal frequency
About 50% of the children 6-24 months did not receive a minimum meal frequency - Barisal, Chittagong and Sylhet are the worst.

Maternal Nutrition

Stunting is closely correlated with poor maternal nutrition status
(Note: Maternal nutrition status based on low MUAC of <221 mm)
Prevalence of Stunting among Children by Mother's Nutritional Status
46.00%53.00%
0%
20%
40%
60%
80%
100%
Malnourished Not malnourishedMother

15.30%11.70%
39%35.90%
0.00%
5.00%
10.00%
15.00%
20.00%
25.00%
30.00%
35.00%
40.00%
% m
alnu
triti
on
Wasting Underw eight
Prevalence of Wasting and Underweight among Children by Children's Health
SickNo sick
Both wasted and underweight children are more likely to be illness than stunted children.
Maternal Nutrition
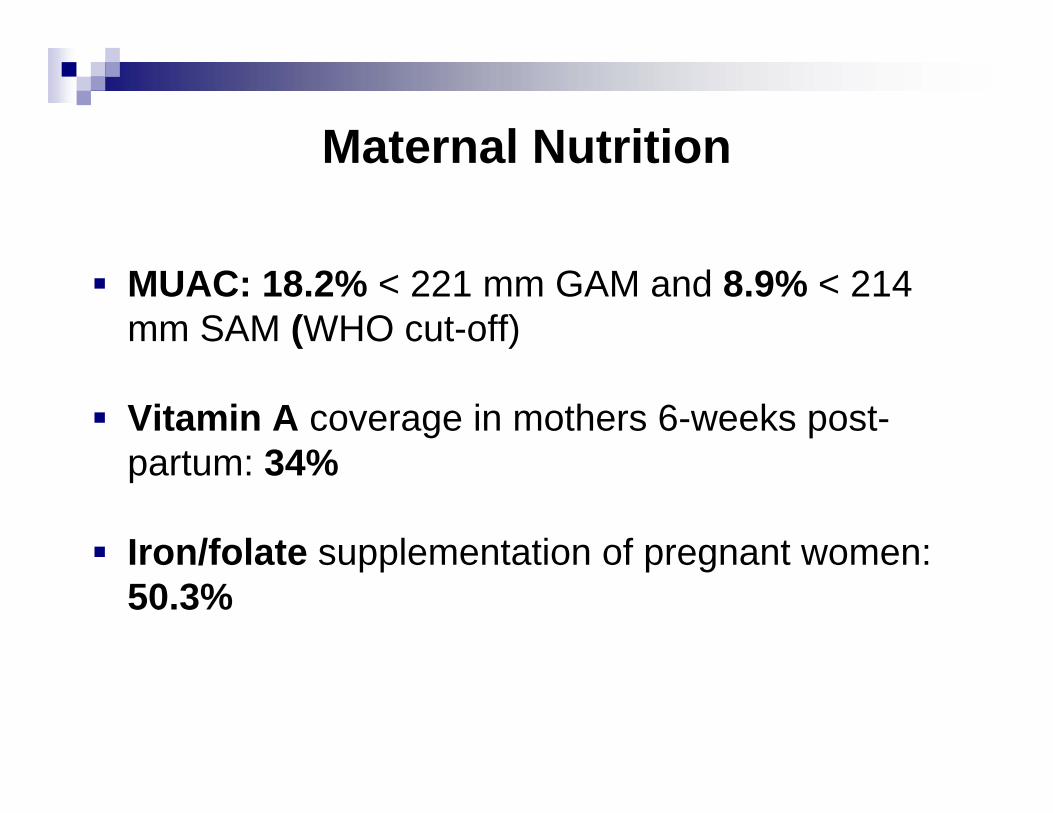
MUAC: 18.2% < 221 mm GAM and 8.9% < 214 mm SAM (WHO cut-off)
Vitamin A coverage in mothers 6-weeks post-partum: 34%
Iron/folate supplementation of pregnant women: 50.3%

Morbidity, Mortality, Water and Sanitation

Child Health
•48.6% of children were ill in the 2-weeks before the survey (49% rural, 47.5% urban)
•85% of children were brought to health facilities. Lack of money was the major reason (45.5%) for those children not brought for health care.

General Health: (household)
•50.8% reported illness in the previous 2-weeks (51.1% rural, 50% urban)
•85% of the households surveyed sought healthcare treatment. Of those that did not, 65.6% stated that lack of money was the major reason.
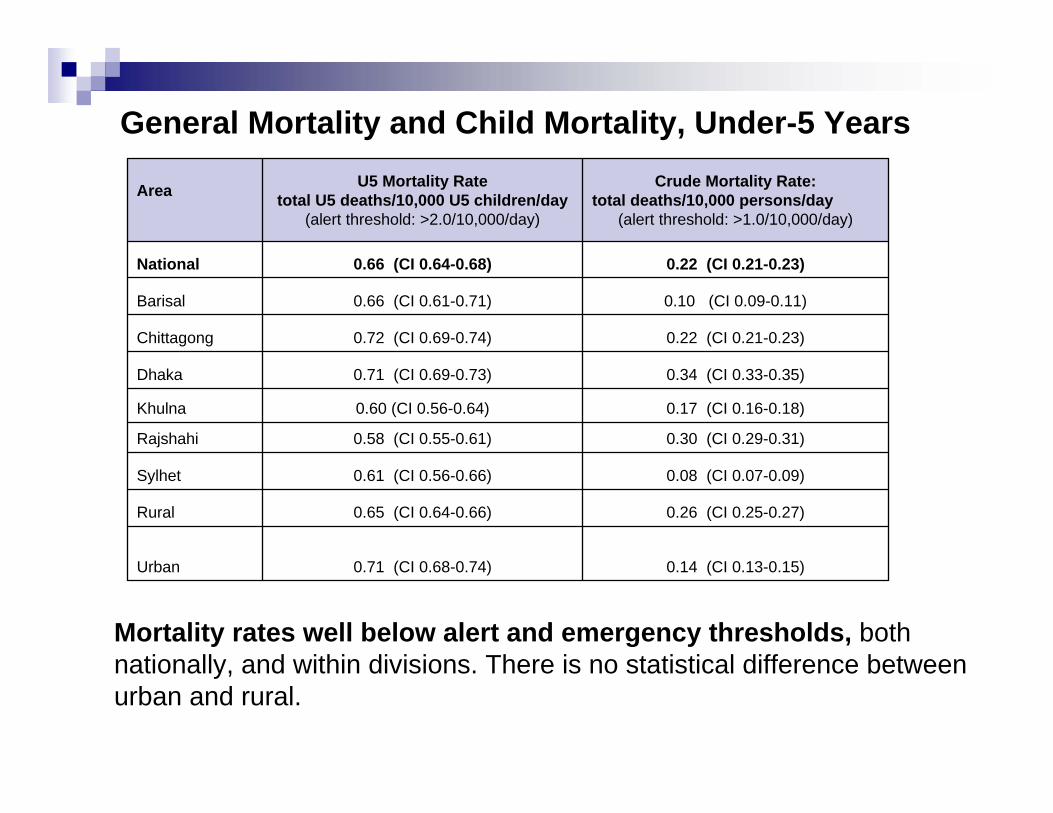
General Mortality and Child Mortality, Under-5 Years
Mortality rates well below alert and emergency thresholds, both nationally, and within divisions. There is no statistical difference between urban and rural.
0.71 (CI 0.68-0.74)
0.65 (CI 0.64-0.66)
0.61 (CI 0.56-0.66)
0.58 (CI 0.55-0.61)
0.60 (CI 0.56-0.64)
0.71 (CI 0.69-0.73)
0.72 (CI 0.69-0.74)
0.66 (CI 0.61-0.71)
0.66 (CI 0.64-0.68)
U5 Mortality Ratetotal U5 deaths/10,000 U5 children/day
(alert threshold: >2.0/10,000/day)
0.14 (CI 0.13-0.15)Urban
0.26 (CI 0.25-0.27)Rural
0.08 (CI 0.07-0.09)Sylhet
0.30 (CI 0.29-0.31)Rajshahi
0.17 (CI 0.16-0.18)Khulna
0.34 (CI 0.33-0.35)Dhaka
0.22 (CI 0.21-0.23)Chittagong
0.10 (CI 0.09-0.11)Barisal
0.22 (CI 0.21-0.23)National
Crude Mortality Rate:total deaths/10,000 persons/day
(alert threshold: >1.0/10,000/day)
Area

Percent of households with safe sources of drinking water
89.3% of the population have as a main source of drinking water, a tubewell or borehole at the moment of the survey, but only 7.5% of households treat their drinking water at the moment (no change from 12 months ago)
97.5
2.5
94.9
5.1
93.6
6.4
88.6
11.4
98.9
1.1
94.1
5.9
94.8
5.20%
20%
40%
60%
80%
100%
Barisal Chittagong Dhaka Khulna Rajshahi Sylhet National
SafeUnsafe

Sanitation
010203040506070
Barisa
lChitta
gong
Dakha
Khulna
Rajshahi
Sylhet
Urban
RuralTota
l
Type of toilet facility in Bangladesh by division and by area
ImprovedUnimprovedOpen SpaceOthers
51.4% of the population used an improved toilet facility, usage of improved latrine more in urban area compared to rural area

3.5. Malnutrition and Household Food Security
Linkages

FOOD SECURITY and NUTRITION LINKAGES
Statistical Linkages (Significant)
Children within households with Poor and borderline household food consumption scores are more likely to be malnourished (wasting, stunting, underweight).
Household with high percent share of food expenditures were more likely to have malnourished children (wasting, stunting, underweight)
Households having higher Coping Strategy Index (CSI) scores are more likely to have malnourished children (wasting, stunting, underweight)
Households with seasonal or irregular income (agriculture wage, non-agriculture wage and casual work) are more likely to have malnourished children (stunting / underweight)

4. Conclusions

Household Food Security and MarketsTrade barriers were a major contributing factor re: food price rise.Food traders identify main constraints; low capital for investment in food storage facilities. Households heavy reliance on debt to cope with food access problems.Households spent a greater percent of their total expenditures on foodHouseholds compromise health care expenditures to cope; implications for MDGs etc.Social protection and Social Safety Net expansion needs to be faster, more agile, and better targeted

Nutrition, Health, Water and SanitationOverall, wasting and underweight levels remains high while there is a slight increase in stunting levels
The youngest children present higher rates malnutrition, especially acute malnutrition
Diet quality does not meet acceptable levels for children, thus young children less than two years of age do not eat the minimum acceptable diet.
Child malnutrition is strongly associated with the two main indicators for food security (i.e. children from poor and border line food consumption groups or/and from households with increase % of expenditure on food are more likely to be malnourished)
Prevalence of illness among other household member and among children under five year old is high. Lack of money is an important reason for not seeking medical care, while fever, respiratory illness and diarrhoea are significantly associated with acute malnutrition (wasting)
Mortality rates remain below alert and emergency thresholds
Overall, water and sanitation indicators are stable but quality of water and water treatment not necessarily good.

5. Recommendations

Recommendations1. Enhance the efficiency and effectiveness of the Social
Safety Net system; expand coverage in areas of high malnutrition and food insecurity.
2. Targeted supplementary feeding w/ micronutrients for vulnerable groups, Children Under 5’s, Under 2’s, Pregnant and/or Lactating Women
3. Cash interventions when food abundant, accounting for seasonality, and market availability; otherwise targeted food assistance.
4. Support investment in food marketing and storage infrastructure, e.g. warehouses for larger stocks.
5. Promote open trade policies within region, avoid policies that result in trade barriers.

Recommendations6. Invest more and build on existing information systems for monitoring and
surveillance, early warning for early actions
7. Address the large numbers of acutely malnourished children with management of acute malnutrition at both facility and community levels
8. Improve optimal infant and young child feeding -emphasizing maternal and community participation
9. Emphasize micronutrient-enriched foods and diet diversity in food assistance interventions, food security and nutritional programmes
10. Strengthen health and hygiene promotion to prevent and treat diarrhoeal disease, respiratory infections and fever
11. Harmonized and develop and standardized national survey guidelines to enable data quality and comparability.