Embed Size (px)
Citation preview
MINISTRY OFAGRICULTURE, FISHERIES AND FOOD
Household Food Consumptionand Expenditure : 1 969
WITH PRELIMINARY ESTIMATES FOR 1970
Annual Report of the
National Food Survey Committee
r/wT DOCS. -LIBRARY
LONDON

MINISTRY OFAGRICULTURE, FISHERIES AND FOOD
Household Food Consumptionand Expenditure: 1969
WITH PRELIMINARY ESTIMATES FOR 1970
Annual Report of the
National Food Survey Committee
LONDON
HER MAJESTY'S STATIONERY OFFICE1971

SBN 11 240939 3

THE NATIONAL FOOD SURVEY COMMITTEE
L. Napolitan, C.B., M.Sc. (Econ.)
Ministry of Agriculture, Fisheries and Food, Chairman
M. A. Abrams, Ph.D. (Econ.)
Director, Survey Research Unit, Social Science Research Council
A. H. J. Baines, M.A.Ministry of Agriculture, Fisheries and Food
W. T. C. Berry, M.A., M.D., D.T.M. & H.
Department of Health and Social Security
C. J. Brown, M.A.
Professor J. A. C. Brown, M.A.
University of Oxford
J. A. Heady, M.A., Ph.D.
Medical Research Council
Dorothy F. Hollingsworth, O.B.E., B.Sc, F.R.I.C, F.I.Biol., F.I.F.S.T.,
S.R.D.
Director, The British Nutrition Foundation Ltd
Professor J. H. Kirk, C.B.E., M.A.
Wye College, University of London
Professor W. J. Thomas, M.Sc.
Agricultural Economics Department, University of Manchester
Elspeth M. Warwick, M.B., Ch.B., D.P.H.
Scottish Home and Health Department
Secretaries
S. Clayton
Ministry of Agriculture, Fisheries and Food
J. P. Greaves, M.A., Ph.D., M.I.Biol., A.I.F.S.T.
Ministry of Agriculture, Fisheries and Food
in

Preface
The National Food Survey started in 1940 and this annual report is the twentiethto be published on the results which have emerged. The thirty years of the enquiryhave been a period of continuous change; the contrast between the wartime andearly post-war years of food rationing and the present day is very marked. Theproportion of consumers' total expenditure spent on food has fallen from 30 per
cent just before the war to 24 per cent thirty years later. The supermarket is nowcommonplace, convenience foods have assumed an entirely new significance,and poultry meat is no longer a luxury food.
Over the years the Survey has provided an unparalleled body of informationon food consumption patterns. It records the differences that exist between
income groups, between families of different size, and between regions. Thisinformation is of continuing value to nutritionists, business men, economists,policy-makers and their advisers, and not least to the general public.
In the present report will be found the same wide range of data as in previousannual reports. The opportunity has, however, been taken to regroup the text
and the appendices in a more coherent manner, and it is hoped that this willprove convenient to the reader.
A special feature of the Survey in 1969 was the inclusion of questions aboutthe types of shop used by housewives for their main food purchases, and Chapter4 of the Report is devoted to an analysis of the results obtained. Also of interestto the food industry are the tables included in Appendix B which show changes
in the income elasticities of demand for different foods since 1955. ThisAppendix also includes a table giving new estimates of the price elasticities ofdemand for a number of foods.
The estimates of the average energy value and nutrient content of the diet invarious types of household are again compared with the recommendations ofintake made by the Department of Health and Social Security. Estimates are
also given of the concentration of nutrients in relationship to the energy valueof average diets of various groups of households.
The results of the Survey continue to be published in the Monthly Digest ofStatistics in summary form as soon as they become available for all households,income groups and types of family. Estimates of consumption for all householdsare also published each quarter in Trade and Industry, together with some nutritional data. Applications for unpublished analyses should be addressed tothe National Food Survey Branch of the Ministry of Agriculture, Fisheries andFood, Tolcarne Drive, Pinner, Middlesex HA5 2DT.
The Committee again wishes to record its indebtedness to the many housewives who have so generously given of their time to provide records of theirfood purchases. The Committee is also grateful to its secretaries and to the
staffs of the Ministry of Agriculture, Fisheries and Food, the Social SurveyDivision of the Office of Population Censuses and Surveys and the British MarketResearch Bureau Ltd who have contributed to the work of the Survey.
Leonard Napolitan,June, 1971 Chairman, National Food Survey Committee

Contents
Part I Paragraphs
Chapter 1 Introduction and Summary1.1 Personal Income, Expenditure and Retail Prices in 1969 . 1-2
1.2 Summary of Survey Results for 1969 3-10
Chapter 2 Household Food Consumption and Expenditure :
National Averages2.1 General Levels of Food Consumption, Expenditure and
Prices 11-15
2.2 Individual Foods : Consumption Trends .... 16-43
Chapter 3 Household Food Consumption and Expenditure:Geographical, Income Group and Family CompositionDifferences
3.1 Introduction 44
3.2 Geographical Differences3.2.1 Classification Used 45-463.2.2 Main Results in 1969 47-53
3.3 Income Group Differences3.3.1 Classification Used 543.3.2 Main Results in 1969 55-57
3.4 Household Composition Differences3.4.1 Classification Used 58
3.4.2 Main Results in 1969 59-62
3.5 Family Composition Differences within Income Groups3.5.1 Classification Used 63
3.5.2 Main Results in 1969 64-67
3.6 Household Food Consumption and Expenditure according toAge of Housewife, and Broad Socio-economic Grouping, 1969 68-73
Chapter 4 Types of Shop Used by Housewives for their Main FoodPurchases in 1969
4.1 Introduction 74
4.2 Type of Shop Used by Housewives 75-81
4.3 Food Expenditure and Average Prices Paid by Householdsclassified according to Type of Shop used for their MainFood Purchases 82
Chapter 5 Energy Value and Nutrient Content of Household FoodConsumption
5.1 Introduction 83-87
5.2 National Averages 88-92
5.3 Geographical Differences 93-95
5.4 Income Group Differences 96-97
5.5 Household Composition Differences 98-99
5.6 Family Composition Differences within Income Groups . 100-101
5.7 Differences associated with Age of Housewife and BroadSocio-economic Grouping 102-103
Chapter 6 Preliminary Estimates of Household Food Consumption, Expenditure and Prices in 1970 . 104-117
vii

INDEX TO TABLES
Part ITable 1
Table 2
Table 3
Table 4
Chart
Table 5
Changes in Earnings, Prices and Consumers' Expenditure, 1964-1969
Household Food Expenditure and Total Value of Foodobtained for Household Consumption, 1968 and 1969
Percentage Changes in Average Expenditure, FoodPrices and Real Value of Food Purchased ; Quartersof 1969 Compared with Corresponding Quarters of1968
Indices of Expenditure, Prices and Real Value of FoodPurchased for Household Consumption, 1964-1969 .
Energy Value and Nutrient Content of Household FoodConsumption, according to Age of Housewife andBroad Socio-economic Groupings, 1969 .
Household Food Expenditure, 1968, 1969 and 1970
Page
2
6
6
7
36-3940
Part II(Tables of average consumption, expenditure or prices relating to all
households in the National Food Survey sample 1969)
Table 6 Indices of Expenditure on Main Food Groups, 1964-1969
Table 7 Indices of Prices for Main Food Groups, 1964-1969
Table 8 Indices of Real Value of Purchases of Main FoodGroups, 1964-1969
Table 9 Household Food Consumption and Purchases: NationalAverages, 1969 .......
Table 10 Household Food Expenditure: National Averages, 1969
Table 11 Household Food Prices: National Averages, 1969
Table 12 Percentage of All Households Purchasing SeasonalTypes of Food During Survey Week, 1969
(Tables relating to geographical differences in average consumption,
expenditure or prices)
Table 13 Household Food Expenditure, Value of Consumptionand Price Indices according to Region and Type ofArea, 1969
Table 14 Geographical Variations in Household Consumption ofthe Main Food Groups, 1969
Table 15 Household Food Consumption according to Regionand Type of Area, 1969. .....
46
47
48
49-5152-5455-58
59
62
63-65
66-71
(Tables relating to income group differences in average consumption,
expenditure or prices)
Table 16 Household Food Expenditure, Value of Consumptionand Price Indices according to Income Group, 1969. 74
Table 17 Household Food Consumption according to IncomeGroup, 1969 75-77
Table 18 Household Food Expenditure according to IncomeGroup, 1969 78-80
viii
(Tables relating to household composition differences in average
consumption, expenditure or prices)
Table 19 Household Food Expenditure, Value of Consumptionand Price Indices according to Household Composition, 1969 82
Table 20 Household Food Consumption according to HouseholdComposition, 1969 83-85
Table 21 Household Food Expenditure according to HouseholdComposition, 1969 86-88
(Tables relating to differences in average consumption and expenditurein certain household composition groups within income groups)
Table 22 Household Food Consumption by certain HouseholdComposition Groups within Income Groups, 1969 . 90-93
Table 23 Household Food Expenditure and Average DeclaredNet Family Income of Certain Household Composition Groups within Income Groups, 1969 . . 94
(Tables relating to differences in average consumption and expendi
ture in households classified according to age of housewife and broadsocio-economic grouping)
Table 24 Classification of Households according to Age ofHousewife and Broad Socio-economic Grouping,1969 96
Table 25 Household Food Consumption according to Age ofHousewife and Broad Socio-economic Grouping,1969 97-98
Table 26 Household Food Expenditure according to Age ofHousewife and Broad Socio-economic Grouping, 1969 99-101
(Tables relating to the types of shop used by housewives for most oftheir purchases)
Table 27 Type of Shop used by Households in each Region and
Type of Area for most of their Purchases, 1969 . 105
Table 28 Type of Shop used by Households of each IncomeGroup for most of their Purchases, 1969 . . . 106
Table 29 Type of Shop used by Households of Different Composition for most of their Purchases, 1969 107
Table 30 Average Expenditure on different kinds of Meat andAverage Prices paid by Housewives, classified
according to Type of Shop in which they bought mostof their Fresh Meat during the week of survey . 108
Table 31 Average Expenditure on different kinds of FreshFruit, and Average Prices paid by Housewives,classified according to Type of Shop in which they
bought most of their Fresh Fruit during the week
of survey 109
Table 32 Average Expenditure on different kinds of Fresh
Vegetables, and Average Prices paid by Housewives,
classified according to Type of Shop in which they
bought most of their Fresh Vegetables during the
week of survey 110-111
ix
Table 33 Average Expenditure on different kinds of Groceries,
and Average Prices paid by Housewives, classified
according to Type of Shop in which they boughtmost of their Groceries during the week of survey . 1 12
{Tables of average energy value and nutrient content of the diet)
Table 34 Energy Value and Nutrient Content of Household FoodConsumption: National Averages, 1964-1969 . . 114
Table 35 Contributions made by Groups of Foods to the EnergyValue and Nutrient Content of Household FoodConsumption: National Averages, 1969 . . 115-118
Table 36 Geographical Variations in Energy Value and NutrientContent of Household Food Consumption, 1969 . 119-120
Table 37 Energy Value and Nutrient Content of the HouseholdFood Consumption of Households in DifferentIncome Groups, 1969 121-122
Table 38 Energy Value and Nutrient Content of the HouseholdFood Consumption of Households of Different Com
position, 1969 123-124
Table 39 Energy Value and Nutrient Content of the HouseholdFood Consumption of Households of Different Com
position within Income Groups, 1969 . . . 125-127
Table 40 Energy Value and Nutrient Content of Household FoodConsumption according to Age of Housewife andbroad Socio-economic Grouping, 1969 . . . 128-129
(Tables of average consumption, expenditure, prices and nutrition
relating to all households in the National Food Survey sample, 1970)
Table 41 Household Food Consumption and Purchases : National
Averages, 1970 132-136
Table 42 Household Food Expenditure: National Averages, 1970 137-142
Table 43 Household Food Prices: National Averages, 1970 . 143-146
Table 44 Percentage of All Households purchasing Seasonal
Types of Food during Survey Week, 1970 . . . 147
Table 45 Energy Value and Nutrient Content of Household FoodConsumption: National Averages, 1969 and 1970 . 148
Appendices
A
BC
Methodology of the National Food Survey, and Com
position of the Sample in 1969
Income Elasticities of Demand, 1969 .
Estimates of National Supplies of Food Moving into
Consumption ......Glossary of Terms used in the Survey
Index
149
176
190
192
197

PARTI

Chapter 1
INTRODUCTION AND SUMMARY
/./ Personal Income, Expenditure and Retail Prices in 1969
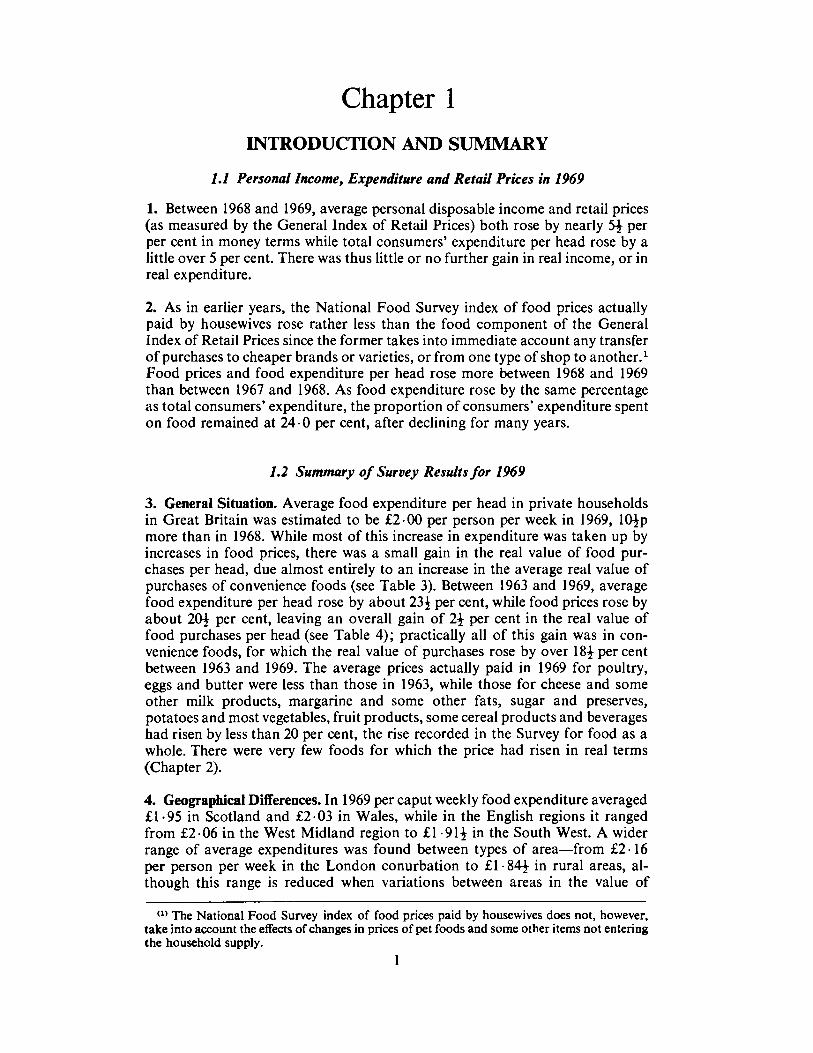
1. Between 1968 and 1969, average personal disposable income and retail prices
(as measured by the General Index of Retail Prices) both rose by nearly 5£ per
per cent in money terms while total consumers' expenditure per head rose by a
little over 5 per cent. There was thus little or no further gain in real income, or inreal expenditure.
2. As in earlier years, the National Food Survey index of food prices actuallypaid by housewives rose rather less than the food component of the GeneralIndex of Retail Prices since the former takes into immediate account any transferof purchases to cheaper brands or varieties, or from one type of shop to another.1
Food prices and food expenditure per head rose more between 1968 and 1969
than between 1967 and 1968. As food expenditure rose by the same percentage
as total consumers' expenditure, the proportion of consumers' expenditure spent
on food remained at 24 ■0 per cent, after declining for many years.
1.2 Summary of Survey Results for 1969
3. General Situation. Average food expenditure per head in private householdsin Great Britain was estimated to be £2 00 per person per week in 1969, 10^p
more than in 1968. While most of this increase in expenditure was taken up by
increases in food prices, there was a small gain in the real value of food purchases per head, due almost entirely to an increase in the average real value ofpurchases of convenience foods (see Table 3). Between 1963 and 1969, average
food expenditure per head rose by about 23£ per cent, while food prices rose byabout 20i per cent, leaving an overall gain of 2\ per cent in the real value offood purchases per head (see Table 4); practically all of this gain was in convenience foods, for which the real value of purchases rose by over 18£ per centbetween 1963 and 1969. The average prices actually paid in 1969 for poultry,eggs and butter were less than those in 1963, while those for cheese and some
other milk products, margarine and some other fats, sugar and preserves,
potatoes and most vegetables, fruit products, some cereal products and beverages
had risen by less than 20 per cent, the rise recorded in the Survey for food as a
whole. There were very few foods for which the price had risen in real terms
(Chapter 2).
4. Geographical Differences. In 1969 per caput weekly food expenditure averaged
£1-95 in Scotland and £2 03 in Wales, while in the English regions it rangedfrom £2 06 in the West Midland region to £1 -91$ in the South West. A wider
range of average expenditures was found between types of area —from £2-16per person per week in the London conurbation to £1 •
84^ in rural areas, al
though this range is reduced when variations between areas in the value of
(1) The National Food Survey index of food prices paid by housewives does not, however,
take into account the effects of changes in prices of pet foods and some other items not entering
the household supply.
1
Household Food Consumption and Expenditure: 1969
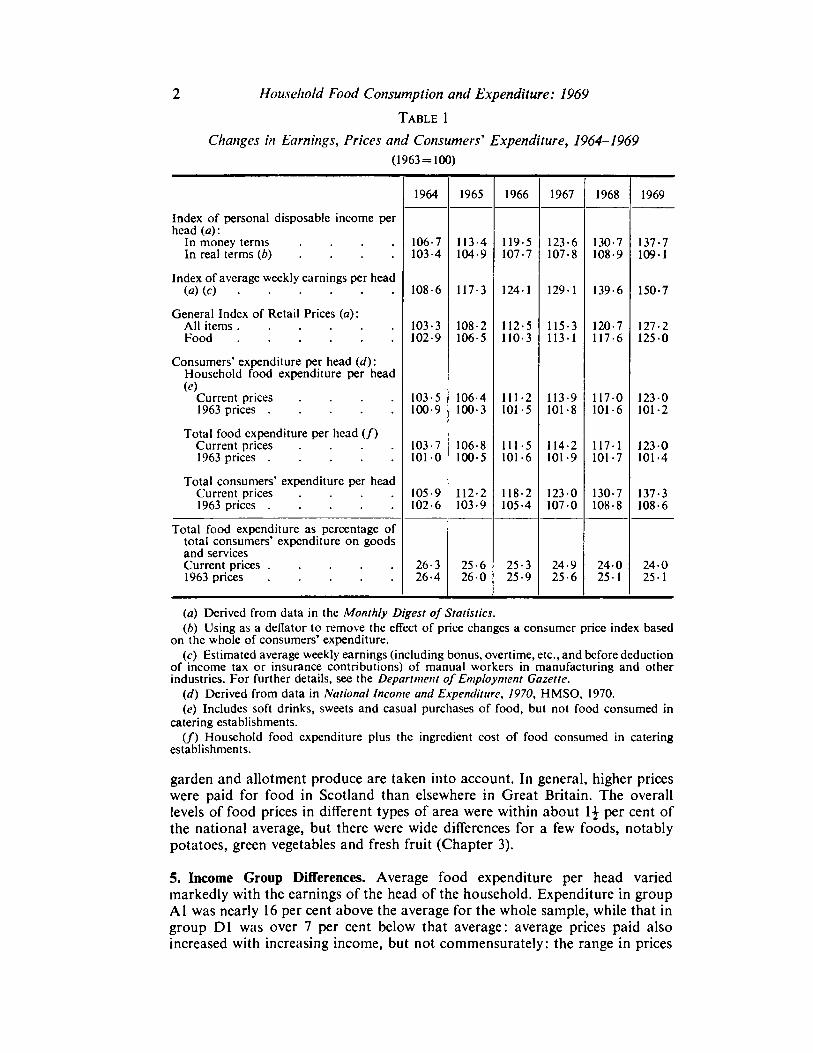
Table 1
Changes in Earnings, Prices and Consumers'1 Expenditure, 1964-1969
(1963=100)
Index of personal disposable income perhead (a) :
In money terms ....In real terms (b)
Index of average weekly earnings per head
(a) to
General Index of Retail Prices (a):All itemsFood
Consumers' expenditure per head (rf) :
Household food expenditure per head
toCurrent prices ....1963 prices
Total food expenditure per head (/)Current prices ....1963 prices
Total consumers' expenditure per headCurrent prices ....1963 prices
Total food expenditure as percentage oftotal consumers' expenditure on goodsand servicesCurrent prices1963 prices
1964
106-7103-4
108-6
103-3102-9
103-5100-9
103-7101-0
105-9102-6
1965
113-4104-9
117-3
108-2106-5
106-4100-3
106-8100-5
112-2103-9
1966
119-5107-7
124-1
112-5110-3
111-2101-5
111-5101-6
118-2105-4
1967
123-6107-8
129-1
115-3113-1
113-9101-8
114-2101-9
1230107-0
1968
130-7108-9
139-6
120-7117-6
1170101-6
1171101-7
130-7108-8
1969
137-71091
150-7
127-2125 0
1230101-2
1230101-4
137-3108-6
26-326-4
25-6260
25-325-9
24-925-6
24025-1
24025-1
(a) Derived from data in the Monthly Digest of Statistics.
(b) Using as a deflator to remove the effect of price changes a consumer price index basedon the whole of consumers' expenditure.
to Estimated average weekly earnings (including bonus, overtime, etc., and before deductionof income tax or insurance contributions) of manual workers in manufacturing and otherindustries. For further details, see the Department of Employment Gazette.
(d) Derived from data in National Income and Expenditure, 1970, HMSO, 1970.
to Includes soft drinks, sweets and casual purchases of food, but not food consumed incatering establishments.
(/) Household food expenditure plus the ingredient cost of food consumed in cateringestablishments.
garden and allotment produce are taken into account. In general, higher priceswere paid for food in Scotland than elsewhere in Great Britain. The overalllevels of food prices in different types of area were within about 1^ per cent ofthe national average, but there were wide differences for a few foods, notablypotatoes, green vegetables and fresh fruit (Chapter 3).
5. Income Group Differences. Average food expenditure per head variedmarkedly with the earnings of the head of the household. Expenditure in groupAl was nearly 16 per cent above the average for the whole sample, while that ingroup Dl was over 7 per cent below that average: average prices paid alsoincreased with increasing income, but not commensurately: the range in prices
Introduction and Summary 3
was 1 1 per cent between the highest and lowest income groups, but only 5 percent if group Al is excluded (Chapter 3). s
6. Household Composition Differences. Weekly food expenditure varied considerably between types of household and, in 1969, ranged from £1-39 per head
in families with four or more children (£9 03^ for the family) to £2-69 per head
for younger childless couples (£5 •37-J per household). In contrast to this rangeof over 90 per cent, the general level of prices paid for food showed a corresponding range of less than 8 per cent, mainly caused by differences in prices paid formeat and meat products, fruit and vegetables and cereal products. The large
range in average expenditure is thus partly due to differences in prices, butmainly due to adults having greater physiological requirements than children,although differences in economic circumstances also contributed to the disparity.As in previous years, when income as well as family composition is taken intoaccount, the averages for food expenditure per head show much greater variationbetween family-size groups within each income range than between incomegroups within each family-size group. The wide range of differences in per caputconsumption of each of the main foods between the smallest families and the
largest persists within each income group. An analysis of household food consumption and expenditure according to age of housewife and broad socioeconomic grouping indicates that household food consumption is affected moreby the size of the household and the age of its members than by the broadsocio-economic grouping (Chapter 3).
7. Types of shop used by housewives for their main food purchases. According toinformation provided by housewives about the shops in which they bought theirfood, the type of shop used for their main food purchases depended more on the
facilities available locally than on the income and family characteristics of the
household. Moreover, these household characteristics appear to have moreinfluence than choice of shop on the level of food expenditure and on the
average prices paid for food (Chapter 4).
8. Energy Value and Nutrient Content. The average per caput daily energy valueof the food obtained for consumption in private households in Great Britain in1969 was 2570 kcal (10-8 MJ),(1) similar to that in recent years, and 9 per cent
greater than the recommended intake. The nutrient content of the average diethas likewise shown little change ; more details are shown than in previous Reportsfor vitamin A and nicotinic acid. Estimates of average nutrient intake exceeded
the recommendations for all nutrients except vitamin D, but the Survey does
not record the vitamin D obtained from welfare and pharmaceutical sources.
Regional variations were less pronounced for nutrient intake than for patternsof food consumption. These variations, and those associated with income,family size, age of housewife and socio-economic status, are similar to those
reported for 1968. These observations do not preclude the existence of over-consumption of food in some individual families, or of under-consumption ordietary imbalance in others, but they are nevertheless consistent with the findingsto date of the individual medical and dietary studies conducted under the aegis
of the Department of Health and Social Security in indicating that there is littleunder-nutrition in Britain. They are equally consistent with the view that the
<" 1000 kilocalories (kcal)=4- 184 megajoules (MJ).
4 Household Food Consumption and Expenditure: 1969
major manifestation of poor nutrition in this country is an excessive energyintake in relation to requirements, leading to overweight in some people(Chapter 5).
9. Preliminary Estimates of Household Food Consumption, Expenditure and
Prices in 1970. Average household expenditure on food rose from £2 00 perperson per week in 1969 to £2- 11 in 1970. Of this increase of lip in per caputexpenditure, over 9^p can be attributed to the effects of increases in the generallevel of food prices and just under l|p to an increase in the real value of foodpurchases. Changes in the nutrient content of the average household dietbetween 1969 and 1970 were small (Chapter 6).
10. Elasticities of Demand. Estimates of the income elasticities of expenditureon food and quantities purchased are given in Appendix B, together with comparative results for earlier years. The income elasticity of household foodexpenditure per head was estimated to be 0-20 in 1969, compared with 0-25 in1960 and 0-30 in 1955. The appendix also contains estimates of the own-priceelasticities of demand for certain foods, calculated from Survey data fromJanuary 1964 to December 1969 (Appendix B).
vr
Chapter 2
HOUSEHOLD FOOD CONSUMPTION ANDEXPENDITURE: NATIONAL AVERAGES
2.1 General Levels of Food Consumption, Expenditure and Prices
11. The estimates of food expenditure and consumption from the NationalFood Survey relate to food obtained for consumption in the home, and there
fore exclude meals and other food taken elsewhere/" The fieldwork of the
Survey does not extend over Christmas, and in 1969 records were obtained upto Friday, 19 December. In order to correct for some over-representation ofsmaller towns and semi-rural areas in the sample at the expense of larger townsand of Greater London, the national averages have, as usual, been calculatedas weighted averages of the results for each of the six main types of area(2), the
weights being proportionate to the respective populations. Subject to these
qualifications, average food expenditure per head in private households inGreat Britain was estimated to be £2 00 per person per week in 1969, lOJp(5 •5 per cent) greater than in 1968, the increase being apportioned amongst the
main food groups as follows:- liquid milk (lp) meat and meat products (3^p),
eggs 0£p), potatoes (lp), other vegetables and vegetable products (lp), fruit (lp),bread (jrp), other cereals and cereal products (lp), all other food (Hp). Thevalue attributed to garden and other supplies obtained without payment*2'
averaged 4£p per person per week, ^p more than in 1968, and when this value isadded to the amount spent on food, the total value of food obtained for house
hold consumption averaged £2 04^ per person per week, 5-6 per cent morethan in 1968. The rate of increase in food expenditure in each quarter of 1969
compared with corresponding quarters of 1968 varied between 4-3 per cent and6-7 per cent, compared with increases ranging from 2 - 3 to 2-9 per cent between
corresponding quarters of 1968 and 1967.
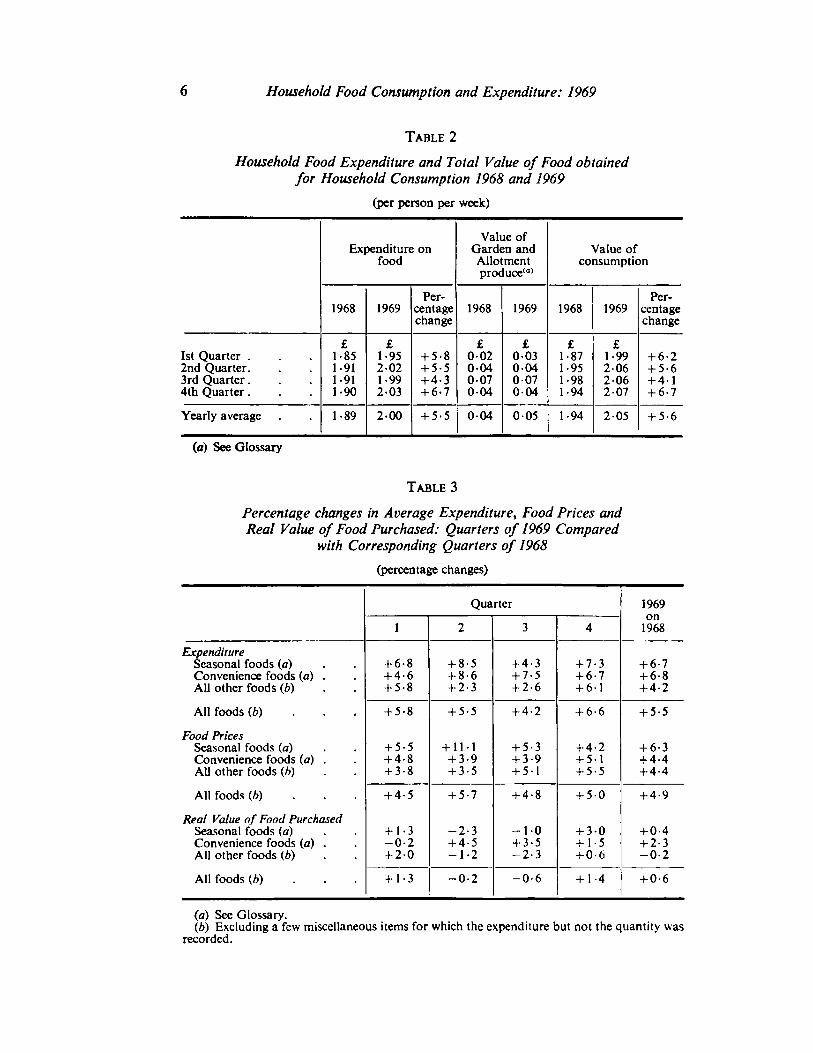
12. The changes in food expenditure shown in Table 2 can be explained partlyby changes in food prices and partly by changes in the "quantity" (value at
constant prices, not necessarily physical quantity) of food purchases. In Table 3,
an attempt has been made to apportion the change in expenditure between these
two factors; for this purpose an index of food prices paid by housewives has been
compiled from the Survey data, and this index has been used to deflate the indexof expenditure and thereby obtain a measure of the relative change in the
overall quantity of food purchases*3'. Thus food prices rose by 4-9 per cent,
compared with the rise of 5 •5 per cent in average food expenditure and there
For further details see the general note in the Glossary. Br., id estimates of overall foodsupplies moving into consumption in the United Kingdom, as measured at a primary stage ofdistribution, are reproduced in Appendix C.
(a) See Glossary.(3>Such an apportionment cannot, however, be precise owing to limitations in the price
index which arise because the classification of food items in the Survey cannot be infinitelydetailed. The average price paid for each item is obtained by dividing the total expenditure onthat item by the total quantity purchased; hence a shift in purchases from a cheaper to a dearervariety within the same food item (for example, to a higher grade of liquid milk, or to largereggs) is represented as an increase in the average price paid for that item and not as a rise inthe real value of purchases. This type of limitation does not arise when there is a shift in purchases from one item in the classification to another.
5
6 Household Food Consumption and Expenditure: 1969
Table 2
Household Food Expenditure and Total Value of Food obtained
for Household Consumption 1968 and 1969
(per person per week)
Expenditure onfood
Value ofGarden andAllotment
Value ofconsumption
Percentagechange
produce""
Percentagechange
1968 1969 1968 1969 1968 1969
1st Quarter .
2nd Quarter.3rd Quarter .
4th Quarter .
£1-851-911-911-90
£1952021-99203
+ 5-8+ 5-5+4-3+ 6-7
£002004007004
£003004007004
£1-871-951-981-94
£1 -99206206207
+ 6-2+ 5-6+ 4-1+ 6-7
Yearly average . 1-89 200 + 5-5 004 005 1-94 205 + 5-6
(a) See Glossary
Table 3
Percentage changes in Average Expenditure, Food Prices andReal Value of Food Purchased: Quarters of 1969 Compared
with Corresponding Quarters of 1968
(percentage changes)
Quarter 1969
on1968
ExpenditureSeasonal foods (a)Convenience foods (a) .
All other foods (b)
1 2 3 4
+ 6-8+ 4-6+ 5-8
+ 8-5+ 8-6+ 2-3
+4-3+7-5+ 2-6
+ 7-3+ 6-7+ 6-1
+ 6-7+ 6-8+ 4-2
All foods (b) + 5-8 + 5-5 +4-2 + 6-6 + 5-5
Food PricesSeasonal foods (a)Convenience foods (a) .
All other foods (b)
+ 5-5+4-8+ 3-8
+ 11-1+ 3-9+ 3-5
+ 5-3+ 3-9+ 5-1
+ 4-2+ 5-1+ 5-5
+ 6-3+ 4-4+ 4-4
All foods (6) + 4-5 + 5-7 + 4-8 + 5-0 + 4-9
Real Value of Food PurchasedSeasonal foods (a)Convenience foods (a) .
All other foods (6)
+ 1-3-0-2+ 20
-2-3+ 4-5-1-2
-10 + 3-0+ 1-5+0-6
+0-4+2-3-0-2
+ 3-5-23
All foods (6) + 1-3 -0-2 -0-6 + 1-4 + 0-6
(a) See Glossary.(b) Excluding a few miscellaneous items for which the expenditure but not the quantity was
recorded.
Household Food Consumption and Expenditure: National Averages
Table 4
Indices of Expenditure, Prices and Real Value of Food Purchased (a)
for Household Consumption, 1964-1969
(1963=100)
Expenditure Indices
1964 1965 1966 1967 1968 1969
Seasonal foods (a) . 98-9 103-8 110-3 112-2 1131 120-7Convenience foods (a) :
Canned .... 104-3 107-8 1151 121-5 122-9 129-3
Quick-frozen 1000 110-3 1391 139-7 161-7 196-4Other convenience foods 105-2 110-6 117-5 124-6 133-6 141-2Total convenience foods 104-5 109-4 117-9 124-3 130-9 139-8
All other foods (b) . 102-6 106-6 108-8 110-7 113-3 118-2
All foods (6) .... 1020 106-4 111-2 1141 1171 123-5
Indices of Average PricesSeasonal foods (a) . 97-5 101-3 107-2 109-6 1111 118-4Convenience foods (a):
Canned .... 102-3 105-0 109-7 109-8 111-3 1151Quick-frozen 104-4 107-2 105-5 106-2 106-8 112-3Other convenience foods 103-2 107-4 110-5 112-6 115-5 120-8Total convenience foods 102-9 106-4 109-8 1110 113-2 117-8
All other foods (b) . 105-9 109-4 111-9 113-5 117-9 123-2
All foods (b) .... 102-9 106-5 109-9 111-9 114-9 120-6
Indices of Real Value of Food PurchasedSeasonal foods (a) . 101-5 102-5 102-9 102-3 101-8 101-9Convenience foods (a) :
Canned .... 101-9 102-7 104-9 110-7 110-3 112-3
Quick-frozen 95-8 102-8 131-8 131-6 151-4 1750Other convenience foods 101-9 103-0 106-4 110-7 115-7 116-9
Total convenience foods 101-5 102-9 107-4 1120 115-7 118-7
All other foods 96-9 97-4 97-2 97-6 961 95-9
All foods (b) .... 991 1000 101-1 1020 101-9 102-4
(a) See Glossary.(b) Excluding a few miscellaneous items for which the expenditure but not the quantity was
recorded.
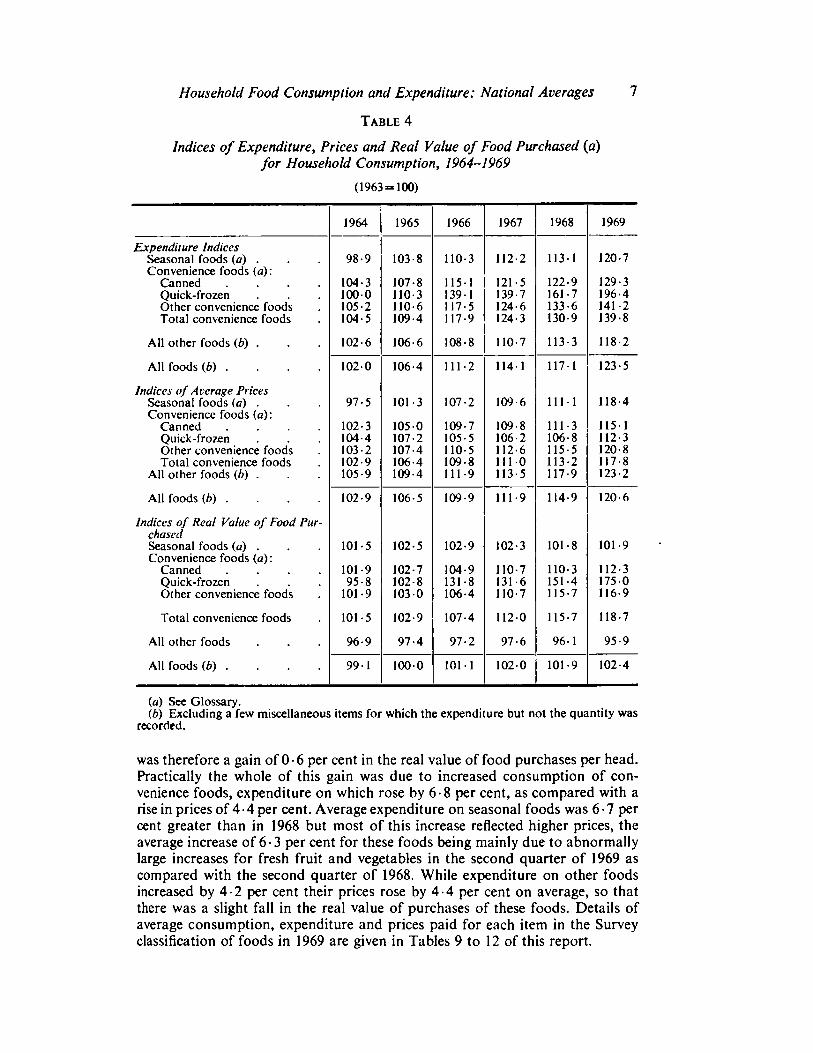
was therefore a gain of 0-6 per cent in the real value of food purchases per head.
Practically the whole of this gain was due to increased consumption of convenience foods, expenditure on which rose by 6 •8 per cent, as compared with a
rise in prices of 4 •4 per cent. Average expenditure on seasonal foods was 6 ■7 per
cent greater than in 1968 but most of this increase reflected higher prices, the
average increase of 6-3 per cent for these foods being mainly due to abnormallylarge increases for fresh fruit and vegetables in the second quarter of 1969 as
compared with the second quarter of 1968. While expenditure on other foodsincreased by 4-2 per cent their prices rose by 4-4 per cent on average, so thatthere was a slight fall in the real value of purchases of these foods. Details ofaverage consumption, expenditure and prices paid for each item in the Surveyclassification of foods in 1969 are given in Tables 9 to 12 of this report.
8 Household Food Consumption and Expenditure: 1969
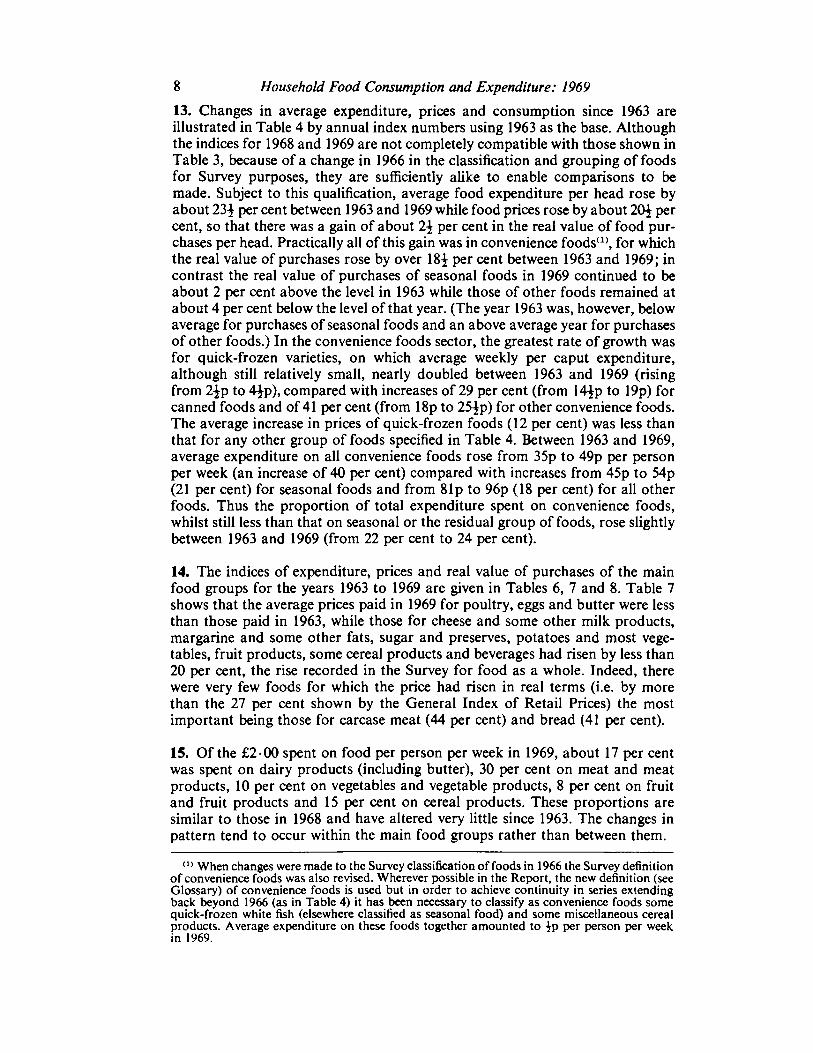
13. Changes in average expenditure, prices and consumption since 1963 are
illustrated in Table 4 by annual index numbers using 1963 as the base. Althoughthe indices for 1968 and 1969 are not completely compatible with those shown inTable 3, because of a change in 1966 in the classification and grouping of foodsfor Survey purposes, they are sufficiently alike to enable comparisons to be
made. Subject to this qualification, average food expenditure per head rose byabout 23-J per cent between 1963 and 1969 while food prices rose by about 20J percent, so that there was a gain of about 2\ per cent in the real value of food purchases per head. Practically all of this gain was in convenience foods'", for whichthe real value of purchases rose by over 18^ per cent between 1963 and 1969; incontrast the real value of purchases of seasonal foods in 1969 continued to be
about 2 per cent above the level in 1963 while those of other foods remained at
about 4 per cent below the level of that year. (The year 1963 was, however, belowaverage for purchases of seasonal foods and an above average year for purchasesof other foods.) In the convenience foods sector, the greatest rate of growth wasfor quick-frozen varieties, on which average weekly per caput expenditure,although still relatively small, nearly doubled between 1963 and 1969 (risingfrom 2-Jp to 4^p), compared with increases of 29 per cent (from 14Jp to 19p) forcanned foods and of 41 per cent (from 18p to 25-Jp) for other convenience foods.The average increase in prices of quick-frozen foods (12 per cent) was less thanthat for any other group of foods specified in Table 4. Between 1963 and 1969,
average expenditure on all convenience foods rose from 35p to 49p per personper week (an increase of 40 per cent) compared with increases from 45p to 54p
(21 per cent) for seasonal foods and from 81p to 96p (18 per cent) for all otherfoods. Thus the proportion of total expenditure spent on convenience foods,whilst still less than that on seasonal or the residual group of foods, rose slightlybetween 1963 and 1969 (from 22 per cent to 24 per cent).
14. The indices of expenditure, prices and real value of purchases of the mainfood groups for the years 1963 to 1969 are given in Tables 6, 7 and 8. Table 7
shows that the average prices paid in 1969 for poultry, eggs and butter were less
than those paid in 1963, while those for cheese and some other milk products,margarine and some other fats, sugar and preserves, potatoes and most vege
tables, fruit products, some cereal products and beverages had risen by less than20 per cent, the rise recorded in the Survey for food as a whole. Indeed, there
were very few foods for which the price had risen in real terms (i.e. by morethan the 27 per cent shown by the General Index of Retail Prices) the mostimportant being those for carcase meat (44 per cent) and bread (41 per cent).
15. Of the £2 00 spent on food per person per week in 1969, about 17 per cent
was spent on dairy products (including butter), 30 per cent on meat and meat
products, 10 per cent on vegetables and vegetable products, 8 per cent on fruitand fruit products and 15 per cent on cereal products. These proportions are
similar to those in 1968 and have altered very little since 1963. The changes inpattern tend to occur within the main food groups rather than between them.
a> When changes were made to the Survey classification of foods in 1966 the Survey definitionof convenience foods was also revised. Wherever possible in the Report, the new definition (seeGlossary) of convenience foods is used but in order to achieve continuity in series extendingback beyond 1966 (as in Table 4) it has been necessary to classify as convenience foods somequick-frozen white fish (elsewhere classified as seasonal food) and some miscellaneous cerealproducts. Average expenditure on these foods together amounted to Jp per person per weekin 1969.
Household Food Consumption and Expenditure: National Averages 9
2.2 Individual Foods: Consumption Trends
16. Changes in average household consumption of individual foods are sum
marized in paragraphs 17 to 43 below. Full details of average consumption ofindividual foods are given in Table 9.
Milk and Cream17. Expenditure on milk and cream accounted for nearly 1 1 per cent of household food expenditure in 1969 compared with 9 per cent in the previous year.The price of a pint of ordinary grade milk was temporarily reduced by 5 per cent
on 27 July 1969, and then increased by 10 per cent on 31 August. Over the yearas a whole, expenditure on liquid milk averaged 19^p per person per week, lpmore than in 1968, while purchases rose very slightly to 4-59 pints per personper week. Consumption of welfare milk (averaged over all persons in the
sample) remained at 0-71 pint per person per week in 1969, but that of schoolmilk declined from 0 16 pint per person per week in 1968 (and 018 pint in1967) to 0 12 pint in 1969, the first full year since local education authoritieswere relieved of the duty to provide free milk to children of secondary schoolage. Condensed milk continued to lose some ground to instant skimmed milkpowder and yoghurt (which together averaged no more than 0 08 pint per
person per week) and average purchases of cream increased further by 0 •08 ozto 0-70 oz.
Cheese
18. Average expenditure on cheese rose slightly to nearly 4^p per person per
week. The upward trend in consumption of natural cheese continued, assisted
by a further decline in real terms in the average price; purchases averaged
3- 15 oz per person per week compared with 3 08 oz in the previous year.Consumption of processed cheese was fully maintained at 0 •35 oz per personper week.
Meat and Poultry19. Average expenditure on meat of all kinds was 60£p per person per week in1969 compared with 57p in 1968 and continued to account for 30 per cent oftotal household food expenditure.
20. Carcase Meat. Expenditure on carcase meat (cuts etc of raw beef, lamb andpork) again accounted for 47 per cent of household expenditure on all meat,
meat products and poultry in 1969, and amounted to 28-^p per person per week,
l^p more than in 1968, although average purchases at 15-8 oz were 0- 1 oz less.
Half of the increase was spent on beef and veal, owing to an increase in the
average price paid, purchases remaining at 7-7 oz per person per week. Anadditional 0 13p was spent on mutton and lamb, average purchases of whichdeclined from 5 •7 oz per week to 5 •3 oz, and an extra £p was spent on pork,consumption of which increased further from 2-5 oz per person per week to2-8 oz.
21. Poultry. Average expenditure on uncooked poultry reached 5p per personper week in 1969 and purchases increased further by 0- 1 oz to 4-6 oz. Althoughthere was a small increase in the average price (in money terms but not in real
terms) it was still below the level of 1963. The market for poultry has steadilywidened for more than a decade, though even now the number of housewives
10 Household Food Consumption and Expenditure: 1969
buying it in any one week is less than that for beef, pork or mutton and lamb orfor bacon or sausages. Most of the expansion has, of course, been for broilerchicken, but in the last few years there has also been a noticeable growth in
consumption outside the Christmas period of turkeys and other poultry over4 lb in weight.
22. Elasticity of Demandfor Beef, Lamb, Pork and Broiler Chicken. An analysisof the monthly Survey data over the period from 1964 to 1969 has been made in
order to ascertain the extent to which changes in consumption of beef, lamb,
pork and broiler chicken can be attributed to changes in their relative prices, to
changes in real incomes, and to changes in consumers' tastes which would have
taken place even if prices and incomes had not changed. The method of analysiswhich has been employed to determine these various effects consisted of the
fitting of demand functions which assume that the effects due to changes in
prices, to changes in income, and to other factors are multiplicative, not additive. The simultaneous determination of these demand functions (one for each
type of meat) thus entails the estimation of the own-price elasticities of demandfor each of the meats together with the cross-elasticities with respect to changes
in prices of the other meats under consideration and also entails the estimationof the relevant income elasticities of demand as well as shifts in demand'1'.
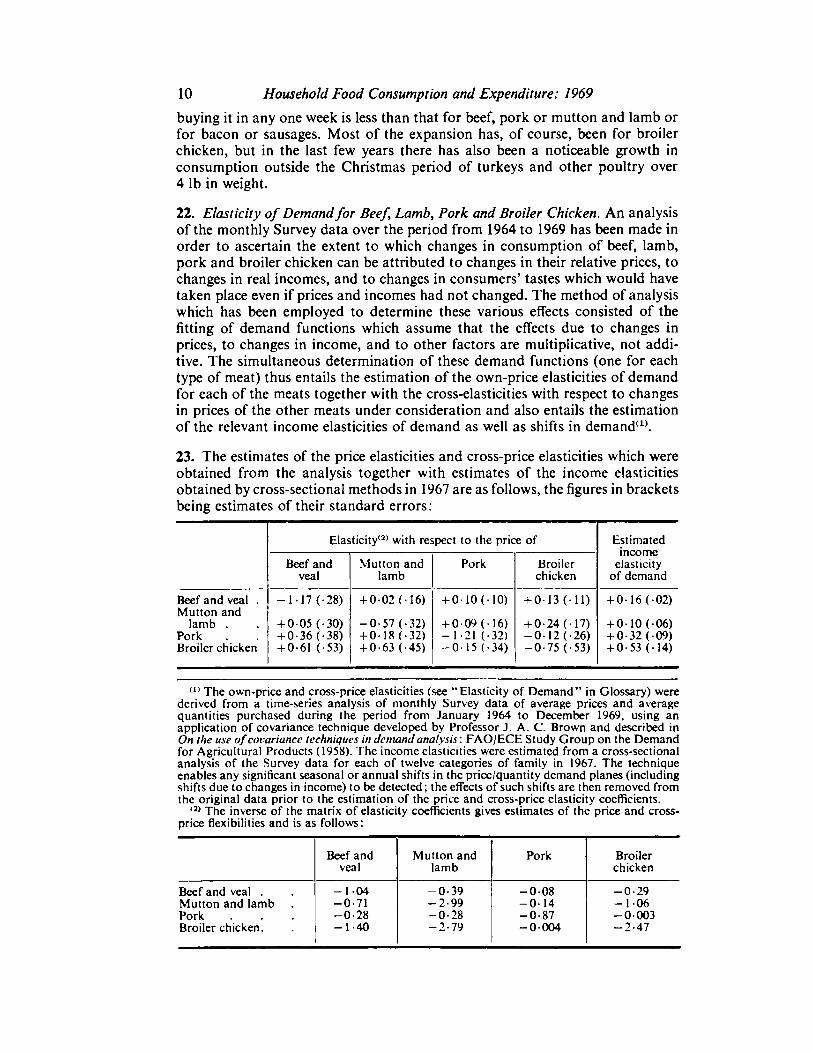
23. The estimates of the price elasticities and cross-price elasticities which were
obtained from the analysis together with estimates of the income elasticities
obtained by cross-sectional methods in 1967 are as follows, the figures in bracketsbeing estimates of their standard errors :
Elasticity12' with respect to the price of Estimatedincome
elasticityof demand
Beef andveal
Mutton andlamb
Pork Broilerchicken
Beef and veal .
Mutton and-117 (-28) + 0 02 (-16) +010(10) + 013 (11) + 016(02)
lamb .
Pork+ 0 05 (-30)+ 0-36 (-38)+ 0-61 (-53)
-0-57 (-32)+ 018 (-32)+ 0-63 (-45)
+ 0 09 ( 16)— 1-21 (-32)-015 (-34)
+ 0-24(-17)-0-12 (-26)-0-75 (-53)
+ 010(06)+ 0-32 ( 09)+ 0-53 (14)Broiler chicken
(1) The own-price and cross-price elasticities (see "Elasticity of Demand" in Glossary) werederived from a time-series analysis of monthly Survey data of average prices and averagequantities purchased during the period from January 1964 to December 1969, using anapplication of covariance technique developed by Professor J. A. C. Brown and described inOn the use of covariance techniques in demand analysis: FAO/ECE Study Group on the Demandfor Agricultural Products (1958). The income elasticities were estimated from a cross-sectionalanalysis of the Survey data for each of twelve categories of family in 1967. The techniqueenables any significant seasonal or annual shifts in the price/quantity demand planes (includingshifts due to changes in income) to be detected; the effects of such shifts are then removed fromthe original data prior to the estimation of the price and cross-price elasticity coefficients.
(a>The inverse of the matrix of elasticity coefficients gives estimates of the price and cross-price flexibilities and is as follows :
Beef and Mutton and Pork Broilerveal lamb chicken
Beef and veal . -104 -0-39 -008 -0-29Mutton and lamb -0-71 -2-99 -014 -106Pork -0-28 -0-28 -0-87 -0 003Broiler chicken. -1-40 -2-79 -0 004 -2-47
Household Food Consumption and Expenditure: National Averages 1 1
These price elasticities represent approximately the percentage changes whichwould be expected to result, other things being equal, in average purchases perhead for each 1 per cent change in the respective average prices; the degree ofapproximation is close for small percentage changes in price. A minus sign
before the elasticity coefficient implies that an increase in price would be accompanied by a decrease in the quantity purchased (or vice versa), and a plus sign
implies that the percentage changes in price and in purchases would each be inthe same direction. Thus, for example, reading down the first column of coeffi
cients an increase of 1 per cent in the average price of beef and veal would be
expected to result in a decrease of 1 • 17 per cent in the average quantity of beefand veal bought, together with an increase of 0 05 per cent in average purchasesof mutton and lamb, and increases of 0 •36 per cent and 0-61 per cent respectively
in those of pork and broiler chicken. Similarly, reading across the first row ofcoefficients, average purchases of beef and veal would be expected to decrease
by 1 ■17 per cent for each 1 per cent increase in its average price, but to increase
by 0 02 per cent for each 1 per cent increase in the price of mutton and lamb,and by 0- 10 and 013 per cent respectively for each 1 per cent increase in the
price of pork and of broiler chicken and by 0- 16 per cent for each 1 per cent
increase in personal disposable income per head. It will be noted that none ofthe estimate of the cross-price elasticities given in the above table attains formalstatistical significance; the results are therefore not wholly conclusive, and some
of the smaller values can probably be discounted. However, there is a suggestion
that of all the substitutions of one meat for another which are possible on the
basis of changes in their relative prices, those from beef or lamb to poultry (orvice versa) appear to happen most readily.
24. Once the set of price and income elasticities were determined, they were used
to make estimates of the level of purchases which might have been expected each
month and each year, other things being equal, given the changes in average
price and in income which in fact occurred. The differences between these
estimates of expected purchases and the level of purchases actually recordedprovide a measure of the shifts in demand (together with any residual error)which took place. The annual averages of prices and purchases, expressed as
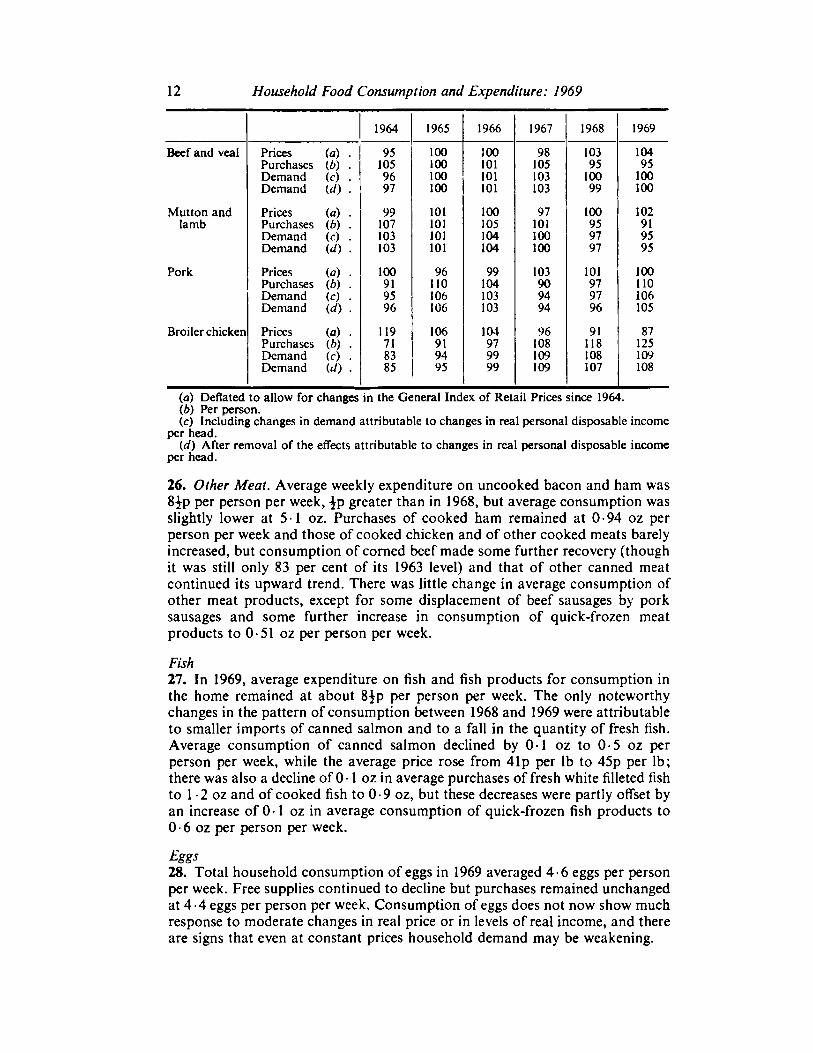
indices (1964-1969 = 100) together with further indices which illustrate the
shifts in the strength of consumer demand for each of the meats after removal ofthe effects attributable to changes in prices and income, are shown in table onpage 12.
25. These results suggest that the underlying consumer preference for beef wasbecoming stronger between 1964 and 1967, but following the reduction insupplies arising from the epidemic of foot and mouth disease in the autumn andwinter of 1967/68 there was, prima facie, some suggestion of a weakening in thispreference. This downturn, however, was probably more apparent than real;possibly butchers were able to induce housewives to transfer some of theirdemand away from beef, initially to broiler chickens (and other kinds ofpoultry —see paragraph 21, above) and later to pork without having to resortto increasing beef prices as much as would otherwise have been necessary tobring about this transfer. The series of indices illustrating changes in the demandfor pork and for broilers are compatible with this hypothesis. The overallweakening in per caput household demand for mutton and lamb over the
period, however, appears to have continued unaffected by these changes.
12 Household Food Consumption and Expenditure: 1969
1964 1965 1966 1967 1968 1969
Beef and veal Prices (a) ■ 95 100 100 98 103 104
Purchases U>) . 105 100 101 105 95 95Demand (c) . 96 100 101 103 100 100
Demand (d) . 97 100 101 103 99 100
Mutton and Prices (a) . 99 101 100 97 100 102
lamb Purchases 0) ■ 107 101 105 101 95 91
Demand (c) . 103 101 104 100 97 95Demand id) . 103 101 104 100 97 95
Pork Prices (a) . 100 96 99 103 101 100
Purchases (b) . 91 110 104 90 97 110
Demand (c) . 95 106 103 94 97 106
Demand id) . 96 106 103 94 96 105
Broiler chicken Prices (a) . 119 106 104 96 91 87
Purchases (b) . 71 91 97 108 118 125
Demand (c) . 83 94 99 109 108 109
Demand id) . 85 95 99 109 107 108
(a) Deflated to allow for changes in the General Index of Retail Prices since 1964.
(b) Per person.
(c) Including changes in demand attributable to changes in real personal disposable incomeper head.
(<0 After removal of the effects attributable to changes in real personal disposable incomeper head.
26. Other Meat. Average weekly expenditure on uncooked bacon and ham was8£p per person per week, ^p greater than in 1968, but average consumption wasslightly lower at 5 • 1 oz. Purchases of cooked ham remained at 0-94 oz per
person per week and those of cooked chicken and of other cooked meats barelyincreased, but consumption of corned beef made some further recovery (thoughit was still only 83 per cent of its 1963 level) and that of other canned meat
continued its upward trend. There was little change in average consumption ofother meat products, except for some displacement of beef sausages by porksausages and some further increase in consumption of quick-frozen meat
products to 0-51 oz per person per week.
Fish27. In 1969, average expenditure on fish and fish products for consumption inthe home remained at about 8$p per person per week. The only noteworthychanges in the pattern of consumption between 1968 and 1969 were attributableto smaller imports of canned salmon and to a fall in the quantity of fresh fish.
Average consumption of canned salmon declined by 0 1 oz to 0-5 oz per
person per week, while the average price rose from 41 p per lb to 45p per lb;there was also a decline of 0 - 1 oz in average purchases of fresh white filleted fishto 1 - 2 oz and of cooked fish to 0-9 oz, but these decreases were partly offset byan increase of 0 • 1 oz in average consumption of quick-frozen fish products to0 •6 oz per person per week.
Eggs28. Total household consumption of eggs in 1969 averaged 4-6 eggs per personper week. Free supplies continued to decline but purchases remained unchangedat 4 •4 eggs per person per week. Consumption of eggs does not now show muchresponse to moderate changes in real price or in levels of real income, and there
are signs that even at constant prices household demand may be weakening.
Household Food Consumption and Expenditure: National Averages 13
Fats29. Expenditure on fats continued to average just under lOp per person perweek and there was no significant change in 1969 in the level or pattern of consumption which averaged 11-8 oz per person per week, of which 6 •2 oz wasbutter and 2-8 oz margarine (compared with 12 0 oz, 6 0 oz and 3-4 oz re
spectively in 1964). Purchases of lard and other solid fats continued to averageabout 2 •3 oz, and those of cooking oils and salad oils increased slightly to justover 0 ■5 fluid oz.
Sugar and Preserves
30. Average purchases of sugar continued to decline, falling from 16 -4 oz in1968 to 16-2 in 1969. The long-established downward trend in consumption ofjam and of syrup, treacle and honey continued, but purchases of marmaladewere maintained at an average of just under 1 oz per person per week.
Vegetables
31. Expenditure on vegetables and vegetable products averaged 20p per personper week in 1969 and accounted for 10 per cent of household food expenditure,about % per cent more than in 1968, when potato prices were exceptionally low.
Potatoes and Potato Products32. Consumption of potatoes averaged just over 49 oz per person per week
compared with nearly 52 oz in 1968; purchases were reduced by an average of2 oz and supplies from gardens etc by over \ oz. The reduction in purchases wasentirely in old potatoes sold loose, and may be associated with the reduction inthe acreage planted ; purchases of prepacked potatoes and of new potatoes each
showed small increases. Because of higher prices, average expenditure on potatoesin 1969 was 6p per person per week, compared with 5p in 1968. Expenditure onpotato products (excluding quick-frozen products) averaged 2p per person perweek in 1969 compared with l^p in 1968 and lp in 1966.
Cabbages, Brussels Sprouts, Cauliflowers etc
33. Average consumption of this group of fresh vegetables was 9 0 oz perperson per week in 1969, compared with 9-7 oz in 1968, the decrease being insupplies of cabbages and, to a lesser extent, brussels sprouts. Prices rose onaverage by about £p a lb compared with the previous year.
Peas and Beans {Fresh and Processed)34. Average purchases and garden and allotment supplies of fresh peas continued to decline in 1969 and together averaged no more than 0 •6 oz per personper week. However, this decline was more than offset by the continued increase
in purchases of quick-frozen peas, which averaged 11 oz, and a further slightincrease in purchases of canned peas to 3 • 1 oz. The transfer of demand fromfresh beans to quick-frozen beans has been less marked than that from fresh toquick-frozen peas, and household consumption of fresh beans at 1 •3 oz perperson per week was still greatly in excess of that of quick-frozen beans (0-3 oz).Purchases of canned beans continued to increase and averaged 3 ■6 oz. ,
Leafy Salads35. For several years, purchases of lettuces and other leafy salads have remainedsteady at about 1 oz per person per week and average supplies from gardens and
14 Household Food Consumption and Expenditure: 1969
allotments at about i oz. Average expenditure rose from 0-79p in 1968 to 0-87pin 1969, the average price increasing from 12^p per lb to 13^p per lb.
Other Vegetables
36. Purchases of carrots averaged 2 •6 oz per person per week, slightly less thanin the previous year, but purchases of other root vegetables and of onions andleeks were fully maintained at 1 •6 oz and 2 ■8 oz respectively. There was no
change in the average level of garden and allotment supplies of these vegetables.
Average purchases of cucumbers and of mushrooms were also steady at 0 -7 ozand 0 •4 oz respectively, and there was a small increase in consumption of otherfresh vegetables to 0-7 oz. Purchases of canned vegetables (other than peas,
beans or potatoes) continued to increase, reaching an average of 1 •2 oz perperson per week. Average consumption of quick-frozen vegetables (other than
peas and beans) and vegetable products also showed some further growth and
expenditure on these items reached I-Jp per person per week in 1969, almostdouble the amount recorded in 1966.
Fresh Fruit37. Expenditure on fresh fruit in 1969 averaged 1 1-Jp per person per week,
nearly 6 per cent of average household food expenditure. The total quantityconsumed averaged 21 oz per person per week, of which a tenth was garden andallotment produce. Purchases of oranges continued to increase, averaging 3 •8 oz,
but purchases of other citrus fruit decreased slightly to 1 •3 oz. Purchases ofbananas increased slightly to 3-4 oz and consumption of apples at 6-7 oz perperson per week was also rather greater than in 1968, while consumption ofpears was fully maintained at nearly 0-9 oz; average prices of all these fruitsincreased relatively less than those of all other fruits. Consumption of tomatoesat 41 oz reflects a slight increase in garden and allotment supplies. Suppliesof rhubarb from these sources were, as usual, more than twice as great as
purchases.
Canned Fruit and Fruit Products38. Purchases of canned and bottled tomatoes were fully maintained at an
average of 0 •8 oz per person per week. Consumption of canned fruit, however,
increased slightly to nearly 4-9 oz, a further decrease in purchases of cannedpeaches, pears and pineapples to 2 •5 oz being more than offset by an increase
in purchases of other canned fruit to 2-4 oz. Purchases of dried fruit and nutscontinued to average about 1 •2 oz per person per week(1) and those of fruitjuices about 0-6 fluid oz.
Bread and Flour39. Average expenditure on bread was 12|p per person per week in 1969, ^p
more than in 1968, and accounted for a little more than 6 per cent of householdfood expenditure. However, average purchases of bread continued to declineand were 37 -7 oz per person per week in 1969, compared with 38 - 3 oz in the
previous year and 41 -9 oz in 1964. About half of the decline of 10 per cent inper caput purchases since 1964 can be attributed to the rise in the price of breadover this period (32 per cent in money terms, equal to 7 per cent in real terms),
m Some of the Christmas trade will be unrepresented in this estimate, since the fieldwork ofthe Survey does not extend over Christmas (see paragraph 11).
Household Food Consumption and Expenditure: National Averages 15
but only about a tenth of the fall can be attributed to the rise in real incomes
over the period(1). The remainder of the decline in purchases is attributable to a
change in consumers' tastes. Most of the decline was in respect of large wrapped
white loaves. Purchases of flour were maintained at 5 •4 oz per person per week
in 1969 although previously they had been declining for several years.
Cakes and Biscuits40. Average purchases of buns, scones and tea cakes, and of cakes and pastries,
at 1 •3 oz and 4 •6 oz per person per week respectively, continued to decline, and
these decreases cannot be accounted for in terms of changes in prices and
incomes. Purchases of biscuits showed no further increase in 1969, those ofchocolate biscuits continuing to average about 1 0 oz per person per week and
those of other biscuits 4 •8 oz.
Other Cereal Products, including Breakfast Cereals and Puddings41. While purchases of oatmeal and oat products were barely maintained at
0 ■5 oz per person per week, purchases of prepared breakfast cereals increased
further to 2 •6 oz. Per caput consumption of canned milk puddings and of rice
declined slightly, but purchases of other puddings and of infant and invalid
foods were maintained and those of other cereal foods (particularly convenience
varieties) increased by about 8 per cent to 2 0 oz per person per week.
Beverages
42. Average purchases of tea continued to decline slowly, averaging 2 •5 oz per
person per week compared with 2-6 oz in 1968. Purchases of coffee essences also
continued to decline, but those of instant coffee increased further to 0-38 oz per
person per week and those of coffee beans and ground coffee increased to 0- 13
oz. This further transfer of demand from tea to coffee represents a shift in con
sumer preferences which can be explained only partly in terms of changes in
incomes and not at all in terms of changes in prices. Consumption of cocoa and
drinking chocolate and of branded food drinks was well maintained.
Miscellaneous Foods43. Purchases of canned soups and of dehydrated and powdered soups increased
slightly in 1969, reaching 3-2 oz per person per week and Oil oz respectively.
Purchases of pickles and sauces also showed some further increase, averagingover 1 ■4 oz per person per week. Average consumption of prepared baby foods,
spreads and dressings, ice-cream purchased to serve with a meal, and of such
cabinet-trade frozen foods as pastry and sponge also continued to increase in
1969.
(1>The income elasticity of demand for bread was estimated to be about —0-2 in 1967, i.e.a 1 per cent increase in real incomes per head tends to result, other things being equal, in adecrease in per caput purchases of 0-2 per cent; the price elasticity, estimated from an analysisof Survey data between 1964 and 1969, was about —0-7, i.e. a 1 per cent increase in the realprice of bread tends to result, other things being equal, in a decrease in per caput purchasesof 0-7 percent.
Chapter 3
HOUSEHOLD FOOD CONSUMPTION ANDEXPENDITURE: GEOGRAPHICAL, INCOME GROUP
AND FAMILY COMPOSITION DIFFERENCES
3.1 Introduction
44. The National Food Survey provides estimates of average food consumptionand expenditure for different household groups in addition to those for GreatBritain as a whole. The estimates for the former cannot be as accurate as thosefor the whole community because they are each based on fewer householdrecords, but they exhibit a pattern of differences between the various groupswhich changes only slowly from year to year. The Annual Report for 1965
contained a detailed review of such changes over the period 1956 to 1965, andoutlines of the results for 1966, 1967 and 1968 were given in the Annual Reportsfor those yearsa>. This chapter contains a summary of the results for 1969.
3.2 Geographical Differences
3.2.1 CLASSIFICATION USED
45. To reveal differences in food consumption patterns between households indifferent parts of the country, the Survey data are analysed in two separate
ways. The first of these classifies households according to geographic region, the
second classifies households according to the degree of urbanization of the
polling districts in which they are located"'. The two classifications are made
independently of each other and no cross-classification according to degree ofurbanization within each region has been attempted.
46. The Survey is designed to be representative of Great Britain as a whole, butpractical considerations limit the number of localities which can be includedfrom each region in any one year. Although the results obtained from the
localities selected in a single year from any one region may not therefore be
fully representative of that region, the results obtained over a period of years
cover a wider range of localities and show a fair degree of consistency, whichallows conclusions to be drawn about broad regional characteristics in patterns
of consumption.
3.2.2 MAIN RESULTS IN 1969
47. Table 13 gives estimates of average expenditure per person per week in each
region and type of area in 1969 and the value of food obtained for consumptionin the home. Average per caput expenditure per week was £1 -95 in Scotland
"> Household Food Consumption and Expenditure: Reports for 1965, 1966, 1967 and 1968.
HMSO.(2>Nine regions are distinguished, separate results being given for Wales, for Scotland, and
for each of the standard regions of England (as defined since mid-1965) except that East Angliais combined with the South East Region. Further details are given in Appendix A (Table 1).The analysis according to degree of urbanization distinguishes six types of area, defined as inAppendix A, paragraph 15.
16

Geographical, Income Group and Family Composition Differences 17
and £2 03 in Wales; in the English regions average expenditure ranged from£2 06 in the West Midlands to £1-91£ in the South West. After taking intoaccount supplies from sources such as gardens and allotments, the average
values of consumption in the regions in the south of England and in Wales were
all at or above the average for Great Britain as a whole, while those in the EastMidlands, the north of England and in Scotland were below that average.
48. Greater differences in average expenditure exist between types of area thanbetween broad regions. Average expenditure in London (£2- 16 per person per
week) was 8 per cent above, and that in rural areas (£1 -84^) was 8 per cent
below the overall national average. However, the average values attributable togarden and allotment produce ranged from lp per person per week in provincialconurbations to 24Jp in rural areas : when these are taken into account the range
in average values of consumption between types of area is narrowed to about10 per cent, that in London being about 6^ per cent above the average forGreat Britain and that in provincial conurbations about 4 per cent below thataverage.
49. Average expenditure on seasonal foods and on quick-frozen foods was
greatest in the south-east of England and lowest in the north and in Scotland ;
conversely, average expenditure on other convenience foods, especially canned
varieties, was greater in the north of England than in the south. Averageexpenditure on seasonal foods in London was one and a half times as great as
that in rural areas and nearly a third greater than that in provincial conurbations.The range of differences in expenditure on convenience foods was relativelynarrower, except for quick-frozen foods, for which the average amount spent inLondon was double that spent in rural areas ; for other convenience foods, the
highest averages occurred in the larger provincial towns.
50. Table 13 also gives index numbers of food prices'1' paid by housewives in1969 in each region and type of area. Housewives in Scotland continued to payhigher food prices in general than were paid elsewhere in Great Britain, particularly for carcase meat and bacon, fish, fresh fruit and vegetables, and cereal
products. In Wales, and in all regions of England except the South West, foodprices in general were within 2 per cent of the national average. In the SouthWest region prices were nearly 3 per cent below the national average, mainlybecause of lower prices paid for meat and meat products, potatoes and cereal
products. The overall levels of food prices in different types of area were withinabout \\ per cent of the national average, but there were wide differences for a
few foods. Thus, the average price paid for potatoes by housewives in Londonwas noticeably greater than that paid in rural areas, and about a fifth greater
than in provincial towns; these differences appear to have arisen, at least inpart, from differences in bulk-purchasing habits, the average size of purchasebeing smaller in London than elsewhere. Differences in average prices paid forother foods were much smaller, but lamb and fresh fruit were noticeably cheaper
(1>The price indices have been derived by valuing the national diet at the average pricespaid in each region and type of area, and expressing each result as a percentage of the cost ofthe national diet at national prices. Thus the price indices take no account of variation in thepattern of food purchases in different localities, but only of price differences which are duepartly to variations of quality (including differences in varieties purchased, e.g. cuts of bacon,within each item in the Survey classification of foods), partly to differences in the services (inthe widest sense) offered by different shops, and partly to differences in transport costs.
18 Household Food Consumption and Expenditure: 1969
in London than elsewhere, whereas fresh green vegetables tended to be a littledearer.
51. The regional "price of energy" indices'1' in Table 13 indicate that in the
combined South East/East Anglia region, and particularly in London, the costper calorie of the average diet was well above that in other parts of GreatBritain, because the south-eastern diet contained more carcase meat, poultry,fresh fruit and vegetables and less cereal products, sugar and margarine. Averagecost per calorie ranged from 4£ per cent above the national average in the
combined South East/East Anglia region (and 10 per cent above in London) to5 per cent below that average in Wales, a rather wider range than in previousyears. The "price of energy" indices for all types of area except London were
less than 3 per cent below the national average.
52. Detailed estimates of the average consumption in each region and type ofarea of each of the foods itemized in the Survey classification are given in Table15. The food consumption patterns in 1969, summarized in Table 14, showbroadly similar characteristics to those noted in previous years. For example,in addition to the variations for the South East/East Anglia region (and especiallyfor London) noted in the previous paragraph, consumption in Wales of butter,cooking fat, lamb, bacon, poultry and tea remained relatively high and that ofmargarine, beef, pork and coffee relatively low, while in Scotland consumptionof beef, margarine, preserves and cereal products was high and that of lamb,pork, poultry, bacon and fresh green vegetables low. Consumption of lamb and
poultry was below the national average in the north of England (with the
notable exception of Iamb in the North West) but generally above the nationalaverage further south (apart from the East Midlands). Although regionalvariations in consumption of beef were less marked, there was a tendency foraverage consumption to be higher in the north than in the south of England.Consumption of fruit and of fresh green vegetables was low in the north and
much higher in the Midlands and the south, but this pattern tended to be
reversed for potatoes and other vegetables.
53. The analysis according to type of area shows that the average patterns ofconsumption in larger and smaller towns and, to a smaller extent, in semi-ruralareas, were fairly similar to that in Great Britain as a whole, but the pattern ofconsumption in Greater London showed some marked contrasts with that inthe provincial conurbations. For example, consumption of lamb, poultry, pork,coffee, cheese, fruit and fresh green vegetables was high in London and low inthe provincial conurbations, while consumption of margarine, flour confectionery, bread, potatoes, processed meats and processed vegetables was higher inthe provincial conurbations than in London. In rural areas, purchases of the
ingredients for home baking were above the national average and those of cakes
and biscuits below it; consumption of pork, coffee and fresh green vegetables
was also high, and that of lamb, poultry, fish, tea, potatoes and other vegetables
comparatively low.
(1) These "price of energy" indices showing relative differences in "cost per calorie" havebeen obtained by dividing the money value of food obtained for consumption (purchases plusfree supplies) in each group of households by its energy value and expressing the result as apercentage of the corresponding quotient for all households. These indices take into accountregional and type of area variations in consumers' choice of foods as well as variations inprices paid.

Geographical, Income Group and Family Composition Differences 19
3.3 Income Group Differences
3.3.1 CLASSIFICATION USED
54. The definition of income group used in the National Food Survey is interms of the gross weekly income (i.e. before deduction of direct taxes andanalogous payments) of the head of the household, as stated by the housewifeor, if necessary, imputed from occupation or other information"'. Because ofthe continuing rise in money incomes, the income ranges for each group mustbe re-defined periodically. Moreover, the revision must be made in advance ofthe fieldwork for any year, because those housewives who are unable or un
willing to state the exact income of the head of the household will often say inwhich of the specified income ranges it lies, and such information is better
for purposes of classification than estimates imputed from occupation or otherfactors. The income ranges which were adopted at the beginning of 1969 for use
throughout the year are shown in the following table together with the desired
distribution of the sample between these groups and the distribution actuallyrealized.
Distribution of households
Planned Realised
Group Al (£55 and over per week)%2-57-5
350350200
%3-6
11-437-527-619-8
Group A2 (£34-50 but less than £55 per week)Group B (£20 but less than £34-50 per week) .
Group C (£1 1 •50 but less than £20 per week) .
Group D (Under £11-50 per week) ....Total 1000 (1000)
Further details of the composition of the sample of households in each group in1969 are given in Tables 5 to 8 of Appendix A.
3.3.2 MAIN RESULTS IN 1969
55. Estimates of average expenditure on food in 1969 in each of the incomegroups are given in Table 16. Average expenditure per head in group Al wasnearly 16 per cent above the average for the whole sample and that in group Dlwas over 7 per cent below that average ; average expenditure in the intermediategroups varied directly with income, the gradation being steeper at the higherincome levels. There was a similar gradation in the value of food supplies from
gardens and allotments, so that the range in the average value of food obtainedfor consumption was rather wider than that for food expenditure. The gradationwith income was also apparent for average expenditure on seasonal foods and
on convenience foods, particularly quick-frozen foods, but not for cannedconvenience foods, for which differences between income groups were very smalland the highest averages tended to occur in the middle of the income range.
(1>See Appendix A, paragraph 15.
Sub-divided into three groups, namely: households containing one or more earners(group Dl), those containing no earner (group D2) and households solely or mainly dependenton state retirement pensions (contributory) or non-contributory old age pensions (abbreviatedasOAP).
20 Household Food Consumption and Expenditure: 1969
Table 16 also shows index numbers comparing the general levels of prices paid(1)for food by households in each of the income groups. These index numbersindicate that average prices paid increase with increasing income, the rangebetween group Al and group Dl being 1 1 per cent (but only 5 per cent betweengroups A2 and D 1), compared with a wider range of 24 per cent (and 1 3 per cent)for expenditure. The differences between groups Al and Dl in average pricespaid were greater for fish (23 per cent), carcase meat (19 per cent), cereal products (18 per cent), natural cheese (17 per cent) and meat products (15 per cent)than for most other foods, and probably reflect, at least in part, differences inquality and in service.
56. The "price of energy" indices'2' given in Table 16 take into account notonly price variation but also differences between groups in dietary pattern. Theyshow a range as large as 30 per cent between income groups Al and C, largelycaused by the highest income group spending relatively more on low-energy andless on high-energy foods.
57. Details of average consumption of and expenditure on the main foods ineach of the income groups are given in Tables 17 and 18. Groups B and Ctogether comprise about two-thirds of the households in the sample and there
fore show a dietary pattern similar to the average for the sample as a whole.The tables illustrate, however, some marked differences in dietary patternsbetween the higher and lower income groups, notably the comparatively highconsumption of fresh fruit, green vegetables, quick-frozen vegetables, dairyproducts, meat, and coffee by the former, and their relatively low consumptionof bread, potatoes, sugar, margarine, cakes and tea. The results for pensionerhouseholds reflect both the almost wholly adult composition of the householdand the persistence of buying habits formed in earlier years.
3.4 Household Composition Differences
3.4.1 CLASSIFICATION USED
58. The households participating in the National Food Survey were groupedinto eleven types according to their size and composition in terms of numbers ofadults, adolescents and children<3) as follows:
Households of one man and one woman and:no other (both under 55)no other (one or both 55 or over)1 child2 children3 children4 or more childrenadolescents onlyadolescents and children
(l) See paragraph 50.<a)These indices, which measure the "cost per calorie", have been obtained by dividing the
money value of food obtained for consumption (purchases plus free supplies) in each group ofhouseholds by its energy value and expressing the result as a percentage of the correspondingquotient for all households.
<3)See Glossary for definitions of "adult", "adolescent" and "child".
Geographical, Income Group and Family Composition Differences 21
Other households with:adults onlyadolescents but no childrenchildren
Details of the sample in 1969 according to household composition are given inTables 7 and 8 of Appendix A.
3.4.2 MAIN RESULTS IN 1969
59. Estimates of the average household food expenditure and value of consumption per person per week in 1969 in each of the eleven types of householdare given in Table 19. These show much wider variation than those for the otherclassifications by location and income considered above. Thus, average foodexpenditure per person per week ranged from £1 ■39 in families with four or morechildren (£9 •
03^ for the family) to £2 •69 in households containing only a youngercouple (£5 •
37^ per household). The inclusion of supplies of garden and allotmentproduce does not significantly alter this range. These relative differences are alsoapparent for average expenditure on seasonal foods, on quick-frozen foods andon canned foods, but for other convenience foods the relative differences arehalved. The main difference in average expenditure between younger and oldercouples was that the former spent about one-third more than the latter onconvenience foods and twice as much on quick-frozen foods.
60. The price index*" given in Table 19 shows a range of rather less than 8 percent between the general level of prices paid for food by families with four ormore children and those paid by younger couples, in contrast with the range ofover 90 per cent in average food expenditure per head. Prices paid by familieswith four or more children were in general about 5 per cent below the averagefor all types of household. About half of this difference is attributable to lowerprices paid for carcase meats, poultry, bacon and meat products, one-fifth tofruit and vegetables and a tenth to cereal products other than bread. Prices paidby younger couples, however, were in general over 2 per cent above those paidby the country as a whole; half of this difference is attributable to higher pricespaid for meat and meat products, one-fifth to fruit and vegetables and a sixth tocereal products other than bread. These differences in average prices paid arisefrom differences in quality, average size of purchase and the extent to whichhousewives spend time in comparing prices and standards of service offered bydifferent shops. The differences ignore, however, any bonuses given by way ofdividend or trading stamps.
61. The "price of energy" indices'2', which are also given in Table 19, take intoaccount dietary patterns as well as prices and show a range of 32 per centbetween younger childless couples and couples with four or more children. Thisrange, which is four times as great as the range in the corresponding food priceindices, is mainly attributable to differences in dietary patterns. These in turn arepartly attributable to physiological and partly to economic factors : differencesin wastage may also affect the range.
(1>The index has been compiled by costing the national diet at the average prices paid byeach of the household groups (cf. paragraph 50).
(3) See footnote (2) to paragraph 56.
22 Household Food Consumption and Expenditure: 1969
62. The pattern of food consumption and expenditure in 1969 in each of theeleven household types is shown in some detail in Tables 20 and 21. As usual,expenditure and consumption per person of most foods was greater in smallfamilies than in large, mainly because adults have greater physiological requirements than children, though differences in economic circumstances also contributed to this disparity, and to the greater per caput consumption of relativelycheap sources of energy in larger families.
3.5 Family Composition Differences Within Income Groups
3.5.1 CLASSIFICATION USED
63. In order to examine the relative effects of the composition of the family andof the income of its head upon household food expenditure and consumptionand the nutritive value of the diet, the Survey data have been analysed accordingto family composition within each broad income group. Because they containfew children, households in income group D2 and those of old age pensionershave been excluded from this analysis. The samples of households with childrenin income groups Al and Dl are too small for separate analysis, and have been
combined with those in groups A2 and C respectively. The analysis is thereforeconfined to twenty-one sub-groups of households—seven family types (namely,childless younger couples and couples with different numbers of children, withor without adolescents) within each of three broad income groups, A, B andC & Dl. Details of the composition of the sample in 1969 are given in Table 7
of Appendix A.
3.5.2 MAIN RESULTS IN 1969
64. Estimates of average per caput weekly food consumption and expenditure in1969 in each of the twenty-one sub-groups are given in Tables 22 and 23 re
spectively. Average food expenditure per head ranged from about £1-35 perweek in families in the lower income groups with 4 or more children to £3
per week in households in income group A containing only a younger couple.As in previous years, the averages for food expenditure per head show much
greater variation between family-size groups within each income range thanbetween income groups within each family-size group. For example, in 1969 the
smallest range between family-size groups within any income group was as much
as £1 - 1 7-J per person per week whereas the largest range between income groups
within any family type was only 52^p per person per week. Estimates of the
average food expenditure per household in each of the twenty-one sub-groupsare also given in Table 23. Within each income group there was a range of £3 • 50
or more in average weekly food expenditure per household between the smallest
and the largest families. However, within the separate family-size groups, the
maximum range between the highest and lowest income groups was only £1 - 30.
Estimates of average per caput consumption of each of the main foods are givenin Table 22. They show, in most cases, that the wide range of differences in per
caput consumption between the smallest families and the largest persists withineach income group.
65. A comparison of the average prices paid for some of the main commoditiesby younger couples in income group A with those paid by large families in
Geographical, Income Group and Family Composition Differences 23
income group C & Dl shows that the former paid on average about 5 per cent
more for each pint of milk in 1969, presumably because they opted for the
premium grades. They bought beef, lamb, pork and bacon at average pricesbetween a fifth and a third as much again as those paid by larger families withlower incomes, presumably because they more frequently selected the moreexpensive cuts. Differentials of about 15 per cent were recorded for poultry andfor bread, again reflecting differences in variety and quality (in the widest sense,
including services provided by the retailer), but for butter, margarine and eggs
the differential was only about 5 per cent. It must be borne in mind, however,that these comparisons have been made from only a relatively small number ofobservations, and the price differentials have shown such wide and irregularfluctuations over the past few years that it is impossible to deduce whether ornot they are changing in magnitude.
66. Estimates of declared net family income per head and per household are
also given in Table 23. These estimates, which include family allowances andare after deduction of income tax and national insurance contributions, are
derived from information given by the housewife and are known, on average, tobe understated. The estimates should therefore be regarded with a good deal ofcircumspection.
67. Indices showing the relative differences in "cost per calorie" between the
twenty-one sub-groups are shown in section (iv) of Table 39. Average cost percalorie is seen to increase with increasing income and to decrease with increasingfamily size, but there is a wider range between large and small families in the
highest income groups than between corresponding families in the lower incomegroups.
3.6 Household Food Consumption and Expenditure Accordingto Age of Housewife and Broad Socio-economic Grouping, 1969
3.6.1 CLASSIFICATION USED
68. The experimental classification of households according to the age of the
housewife in each of two broad socio-economic groupings, first attempted in1968(1), was repeated in 1969. The two broad groupings were designed to bringtogether, as far as possible, professional and other persons whose incomes tend
to rise throughout most of their careers and who tend to have substantial occupational pensions, and to contrast these with workers who reach their maximumearnings early in their working lives and retire with either the State retirementpension only or with only very limited additional funds. The criterion used forthis grouping was whether the head of household was classified in Registrars-General's Social Classes I and II (professional and intermediate occupations) orin Classes III, IV or V (skilled, partly skilled and unskilled occupations)<2). Just
u) Household Food Consumption and Expenditure: 1968, paragraphs 71 to 75, HMSO, 1970."' In certain circumstances (i.e. where the head of household was in the armed forces, retiredor not gainfully employed, or where no information about occupation was available) thehousehold will have been classified as Registrars-General's Social Class O. In such caseshouseholds in which the head of household's income group was A, B or C were allocated to theprofessional group of households, the remainder (i.e. income group D) to the second group ofhouseholds.
24 Household Food Consumption and Expenditure: 1969
over one-quarter of the households (and persons) were allocated to the professional and intermediate ("professional") group in 1969 and nearly three-quarters to the other ("non-professional") group. It has been necessary toexclude from the analysis 46 households (about 0-5 per cent of the wholesample) in which the housewife did not state her age.
3.6.2 FAMILY COMPOSITION
69. Table 24 shows the main characteristics of households in each of the seven
age-groups in each of the two broad socio-economic groupings. In both groupings, the average family size rose to its peak when the housewife was aged be
tween 35 and 44 and declined above that age as the children grew up and lefthome. The average size of family in each age-range up to 34 was noticeablysmaller in the professional group than in the other group because the lattertended to commence raising their families earlier; this difference in averagehousehold size practically disappeared in the 35-54 age band. In later years theprofessional households were of greater average size than the non-professionalhouseholds in comparable age-groups. Overall, the average size of family wasgreater in professional than non-professional households (3 17 persons compared with 3 02)
3.6.3 AVERAGE DECLARED NET FAMILY INCOME
70. Average net family income (as declared by the housewife* "), both per head
and per household, was greater at each stage of the life-cycle in professionalthan in non-professional households. When the housewife was under 65 yearsof age, average income per head in professional households was from a quarterto two-fifths greater than in other households, but in later years this marginwidened so that average income in professional households became twice thatin other households.
3.6.4 PROPORTION OF FAMILY INCOME SPENT ON FOOD
71. Average food expenditure in both professional and non-professional house
holds was greatest per household when the household reached its maximum size,
and greatest per person when the housewife was aged between 55 and 64, andthe household therefore almost entirely adult in composition. In professionalhouseholds the proportion of declared net family income spent on food variedonly between 18 and 23 per cent through the life cycle, but in non-professionalhouseholds the proportion rose from 24 per cent in the younger families to 37
per cent in the 65-74 age group. Details of average expenditure on varioustypes of food by each group are given in Table 26.
3.6.5 AVERAGE CONSUMPTION OF FOOD
72. Variations in average consumption of food are given in Table 25. Age forage, consumption per head of most foods was greater in professional householdsthan in other households, but the pattern of variations with age was similar inboth socio-economic groups. The main features of this pattern are that average
(1) See also paragraph 66.

Geographical, Income Group and Family Composition Differences 25
consumption increased with increasing prosperity and with increasing per caput
nutritional need but declined once retirement age was reached or approached.In general, household food consumption was more affected by the size of the
family and the age of its members than by the "professional or "non-professional" status of the head of the household. Margarine, sugar, potatoes,white bread (but not brown), cakes and tea were among the few items for which
average consumption was higher in non-professional than in professionalhouseholds, although there are other foods, such as flour, biscuits and brandedfood drinks, for which there were no consistent differences between the twobroad classes in corresponding age-groups.
3.6.6 AVERAGE PRICES PAID FOR FOOD
73. The average prices paid for foods itemised in the Survey vary from one
household to another and reflect not only differences in the prices of exactlycomparable items, but also differences in quality and variety. Nevertheless the
price variation between age-groups and between professional and other households was generally small. The pattern was for professional households topay on average somewhat higher prices for their food than were paid by
other households; this preference was perhaps most marked for fresh fish,where there is a particularly wide range of varieties and prices, and for cream.
The difference between the two groups was, however, not so great for the
various types of meat, notwithstanding the range of choice available. For manyfoods the average price paid showed no regular gradation with age of housewife.Cream, however, provided an exception, and showed an upward gradation inprices with age, both for professional and for other households. This item
includes double and single cream and canned cream, three products with a
marked price differential. Cheese showed some tendency to follow the same
pattern. For eggs, flour and butter there was also an upward gradation with age
but little or no difference between professional and other households in average
prices paid. The prices paid for margarine, cooking fats and sugar, however,increased with age only throughout the working life. For potatoes and for breadthe prices tended to be least when the housewife was in the 35-44 age-band andthe size of family was at its greatest, thus providing opportunities for economiesof scale. Average prices paid for quick-frozen vegetables also followed thispattern but there was no clear gradation for fresh green vegetables. The moreexpensive kinds of biscuits were most favoured in middle age but the highestaverage prices paid for tea occurred after retirement.
Chapter 4
TYPES OF SHOP USED BY HOUSEWIVES FORTHEIR MAIN FOOD PURCHASES IN 1969
4.1 Introduction
74. Global statistics of the number, sizes, types and location of retail food outlets are usually compiled from information supplied by the outlets themselves
and therefore do not provide information about the characteristics of thehouseholds using different types of shop. In order to obtain some informationof this kind, participants in the National Food Survey throughout 1969 wereasked to give particulars about the kinds of shops from which they purchasedmost of their fresh meat, fresh vegetables, fresh fruit and groceries during theweek in which they were taking part in the Survey. To confine the inquiry topractical limits information was not obtained concerning the type of shop fromwhich each individual item was bought. The results which appear in the accom
panying tables are therefore circumscribed by the terms of the questionnaire and
cannot be used to determine the relative turnover of different kinds of shop.Nevertheless, they appear to be broadly compatible with the available statisticsof turnover, when account is also taken of the fact that the National Food Surveycovers only purchases made by private households.
4.2 Type of Shop Used by Housewives
75. The results of the inquiry given in Tables 27, 28 and 29 show the proportionof housewives in the country as a whole and in each of several categories (region,
type of area, income group, type of household) who do the bulk of their shoppingin co-operatives, multiples or independent shops. For the purpose of the inquiry,shops (other than co-operatives) which are part of a chain with ten or more
branches were considered to be multiples, and other shops (except co-operatives)were considered to be independents (including market stalls and groups ofindependent retailers who have voluntarily joined in a special trading arrangement with a wholesaler).
76. Geographical Differences. In Great Britain as a whole, about two out ofevery three housewives said they made most of their purchases of meat in
independent shops, about one in five in multiple shops and one in ten in co
operatives. Relatively more households in Scotland and in the North, Northwest and East Midlands of England purchased most of their meat in
co-operatives. The proportions of households using multiples for most of their
purchases of meat were as great as one household in four in the South-West andone in three in the South-East. Conversely, patronage of independent shops formain meat purchases in the Yorkshire and Humberside region, and in the
North-West, the West Midlands and in Scotland and Wales was well above the
national average.
77. The analysis by type of area indicates that the highest proportion of house
holds using co-operatives for most of their purchases of meat occurred in
provincial conurbations and large towns. The highest proportion using multiples
26
Types of Shop Used by Housewives for their Main Food Purchases in 1969 27
was in London and small towns, and the highest proportion using independentswas, as might be expected, in the more rural areas. Of the households usingmultiples for most of their purchases of meat, about half used self-service shops,and this proportion was fairly constant throughout Great Britain ; relatively fewof the co-operatives or independent butchers' shops were described as self-
service.
78. For fruit and vegetables, the broad pattern was similar to that for meat, butthere were differences in emphasis. Thus, in Scotland and the north of Englandthe proportion of households using co-operatives for their main purchases wasalso much greater than in Great Britain as a whole, though smaller than the
corresponding proportions for meat. The proportion using multiples was
greatest in Scotland and Wales and the proportion using independents greatest
in the Yorkshire and Humberside region and in the English Midlands. Self-service of fruit and vegetables was an important feature only in multiple shops.
79. Self-service, however, was a feature of over two-thirds of the shops used byhousewives for the purchase of most of their groceries; it was more common inco-operatives and in multiple shops than among the independents. About one-fifth of the households surveyed used co-operatives for most of their groceries,one-half used multiples and three-tenths used independent shops. The proportionreached about one-third for co-operatives in the North and in the East Midlandsof England, nearly two-thirds for multiple shops in the South-East and two-fifths for independent shops in the West Midlands. The proportion of households
using independent shops for their main grocery purchases varied inversely with
degree of urbanisation; the proportion using multiples and co-operatives was
greater in urban than in rural areas, but did not exhibit a regular gradation withtown size.
80. Income Group Differences. In the analysis by households classified accordingto the income of the head of the household (Table 28), the use of co-operativesfor most of the household purchases of meat, fruit, vegetables and groceries was
greatest among pensioner householders; that of multiples was greatest amongthe lower paid workers, and that of independents among the higher paid, butthese differences between the income groups were fairly small. There was littlevariation between income groups in the use of self-service shops.
81. Household Composition Differences. Table 29, which gives the results of the
analysis by type of household shows relatively little difference between house
hold types in the proportions using the various types of shop for most of their
purchases of meat, fruit, vegetables and groceries. There was a tendency for the
younger couples and the smaller families to make more than average use ofmultiple shops, for co-operatives to be most favoured by older households andfor independents to be most frequently patronized by larger families.
4.3 Food Expenditure and Average Prices Paid by Households
Classified According to Type of Shop Usedfor their Main Purchases
82. Tables 30 to 33 give details of average expenditure per household on differentkinds of foods and average prices paid by households classified according to
28 Household Food Consumption and Expenditure: 1969
type of shop in which they bought most of their meat, fruit, vegetables orgroceries during the week of survey. It must be emphasized that these details ofexpenditure and average prices paid relate to all purchases made by the house
holds concerned, not simply to those purchases made in the type of shop used
for most of their purchases, and take no account of the value of dividend or oftrading stamps. Thus, the only valid interpretation which can be placed on these
data is that, for example, considering the first line of Table 30, households whichbought most of their meat from self-service co-operative stores spent an averageof 61p per household per week on beef and veal (not all of it necessarily in thatkind of shop) and bought varieties of beef and veal which cost on average 32p
per lb. The differences down the columns of the table therefore do not necessarilyrelate to differences between different types of shop, but to different behaviourpatterns between the households using various types of shop for their mainpurchases. In any case, in each column the average expenditure per householdand the average prices paid show only comparatively small variation, which can
be associated with the composition and, to a lesser extent, incomes of the
families using each type of shop.
Chapter 5
ENERGY VALUE AND NUTRIENT CONTENTOF HOUSEHOLD FOOD CONSUMPTION
5.1 Introduction
83. The energy value and nutrient content of the food obtained for consumptionin households are estimated by applying appropriate conversion factors to the
quantities of foods itemised in the Survey(1). The nutrient conversion factors forminerals and vitamins were thoroughly revised for 1969. These factors makeallowance for the losses of thiamin and vitamin C which are likely to occur as a
result of cooking, and for inedible waste. The results therefore represent the
amounts of nutrients estimated to be available to members of the household forconsumption. They are expressed on a per caput basis and consequently the
estimates, for example of energy value for families with several children, are
invariably less than the corresponding estimates for wholly adult families because
of the children's relatively smaller need for energy.
84. These estimates of the quantities of nutrients available for consumption are
compared with, and expressed as percentages of, the intakes recommended bythe Department of Health and Social Security*3', the recommendations of theCommittee on Nutrition of the British Medical Association (1950) no longerbeing used. When making these comparisons the estimated nutritional contentof the food available for consumption (shown in Tables 34 to 40) is reduced byan arbitrary 10 per cent to allow for plate wastage, spoilage and other losses,
including scraps which may be fed to pets. Household needs are assessed afterallowances have been made for the age, sex and occupation of each of the
members of the household, for the number and type of meals eaten by them
away from home, and for the presence of visitors. (Further details of methodology are given in Appendix A, paragraphs 16 to 22.)
85. The recommended intakes of nutrients are defined as the amounts sufficientor more than sufficient for the nutritional needs of practically all healthy personsin a population, and are therefore necessarily in excess of the requirements ofmost individuals. The 1969 Report on Recommended Intakes of Nutrients'2'states: "If an individual is taking more of a nutrient than the recommendedintake, he is almost certainly obtaining more than he requires ; but if the average
intake of a group is greater than the recommendation one cannot be sure thatthere is no malnutrition because of uncertainty about the distribution of intakeswithin the group. Equally, it is not legitimate to deduce the presence of malnutrition in a population merely on the basis of the results of a survey in whichthe average intake of a nutrient is less than the recommendation. But malnutrition is more likely to be present the further average intakes fall below the
recommendations."
'" Among the foods excluded from the Surveys are sweets, alcoholic drinks and food eatenin restaurants and other catering establishments. (See General Note in Glossary.)
(a) Department of Health and Social Security. Recommended Intakes of Nutrients for theUnited Kingdom. Reports on Public Health and Medical Subjects No. 120, HMSO, 1969.
29
30 Household Food Consumption and Expenditure: 1969
86. The recommendations for energy are equated with average requirements andrelate to groups of individuals rather than individuals themselves. In this respect
they differ from the recommendations for nutrients. The Report on Recommended Intakes of Nutrients'" assumes that the individuals are healthy andable to obtain the necessary diet. It states: "In a healthy community where there
is no economic bar to obtaining palatable diets, appetite determines the distribution of energy intakes roughly in accordance with the varied needs of the individuals in a group. Therefore, provided the average observed energy intake isequal to the recommended intake for the group, and many people are notobtaining more than their requirements, few are likely to obtain less than theyneed, even though about half the individuals must of necessity obtain less
energy than the average. If the average intake is appreciably greater than thatrecommended then, unless levels of activity have been underestimated, several
are obtaining superfluous energy and are likely to become obese. Conversely, ifthe average intake is less than that recommended then, unless activity has been
overestimated, undernutrition is present and some individuals will lose weight,or reduce their activity, or do both."
87. Further discussion of the purpose and use of the recommendations is givenin the report, which points out that they may be used in conjunction with surveys
of food consumption for the identification of potential nutritional problems thatmerit investigation. Although they are a useful supplement to clinical and otherstudies they cannot be used alone for the assessment of nutritional status or forthe detection of malnutrition in individuals. The report also emphasizes thatrecommendations for intakes of nutrients can be made only by the exercise ofjudgment on limited data, and that in consequence they can only be provisionaland are subject to future revision in the light of new knowledge.
5.2 National Averages
88. Nutritional estimates for the years 1964 to 1969 are given in Table 34. Theenergy value of the average household diet has shown little change during thisperiod, and in 1969 was recorded as 2570 kcal (10-8 MJ) per person per day, 9
per cent in excess of the recommended intake. Table 35 shows that three quartersof this energy was provided about equally by meat (16 per cent), bread, flour and
other cereals, and fats (15 per cent each) and by milk, cream and cheese (14 per
cent). Sugar (bought as such) and preserves provided 1 1 per cent.
89. The relative contributions of protein, fat and carbohydrate to the energyvalue of the diet are shown in part (iii) of Table 34. The intake of fat rose in
1969 to its highest value in this time series, providing on average 42 per cent ofthe energy of the diet; there was a corresponding fall in the value for carbohydrate. The series demonstrates the relative constancy of the contribution ofprotein; although the total protein intake in 1969 was slightly less than in 1968,
chiefly because of the smaller bread consumption, the intake of animal proteinwas maintained, so that the proportion of protein of animal origin reached a
u> Department of Health and Social Security. Recommended Intakes of Nutrients for theUnited Kingdom. Reports on Public Health and Medical Subjects No. 120, HMSO, 1969.
Energy Value and Nutrient Content of Household Food Consumption 31
new high level of 62-5 per cent. Total protein intake exceeded on average
the recommended intake by just over a quarter, but was nearly twice the
minimum requirement which is based on an assessment of strict physiologicalneed.
90. In 1969 the average iron intake showed a further small fall, partly because
of the reduced bread consumption, to a level 21 per cent above the recommendedintake. About half the reported decrease between 1968 and 1969 in thiaminintake was due to the revision of the conversion factors; of the average dailyconsumption in 1969 of 1 • 17 mg per person, bread provided almost a quarter(partly because of the policy of fortification of flour with this vitamin), andvegetables and meat each rather less than one-fifth (Table 35). Of the totalnicotinic acid in the average diet (16 -2 mg per person daily in 1969), thatderived naturally from cereals is deemed to be unavailable to man; makingallowance for this, and for the fact that the amino acid tryptophan is convertedin the body to this vitamin, the nicotinic acid equivalent of the diet in 1969 was29 •4 mg (see Appendix A, paragraph 18). This amount has not varied duringthe period under review, and in 1969 was 90 per cent greater than the recommended intake. The average vitamin A content of the diet throughout the periodhas remained at double the recommended intake: in 1969 it amounted to1360 [xg retinol equivalent, 910 (xg being provided by retinol itself from animal
products and the remainder derived from the 2110 fig of (3-carotene, suppliedchiefly by vegetables and fruits but also by milk and its products and by margarine (see Table 35 and Appendix A, paragraph 18).
91. Most of the reported decline in vitamin D consumption between 1968 and1969 was due to revision of the conversion factors for the vitamin D content offatty fish. This vitamin is found in relatively few foods : of the 2 ■9 y.g in the
average diet in 1969, 31 per cent was supplied by margarine, which is fortifiedwith this nutrient, and 19 per cent by fatty fish; other chief sources were eggs (17per cent), butter (1 1 per cent), and milk and its products — some of which are
also fortified —(10 per cent). The average diet provided 84 per cent of the recommended intake, but the Survey does not record welfare and pharmaceuticalsources of vitamin D, and the report on Recommended Intakes'1' stressed thatmost adults require no dietary vitamin D since they obtain all they need fromthe action of sunlight on the skin. An average intake below that recommendedtherefore does not necessarily signify that there is any lack of vitamin D in the
diet.
92. The nutritional composition of the average household diet appears to be
very stable and any changes are slight and slow. This is especially noticeablewhen the concentration of nutrients is expressed in terms of energy, as in section
(v) of Table 34. Ways in which such figures may be interpreted were discussed
in the Annual Report for 1967, paragraph 104 and elsewhere. It was pointed outthat comparing them with the recommended intakes, similarly expressed, fordifferent categories of individual, directs attention to those types of person, andto those nutrients, that deserve consideration from the points of view of nutritioneducation and of national nutrition policy.
(1>In its paragraph 125 —see footnote (2) to paragraph 84.
32 Household Food Consumption and Expenditure: 1969
5.3 Geographical Differences
93. Regional and type of area variations in the energy value and nutrient contentof household food consumption in 1969 are shown in Table 36. Although thesample for any one year cannot be fully representative of a given region thevariations shown in this table are in general conformity with the pattern shownin previous years(1). Details of the consumption of particular foods in thevarious regions and types of area are given in Table 15, and the characteristicfood patterns discussed in paragraph 52. Variations in nutrient intake arerelatively much smaller and are further reduced when the average intakes areexpressed as percentages of the recommended intakes.
94. The regional analysis indicates that the diet in the north of England provided less energy, protein, calcium, riboflavin and vitamin C than that in anyother part of the country, and was also relatively low in most other nutrientsexcept iron. Of the different types of area, rural districts showed the highestintake of energy and of most nutrients except animal protein, nicotinic acid
equivalent and vitamin C (for which intakes were highest in the London conurba
tion) and retinol equivalent (highest in smaller towns).
95. The London diet derived more of its energy from protein and fat, and less
from carbohydrate, than did that of any other type of area or region. Indeed the
contribution of fat was equal to that of carbohydrate —44 per cent, and two-thirds of the protein was of animal origin —more than elsewhere. In these
respects Scotland and Wales fared less well than the English regions, though inall areas average intakes of all nutrients (except vitamin D— see paragraph 91)exceeded those recommended.
5.4 Income Group Differences
96. Table 37 shows the energy value and nutrient content of the diet of house
holds in different income groups. Although the energy value increased from
group Al to group C the corresponding recommended intakes for energy
increased likewise, because of the decreasing proportion of occupations ofhousehold members classified as sedentary, and also because of the increasingproportion of meals consumed at home; the extent to which estimated intakes
of energy met the recommendations therefore remained relatively constant
(part (ii) of table). Maximum energy and carbohydrate values were recorded for
pensioner households, but it is known that their purchases of certain storable
foods, particularly flour and sugar, are abnormally high during the survey week
(see Appendix A, paragraph 13).
97. The food patterns characteristic of the two extremes of the income range
(see paragraph 57) resulted in households in group Al obtaining on average
markedly more animal protein (nearly 70 per cent of total protein), fat, calcium,
riboflavin, nicotinic acid equivalent and (especially) vitamin C, and less carbo
hydrate, iron and thiamin, than those in groups C and Dl. The diet of group Al
(1) For fuller discussion see Household Food Consumption and Expenditure: 1965, Table 28
and paragraphs 59 to 69, HMSO, 1967.
Energy Value and Nutrient Content of Household Food Consumption 33
was also the most concentrated, in terms of the amount of nutrients (all except
carbohydrate) provided for a given energy intake (see part (v) of Table 37), andthe cost per calorie was substantially higher than for the other groups (see Table
16). For all groups the average diet provided nutrients in excess of the recommendations, apart from vitamin D for which dietary sources alone did not meet
the recommended intake (see paragraph 91), except for pensioner households.
5.5 Household Composition Differences
98. Table 38 shows the energy value and nutrient content of the household foodconsumption of households of different composition. With increasing numbersof children in the family the average energy value of the diet showed a gradationfrom 3,140 kcal (13-1 MJ) per person per day for younger childless couples to2,140 kcal (9 0 MJ) in families with four or more children. The per caput intakeof protein and other nutrients also declined as the family size increased andlarge families had the lowest per caput intake of all nutrients. Older childlesscouples had the highest vitamin D intake, because of their relatively largeconsumption of fish and margarine. With this exception, highest per caputintakes of nutrients were found with the younger childless couples. In the dietof these households fat and carbohydrate each supplied approximately 44 per
cent of the energy value, while for the largest families fat provided 38 per cent
and carbohydrate 50 per cent.
99. Intakes are expressed on a per caput basis and children have smallerabsolute needs for energy and most nutrients than have adults. Thus the
recommended intakes for most nutrients for families with children are less thanthose for wholly adult households, and the differences between the varioushouseholds are reduced when the estimates of nutrient intake are expressed as
percentages of the recommended intakes. Lowest percentages are found infamilies with three or more children or with adolescents and children, but the
diets of all types of household appear to contain on average ample quantitiesof all nutrients, except vitamin D in households containing children. Therecommended intake for vitamin D is attained on average in wholly adulthouseholds, and those containing adolescents but no children, where requirements are lower. This situation may partly reflect the hypothesis that the recommended intake for vitamin D for young children is too high: many may obtainsubstantially less from their diet without apparent ill health(1).
5.6 Family Composition Differences within Income Groups
100. The relative influences of household composition and of income group onthe nutritional characteristics of family diets are shown in Table 39. The extreme
range of per caput daily energy values is from 3,280 kcal (13 -7 MJ) for childlesscouples in income group C & Dl to about 2,000 kcal (8-4 MJ) for families with3 or more children in group A. The variation in per caput nutrient intakesbetween families of different size for each of the three income groups is much
(1>Ministry of Health. A pilot survey of nutrition of young children in 1963. Reports onPublic Health and Medical Subjects No. 118, HMSO, 1968. Cf. paragraph 124 of Recommended Intakes of Nutrients for the United Kingdom, see footnote (2) to paragraph 84 above.
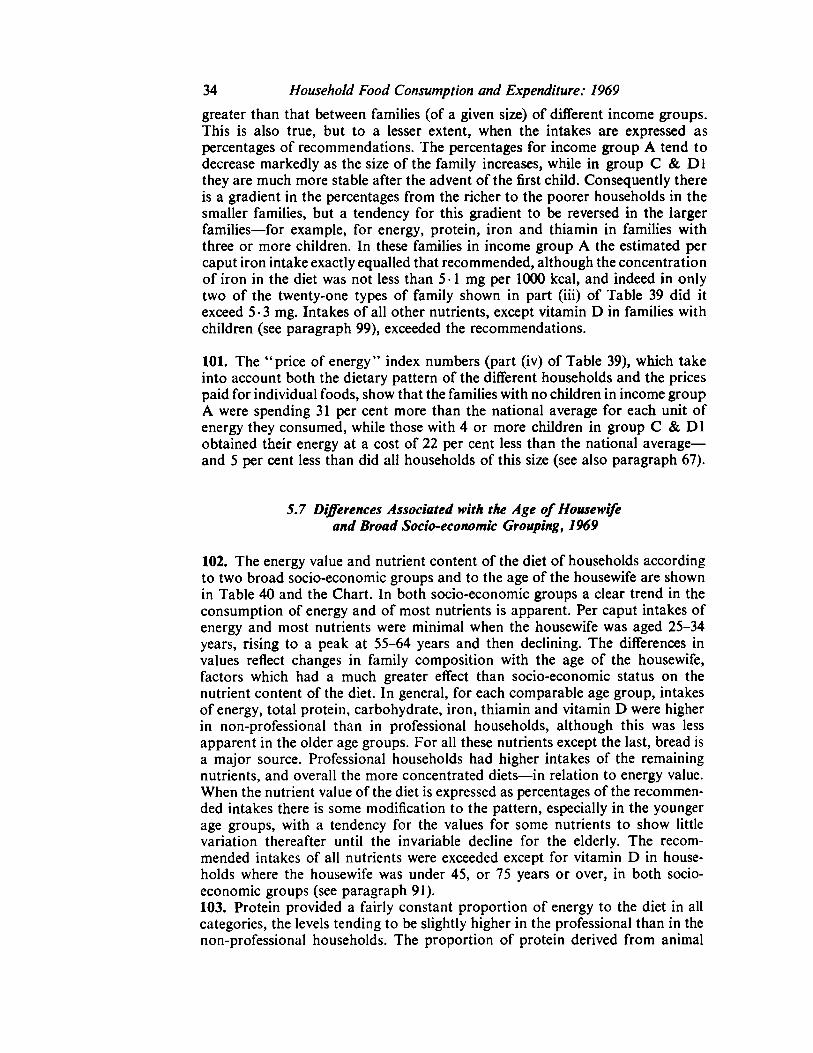
34 Household Food Consumption and Expenditure: 1969
greater than that between families (of a given size) of different income groups.This is also true, but to a lesser extent, when the intakes are expressed as
percentages of recommendations. The percentages for income group A tend todecrease markedly as the size of the family increases, while in group C & Dlthey are much more stable after the advent of the first child. Consequently thereis a gradient in the percentages from the richer to the poorer households in thesmaller families, but a tendency for this gradient to be reversed in the largerfamilies —for example, for energy, protein, iron and thiamin in families withthree or more children. In these families in income group A the estimated percaput iron intake exactly equalled that recommended, although the concentrationof iron in the diet was not less than 51 mg per 1000 kcal, and indeed in onlytwo of the twenty-one types of family shown in part (iii) of Table 39 did itexceed 5 •3 mg. Intakes of all other nutrients, except vitamin D in families withchildren (see paragraph 99), exceeded the recommendations.
101. The "price of energy" index numbers (part (iv) of Table 39), which takeinto account both the dietary pattern of the different households and the pricespaid for individual foods, show that the families with no children in income groupA were spending 31 per cent more than the national average for each unit ofenergy they consumed, while those with 4 or more children in group C & Dlobtained their energy at a cost of 22 per cent less than the national average —and 5 per cent less than did all households of this size (see also paragraph 67).
5.7 Differences Associated with the Age of Housewifeand Broad Socio-economic Grouping, 1969
102. The energy value and nutrient content of the diet of households accordingto two broad socio-economic groups and to the age of the housewife are shown
in Table 40 and the Chart. In both socio-economic groups a clear trend in the
consumption of energy and of most nutrients is apparent. Per caput intakes ofenergy and most nutrients were minimal when the housewife was aged 25-34
years, rising to a peak at 55-64 years and then declining. The differences invalues reflect changes in family composition with the age of the housewife,
factors which had a much greater effect than socio-economic status on the
nutrient content of the diet. In general, for each comparable age group, intakesof energy, total protein, carbohydrate, iron, thiamin and vitamin D were higherin non-professional than in professional households, although this was less
apparent in the older age groups. For all these nutrients except the last, bread is
a major source. Professional households had higher intakes of the remainingnutrients, and overall the more concentrated diets—in relation to energy value.
When the nutrient value of the diet is expressed as percentages of the recommen
ded intakes there is some modification to the pattern, especially in the younger
age groups, with a tendency for the values for some nutrients to show little
variation thereafter until the invariable decline for the elderly. The recom
mended intakes of all nutrients were exceeded except for vitamin D in house
holds where the housewife was under 45, or 75 years or over, in both socioeconomic groups (see paragraph 91).103. Protein provided a fairly constant proportion of energy to the diet in all
categories, the levels tending to be slightly higher in the professional than in the
non-professional households. The proportion of protein derived from animal

Energy Value and Nutrient Content of Household Food Consumption 35
sources was markedly higher at all ages in the professional group. Non-professional households obtained a greater amount of energy from carbohydratethan professional households, and a smaller amount from fat. In the olderprofessional families, where the housewife was aged 55-74 years, fat was a
slightly more important energy source than was carbohydrate. The only nutrientto show markedly different patterns of consumption in the two groups was
vitamin C of which the older professional families obtained distinctly more than
the others (see Chart).
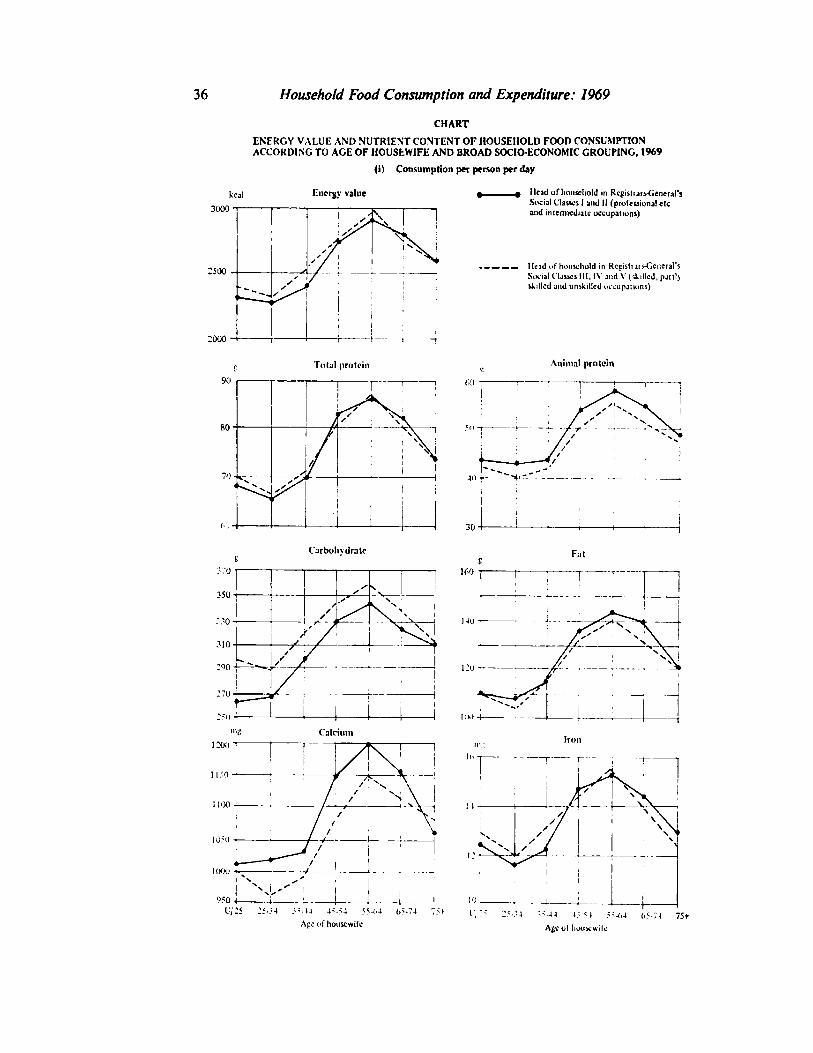
36 Household Food Consumption and Expenditure: 1969
CHART
ENERGY VALUE AND NUTRIENT CONTENT OF HOUSEHOLD FOOD CONSUMPTIONACCORDING TO AGE OF HOUSEWIFE AND BROAD SOCIO ECONOMIC GROUPING, 1969
(i) Consumption per person per day
Energy value
30(n
:oou
Meadof householdin Registrars-General'sSocialClassesI andII (professionaletcandintermediateoccupations)
Meadof householdin Rcgistrari-Gcncral'sSocialClassesIII, IV andV (skilled,partlyskillcdandunskilledoccupations)
Total protein Animal protein
1~ 1"
CarbohydrateFat
////////
J
Iron
If
'/sf \\\ \\ '\
t
/ /S J
U/25 25-34 35-44 45-54 55-(»4 65-74 75t L;:5 2^A 35-44 45-54 55*4 (>5-74 75*Ageof housewife Ageol liotiscwifo
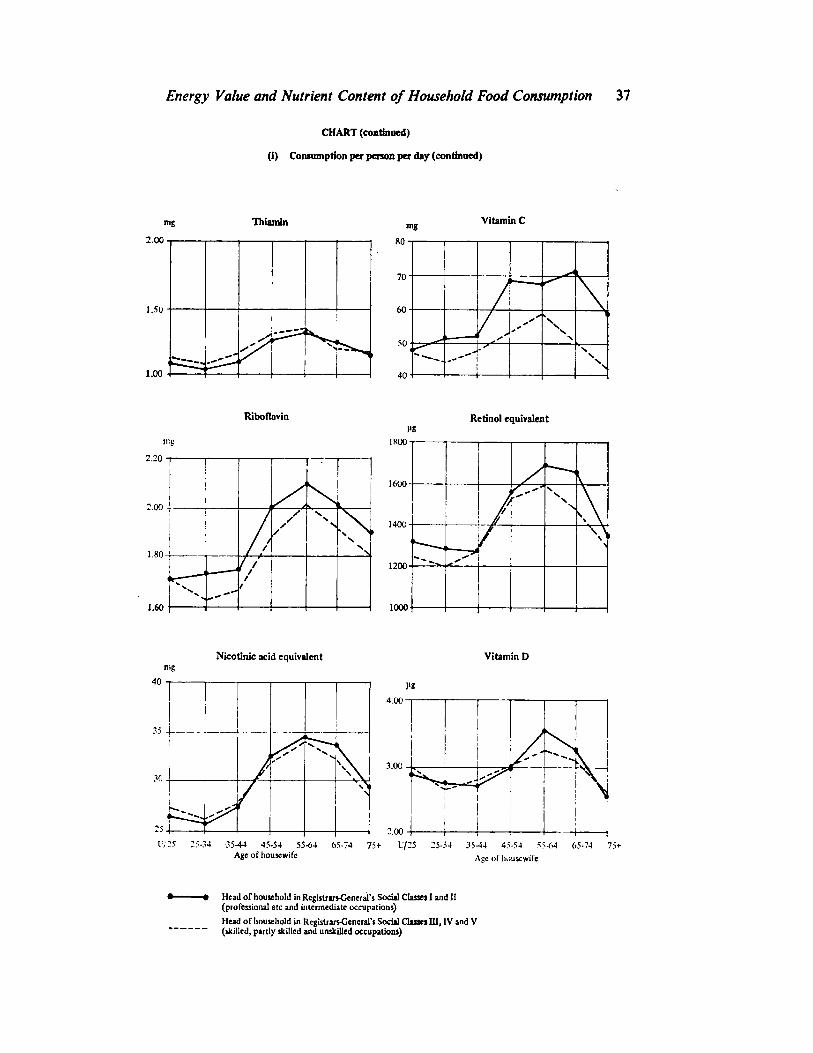
Energy Value and Nutrient Content of Household Food Consumption
CHART (continued)
(i) Consumption per person per day (continued)
Thiamin Vitamin C
2.00
1-50
1.00
Riboflavin
2.20
: oo
1.80
1.60
Retinol equivalent
1400
1000
///
//N.
N\ \\ \"A
>
Nicotinic acid equivalent Vitamin D
n
U/25 25-34 35-44 45-54 55-64 65-74 75+ U/25 25-34 35-44 45-54 55-64 65-74 7Age of housewife Ageof housewife
Headof householdinRegistrars-General'sSocialClassesI andII(professionaletcand intermediateoccupations)
Headof householdin Registrars-General'sSocialClassesIII, IV andV(skilled,partly skilledandunskilledoccupations)

38 Household Food Consumption and Expenditure: 1969
CHART (continued)
(H) Consumption as a percentage of recommended intake
Meadof householdin Registrars-General'sSocialClassesI andII (professionaletcandintermediateoccupations)
Meadof householdin Registrars-General'sSocialClassesIII, IV andV (skilled,partlyskilledandunskilledoccupations)
U/25 25-34 35-44 45-54 55-64 65-74 75+
Age of housewife
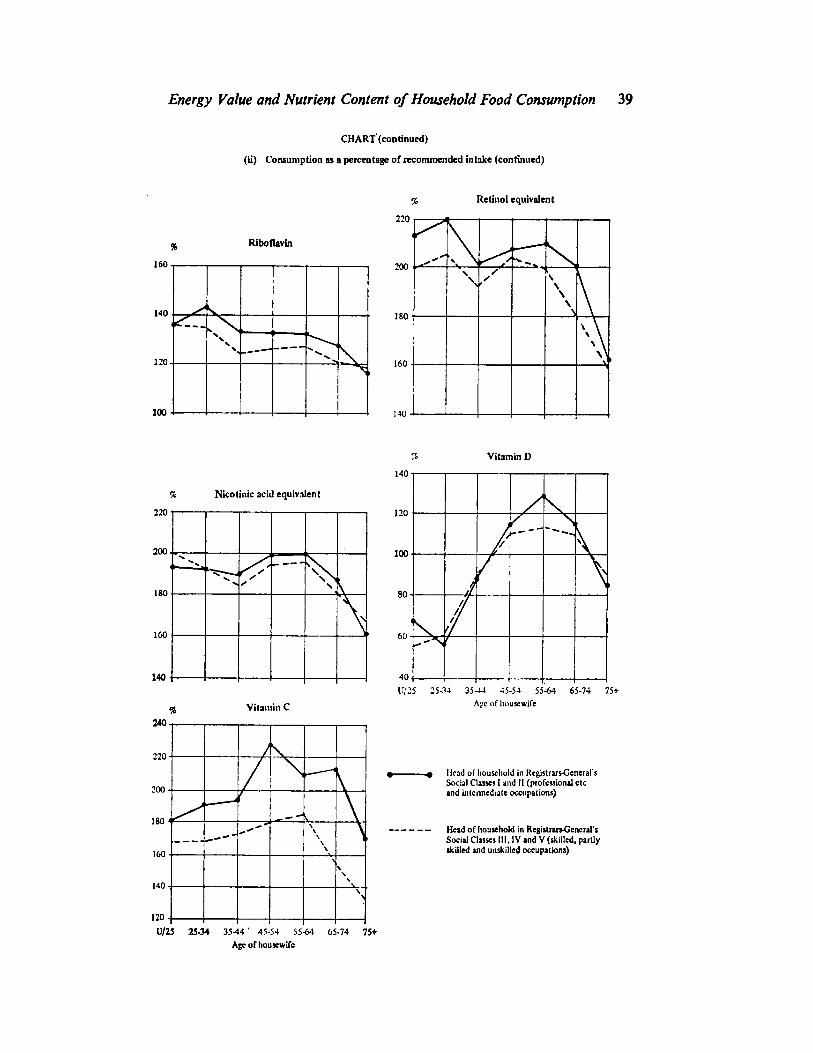
Energy Value and Nutrient Content of Household Food Consumption 39
CHART(continued)
(ti) Consumption as a percentage of recommended intake (continued)
Riboflavin
160
140
i:o
100
Retinol equivalent
200
Vitamin D
% Nicotinic acid equivalent
100
160
140
340
\\\\ >\*«
Vitamin C
180
140
120
\\\\V
\\ \ \\>
140
120
100
80
40
// \
ft////
////
U/25 25-34 35-14 45-54 55-64 65-74 75+
Ageof housewife
Headof householdin Registrars-General'sSocialClassesI andII (professionaletcandintermediateoccupations)
Meadof householdin Registrars-General'sSocialClassesIII, IV andV (skilled,partlyskilledandunskilledoccupations)
U/25 25-34 35-44'
45-54 55-64 65-74 75+
Ageof housewife

Chapter 6
PRELIMINARY ESTIMATES OF HOUSEHOLDFOOD CONSUMPTION, EXPENDITURE
AND PRICES IN 1970
104. Summary data from the Survey in 1970 have been published in theMonthly Digest of Statistics and in Trade and Industry. Detailed nationalaverages for the full Survey classification of foods are given in Tables 41 to 45
of this Report(1>.
105. Average food expenditure per head in private households in Great Britainwas estimated to be £2- 11 per person per week in 1970, compared with £2 00 in1969 and £1 -89 in 1968. The corresponding estimates for each quarter of these
years are given in Table 5.
Table 5
Household Food Expenditure
(£ per person per week)
1968 1969 1970Percentage change
1968
to 19691969
to 1970
1st Quarter2nd Quarter3rd Quarter4th Quarter
1-851-911-91
1-95 2-022-132-112-16
+ 5-8+ 5-5+ 4-3+ 6-7
+ 3-4+ 5-6+ 5-9+ 6-41-90
2-021-99203
Yearly average . 1-89 200 2-11 + 5-5 + 5-4
106. The increase of lip in average weekly food expenditure between 1969 and
1970 was apportioned between the main food groups as follows:meat and meat products 4£p, fish £p, fats £p, potatoes lp, other vegetables and
vegetable products lp, bread and flour l£p, other cereal products ^p, beverages
^p, all other food lp
107. Of the average increase in expenditure of lip, over 9£p was absorbed by
price changes (an average increase of 4 •6 per cent over the year). Of this increase
of 4-6 per cent, nearly one-third is attributable to increased prices for meat andmeat products, one-fifth to cereal products (particularly bread) one-seventh toliquid milk and one-ninth to vegetables (particularly potatoes and vegetable
products).
w These estimates were derived from an effective sample of 7,540 households and, as usual,were formed as weighted averages of the results for each of the six types of area (see Glossary),the weights being proportionate to the respective populations. There was a break in fleldworkfrom 23 May to 21 June 1970 while the General Election campaign was in progress, andcertain adjustments have been made to the results to compensate for the loss of informationduring this period.
40
Preliminary Estimates for 1970 41
108. The remainder of the increase (nearly l^p) represented a net increase of0 -6 per cent in the real value (at constant prices) of food purchases per head.
The real value of purchases of convenience foods rose by 2 •3 per cent, morethan offsetting a fall of 1 ■6 per cent in that of milk and seasonal foods.
109. Average consumption of liquid milk declined slightly from 4 •9 to 4 •6 pintsper person per week, but there was a further small increase in consumption ofinstant milk and yoghurt. Consumption of natural cheese increased further to3 ■25 oz per person per week, while that of processed cheese remained steady at0-34 oz.
110. Slight increases in consumption of beef and pork, to 7-80 oz and 2 -83 ozrespectively, were partly offset by a further fall in average consumption of muttonand lamb to 5 •25 oz per week. There were further small increases in consumptionof bacon, poultry, canned meats, and meat products.
111. Average consumption of fish declined from 5 •5 oz per person per week to5 •4 oz, a further small decrease in consumption of fresh white fish and of cannedsalmon being only partly offset by a small increase in purchases of quick-frozenfish and quick-frozen fish products. Consumption of eggs was fully maintainedat an average of 4 •66 eggs per person per week.
112. Average purchases of fats increased from 11-8 oz per person per week to12 0 oz despite a recorded fall in average consumption of butter from 6 15 ozto 5 ■99 oz per week. Purchases of margarine increased from 2 •78 oz to 2 •86 ozper person per week and those of lard and compound cooking fats and ofvegetable and salad oils also showed increases. Household purchases of sugaralso showed a moderate increase in 1970 after exhibiting a generally downwardtrend for some years. Average consumption of preserves however, continued todecline.
113. Consumption of potatoes averaged 52 oz per person per week in 1970,
compared with 49 oz in 1969 and 52 oz in 1968; average consumption of cabbages, brussels sprouts and cauliflowers also rose in 1970, but there was littlechange in average consumption of other fresh vegetables. There was some slightincrease in purchases of quick-frozen vegetables (other than peas) and of canned
peas and canned beans.
114. Consumption of apples, pears and soft fruit increased but that of oranges,bananas, rhubarb and tomatoes declined slightly. Overall, the average weight offresh fruit consumed remained at just over 23 oz per person per week, but there
was a slight decline in purchases of canned fruit.
115. The average consumption of bread as recorded by the Survey was slightlyhigher than in 1969, but this apparent reversal of the downward trend noted inearlier years can be attributed to a sampling variation in the third quarter of1970. Purchases of flour also rose slightly in 1970 against the previous downwardtrend, but purchases of cakes and pastries continued to decline, while those ofbiscuits remained steady. Consumption of breakfast cereals continued toincrease and purchases of canned milk puddings recovered to the average of1 - 7 oz per person per week recorded in 1968.
42 Household Food Consumption and Expenditure: 1969
116. Average purchases of instant coffee increased further and those of coffeeessences again declined ; consumption of tea remained at just over 2^ oz perperson per week. There was some further increase in purchases of canned soupsand of pickles and sauces.
117. Changes between 1969 and 1970 in the nutrient content of the average dietwere small (Table 45). The energy value of the diet reached 2600 kcal (10-9MJ) per person per day in 1970, that is 1 1 per cent in excess of the recommendedintake, the highest level recorded in the last decade. It can be seen that thepercentages of energy derived from protein, carbohydrate and fat remainedfairly stable, despite slight rises in the average consumption of sugar, fats,bread and flour and potatoes. However, the slight fall in the percentage of fatand the corresponding slight rise for carbohydrate are the first breaks in trendsthat have continued for many years. Small increases in the average intake ofiron and thiamin and in the nicotinic acid equivalent of the diet in 1970 areconsistent with an upward trend in the overall consumption of meat and meatproducts and increased purchases of bread and flour. The average diet continuedto provide 84 per cent of the recommended intake of Vitamin D, but welfare andpharmaceutical sources of this vitamin are not included in the Survey (see alsoparagraph 91).

PART II

Tables of Average Consumption, Expenditure
or Prices relating to All Households in the
National Food Survey Sample, 1969
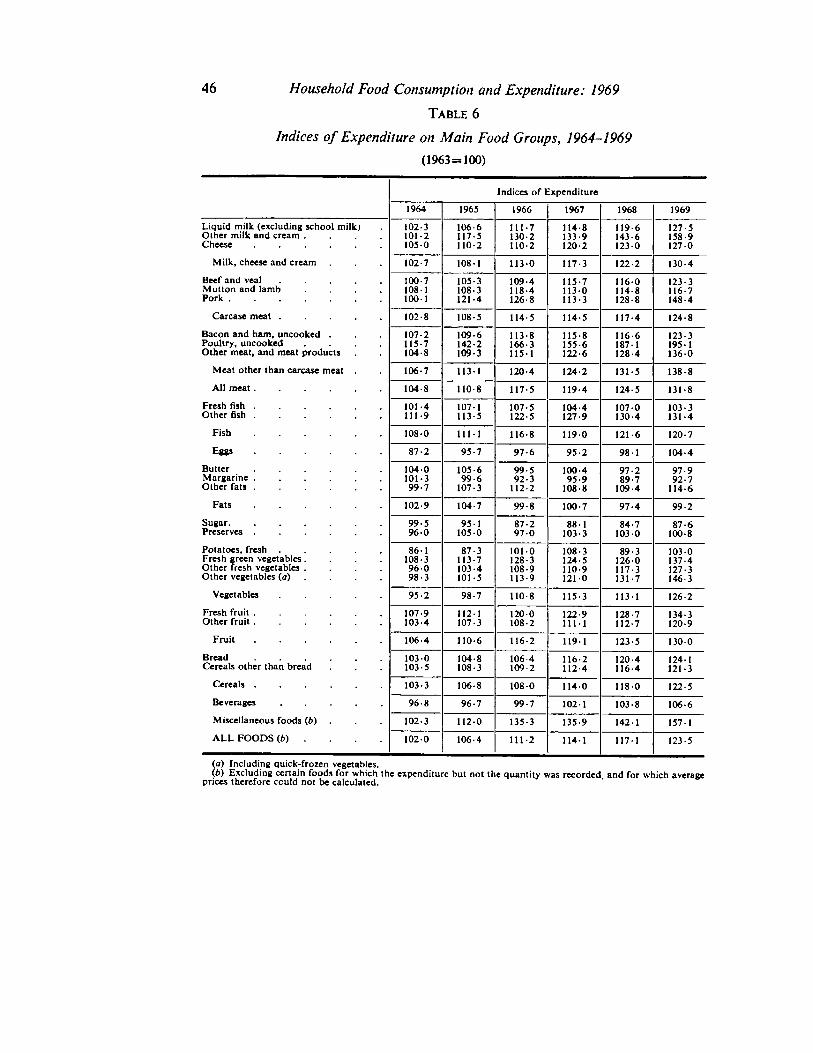
46 Household Food Consumption and Expenditure: 1969
Table 6
Indices of Expenditure on Main Food Groups, 1964-1969
(1963 = 100)
Indices of Expenditure
1964 1965 1966 1967 1968 1969
Liquid milk (excluding school milk)Other milk and cream ....Cheese
102-3101-2105-0
106-6117-5110-2
111-7130-2110-2
1148133-9120-2
119-6143-61230
127-5158-91270
Milk, cheese and cream 102-7 108-1 113-0 117-3 122-2 130-4
Beef and veal .....Mutton and lamb ....Pork
100-7108-11001
105-3108-3121-4
109-4118-4126-8
115-71130113-3
1160114-8128-8
123-3116-7148-4
Carcase meat 102-8 108-5 114-5 114-5 117-4 124-8
Bacon and ham, uncooked . 107-2115-7104-8
109-6142-2109-3
113-8166-3115-1
115-8155-6122-6
116-6187-1128-4
123-3195-1136-0
Poultry, uncooked ....Other meat, and meat products
Meat other than carcase meat . 106-7 113-1 120-4 124-2 131-5 138-8
All meat 1048 110-8 117-5 119-4 124-5 131-8
Fresh fish 101-4111-9
107-1113-5
107-5122-5
104-4127-9
1070130-4
103-3131-4Other fish
Fish 1080 111-1 116-8 1190 121-6 120-7
Eggs 87-2 95-7 97-6 95-2 98-1 104-4
Butter 1040101-399-7
105-699-6
107-3
99-592-3
112-2
100-495-9
108-8
97-289-7
109-4
97-992-7
114-6Margarine ......Other fats
Fats 102-9 104-7 99-8 100-7 97-4 99-2
Sugar 99-5960
95- 1 87-2970
88-1103-3
84-7103-0
87-6100-8Preserves 1050
Potatoes, fresh .....Fresh green vegetables....Other fresh vegetables....Other vegetables (a)
86-1108-396098-3
87-3113-7103-4101-5
1010128-3108-9113-9
108-3124-51109121-0
89-3126-0117-3131-7
1030137-4127-3146-3
Vegetables ..... 95-2 98-7 110 8 115-3 113-1 126-2
Fresh fruit 107-9103-4
1121107-3
120-0108-2
122-9111-1
128-7112-7
134-3120-9Other fruit
Fruit 106-4 1106 116-2 119-1 123-5 130-0
Bread 103 0103-5
104-8108-3
106-41092
116-2112-4
120-4116-4
124-1121-3Cereals other than bread
Cereals ...... 103-3 106-8 1080 114-0 1180 122-5
Beverages ..... 96-8 96-7 99-7 102- 1 103-8 106-6
Miscellaneous foods (6) . 102-3 112-0 135-3 135-9 142- 1 1571
ALL FOODS (o) .... 102-0 106-4 111-2 114-1 117-1 123-5
(a) Including quick-frozen vegetables.(4) Excluding certain foods for which the expenditure but not the quantity was recorded and for which average
prices therefore could not be calculated.
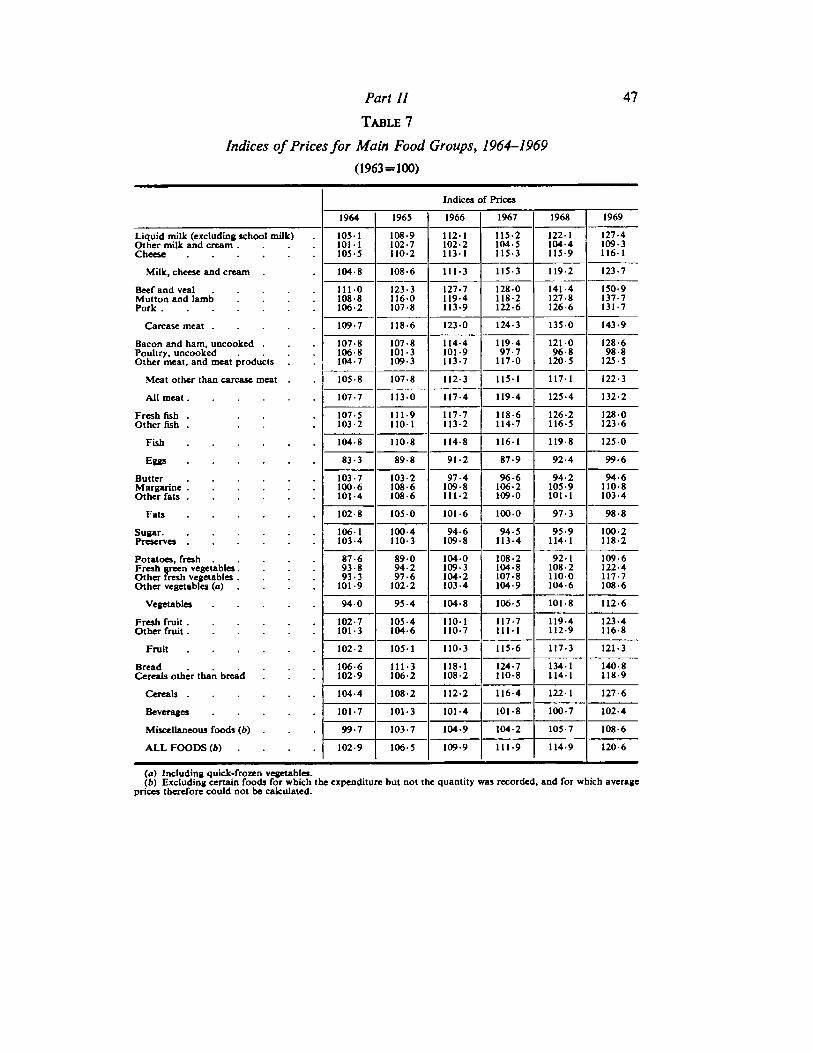
Part II 47
Table 7
Indices of Prices for Main Food Groups, 1964-1969
(1963=100)
Indices of Prices
1964 1965 1966 1967 1968 1969
Liquid milk (excluding school milk)Other milk and cream .... 105- 1
101-1105-5
108-9102-7110-2
112-1102-21131
115-2104-51153
122- 1 127-4109-3104-4
115-9 116-1
Milk, cheese and cream 104-8 108-6 111-3 115-3 119-2 123-7
Mutton and lamb ....Pork
111-0108-8106-2
123-3116-0107-8
127-7119-4113-9
1280118-2122-6
141-4127-8126-6
150-9137-7131-7
109-7 118-6 1230 124-3 135-0 143-9
Bacon and ham, uncooked . 107-81068
107-8101-3109-3
114-4101-9113-7
119-497-7
117-0
121-096-8
120-5
128-698-8
125-5Poultry, uncooked ....Other meat, and meat products 104-7
Meat other than carcase meat 105-8 107-8 112-3 115-1 117-1 122-3
107-7 113-0 117-4 119-4 125-4 132-2
Fresh fish . 107-5103-2
111-91101
117-7113-2
118-6114-7
126-2116-5
128-0123-6Other fish . .
Fish 104-8 110-8 114-8 116-1 119-8 125-0
Egg* 83-3 89-8 91-2 87-9 92-4 99-6
103-7100-6101-4
103-2108-6108-6
97-4109-8111-2
96-6106-2109-0
94-2105-9101-1
94-6110-8103-4
1028 105-0 101-6 100-0 97-3 98-8
106-1103-4
100-4110-3
94-6109-8
94-5113-4
95-91141
100-2118-2
Fresh green vegetables....Other fresh vegetables....Other vegetables (a)
87-693-893-3
101-9
89-094-297-6
102-2
104-0109-3104-2103-4
108-2104-8107-8104-9
92- 1108-21100104-6
109-61224117-7108-6
94-0 95-4 104-8 106-5 101-8 112-6
102-7101-3
105-4104-6
1101110-7
117-7111-1
119-4112-9
123-4116-8
Fruit 102-2 105- 1 110-3 115-6 117-3 121-3
Bread 106-6102-9
111-3106-2
1181108-2
124-7110-8
1341114-1
140-8118-9Cereals other than bread
104-4 108-2 112-2 116-4 122- 1 127-6
101-7 101-3 101-4 101-8 100-7 102-4
Miscellaneous foods (ft) 99-7 103-7 104-9 104-2 105-7 108-6
ALL FOODS (6) .... 102-9 106-5 109-9 111-9 114-9 120-6
(a) Including quick-frozen vegetables.(ft) Excluding certain foods for which the expenditure but not the quantity was recorded, and for which average
prices therefore could not be calculated.
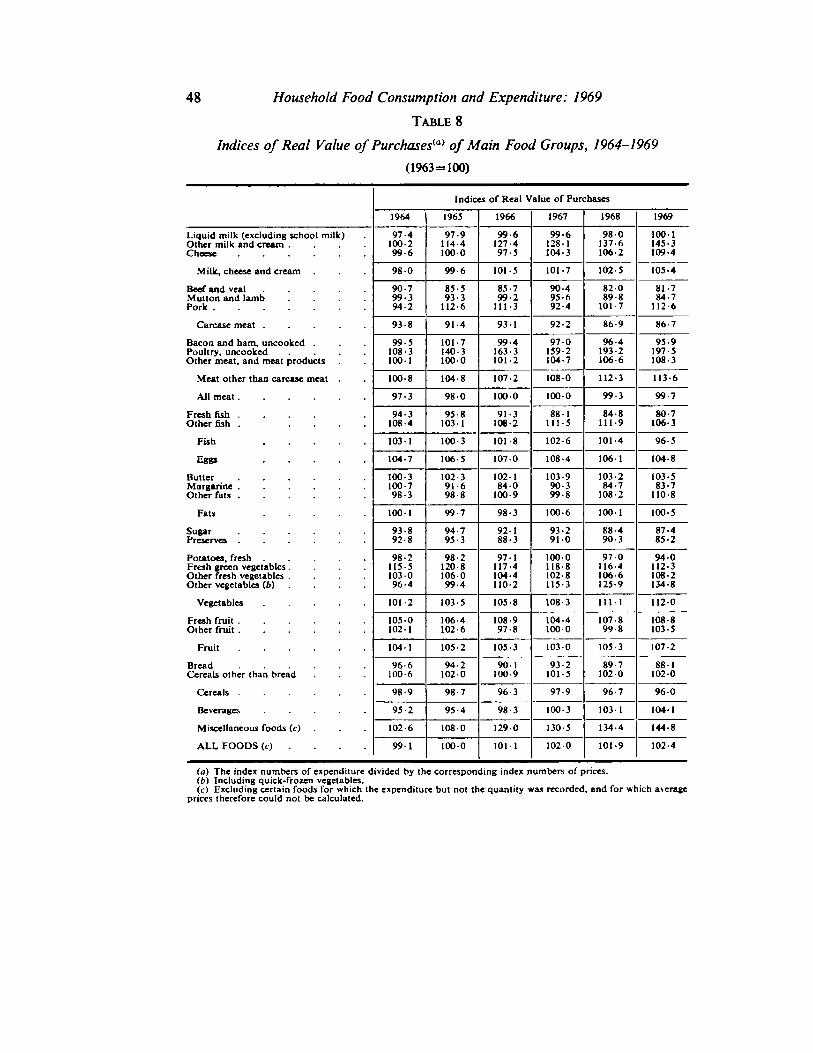
48 Household Food Consumption and Expenditure: 1969
Table 8
Indices of Real Value of Purchasesia) of Main Food Groups, 1964-1969
(1963 = 100)
Indices of Real Value of Purchases
1964 1965 1966 1967 1968 1969
Liquid milk (excluding school milk)Other milk and cream ....Cheese
97-4100-299-6
97-9114-41000
99-6127-497-5
99-6128- 1104-3
980 1001145-3109-4
137-6106-2
Milk, cheese and cream 980 99-6 101-5 101-7 102-5 105-4
Beef and veal 90-799-394-2
85-593-3
112-6
85-799-2
111-3
904 82089-8
101-7
81-784-7
112-6Mutton and lamb ....Pork
95-692-4
Carcase meat 93-8 91-4 93- 1 92-2 86-9 86-7
Bacon and ham, uncooked . 99-5108-3100-1
101-7140-31000
99-4163-3101-2
97 0159-2104-7
96-4193-2106-6
95-9197-5108-3
Poultry, uncooked ....Other meat, and meat products
Meat other than carcase meat . 100-8 1048 107-2 1080 112-3 113-6
All meat 97-3 980 1000 100-0 99-3 99-7
Fresh fish ... 94-3108-4
95-8103 1
91-3108-2
881111-5
84-8111-9
80-7106-3Other fish . ....
Fish 103-1 100-3 101-8 102-6 101-4 96-5
Eggs 104-7 106-5 1070 1084 106- 1 104-8
Butter 100-3100-798-3
102-391-698-8
102-184-0
100-9
103-990-399-8
103-284-7
108-2
103-583-7
110-8MargarineOther fats
Fate 100-1 99-7 98-3 100-6 100-1 100-5
Sugar 93-892-8
94- 7 92- 188-3
93-2910
88-4 87-485-2Preserves ...... 95- 3 90-3
Potatoes, fresh 98-2115-5103-0
98- 2120-8106-0
97-1117-4104-4110-2
100-0118-8102-8115-3
97 0116-4106-6125-9
940Fresh green vegetables....Other fresh vegetables....Other vegetables (6) . 96-4 99- 4
112-3108-2134-8
Vegetables 101-2 103-5 105-8 108-3 111-1 1120
Fresh fruit 10501021
106-4102-6
108-997-8
104-41000
107-899-8
108-8103-5Other fruit
Fruit ...... 1041 105-2 105-3 1030 105-3 107-2
Bread 96-6100-6
94-21020
90- 1100-9
93-2101-5
89-7102-0
88-1102-0Cereals other than bread
Cereals 98-9 98-7 96-3 97-9 96-7 960
Beverages ..... 95-2 95-4 98-3 100-3 103-1 104-1
Miscellaneous foods (c) . 102-6 1080 1290 130-5 134-4 144-8
ALL FOODS (c) 99-1 1000 101-1 1020 101-9 102-4
(a) The index numbers of expenditure divided by the corresponding index numbers of prices.(b) Including quick-frozen vegetables.(c) Excluding certain foods for which the expenditure but not the quantity was recorded, and for which average
prices therefore could not be calculated.
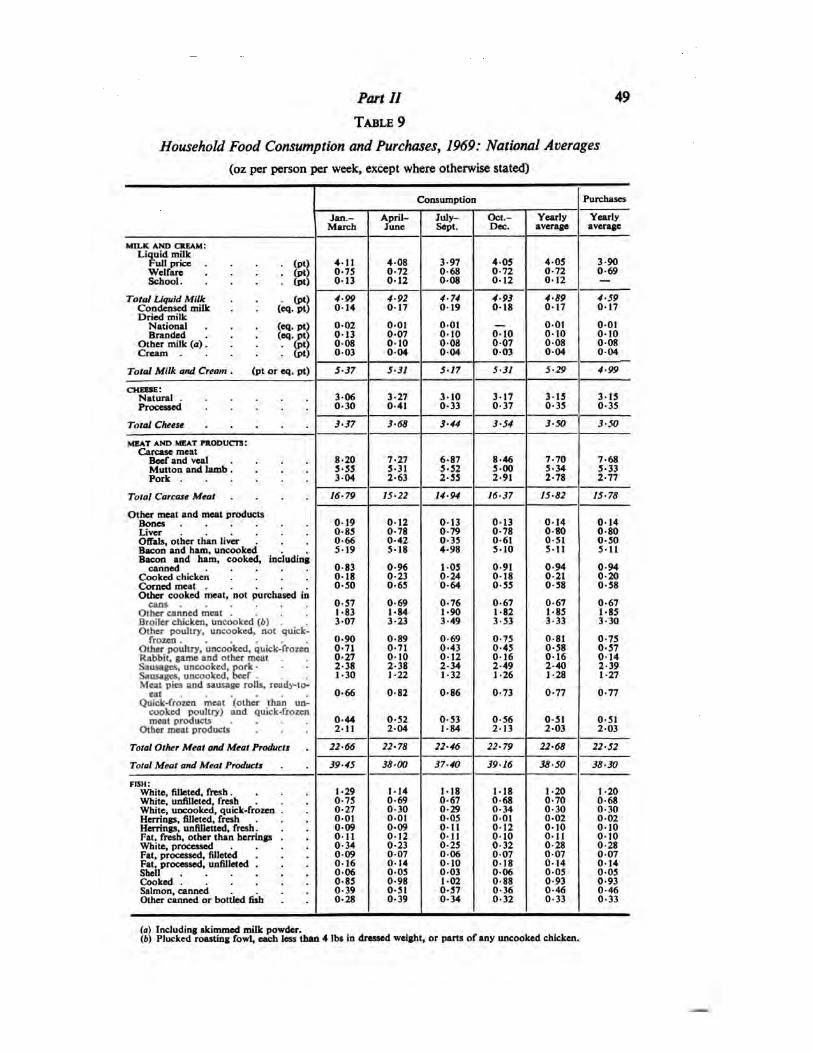
Part II 49
Table 9
Household Food Consumption and Purchases, 1969: National Averages
(oz per person per week, except where otherwise stated)
Consumption Purchases
Jan.- April- July- Oct.- Yearly Yearly
MILK AND CREAM:Liquid milk
March June Sept. Dec. average average
Full price .... (pt) 411 4-08 3-97 405 405 3-90Welfare . (pt) 0-75 0-72 0-68 0-72 0-72 0-69
013 012 008 012 0-12 —
Total Liquid Milk . (pt) 4-99 4-92 4-74 4-93 4-89 4-59Condensed milk (eq. pt) 014 017 019 0-18 017 017Dried milk
National . (eq. pt) 002 001 001 — 001 001Branded (eq.pt) 013 007 010 010 010 010
Other milk (a) . . (pt) 008 010 008 007 0-08 008003 004 004 003 004 004
Total Milk and Cream . (pt or eq. pt) 5-37 5-31 517 5-31 5-29 4-99
306 3-27 310 317 3-15 3150-30 0-41 0-33 0-37 0-35 0-35
Total Cheese 3-37 3-68 3-44 3-54 3-50 350
MEAT AND MEAT PRODUCTS:Carcase meat
Beef and veal .... 8-20 7-27 6-87 846 7-70 7-68Mutton and lamb.... 5-55 5-31 5-52 500 5-34 5-33Pork 304 2-63 2-55 2-91 2-78 2-77
Total Carcase Meat .... 16-79 15-22 14-94 16-37 15-82 15-78
Other meat and meat products019 012 013 0-13 014 0140-85 0-78 0-79 0-78 0-80 0-80
Offals, other than liverBacon and ham, uncooked
0-66 0-42 0-35 0-61 0-51 0-50
Bacon and ham, cooked, including519 518 4-98 510 511 511
0-83 0-96 105 0-91 0-94 094Cooked chicken .... 018 0-23 0-24 0-18 0-21 0-20Corned meat ..... 0-50 0-65 0-64 0-55 0-58 0-58Other cooked meat, not purchased in
0-57 0-69 0-76 0-67 0-67 0-671-83 1-84 1-90 1-82 185 1-85
Broiler chicken, uncooked (t) . 3-07 3-23 3-49 3-53 3-33 3-30Other poultry, uncooked, not quick-
frozen...... 0-90 0-89 0-69 0-75 0-81 0-75Other poultry, uncooked, quick-frozen 0-71 0-71 0-43 0-45 0-58 0-57Rabbit, game and other meat . 0-27 010 0-12 016 0-16 014Sausages, uncooked, pork * - • 2-38 2-38 2-34 2-49 2-40 2-39Sausages, uncooked, beef . 1-30 1-22 1-32 1-26 1-28 1-27Meat pies and sausage rolls, ready-to-
eat 0-66 082 0-86 0-73 0-77 0-77Quick-frozen meat (other than un
cooked poultry) and quick-frozenmeat products 0-44 0-52 0-53 0-56 0-51 0-51
Other meat products 211 2-04 1-84 213 203 203
Total Other Meat and Meat Products 22-66 22-78 22-46 22-79 22-68 22-52
Total Meat and Meat Products 39-45 38-00 37-40 39-16 38-50 38-30
fish:White, filleted, fresh.... 1-29 1-14 1-18 1-18 1-20 1-20White, unnlleted, fresh 0-75 0-69 0-67 0-68 0-70 0-68White, uncooked, quick-frozen . 0-27 0-30 0-29 0-34 0-30 0-30Herrings, filleted, fresh 0-01 0-01 0-05 0-01 0-02 0-02Herrings, unfilletted, fresh. 009 0-09 011 012 010 0-10Fat, fresh, other than herrings . 011 0-12 0-11 0-10 0-11 0-10White, processed .... 0-34 0-23 0-25 0-32 0-28 0-28Fat, processed, filleted 0-09 007 0-06 0-07 0-07 007Fat, processed, unnlleted . 0-16 0-14 0-10 0-18 0-14 014Shell 006 0-05 003 0-06 005 005
0-85 0-98 102 0-88 0-93 0-93Salmon, canned .... 0-39 0-51 0-57 0-36 0-46 0-46Other canned or bottled fish 0-28 0-39 0-34 0-32 0-33 0-33
(a) Including skimmed milk powder.(6) Plucked roasting fowl, each less than 4 lbs in dressed weight, or parts of any uncooked chicken.
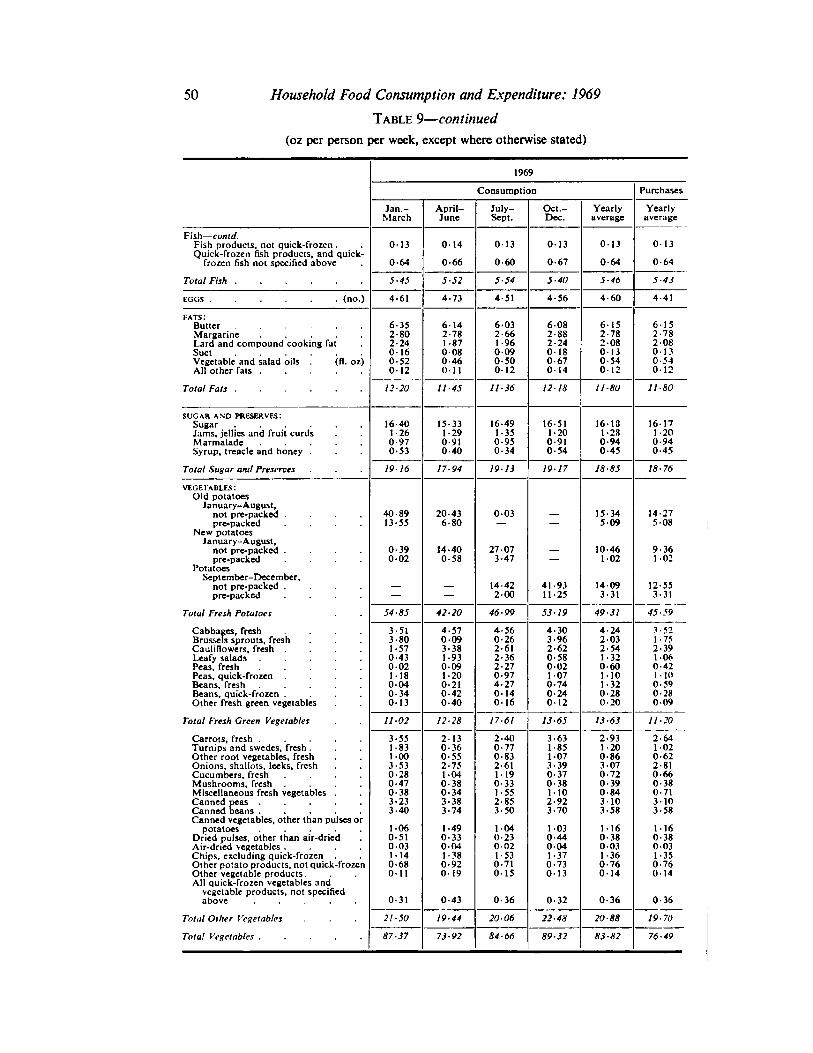
50 Household Food Consumption and Expenditure: 1969
Table 9—continued
(oz per person per week, except where otherwise stated)
Consumption
1969
Purchases
Jan.- April- July- Oct.- Yearly Yearly
Fish —contd.
March June Sept. Dec. average average
Fish products, not quick-frozen . 013 014 013 0-13 013 013Quick-frozen fish products, and quick-
frozen fish not specified above 064 0-66 0-60 0-67 0-64 0-64
Total Fish 5-45 5-52 5-54 5-40 5-46 5-43
EGGS (no.) 4-61 4-73 4-51 4-56 460 4-41
FATS:Butter 6-35 6-14 603 6-08 6-15 615Margarine ..... 2-80 2-78 2-66 2-88 2-78 2-78Lard and compound cooking fat 2-24 1-87 1-96 2-24 2-08 2-08Suet 016 0-08 0-09 0-18 0-13 013Vegetable and salad oils (fl. oz) 0-52 046 0-50 0-67 0-54 0-54All other fats 0-12 011 012 0-14 012 0-12
Total Fats 12-20 11-45 11-36 12-18 11-80 11-80
SUGAR AND PRESERVES:16-40 15-33 16-49 16-51 16-18 1617
Jams, jellies and fruit curds 1-26 1-29 1-35 1-20 1-28 1-20Marmalade ..... 0-97 0-91 0-95 0-91 0-94 0-94Syrup, treacle and honey . 0-53 0-40 0-34 0-54 0-45 0-45
Total Sugar and Preserves 19 16 17-94 19-13 19-17 18-85 18-76
vegetables:Old potatoes
January-August,not pre-packed .... 40-89 20-43 003 — 15-34 14-27
New potatoespre-packed .... 13-55 6-80 — — 509 508
January-August,not pre-packed .... 0-39 14-40 27-07 — 10-46 9-36
Potatoespre-packed .... 0-02 0-58 3-47 — 102 102
September-December,not pre-packed .... — — 14-42 41-93 14-09 12-55pre-packed .... — — 200 11-25 3-31 3-31
Total Fresh Potatoes 54-85 42-20 46-99 53-19 49-31 45-59
Cabbages, fresh .... 3-51 4-57 4-56 4-30 4-24 3-52Brussels sprouts, fresh 3-80 009 0-26 3-96 2-03 1-75Cauliflowers, fresh .... 1-57 3-38 2-61 2-62 2-54 2-39Leafy salads ..... 0-43 1-93 2-36 0-58 1-32 1-06Peas, fresh ..... 002 009 2-27 002 0-60 0-42Peas, quick-frozen .... 118 1-20 0-97 1-07 110 1-10Beans, fresh ..... 004 0-21 4-27 0-74 1-32 0-59Beans, quick-frozen .... 0-34 0-42 014 0-24 0-28 0-28Other fresh green vegetables 0-13 0-40 0-16 0-12 0-20 009
Total Fresh Green Vegetables 11 02 12-28 17-61 13-65 13-63 11-20
Carrots, fresh ..... 3-55 213 2-40 3-63 2-93 2-64Turnips and swedes, fresh . 1-83 0-36 0-77 1-85 1-20 1-02Other root vegetables, fresh 1-00 0-55 0-83 1-07 0-86 0-62Onions, shallots, leeks, fresh 3-53 2-75 2-61 3-39 307 2-81Cucumbers, fresh .... 0-28 1-04 1-19 0-37 0-72 0-66Mushrooms, fresh .... 0-47 0-38 0-33 0-38 0-39 0-38Miscellaneous fresh vegetables . 0-38 0-34 1-55 1-10 084 0-71Canned peas ..... 3-23 3-38 2-85 2-92 310 310Canned beans..... 3-40 3-74 3-50 3-70 3-58 3-58Canned vegetables, other than pulses or
potatoes ..... 1-06 1-49 104 103 1-16 1-16Dried pulses, other than air-dried 0-51 0-33 0-23 n 44 0-38 0-38Air-dried vegetables.... 003 0-04 0-02 004 0-03 003Chips, excluding quick-frozen 1-14 1-38 1-53 1-37 1-36 1-35Other potato products, not quick-frozen 0-68 0-92 0-71 0-73 0-76 0-76Other vegetable products . 011 0-19 015 013 0-14 0-14All quick-frozen vegetables and
vegetable products, not specifiedabove ..... 0-31 0-43 0-36 0-32 0-36 0-36
Total Other Vegetables 21-50 19-44 2006 22-48 20-88 19-70
Total Vegetables 87-37 73-92 84-66 89-32 83-82 76-49
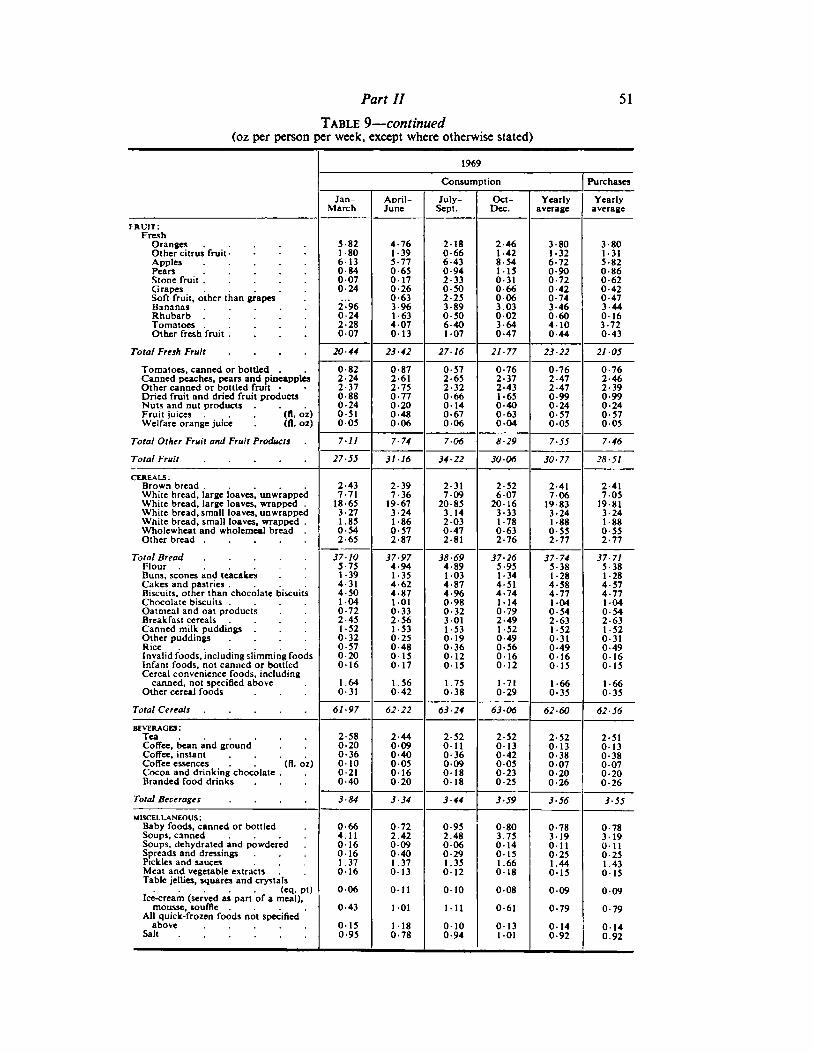
Part II 51
Table 9—continued(oz per person per week, except where otherwise stated)
1969
Consumption Purchases
Jan- April- July- Oct- Yearlyaverage
Yearlyaverage
fruit :Fresh
March June Sept. Dec.
Oranges 5-82 4-76 2-18 2-46 3-80 3-80Other citrus fruit- 180 1-39 0-66 1-42 1-32 1-31Apples 613 5-77 6-43 8-54 6-72 5-82Pears 0-84 0-65 0-94 MS 0-90 0-86Stone fruit 007 017 2-33 0-31 0-72 0-62Grapes 0-24 0-26 0-50 0-66 0-42 0-42Soft fruit, other than grapesBananas
0-63 2-25 0-06 0-74 0-47296 3-96 3-89 3.03 3-46 3-44
Rhubarb 0-24 1-63 0-50 002 0-60 016Tomatoes 2-28 407 6-40 3-64 4- 10 3-72Other fresh fruit .... 007 013 1-07 0-47 0-44 0-43
Total Fresh Fruit .... 20-44 23 42 27-16 21-77 23-22 21-05
Tomatoes, canned or bottled . 0-82 0-87 0-57 0-76 0-76 0-76Canned peaches, pears and pineapplesOther canned or bottled fruit •
2-24 261 2-65 2-37 2-47 2-462-37 2-75 2-32 2-43 2-47 2-39
Dried fruit and dried fruit products 0-88 0-77 0-66 1-65 0-99 0-99Nuts and nut products 0-24 0-20 014 0-40 0-24 0-24Fruit juices ... (fl. oz) 0-51 0-48 0-67 0-63 0-57 0-57Welfare orange juice (fl. oz) 003 006 0-06 0-04 005 005
Total Other Fruit and Fruit Products 7-11 7-74 7-06 8-29 7-55 7-46
Total Fruit 27-55 31 16 34-22 30 06 30-77 28-51
cereals:Brown bread 2-43 2-39 2-31 2-52 2-41 2-41White bread, large loaves, unwrapped 7-71 7-36 709 6-07 706 7-05White bread, large loaves, wrapped . 18-65 19-67 20-85 20-16 19-83 19-81White bread, small loaves, unwrapped 3-27 3-24 3.14 3-33 3-24 3-24White bread, small loaves, wrapped . 1.85 186 203 1-78 1-88 1-88Wholewheat and wholemeal bread . 0-54 0-57 0-47 0-63 055 0-55Other bread 2-65 2-87 2-81 2-76 2-77 2-77
Total Bread 37-10 37-97 38-69 37-26 37-74 37-71Flour 5-75 4-94 4-89 5-95 5-38 5-38Buns, scones and teacakes 1-39 1-35 103 1-34 1-28 1-28Cakes and pastries ....Biscuits, other than chocolate biscuits
4-31 4-62 4-87 4-51 4-58 4-574-50 4-87 4-96 4-74 4-77 4-77
Chocolate biscuits .... 104 101 0-98 1-14 1-04 104Oatmeal and oat products 0-72 0-33 0-32 0-79 0-54 0-54Breakfast cereals .... 2-45 2-56 301 2-49 2-63 2-63Canned milk puddings 1-52 1-53 1-53 1-52 1-52 152Other puddings .... 0-32 0-25 0-19 0-49 0-31 0-31Rice 0-57 0-48 0-36 0-56 0-49 0-49Invalid foods, including slimming foods 0-20 015 0-12 0-16 0-16 0-16Infant foods, not canned or bottled 016 017 015 0-12 0-15 015Cereal convenience foods, including
canned, not specified above 1.64 1.56 1.75 1-71 1-66 1-66Other cereal foods 0-31 0-42 0-38 0-29 0-35 0-35
Total Cereals 61-97 62-22 63-24 63-06 62-60 62-56
BEVERAGES:Tea 2-58 2-44 2-52 2-52 2-52 2-51Coffee, bean and ground 0-20 009 011 0-13 0-13 0-13Coffee, instant .... 0-36 0-40 0-36 0-42 0-38 0-38Coffee essences . . (fl. oz)Cocoa and drinking chocolate .Branded food drinks
010 005 009 0-05 007 0-070-210-40
0160-20
0-18018
0-230-25
0-200-26
0-200-26
Total Beverages .... 3-84 3-34 3-44 3-59 3-56 3-55
miscellaneous:Baby foods, canned or bottled 0-66 0-72 0-95 0-80 0-78 0-78Soups, canned .... 4.11 2.42 2.48 3.75 319 3- 19Soups, dehydrated and powdered 0-16 0-09 0-06 0-14 011 011Spreads and dressings 0-16 0-40 0-29 0-15 0-25 0-25Pickles and sauces 1.37 1.37 1.35 1.66 1.44 1.43Meat and vegetable extracts 016 013 012 0-18 0-15 015Table jellies, squares and crystals
Ice-cream (served as part of a meal).(eq. pt) 006 0-11 0-10 0-08 009 009
mousse, souffle ....All quick-frozen foods not specified
0-43 101 1-11 0-61 0-79 0-79
Saltabove ..... 0-15 1-18 0-10 0-13 0-14 014
0-95 0-78 0-94 1-01 0-92 0.92
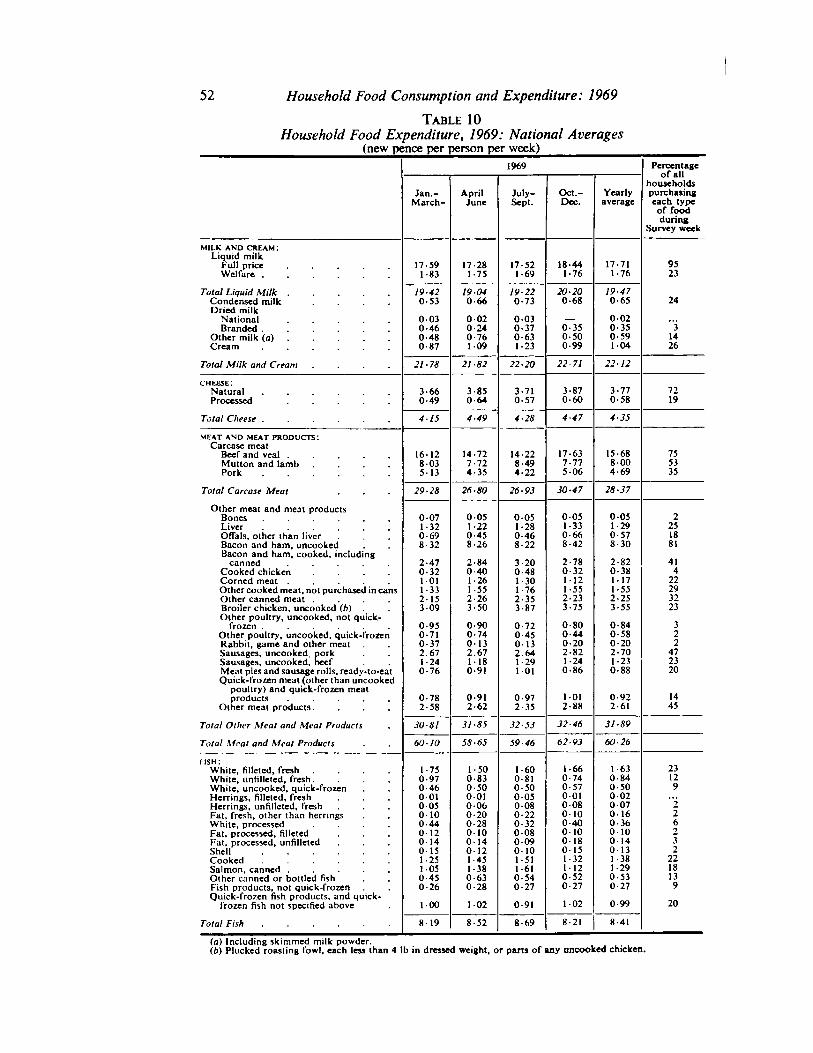
52 Household Food Consumption and Expenditure: 1969
Table 10
Household Food Expenditure, 1969: National Averages(new pence per person per week)
1969
Jan.-March-
AprilJune
July-Sept.
Oct.-Dec.
Yearlyaverage
Percentageor all
householdspurchasingeach typeof foodduring
Survey week
MILK AND CREAM :Liquid milk
Full price .....Welfare
Total Liquid MilkCondensed milk ....Dried milk
National .....Branded ......
Other milk (a)Cream ......
Total Milk and Cream ....cheese:
Natural ......Processed .....
Total Cheese
MEAT AND MEAT PRODUCTS:Carcase meat
Beef and veal .....Mutton and lamb ....Pork
Total Carcase Meat
Other meat and meat productsBones ......Liver ......Offals, other than liverBacon and ham, uncookedBacon and ham, cooked, including
canned .....Cooked chicken ....Corned meat .....Other cooked meat, not purchased in cansOther canned meat ....Broiler chicken, uncooked (6)Other poultry, uncooked, not quick-
frozen ......Other poultry, uncooked, quick-frozenRabbit, game and other meat .Sausages, uncooked, porkSausages, uncooked, beefMeat pies and sausage rolls, ready-to-eatQuick-frozen meat (other than uncooked
poultry) and quick-frozen meatproducts
Other meat products ....Total Other Meat and Meat Products
Total Meat and Meat Products
17-591-83
17-281-75
17521-69
18-441-76
17-711-76
19-420-53
0030-460-480-87
19-040-66
0020-240-76109
19-220-73
0030-370-631-23
20-200-68
0-350-500-99
79*70-65
0020-350-591-04
21-78 21-82 22-20 22-71 22-12
3-660-49
3-850-64
3-710-57
3-870-60
3-770-58
4-15 4-49 4-35
29
30
60
28 26
81 31
10 58
14-228-494-22
80 26-93 30
0051-280-468-22
3-200-481-301-762-353-87
0-720-450-132.641-291-01
0-972-35
85 32-53
65 59-46
15-688-004-69
47 28-37
0-051-290-578-30
2-820-381171-552-253-55
1-230-88
0-92261
37-89
fish:White, filleted, freshWhite, unfilleted, fresh.White, uncooked, quick-frozenHerrings, filleted, freshHerrings, unfilleted, freshFat, fresh, other than herringsWhite, processedFat, processed, filletedFat, processed, unfilletedShell ....Cooked ....Salmon, canned .Other canned or bottled fishFish products, not quick-frozenQuick-frozen fish products, and quick-
frozen fish not specified above
1-600810-500-050-080-220-320080090-101-511-610-540-27
0-91
1-630-840-500020070-160-360-100-140131-381-290-530-27
0-99
819 8-21 8-41Total Fish 8-52 8-69
(a) Including skimmed milk powder.(6) Plucked roasting fowl, each less than 4 lb in dressed weight, or parts of any uncooked chicken.
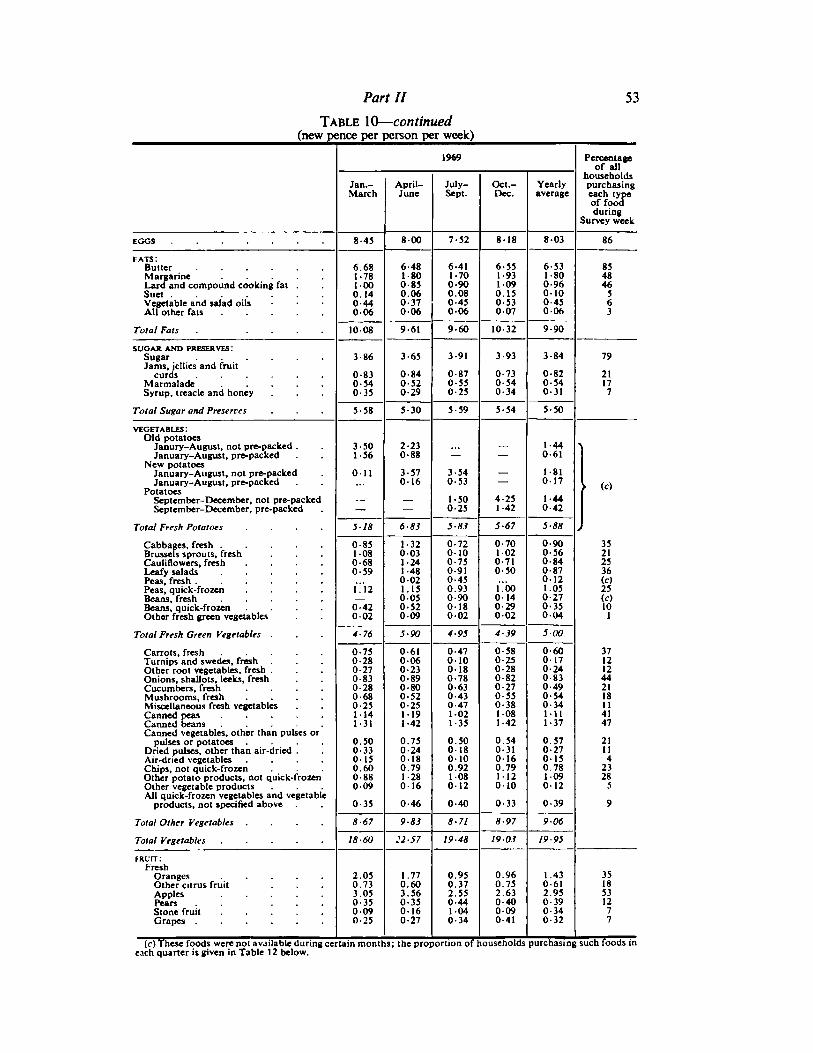
Part II 53
Table 10—continued(new pence per person per week)
1969
Jan.- April-March June
July-Sept.
Oct.-Dec.
Yearlyaverage
Percentageof all
householdspurchasingeach typeof foodduring
Survey week
8-45 800 7-52 818 8-03
fats:ButterMargarine ....Lard and compound cooking fat .SuetVegetable and salad oilsAll other fats ....
Total Fats . ...6.681-781000.14044006
6- 481-800-850.060-37006
6-411-700-900.080-45006
6-551-931090.150-53007
6-531-800-960-100-45006
1008 9-61 9-60 10-32 9-90
86
854846
563
ryes:SUGAR ANDSugarJams, jellies and fruit
curdsMarmaladeSyrup, treacle and honey
Total Sugar and Preserves
3-86
0-830-540-35
3-65
0-840-520-29
3-91
0-870-550-25
3-93
0-730-540-34
3-84
0-820-540-31
5-58 5-30 5-59 5-54 5-50
79
21177
vegetables:Old potatoes
Janury-August, not pre-packed .January-August, pre-packed
New potatoesJanuary-August, not iJanuary-August, I
PotatoesSeptember-December, not pre-packedSeptember-December, pre-packed
Total Fresh Potatoes ....Cabbages, freshBrussels sprouts, freshCauliflowers, fresh ....Leafy salads .....Peas, fresh......Peas, quick-frozen ....Beans, fresh .....Beans, quick-frozen ....Other fresh green vegetables
Total Fresh Green Vegetables .
Carrots, freshTurnips and swedes, freshOther root vegetables, fresh .Onions, shallots, leeks, freshCucumbers, fresh ....Mushrooms, fresh ....Miscellaneous fresh vegetablesCanned peas .....Canned beans .....Canned vegetables, other than pulses or
pulses or potatoes ....Dried pulses, other than air-dried .Air-dried vegetables ....Chips, not quick-frozenOther potato products, not quick-frozenOther vegetable productsAll quick-frozen vegetables and vegetable
products, not specified above
Total Other Vegetables ....Total Vegetables
3-501-56
0-11
2-230-88
3-57016
518 6-83
0- 851-080-680-59
L12
0-42002
1-320031-241-480-021.150-050-52009
4-76 5-90
0-750-280-270-830280-680- 251- 141-31
0.500-330150.600-880-09
0-35
0-610-060-230-890-800-520- 251191-42
0.750- 240180.791- 280-16
0-46
8-67 9-83
18-60 22-57 19
4-251-42
5-67
0-701020-710-50
Tin0-140-29002
95 4-39
0-580-250-280-820-270-550- 381081-42
0.540- 310160.791- 12010
0-33
71 8-97
48 1903 19
88
00
> (c)
35212536
8ft
371212442118114147
21II4
23285
06
95
fruit:Fresh
OrangesOther citrus fruitApplesPearsStone fruitGrapes .
2.050.733.050-350090-25
1.770.603.560-350-160-27
0.950.372.550-441040-34
0.960.752.630-400090-41
1.430-612.950-390-340-32
3518531277
(c) These foods were not av^ilab!e"d7mrig"ccrtam months ; the proportion of households purchasing such foods ineach quarter is given in Table 12 below.
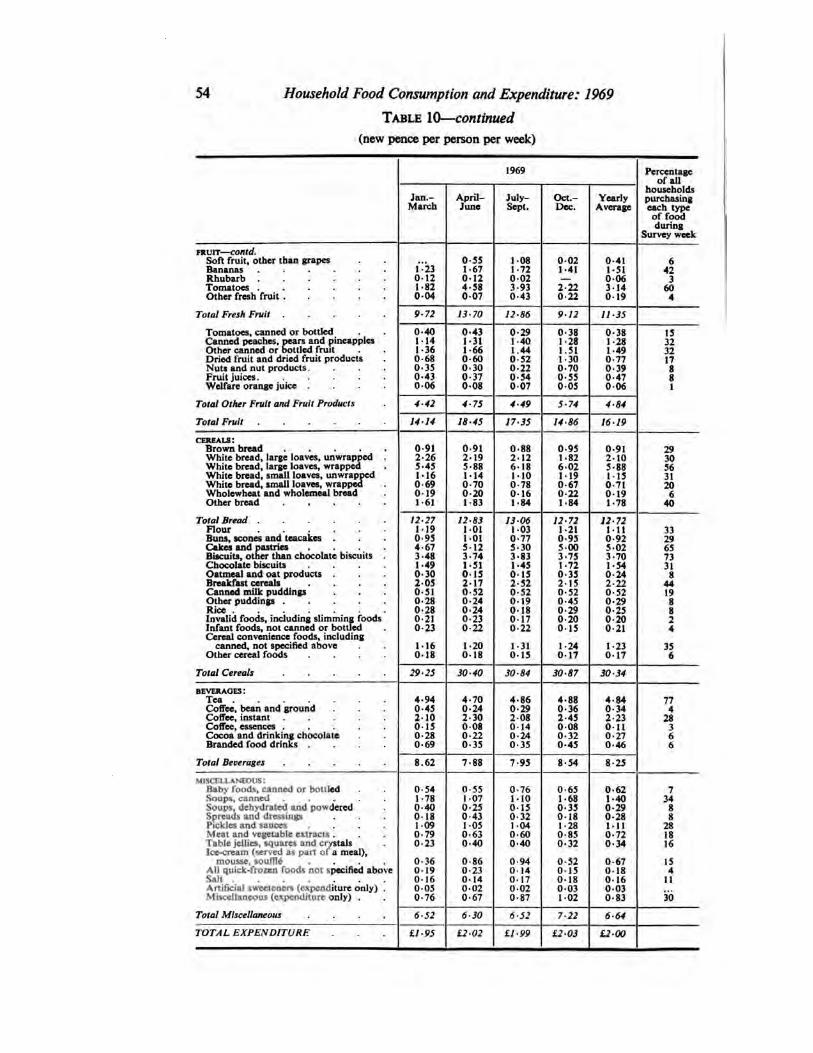
54 Household Food Consumption and Expenditure: 1969
Table 10—continued
(new pence per person per week)
1969
Jan.-March
April-June
July-Sept.
Oct.-Dec.
YearlyAverage
Percentageof all
householdspurchasingeach typeof foodduring
Survey week
fruit —contd.Soft fruit, other than grapesBananasRhubarbTomatoes .Other fresh fruit .
1 230121-82004
0-551-670124-58007
1081-720-023-930.43
0021 41
2-220-22
041I -SI006314019
Total Fresh Fruit 9-72 13-70 12-86 9-12 11-35
Tomatoes, canned or bottledCanned peaches, pears and pineapplesOther canned or bottled fruitDried fruit and dried fruit productsNuts and nut products .Fruit juices. ....Welfare orange juice .
0401141-360-680-350-43006
0-431-311-660-600-300-370-08
0-291-401.440-520-220-540 07
0-381-281.511300-700-55005
0-381-281-490-770-390-47006
Total Other Fruit and Fruit Products
Total Fruit
4-42 4-75 4-49 5-74 4-84
14-14 18-45 17-35 14-86 16-19
CEREALS:Brown bread ....White bread, large loaves, unwrappedWhite bread, large loaves, wrappedWhite bread, small loaves, unwrappedWhite bread, small loaves, wrappedWholewheat and wholemeal breadOther bread ....
Total BreadFlourBuns, scones and teacakes .Cakes and pastriesBiscuits, other than chocolate biscuitsChocolate biscuitsOatmeal and oat productsBreakfast cerealsCanned milk puddingsOther puddings ....RiceInvalid foods, including slimming foodsInfant foods, not canned or bottledCereal convenience foods, including
canned, not specified aboveOther cereal foods
Total Cereals ....
0-912-265-451160-690-191-61
0-912-195-881-140-700-201-83
12-271190-954-673-481-490-302050-510-280-280-210-23
1160-18
12-831-011-015123-741-310152-170-520-240-240-230-22
1-200-18
13 061030-775-303-831-450152-520-520-190180170-22
1-31015
0-912105-881-150-710191-78
1-24017
12-721110-925-023-701-540242-220-520-290-250-200-21
1-23017
29-25 30-40 30-87 30-34
BEVERAGES:Tea 4-94
0-452- 100150-280-69
4-700-242-300-080-220-35
Coffee, bean and groundCoffee, instantCoffee, essences .Cocoa and drinking chocolateBranded food drinks
Total Beverages
4-860-292080-140-240-35
4-880-362-450080-320-45
4-840-342-230-110-270-46
8.62 7-88 7-95 8-54 8-25
MISCELLANEOUS:Baby foods, canned or bottledSoups, canned .....Soups, dehydrated and powderedSpreads and dressingsPickles and sauces ....Meat and vegetable extracts .Table jellies, squares and crystalsIce-cream (served as part of a meal),
mousse, souffle ....All quick-frozen foods not specified aboveSaltArtificial sweeteners (expenditure only) .Miscellaneous (expenditure only) .
Total Miscellaneous ....
0-541-780-400-181090-790-23
0-360190160050-76
0-551-070-250-43I 050-630-40
0-860-230-140020-67
0-76I- 100150-321040-600-40
0940140-170-020-87
0-651-680-350-181-280-850-32
0-520150-180-031-02
0621-400-290-281-110-720-34
0-670-180-160030-83
6-52 6-30 6-52 7-22 6-64
TOTAL EXPENDITURE f.1-95 1202 £1-99 1203 12-00
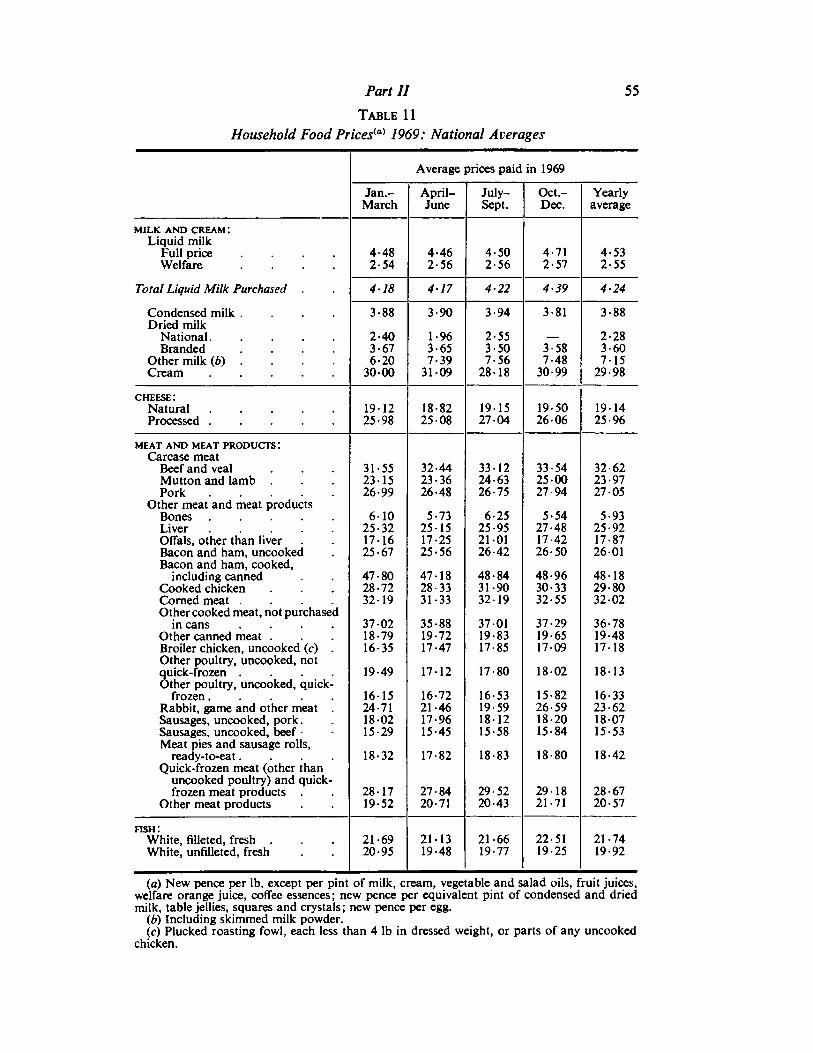
Part II 55
Table 11
Household Food Priced 1969: National Averages
Average prices paid in 1969
Jan.- April- July- Oct- Yearly
MILK AND CREAM:
March June Sept. Dec. average
Liquid milkFull price .... 4-48 4-46 4-50 4-71 4-53Welfare .... 2-54 2-56 2-56 2-57 2-55
Total Liquid Milk Purchased 4-18 4-17 4-22 4-39 4-24
Condensed milk .... 3-88 3-90 3-94 3-81 3-88Dried milk
National 2-40 1-96 2-55 — 2-28Branded .... 3-67 3-65 3-50 3-58 3-60
Other milk (6) .... 6-20 7-39 7-56 7-48 7-15Cream 3000 3109 28-18 30-99 29-98
cheese:Natural 1912 18-82 1915 19-50 1914Processed 25-98 25 08 27-04 26 06 25-96
MEAT AND MEAT PRODUCTS :
Carcase meatBeef and veal 31-55 32-44 33-12 33-54 32-62Mutton and lamb 23 15 23-36 24-63 25-00 23-97Pork 26-99 26-48 26-75 27-94 27 05
Other meat and meat productsBones 6- 10 5-73 6-25 5-54 5-93Liver 25-32 25 15 25-95 27-48 25-92Offals, other than liver 1716 17-25 21 01 17-42 17-87Bacon and ham, uncooked 25-67 25-56 26-42 26-50 26 01
Bacon and ham, cooked,including canned 47-80 47-18 48-84 48-96 4818
Cooked chicken 28-72 28-33 31-90 30-33 29-80Corned meat .... 32- 19 31-33 3219 32-55 32 02Other cooked meat, not purchased
in cans .... 37-02 35-88 37 01 37-29 36-78Other canned meat . 18-79 19-72 19-83 19-65 19-48Broiler chicken, uncooked (c) 16-35 17-47 17-85 1709 1718Other poultry, uncooked, notquick-frozen .... 19-49 17-12 17-80 1802 1813Other poultry, uncooked, quick-
frozen 1615 16-72 16-53 15-82 16-33Rabbit, game and other meat 24-71 21-46 19-59 26-59 23-62Sausages, uncooked, pork. 18-02 17-96 18-12 18-20 1807Sausages, uncooked, beef • 15-29 15-45 15-58 15-84 15-53Meat pies and sausage rolls,
ready-to-eat .... 18-32 17-82 18-83 18-80 18-42
Quick-frozen meat (other thanuncooked poultry) and quick-frozen meat products 28-17 27-84 29-52 29-18 28-67
Other meat products 19-52 20-71 20-43 21-71 20-57
fish:White, filleted, fresh . 21-69 21 13 21-66 22-51 21-74White, unfilleted, fresh 20-95 19-48 19-77 19-25 19-92
(a) New pence per lb, except per pint of milk, cream, vegetable and salad oils, fruit juices,welfare orange juice, coffee essences; new pence per equivalent pint of condensed and driedmilk, table jellies, squares and crystals; new pence per egg.
(b) Including skimmed milk powder.
(c) Plucked roasting fowl, each less than 4 lb in dressed weight, or parts of any uncookedchicken.
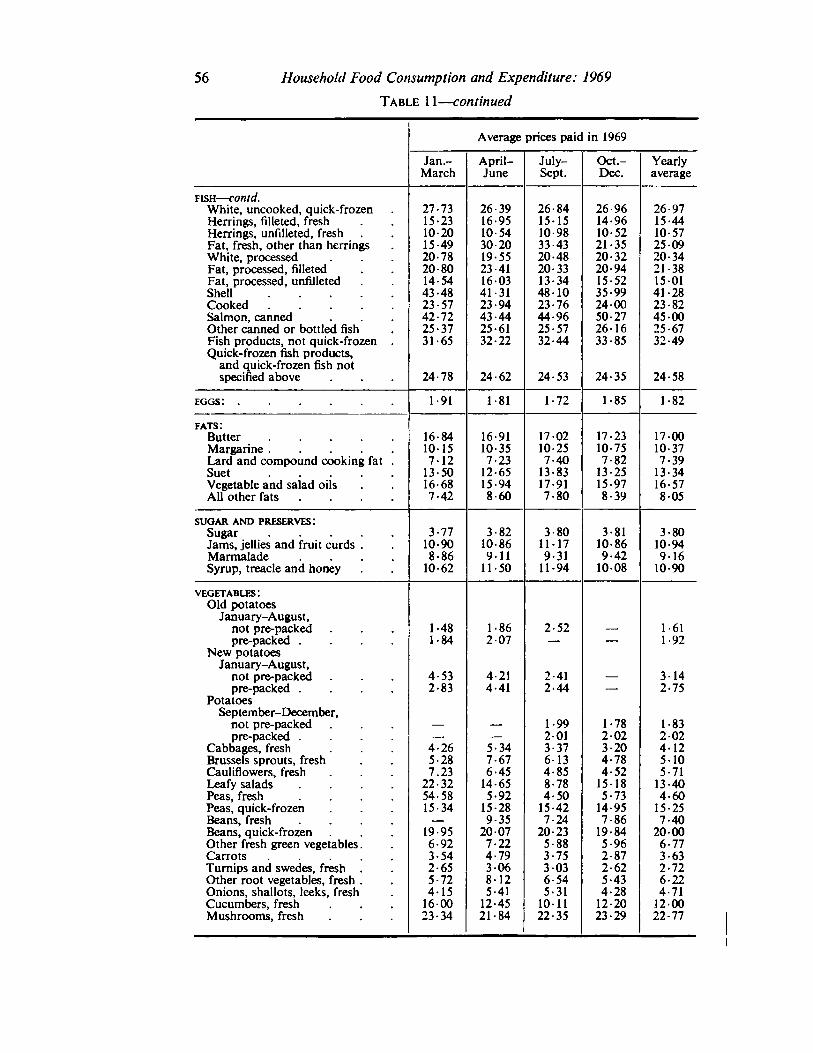
56 Household Food Consumption and Expenditure: 1969
Table 11 —continued
Average prices paic in 1969
Jan.- April- July- Oct- Yearly
fish —contd.
March June Sept. Dec. average
White, uncooked, quick-frozen 27-73 26-39 26-84 26-96 26-97Herrings, filleted, fresh 15-23 16-95 1515 14-96 15-44Herrings, unfilleted, fresh 10-20 10-54 10-98 10-52 10-57Fat, fresh, other than herrings 15-49 30-20 33-43 21-35 2509White, processed 20-78 19-55 20-48 20-32 20-34Fat, processed, filleted 20-80 23-41 20-33 20-94 21-38Fat, processed, unfilleted 14-54 1603 13-34 15-52 1501Shell .... 43-48 41-31 48-10 35-99 41-28Cooked .... 23-57 23-94 23-76 2400 23-82Salmon, canned 42-72 43-44 44-96 50-27 4500Other canned or bottled fish 25-37 25-61 25-57 26-16 25-67Fish products, not quick-frozen 31-65 32-22 32-44 33-85 32-49
Quick-frozen fish products.and quick-frozen fish notspecified above 24-78 24-62 24-53 24-35 24-58
eggs: 1-91 1-81 1-72 1-85 1-82
fats:Butter 16-84 16-91 1702 17-23 17-00Margarine .... 1015 10-35 10-25 10-75 10-37Lard and compound cooking fat 7-12 7-23 7-40 7-82 7-39Suet .... 13-50 12-65 13-83 13-25 13-34Vegetable and salad oils 16-68 15-94 17-91 15-97 16-57All other fats 7-42 8-60 7-80 8-39 805
SUGAR AND PRESERVES:
Sugar 3-77 3-82 3-80 3-81 3-80Jams, jellies and fruit curds . 10-90 10-86 1117 10-86 10-94Marmalade .... 8-86 911 9-31 9-42 916Syrup, treacle and honey 10-62 11-50 11-94 10-08 10-90
vegetables:Old potatoes
January-August,not pre-packed 1-48 1-86 2-52 — 1-61pre-packed .... 1-84 207 — — 1-92
New potatoesJanuary-August,
not pre-packed 4-53 4-21 2-41 — 314pre-packed .... 2-83 4-41 2-44 — 2-75
PotatoesSeptember-December,
not pre-packed — — 1-99 1-78 1-83pre-packed . — — 201 202 2 02
Cabbages, fresh 4-26 5-34 3-37 3-20 4-12Brussels sprouts, fresh 5-28 7-67 6 13 4-78 510Cauliflowers, fresh 7.23 6-45 4-85 4-52 5-71Leafy salads 22-32 14-65 8-78 1518 13-40Peas, fresh 54-58 5-92 4-50 5-73 4-60Peas, quick-frozen 15-34 15-28 15-42 14-95 15-25Beans, fresh — 9-35 7-24 7-86 7-40Beans, quick-frozen 19-95 2007 20-23 19-84 2000Other fresh green vegetables 6-92 7-22 5-88 5-96 6-77Carrots 3-54 4-79 3-75 2-87 3-63Turnips and swedes, fresh 2-65 306 3 03 2-62 2-72Other root vegetables, fresh 5-72 8-12 6-54 5-43 6-22Onions, shallots, leeks, fresh 4-15 5-41 5-31 4-28 4-71Cucumbers, fresh 1600 12-45 1011 12-20 1200Mushrooms, fresh 23-34 21-84 22-35 23-29 22-77
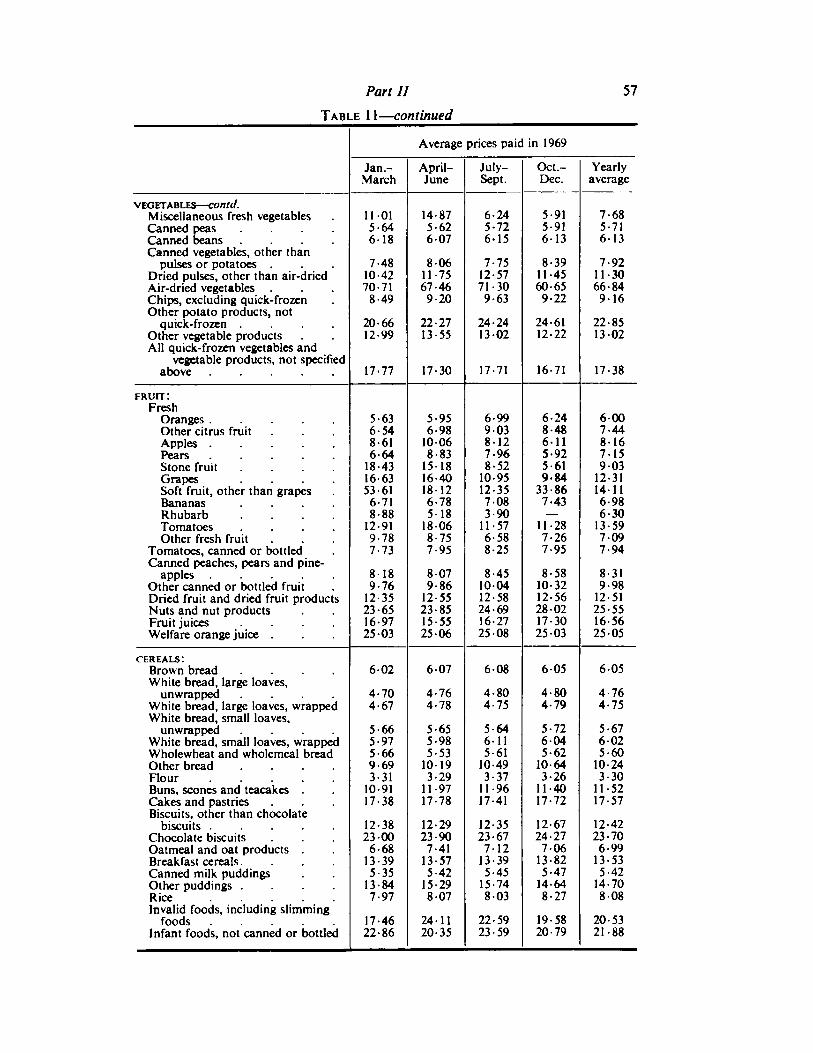
Part II 57
Table 11 —continued
Average prices paid in 1969
Jan- April- July- Oct.- Yearly
VEGETABLES—COtltd.
March June Sept. Dec. average
Miscellaneous fresh vegetables 1101 14-87 6-24 5-91 7-68
Canned peas .... 5-64 5-62 5-72 5-91 5-71Canned beans .... 618 607 6-15 613 6-13
Canned vegetables, other thanpulses or potatoes 7-48 806 7-75 8-39 7-92
Dried pulses, other than air-dried 10-42 11-75 12-57 11-45 11-30Air-dried vegetables 70-71 67-46 71-30 60-65 66-84Chips, excluding quick-frozen 8-49 9-20 9-63 9-22 916Other potato products, not
quick-frozen .... 20-66 22-27 24-24 24-61 22-85Other vegetable products 12-99 13-55 13 02 12-22 13 02All quick-frozen vegetables and
vegetable products, not specifiedabove 17-77 17-30 17-71 16-71 17-38
fruit:Fresh
Oranges ..... 5-63 5-95 6-99 6-24 600Other citrus fruit 6-54 6-98 903 8-48 7-44Apples 8-61 1006 8-12 611 8-16Pears 6-64 8-83 7-96 5-92 715Stone fruit .... 18-43 15-18 8-52 5-61 903Grapes .... 16-63 16-40 10-95 9-84 12-31Soft fruit, other than grapes 53-61 1812 12-35 33-86 14-11Bananas .... 6-71 6-78 708 7-43 6-98Rhubarb .... 8-88 518 3-90 — 6-30Tomatoes .... 12-91 1806 11-57 11-28 13-59Other fresh fruit 9-78 8-75 6-58 7-26 709
Tomatoes, canned or bottled 7-73 7-95 8-25 7-95 7-94Canned peaches, pears and pine
apples 8-18 807 8-45 8-58 8-31Other canned or bottled fruit 9-76 9-86 1004 10-32 9-98Dried fruit and dried fruit products 12-35 12-55 12-58 12-56 12-51Nuts and nut products 23-65 23-85 24-69 28 02 25-55Fruit juices .... 16-97 15-55 16-27 17-30 16-56Welfare orange juice . 25 03 25 06 25 08 25 03 25 05
cereals:Brown bread .... 602 607 608 605 605White bread, large loaves,
unwrapped .... 4-70 4-76 4-80 4-80 4-76White bread, large loaves, wrapped 4-67 4-78 4-75 4-79 4-75White bread, small loaves,
unwrapped .... 5-66 5-65 5-64 5-72 5-67White bread, small loaves, wrapped 5-97 5-98 611 604 602Wholewheat and wholemeal bread 5-66 5-53 5-61 5-62 5-60Other bread .... 9-69 10-19 10-49 10-64 10-24
Flour 3-31 3-29 3-37 3-26 3-30Buns, scones and teacakes . 10-91 11-97 11-96 11-40 11-52Cakes and pastries 17-38 17-78 17-41 17-72 17-57Biscuits, other than chocolate
biscuits 12-38 12-29 12-35 12-67 12-42
Chocolate biscuits 23-00 23-90 23-67 24-27 23-70
Oatmeal and oat products . 6-68 7-41 712 706 6-99Breakfast cereals.... 13-39 13-57 13-39 13-82 13-53Canned milk puddings 5-35 5-42 5-45 5-47 5-42Other puddings .... 13-84 15-29 15-74 14-64 14-70Rice 7-97 8 07 803 8-27 8-08Invalid foods, including slimming
foods 17-46 24-11 22-59 19-58 20-53Infant foods, not canned or bottled 22-86 20-35 23-59 20-79 21-88
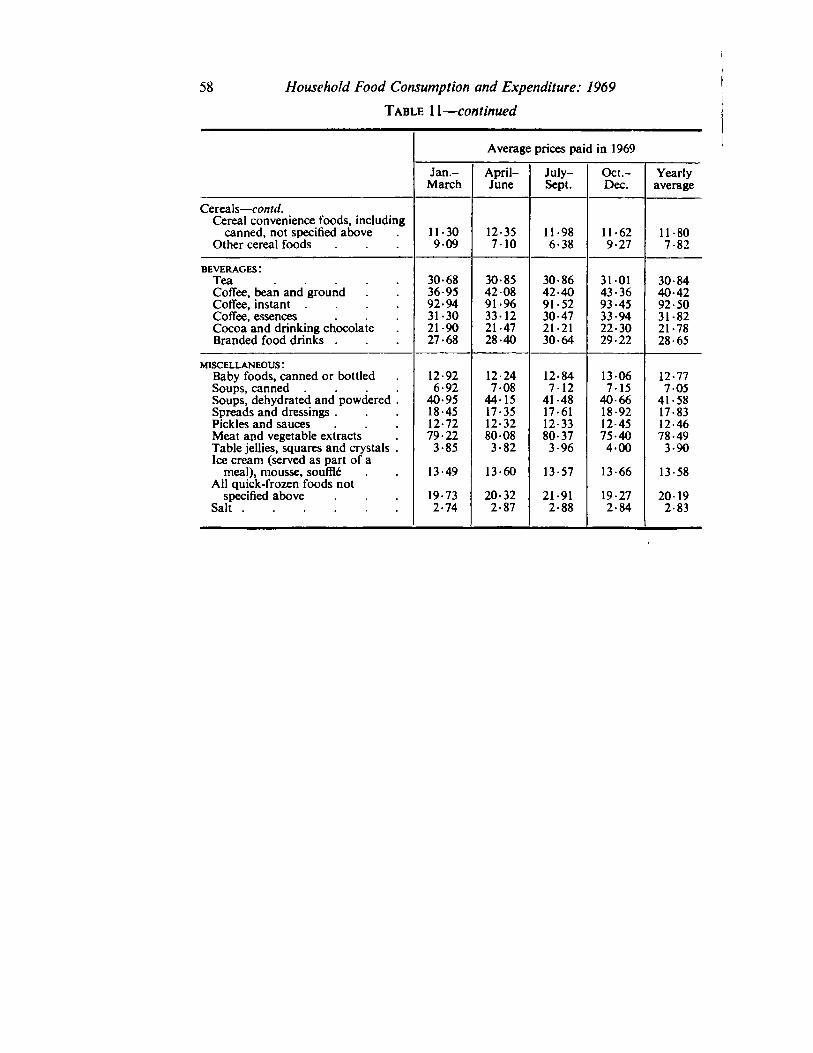
58 Household Food Consumption and Expenditure: 1969
Table 11 —continued
Average prices paid in 1969
Jan- April- July- Oct.- Yearly
Cereals —contd.
March June Sept. Dec. average
Cereal convenience foods, includingcanned, not specified above 11-30 12-35 11-98 11-62 11-80
Other cereal foods 909 710 6-38 9-27 7-82
beverages:Tea 30-68 30-85 30-86 3101 30-84Coffee, bean and ground 36-95 42 08 42-40 43-36 40-42Coffee, instant .... 92-94 91-96 91-52 93-45 92-50Coffee, essences 31-30 33 12 30-47 33-94 31-82Cocoa and drinking chocolate 21-90 21-47 21-21 22-30 21-78Branded food drinks . 27-68 28-40 30-64 29-22 28-65
miscellaneous:Baby foods, canned or bottled 12-92 12-24 12-84 1306 12-77Soups, canned .... 6-92 708 712 7-15 705Soups, dehydrated and powdered . 40-95 44-15 41-48 40-66 41-58Spreads and dressings . 18-45 17-35 17-61 18-92 17-83Pickles and sauces 12-72 12-32 12-33 12-45 12-46Meat and vegetable extracts 79-22 80 08 80-37 75-40 78-49Table jellies, squares and crystals . 3-85 3-82 3-96 400 3-90Ice cream (served as part of a
meal), mousse, souffle 13-49 13-60 13-57 13-66 13-58All quick-frozen foods not
specified above 19-73 20-32 21-91 19-27 20- 19
Salt 2-74 2-87 2-88 2-84 2-83

Part II 59
Table 12
Percentages of All Households Purchasing SeasonalTypes of Food During Survey Week, 1969
Jan.- April- July- Oct.-
MILK AND CREAM \
March June Sept. Dec.
Liquid milk— full price 96 95 96 95
fish:
24 27 30 25
White, fresh, filleted .... 24 22 21 23White, fresh, unfilleted 13 11 12 10White, uncooked, quick-frozen 8 8 9 9Herrings, fresh, filleted (a) 1Herrings, fresh, unfilleted (a) "i i 2 "2Fat, fresh, other than herring 2 2 2 1White, processed .... 7 5 5 7Fat, processed, filleted (a) . 3 2 2 2Fat, processed, unfilleted (a) 3 3 2 4Shell 2 2 2 2
vegetables:
87 84 85 87
Old potatoesJanuary-August,
not pre-packed .... 52 35 -Vw —
New potatoes25 14 HP) —
January-August,not pre-packed .... 3 46 70Vm
—
Potatoespre-packed .... . . . 2 —
September-December,not pre-packed — —
14/W57
pre-packed .... — — 21Cabbages, fresh 34 40 31 32Brussels sprouts, fresh .... 37 1 3 41Cauliflowers, fresh .... 17 33 26 24Leafy salads, fresh .... 23 54 44 23Peas, fresh 1 13
Beans, fresh — 2 23 3Other fresh green vegetables 1 3 1 1Carrots, fresh 46 31 29 42Tumips and swedes, fresh 19 4 7 19Other root vegetables, fresh 15 11 11 12Onions, shallots, leeks, fresh 45 45 40 44Cucumbers, fresh .... 11 33 27 12Mushrooms, fresh .... 20 18 14 17Miscellaneous fresh vegetables 7 8 14 15
fruit:46 41 23 26
Other citrus fruit, fresh 23 16 10 2054 56 48 54
Pears, fresh 12 9 13 14Stone fruit, fresh .... 1 3 22 2Grapes, fresh 5 5 10 11Soft fruit, fresh, other than grapes. 8 15
38 48 45 39
4 5 1
44 70 75 54Other fresh fruit 1 1 9 4
(a) Excluding purchases of quick-frozen foods.
(b) Percentage of households purchasing during July/August.(c) Percentage of households purchasing during September.

Tables relating to Geographical Differences in
Average Consumption, Expenditure or Prices, 1969
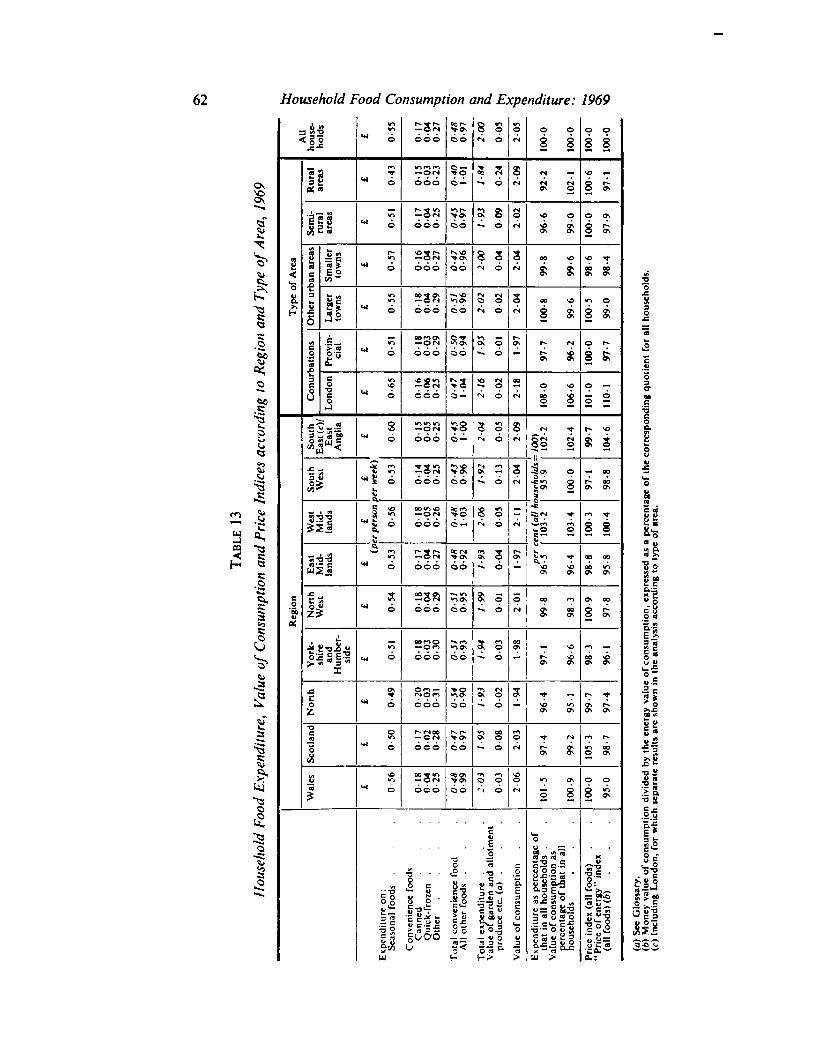
Household Food Consumption and Expenditure: 1969
AU
house
hold
s
U1
01
70
04
0-2
7
0-4
80
-97 8 S 10
« 6
m<N 6
o 0
00
1
0
00
1
0
00
1
0
00
1cs
Rura
lare
as
01
50
03
0-2
3
0-4
01
- 01
1-8
4
0-2
4 ?
92
-2
10
2-
1
10
0-6
97
1
rura
lare
as
« 6
to
0-1
70
04
0-2
5
0-4
50
-97 a 8 s
96
-6
99
0
6-L
60
00
1■«i 6
Typ
eof
Are
a
Oth
er
urb
an
are
as
|
Sm
alle
rto
wns r-
to
0-1
60
-04
0-2
7
0-4
70
-96
2-0
0
00
4 s
99
-8
99
-6
98
-6
98
-4
Larg
er
tow
ns
« 6
«o•o
0-1
80
-04
0-2
9 ^ondo 2
-02
0-0
2
20
4
10
08
99
-6
10
0-5
99
0
Conurb
ati
ons
iPro
vin
cial * 6 0
-18
00
30
-29
0-5
00
-94 ? ?
•i 6 1-9
7
97
-7
96
-2
10
00
97
-7
London IO
VO
01
60
-06
0-2
5
>?
00
2
2-1
8
9-9
01
0-8
01
10
1-0
11
01
o—
South
East
(c)/
East
Anglia s
01
50
05
0-2
5
0-4
51
00
2-0
4
00
5 ?
=
10
0)
10
2-2
10
2-4
99
-7
10
4-6
j £" m
-I 6
*
0-1
40
-04
02
5 So?do 1
-92
0-1
3 2 |* ?
•e*o ogos
3West
e4
97
-
1
98
-
8
1W
est
Mid
lands
er
pers
on
t
0-5
6 288©eo
T°
2-0
6
00
5
ent
(all
he
10
3-2
10
3-4
10
0-3
10
0-4
ej— f4
East
Mid
lands
« 6
>—• m«o
01
70
-04
0-2
7
0-4
80
-92
1-9
3
0-0
4
1-9
7
per
c9
6-5
96
-4
98
-8
95
-8
Regio
n
Nort
hW
est « 6
<o
0-1
80
04
0-2
9
so 10
0
66
-1 5
99
-8
98
-3
10
0-9
97
-8
York
shir
eand
Hum
ber-
side •O
(Omo—©r>
05
10
-93
19
4
00
3
1-9
8
97
1
96
-6
98
-3
96
-
1t*t ° OOO
Nort
h
0-2
00
-03
0-3
1 ??
1-9
3
00
2
1-9
4 *r — t~ ■* '
Q\ r~~o\ OS
OO \o in0\ ON
i
« o
o
0-1
70
02
0-2
8
0-4
70
-97
19
5
00
8
mO
97
-4
99
-2
10
5-3
98
-7
<W
ale
s SO
01
80
-04
0-2
5
0-4
80
-99 o © 8
10
1-5
10
0-9
10
0-0
95
0
to
Oth
er
....
Tota
lexp
end
iture
.
Valu
eof
gard
en
and
allo
tment
pro
duce
etc
(a)
.
Exp
end
iture
as
perc
enta
ge
of
that
inall
house
hold
s.
Convenie
nce
food
sC
anned
Quic
k-fr
oze
n
.
Tota
lco
nvenie
nce
food
All
oth
er
food
s
.
Valu
eof
consu
mp
tion
Valu
eof
consu
mpti
on
as
perc
enta
ge
of
that
inall
house
hold
s
Pri
cein
dex
(all
food
s)"P
rice
of
energ
y"
ind
ex
(all
food
s)(f
t)
Exp
end
iture
on:
Seaso
nal
food
s
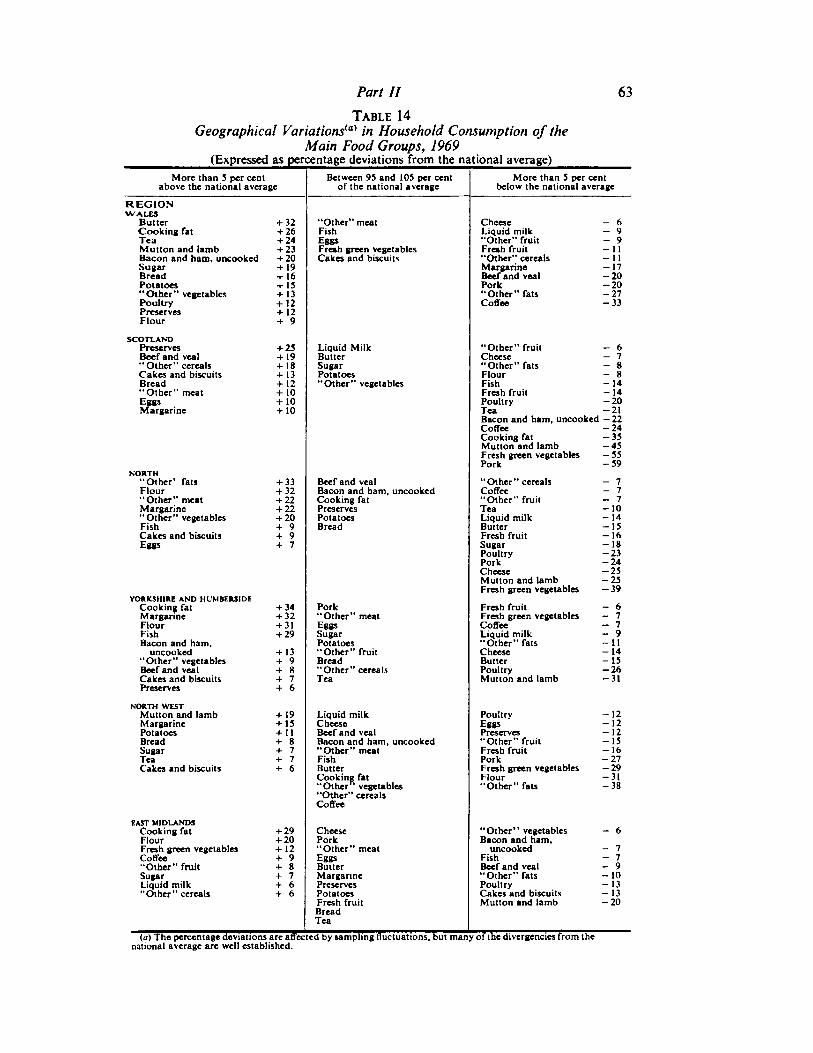
Part II 63
Table 14
Geographical Variations™ in Household Consumption of theMain Food Groups, 1969
(Expressed as percentage deviations from the national average)
More than 5 per centabove the national average
Between 95 and 105 per centof the national average
More than 5 per centbelow the national average
REGIONWALES
Butter + 32 "Other" meat Cheese - 6Cooking fat + 26 Fish Liquid milk - 9Tea + 24 Eggs "Other" fruit - 9Mutton and lamb + 23 Fresh green vegetables Fresh fruit -11Bacon and ham, uncooked + 20 Cakes and biscuits "Other" cereals -11Sugar + 19 Margarine -17Bread + 16 Beef and veal -20Potatoes + 13 Pork -20"Other" vegetables + 13 "Other" fats -27Poultry + 12 Coffee -33Preserves + 12Flour + 9
SCOTLANDLiquid Milk "Other" fruit - 6Preserves +23
Beef and veal + 19 Butter Cheese - 7"Other" cereals + 18 Sugar "Other" fats - aCakes and biscuits + 13 Potatoes Flour - 8Bread + 12 "Other" vegetables Fish -14"Other" meat + 10 Fresh fruit -14Eggs + 10 Poultry -20Margarine + 10 Tea -21
Bacon and bam, uncooked -22Coffee -24Cooking fat -35Mutton and lamb -43Fresh green vegetables -33Pork -39
NORTH"Other" cereals - 7"Other' fats + 33 Beef and veal
Flour + 32 Bacon and ham, uncooked Coffee - 7"Other" meat + 22 Cooking fat
Preserves"Other" fruit - 7
Margarine + 22 Tea -10"Other" vegetables + 20 Potatoes Liquid milk -14Fish + 9 Bread Butter -ISCakes and biscuits + 9 Fresh fruit -16Eggs + 7 Sugar -18
Poultry -23Pork -24Cheese -25Mutton and lamb -25Fresh green vegetables -39
YORKSHIRE AND HUMBERS1DE+ 34 Pork Fresh fruit - 6Cooking fat
Margarine + 32 "Other" meat Fresh green vegetables - 7Flour + 31 Eggs Coffee - 7Fish + 29 Sugar Liquid milk - 9Bacon and ham, Potatoes "Other" fats -11
uncooked + 13 "Other" fruit Cheese -14"Other" vegetables + 9 Bread Butter -13Beef and veal + 8 "Other" cereals Poultry -26Cakes and biscuits + 7 Tea Mutton and lamb -31Preserves + 6
NORTH WESTLiquid milk Poultry -12Mutton and lamb + 19
Margarine + 13 Cheese Eggs - 12Potatoes + 11 Beef and veal Preserves -12Bread + 8 Bacon and ham, uncooked "Other" fruit -ISSugar + 7 "Other" meat Fresh fruit -16Tea + 7 Fish Pork -27Cakes and biscuits + 6 Butter Fresh green vegetables -29
Cooking fat Flour -31"Other11 vegetables "Other" fats -38"Other" cereals
EASTMIDLANDS
Coffee
"Other" vegetables - 6Cooking fat + 29 CheeseFlour + 20 Pork Bacon and ham,Fresh green vegetables + 12 "Other" meat uncooked - 7Coffee + 9 Eggs Fish - 7"Other" fruit + 8 Butter Beef and veal - 9Sugar + 7 Margarine "Other" fats -10Liquid milk + 6 Preserves Poultry -13"Other" cereals + 6 Potatoes Cakes and biscuits -13
Fresh fruit Mutton and lamb -20BreadTea
""(a^he percentage deviations arc affected by sampling fluctuations, but many of the divergencies from thenational average are well established.
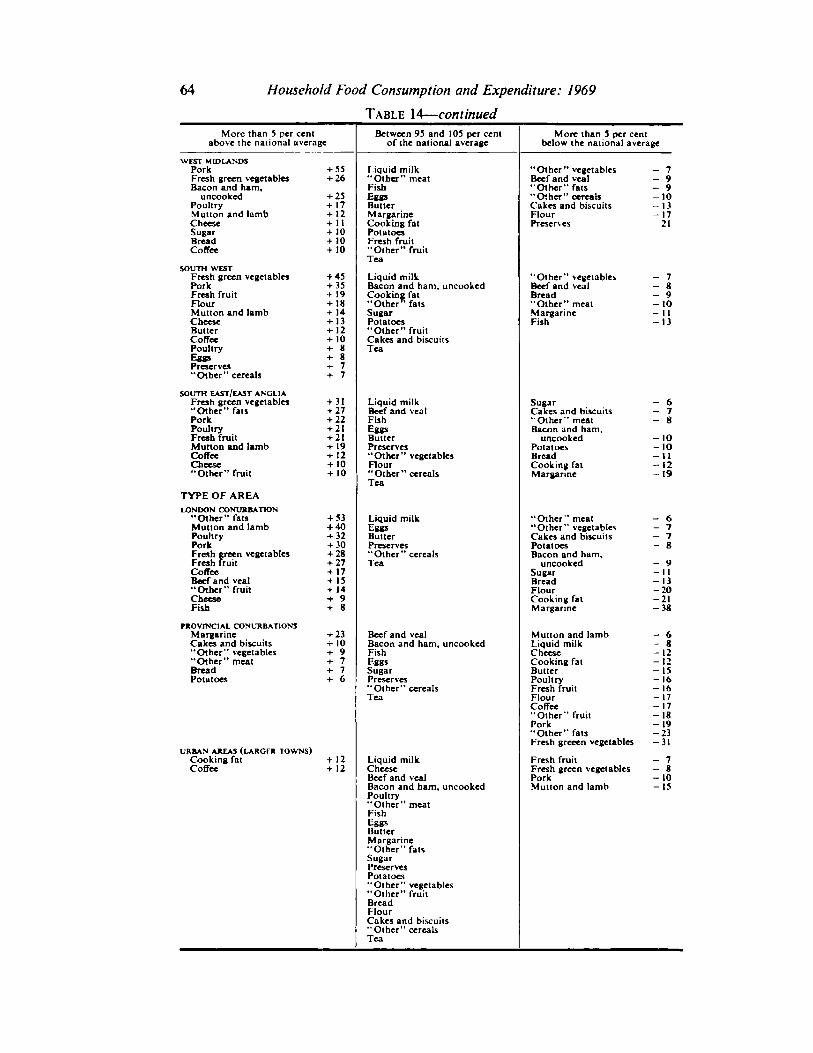
64 Household Food Consumption and Expenditure: 1969
Table 14—continued
More than 5 per centabove the national average
Between 95 and 105 per centof the national a
More than 5 per centbelow the national average
WEST MIDLANDSPorkFresh greenBacon and ham.
PoultryMutton andCheeseSugarBreadCoffee
SOUTH WESTFresh green vegetablesPorkFresh fruitFlourMutton and lambCheeseButterCoffeePoultryEggs
'"Other" cereals
SOUTH EAST/EASTANGLIAFresh green vegetables"Other" fatsPorkPoultryFresh fruitMutton and lambCoffeeCheese"Other" fruit
TYPE OF AREALONDON CONURBATION
"Other" fatsMutton and lambPoultryPorkFresh green vegetablesFresh fruitCoffeeBeef and veal"Other" fruitCheeseFish
PROVINCIAL CONURBATIONSMargarineCakes and biscuits"Other" vegetables"Other"BreadPotatoes
J- 55+26
+23+ 17+ 12+ 11+ 10+ 10+ 10
+43+ 33+ 19+ 11+ 14+ 13+ 12+ 10+ 8+ 8+ 7+ 7
+ 31+ 27+ 22+ 21+ 21+ 19+ 12+ 10+ 10
+ 53+40+ 32+ 30+ 28+ 27+ 17+ 15+ 14+ 9+ a
+ 23+ 10+ 9+ 7+ 7+ 6
URBAN AREAS (LAROER TOWNS)Cooking fat + 12Coffee + 12
Liquid milk"Other" meatFishEggsButterMargarineCooking fatPotatoesFresh fruit"Other" fruitTea
Liquid milkBacon and ham, uncookedCooking fat"Other ' fatsSugarPotatoes"Other" fruitCakes and biscuitsTea
Liquid milkBeef and vealFishEggsButterPreserves"OtherFlour"OtherTea
Liquid milkEggsButterPreserves"Other" cerealsTea
Beef and vealBacon and ham, uncookedFishEggsSugarPreserves"Other" cerealsTea
Liquid milkCheeseBeef and vealBacon and ham, uncookedPoultry"Other" meatFishEggsButterMargarine"Other" fatsSugarPreservesPotatoes"Other" vegetables"Other" fruitBreadFlourCakes and biscuits"Other" cereals
"Other" vegetablesBeef and veal"Other" fats"Other" cerealsCakes and biscuitsFlourPreserves
"Other" vegetablesBeef and vealBread"Other" meatMargarine
SugarCakes and biscuits"Other" meatBacon and ham,
uncookedPotatoesBreadCooking fatMargarine
"Other" meat"Other" vegetablesCakes and biscuitsPotatoesBacon and ham,
uncookedSugarBreadFlourCooking fatMargarine
Mutton and lambLiquid milkCheeseCooking fatButterPoultryFresh fruitFlourCoffee"Other" fruitPork"Other" fataFresh greeen
Fresh fruitFresh green vegetablesPorkMutton and lamb
- 7- 9- 9- 10- 13-17-21
- 9- 10- II- 13
- 6- 7- 8
-10- 10-11-12-19
- 6- 7- 7- S
- 9II13
-20-21-38
- 6- 8- 12- 12- 15-16- 15-17- 17-18- 19-23-31
- 7- S- 10- 15
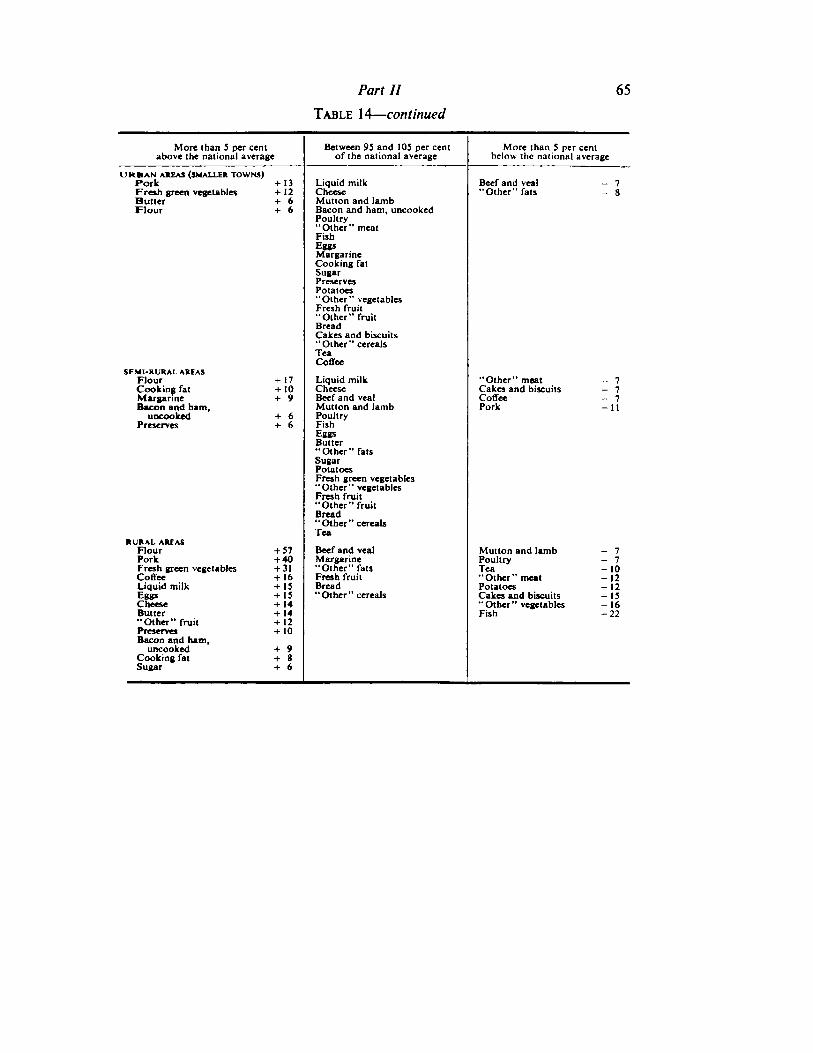
Part II 65
Table 14—continued
More than 5 per cent Between 95 and 105 per cent More than 5 per cent
URBAN AREAS (SMALLER TOWNS)
above the national average of the national average below the national average
Pork + 13 Liquid milk Beef and veal - 7Fresh green vegetables + 12 Cheese "Other" fats - 8Butter + 6 Mutton and lambFlour + 6 Bacon and ham, uncooked
Poultry"Other" meatFishEggsMargarineCooking fatSugarPreservesPotatoes"Other" vegetablesFresh fruit"Other" TruitBreadCakes and biscuits"Other" cerealsTeaCoffee
SEMI-RURAL AREASFlour + 17 Liquid milk "Other" meat - 7Cooking fatMargarine
+ 10 Cheese Cakes and biscuits - 7+ 9 Beef and veal Coffee - 7
Bacon and ham. Mutton and lamb Pork -11uncooked + 6 Poultry
Preserves + 6 FishEggsButter"Other" fatsSugarPotatoesFresh green vegetables"Other" vegetablesFresh fruit"Other" fruitBread"Other" cerealsTea
RURAL AREASFlour + 57 Beef and veal Mutton and lamb - 7Pork + 40 Margarine Poultry - 7Fresh green vegetables + 31 "Other" fats Tea -10Coffee + 16 Fresh fruit "Other" meat -12Liquid milk + 15 Bread Potatoes -12
+ 15 "Other" cereals Cokes and biscuits -15Cheese + 14 "Other" vegetables -16Butter + 14 Fish -22"Other" fruit + 12Preserves + 10Bacon and ham,
uncooked + 9Cooking fat + 8Sugar + 6
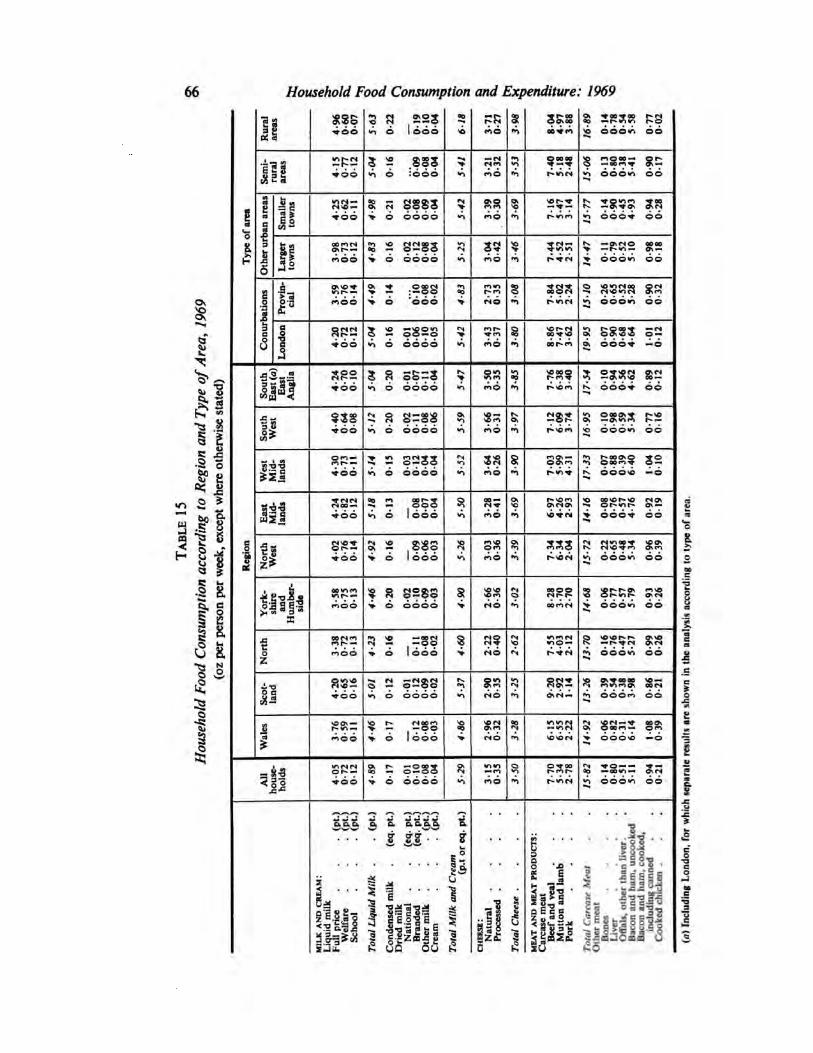
66 Household Food Consumption and Expenditure: 1969
$
1"
M
I*si j
ail8 §•
•2 8.
S i
9
Rura
l
4
96
06
00
-07
5-6
3
0-2
2
01
90
10
0-0
4 OO
3-7
10
-27 ?
8-0
44
-97
3-8
8
16
-89
01
40
-78
0-5
45
-58
0-7
70
02
to
Sem
i-ru
ral
are
as 5 2 883
*i 6 -666>
3-2
10
-32 ?
7-4
05
18
2-4
8
15
-06
01
30
80
0-3
85
-41
0-9
00
17
-*66 ■n
Typ
eof
are
a
Oth
er
urb
an
are
as
Sm
alle
r
1
42
50
-62
0*1
1 3 S 3SS3 >
3-3
90
-30
7-1
63
-47
3-1
4
•o 6664 66» 6 6666 •A
Larg
er
1
3-9
80
-73
0*
12
? ? °-oS **.rsi
30
40
-42
3-4
6
7-4
44
-52
2-5
1
14
-47
0-1
10
-79
0-5
25
10
0-9
80
-18
> © OOOO •A
Pro
vin
cial
3-5
90
-76
0-1
4 On OOOfN
2-7
30
-35 3
■n 7-8
45
02
2-2
4 o soinrNoo en>n oooin 66
Conurb
ati
ons
> — : —oo> 6 'ooo >
Lond
on
4-2
00
-72
0*1
2
S-0
4
0-1
6
0-0
10
06
0-1
00
05
*-> 3-4
30
-37
8-8
67
-47
3-6
2
19
-95
00
70
-90
0-6
84
-64
10
10
12
South
East
(o)
East
4-2
40
-70
0-
10
5 8 SB=S IS.
3-5
00
-33
7-7
66
-38
3 -40
5! SSSS £2
1
6 666o>
"n 666-i 66
South
West
4-4
00
-64
0-0
8 ?
° °=S8 9t
J-9
7
71
26
09
3-7
4
16
-95
01
00
-98
0-5
95
-34
0-7
70
16
•n 6 OOOO *n n o
West
Mid
lands nh-
466
5 2 S2SS*o 6 6666 J-
52 SfN
J-9
0
70
35
-99
4-3
1 *n r-oooso ▼ o"\ oosm? o —
mo oooo —o
East
Mid
lands rioo —
■WOO
? ?
55
0
oo—
no i(59
6-9
74
-26
2-9
3
14
16
0-0
80
-76
0-5
74
-76
0-9
20
19
<o 6 1 666
Regio
n
Nort
hW
est
40
20
-76
0-
14
4-9
2
01
6
0-0
90
-06
00
3 ? 3
03
0-3
6
JJ9 7-3
46
-34
2-0
4
15
-72
0-2
20
-65
0-4
83
-34
0-9
60
-39
York
-
3-5
80
-75
0-1
3 $ S S28S> 6 6666
s
> 2-6
60
-36 3 OOOO
COrtN 14
-68
0-0
60
-77
0-5
7
0-9
30
-26
1 3 3 « ■n
Nort
h
s
3-3
80
-72
0-
13
4-2
5
01
6
01
10
08
00
2
4-6
0
2-2
20
-40
2-6
2 mo —
13
-70
0-1
60
-76
0-4
73
-27
0-9
90
26
Sco
tla
nd
4-2
00
-65
0-
16
5 2 52SS
>^
>
6 6666 V
2-9
00
-35 ?
9-2
02
-92
1•
14
13
-26
0-3
90
-54
0-
38
3-9
8
0-8
60
21
*A
Wale
s
3-7
60
-59
0-1
1
01
7
0-1
20
-08
0-0
3
4S
6
2-9
60
-32
61
56
-55
2-2
2 a sss2 gsj 666* —6
i\ hold
s
40
50
-72
0-1
2
4-8
9
0-1
7
0-0
10
10
0-0
80
-04 «
3-1
50
-35 51
7-7
05
-34
2-7
8 S3 2SS= S3
£
666-r, 66«n
Full
pri
ce
.
(pt.
)W
elfare
.
(pt.
)S
chool
.
.
(pt.
)
Tota
lLi
quid
Milk
..
(pt.
)
Cond
ense
dm
ilk(e
q.
pt.
)D
ried
milk
Nati
onal
(eq
.p
t.)
Bra
nd
ed
(eq
.p
t.)
Oth
er
milk
.(p
t.)
Cre
am
.
.
.
(pt.
)
(p.t
or
eq
.p
t.)
Natu
ral
....
Pro
cess
ed
....
Tota
lC
heese
....
Carc
ase
meat
Beef
and
veal
Mutt
on
and
lam
bPork
....
Bones
....
Liver
....
Baco
nand
ham
,unco
oke
d
MIL
KA
ND
CR
EA
M:
Tota
lM
ilkand
Cre
am
MEA
TA
ND
MEA
TPR
OD
UC
TS
:
Tota
lC
arc
ase
Meat
Oth
er
meat
Off
als
,oth
er
than
liver.
Baco
nand
ham
,co
oke
d,
incl
ud
ing
canned
Cooke
dch
icke
n
.
Liq
uid
milk
cheese
:
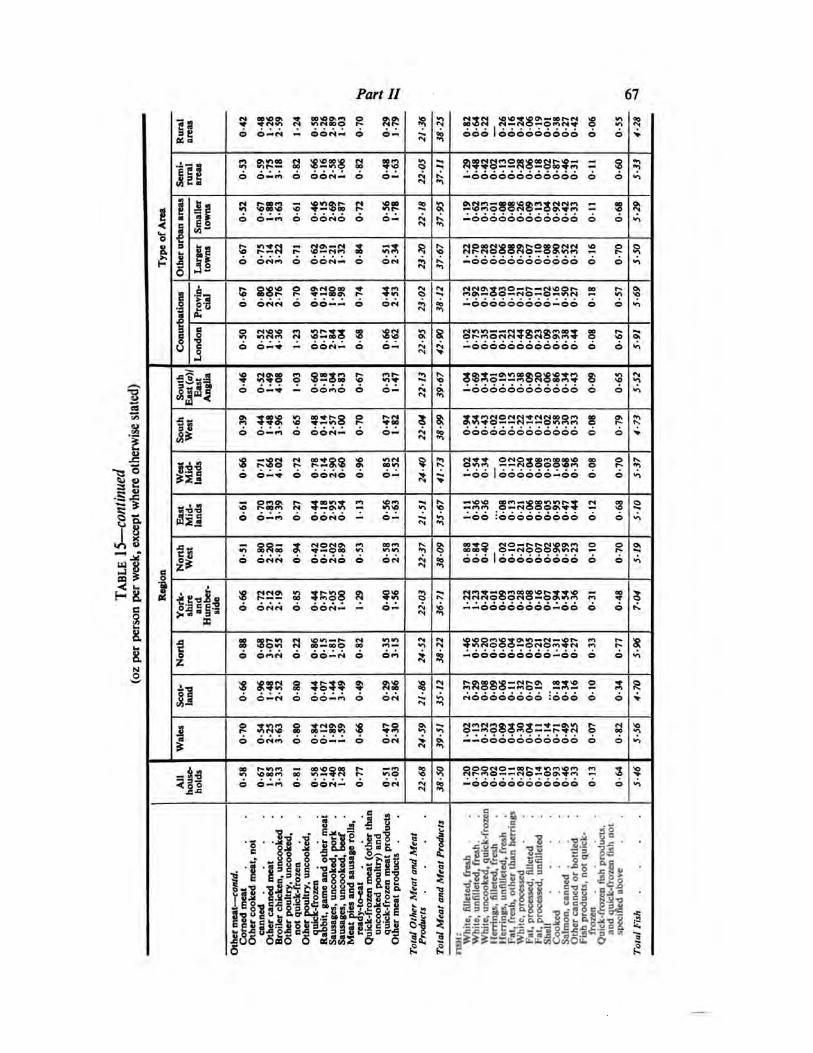
Part II 67
Rura
lare
as 3 ?*K s sssss s as
21
-36 asa asasasafis s s
6 6— n — 66rt— 6 6— 666 1666666666 6 6 >
Sem
i-ru
ral
are
as
03
3
0-5
9
1 -75
31
8
0-
82
06
60
16
2-3
81
-06
0-8
2
0-4
8
1-
63
22
-05
37
11
—666666666666 6 6
*i«o
Typ
eof
Are
a
j
Oth
er
urb
an
are
as
jS
malle
rto
wns
0-5
2
0-6
7
1 -88
3-6
3
0-6
1
0-4
60
-13
2-6
90
-87
0-7
2
0-
36
1-7
8 a 23R5§§ai52SS!!JR = 3
—666666666666 6 6 5-2
9
Larg
er
tow
ns
0-6
7
0-7
52
-1
43
-2
2
0-7
1
0-
62
01
92
-21
1-3
2
0-8
4
0-3
12
34
23
-20
~>
~6o6c>c>o6c>oooo 6 6
?•A
|Conurb
ati
ons
|
Pro
vin
cial
0-6
7
0-8
02
-06
2-7
6
0-7
0
0-4
90
-1
2
1-
80
1-
98
0-7
4
0-4
42
-3
3
23
02
38
12 r*r-to\ •*-->©—r»—N\eph oo r-
<*»OS—OO —fMO —O —9.1N — <n—660006666—60 6 6
Lond
on 8 SSS S S^SS 3 S3
6 6 —▼ — obtj- 6 6 —
S
42
-90 SPSSSaSSRSSSS § s
—666666666666 6 6
s
East
(a)/
East
Anglia $ K?g S S2SS £ 3$
6 ©-■» — oono 6 6—
$
39
-67
10
40
-69
0-3
4 sasssasaaa s s ?
South
West 3
38
-99
0-9
40
-54
0-4
30
-02
01
00
-12
0-2
20
-14
0-1
20
-02
0-5
80
-30
0-3
3
6606660660 6 6
0-0
8
0-7
9
6 6— 6 66cs— 6 6—«N
>
West
Mid
lands «5 r-^oo r-- r-— 2h® o\ win
6 6—4 6 iono 6 6 —
24
-40 R
1-0
20
-54
0-3
4
Zl-
001
'0 oz-
o
9£
08
9080
-
1£00
80
0W
O
80
0
OiO
5-J
7
•—l■**■
East
Mid
lands
0-6
1
0-
70
1- 8
33
-39
0-2
7
0-4
40
18
2-9
30
-5
4
1-
13
0-
36
1-
63
21
-51 fS«
11
10
-36
0-3
6 O-NOOOAtt — *3:666666666 6 6
Regio
n
Nort
hW
est
0-3
1
0-8
02
-20
2
81
0
94
0-4
20
10
20
20
-89
0-5
3
0-5
82
-53
22
-37
38
-09
0-8
80
-84
0-4
0
0-0
20
10
0-2
10
-07
00
70
02
0-9
60
-59
0-2
3
01
0
0-7
0
York
shir
eand
Hum
ber-
side
0-6
6
0-7
22
-12
2•
19
0-8
5
0-4
40
-3
72
-05
10
0
1-
29
0-4
0
1
56
22
-03
36
-71 ass sssasssxaa a ? 3
Nort
h
0-8
8
0-6
83
-07
2-5
5
02
2
0-8
60
13
18
12
07
0-8
2
0-3
33
15
*%
38
-22
--6 6666666—66 6 6
s
—666666666—66 6 6 *-»
Sco
tla
nd 8 g 5 as
6 6— « 6 66— <i 6 6m
21
-86
35
12 Rasss=ss2 sas s a
4-7
0
(^66666666 :666 6 6
Wale
s g S83 g 322?; 8 ?g
6 6<sm 6 66 —— 6 6is
8!
39
-51 SSSSSSaSsassa S 3
——66666666666 6 6 \5-5
6
$
All
house
*hold
s
0-5
8
06
7
1 -85
3-3
3
0-8
1
0-5
80
-16
2-4
0 I■28
0-7
7
0-5
12
-03 8
38
-50 gSSS2=SS2S5*S 5 2
^&ooo^c>6o6o6o 6 6
canned
....
Oth
er
canned
meat
Bro
iler
chic
ken,
unco
oke
dO
ther
poult
ry,
unco
oke
d,
quic
k-fr
oze
nR
ab
bit
,g
am
eand
oth
er
meat
Sausa
ges,
unco
oke
d,
pork
Sausa
ges,
unco
oke
d,
beef
Meat
pie
sand
sausa
ge
rolls
,re
ad
y-t
o-e
at
Quic
k-fr
oze
nm
eat
(oth
er
than
quic
k-fr
oze
nm
eat
pro
duct
sO
ther
meat
pro
duct
s
Tota
lO
ther
Meat
and
Meat
Pro
duct
s..
..
Tota
lM
eat
and
Meat
Pro
duct
s
Whit
e,
fille
ted,
fresh
.
Whit
e,
unfille
ted
,fr
esh
.
Whit
e,
unco
oke
d,
quic
k-fr
oze
nH
err
ing
s,fille
ted
,fr
esh
Herr
ing
s,unfille
ted
,fr
esh
Fat,
fresh
,oth
er
than
herr
ing
sW
hit
e,
pro
cess
ed
Fat,
pro
cess
ed,
fille
ted
Fat,
pro
cess
ed,
unfille
ted
Shell
....
Cooke
d..
..S
alm
on,
canned
.
Oth
er
canned
or
bott
led
Fish
pro
duct
s,not
quic
k-fr
oze
n..
..Q
uic
k-fr
oze
nfish
pro
duct
s,and
quic
k-fr
oze
nfish
not
speci
fied
ab
ove
Tota
lFi
sh..
..
Oth
er
meat—
contd
.C
orn
ed
meat
Oth
er
cooke
dm
eat,
not
not
quic
k-fr
oze
nO
ther
poult
ry,
unco
oke
d,
unco
oke
dp
oult
ry)
and
fish
:
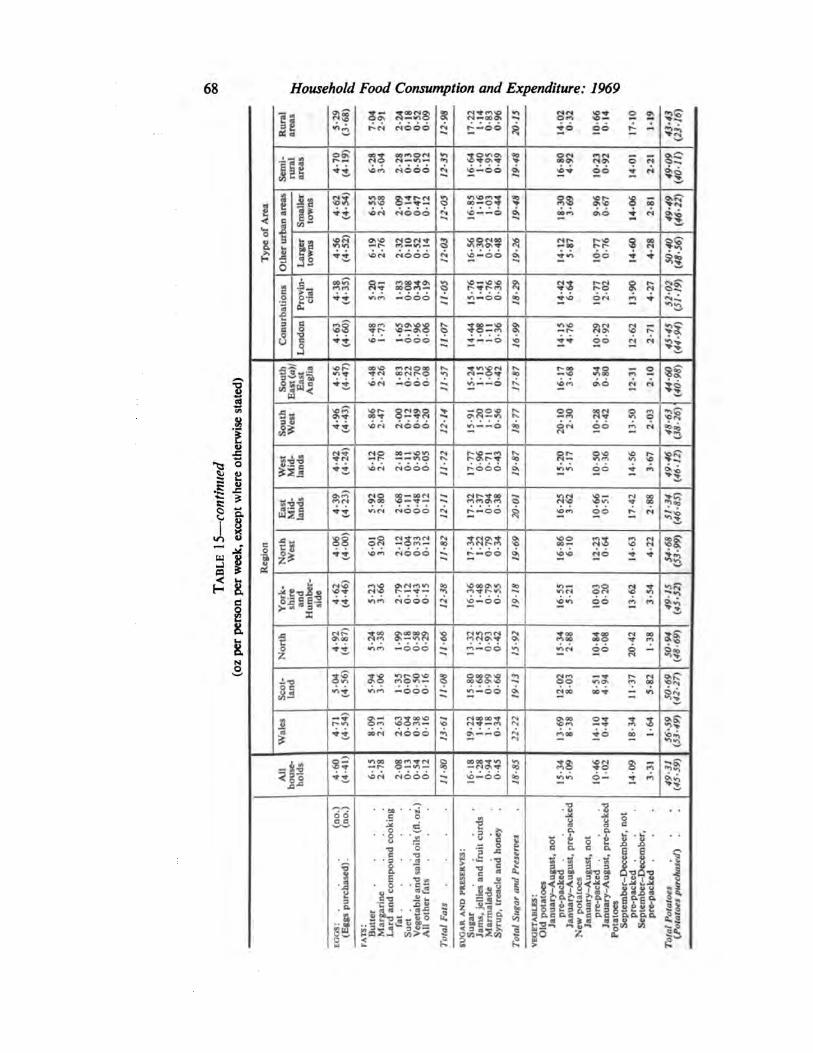
68 Household Food Consumption and Expenditure: 1969
Rura
lare
as
5-2
9(3
-68
)
7-0
42
-91
0-1
80
-52
00
9 S
17
-22
11
40
-83
0-9
6
14
-02
10
-66
0-
14
17
-10
1-
19 3§
*3
Sem
i-ru
ral
4-7
0(4
-1
9)
6-2
83
04
2-2
80
13
0-5
00
-12 ~:
16
-64
1-4
00
-95
0-4
9 ?
16
-80
4-9
2
10
-23
0-9
2
14
-01
2-2
1
49
-09
(40
-11
)
2;
Typ
eof
Are
a
Oth
er
urb
an
are
as
Sm
alle
rto
wns
4-6
2(4
-54
)
6-3
52
-68
2-0
90
-14
0-4
70
-12
12
-05
16
-85
1-1
61
-03
0-4
4
19
-48
18
-30
3-6
9
9-9
60
-67
14
06
2-8
1
49
-49
(46
-22
)
tow
ns
4-5
6(4
-52
)
61
92
-76
2-3
20
10
0-5
20
14
12
-03
16
-56
1-3
00
-92
0-4
8
19
-26
14
12
5-8
7
10
-77
0-7
6
14
-60
4-2
8
SjC
onurb
ati
ons
Pro
vin
cial
4-3
8(4
-35
)
5-2
03
-41
1-8
30
-08
0-3
40
19 ?
15
-76
1-4
10
-76
0-3
6 %
14
-42
6-6
4
10
-77
20
2
13
-90
4-2
7
-—Lo
nd
on
6-4
8
1 -73
1 -65
01
90
96
00
6
11
-07
14
-44
1-0
81
11
0-3
6
16
99
14
15
4-7
6
10
-29
0-9
2
12
-62
2-7
1
?$
South
East
(a)l
l| 4-5
6(4
-47
)
6-4
82
-26
1 -83
0-2
20
-70
0-0
8
11
-57
15
-24
1-1
51
-06
0-4
2 rx
l«
16
17
3-6
8
9-5
40
-80
12
-31
2-
10
IN.
South
West
4-9
6(4
-43
)
6-8
62
-47
2-0
00
-12
0-4
90
-20 %
15
-91
1-2
01
10
0-5
6 N.*5
20
10
2-3
0
10
-28
0-4
2
13
-50
20
3
—. *S
West
Mid
lands
6-1
22
-70
2-1
80
11
0-5
60
05
11
-72
17
-77
0-9
60
-71
0-4
3
19
-87
15
-20
5-1
7
10
50
0-3
6
14
-56
3-6
7 fS
East
Mid
lands
4-3
9(4
-23
)
5-9
22
-80
2-6
80
-11
0-4
80
-12
12
-11
17
-32
1-3
70
-94
0-3
8
20
-01
16
- 25
3-6
2
10
-66
0-5
1
17
-42
2-8
8
"loo
Regio
n
Nort
hW
est
4
06
(4-0
0)
6-0
13
-20
2-
12
0-0
40
-33
0-1
2
ZS-l
l
17
-34
1-2
20
-79
0-3
4
19
-69
16
-86
6-1
0
12
-23
0-6
4
14
-63
4-2
2
York
shir
eand
Hum
ber-
side
4-6
2(4
-46
)
5-2
33
-66
2-7
9
0-4
30
15
—■ 16
-36
1-4
80
-79
0-5
5 ■
16
-55
5-2
1
10
03
0-2
0
13
-62
3-5
4
Nort
h
4-9
2(4
-87
)
5-2
43
-38
1-9
90
18
0-5
80
-29 c
•o<-J r-l(N
r-l—OO
?
15
-34
2-8
8
10
-84
0-0
8
20
-42
1 -38
at|°>
Sco
tla
nd
5-0
4(4
-56
)
5-9
43
06
1 -35
00
70
-50
0-1
6
11
-08
15
-80
1-6
80
-99
0-6
6
—-
12
02
8-0
3
8-5
14
-9
4
11
-37
5-8
2
—.
1
4-7
1(4
-54
)
80
92
-31
2-6
30
-04
0-3
80
16
«n 19
-22
1-4
81
-18
|22
-22
13
-69
8- 3
8
14
10
0-4
4
18
-34
1-
64
^>
All
house
hold
s
4-6
0(4
-41
)
6-1
52
-78
2-0
80
13
0-5
40
12
11
-80
16
-18
1-2
80
-94
0-4
5
15
-34
5-0
9
10
-46
1-0
2
14
09
3-3
1
eg
os:
.
.
.
(no.)
(Eg
gs
purc
hase
d)
.
(no.)
Butt
er
....
Marg
ari
ne
Lard
and
com
pound
cooki
ng
fat
Suet
Veg
eta
ble
and
sala
doils
(fl.
oz.
)A
lloth
er
fats
Tota
lFa
ts..
..
Sug
ar
....
Jam
s,je
llies
and
fruit
curd
sM
arm
ala
de
Syru
p,
treacl
eand
honey
Tota
lS
ug
ar
and
Pre
serv
es
veg
eta
ble
s:O
ldp
ota
toes
January
-Aug
ust
,not
pre
-pack
ed
.
January
-Aug
ust
,p
re-p
ack
ed
New
pota
toes
January
-Aug
ust
,not
pre
-pack
ed
.
January
-Aug
ust
,p
re-p
ack
ed
Pota
toes
Sep
tem
ber-
Dece
mb
er,
not
pre
-pack
ed
.
Sep
tem
ber-
Dece
mb
er,
pre
-pack
ed
.
SU
GA
RA
ND
PR
ES
ER
VES
:
(Pota
toes
purc
hase
d)
fats
:
Tota
lPota
toes
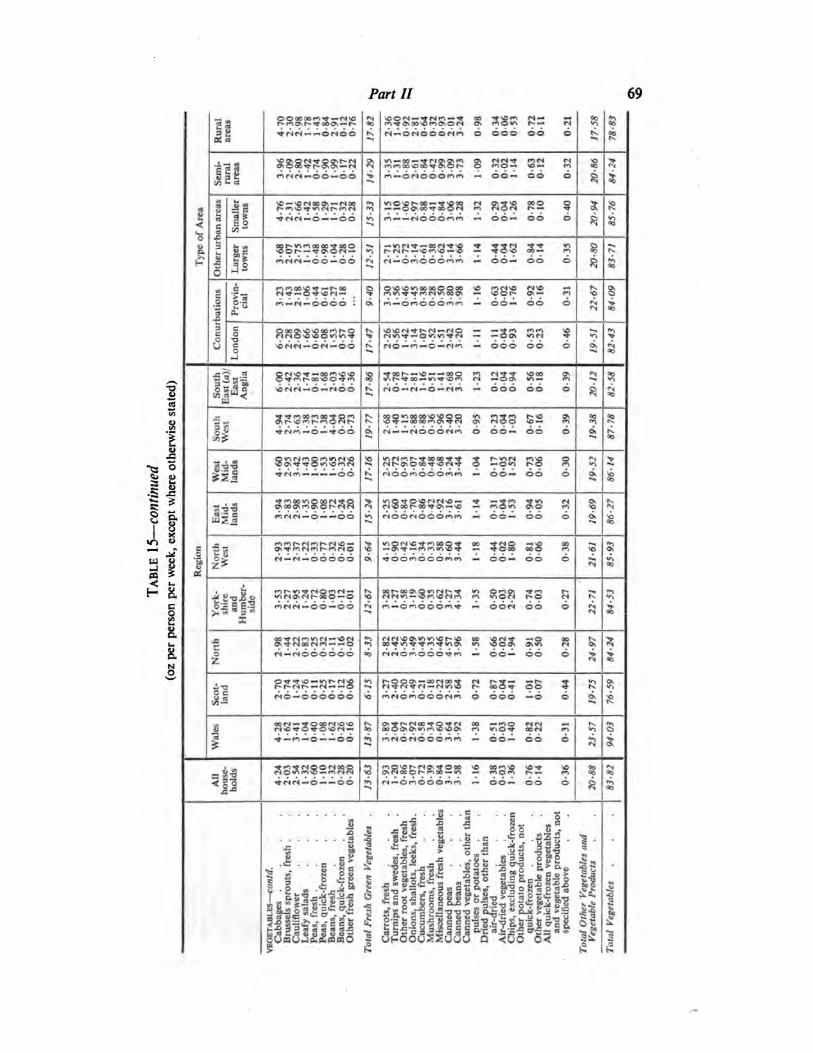
Part II 69
Rura
lare
as
4-7
02
-30
2-9
8
1 '78
1 -43
0-8
42
-91
01
20
-76
17
-82
n —6ri666rn-i 6 666 66 6
17
-58
78
-83
Sem
i-ru
ral
are
as
3
35
1-
31
0-8
82
-6
10
-84
0-4
20
-99
30
93
-73
10
9
0-
32
00
21
-1
4
0-6
30
12
0-3
2
20
-86
Typ
eof
Are
a
Oth
er
urb
an
are
as
1
Sm
alle
rto
wns
■*riN— 6— —66 15
-33 PI g!3S S2 f
rt«-No66nm — 66— 66 6
20
-94
85
-76
Larg
er
tow
ns
3-6
82
07
2-7
51
-13
0-4
80
-98
10
40
-28
01
0
12
-51
2-
71
1-2
50
-72
31
40
-61
0-3
80
-62
31
43
-6
6
11
4
0-4
40
-0
4
1-
62
0-8
40
14
0-3
5
20
-80
83
-71
Conurb
ati
ons
Pro
vin
cial
3-2
3
1 -43
21
81
06
0-4
40
-61
0-2
70
18
94
0
3-3
01
-56
0-4
63
-45
0-3
80
-28
0-5
03
-80
3-9
8
11
6
0-6
30
02
1-7
6
0-9
20
-16
0-3
1 t-**o
84
-09
*N
Lond
on
6-2
02
-28
20
9
1 '66
0-6
62
08
1 -53
0-5
70
-40
17
-47
2-2
60
-56
3-
14
1-07
0-
52
1-5
12
-4
23
-2
0
11
1
01
10
04
0-9
3
0-5
30
-23
0-4
6
19
-51
South
East
(a)/
East
Anglia
60
02
-42
2-3
6
1
-74
0-8
1
1 -68
20
30
-46
0-3
6
Is. 2-5
40
-7
81
- 47
2-
81
1•
16
0-
51
14
12
-6
83
-3
0
1- 2
3
01
20
-04
0-9
4
0-5
60
18
0-3
9
20
12
"■■»
South
West
rs 802oSSSSSS8 5 SSS £2 3
N--No6oNn 6 66— 66 6
19
-38
87
-78
West
Mid
lands «c?»**to«n«rKS
Is.
»n(Ni*>i-»f cooo r-«nfsi n so o<Nr- o\o obv son ^ o —o x"> r-o *N
"\>
IS, fSOOMOOOinn — 66— 66 6 —.
East
Mid
lands
3-9
42
-83
2-9
81
-35
0-9
01
08
1-
72
0-2
40
-20 <Ss©00r- 00 Os«- so — MO"i OSO f"l
(NOOnOOOrin — OO— OO o
19
-69
86
-27
Regio
n
Nort
hW
est
2-9
31
-43
2-
37
1 -22
0-3
30
-77
0-3
20
-26
0-0
1 Sg^SSSKS? 2 3SS 8•iooonooo^m — 66— 66 6
21
-61 3
York
shir
eand
H
um
ber-
side
I1NN-66-66
55
n-Onooonv « OON 66 6
22
-71
S3
oo
Nort
h
30-f (N >^'.fN—O fN m•n
fs in soos»n«nsor»so oo soin* —o oooo^«n^^-n^<nos <5oo\ Os«o tN
24
-97 ?
w —nOOOOOO (NNOnOOOtW — OO— OO O >oo
2-7
0
1-
24
0-7
60
-11
0-2
50
17
01
20
06 RS8Sm2SK3 P £3? 5S 3
ncionooonn 6 666 —6 6
76
-59
Sco
tla
nd
0-7
4
sc
19
-75
1
4-2
81
-62
3-4
1
1 -04
0- 4
01
08
1- 6
20
-26
0-1
6 K C*3I^M0O-*Q-*<N 00 —mO (NfN —
nwotiobonn — 66— 66 6
Is "i o
3
All
hold
s
13
-63 SSSSPR32K 2 S3S £2 S
20
-88 •N
(S—6oo.666mro — 66— 66 6
OO
Cab
bag
es
....
Bru
ssels
spro
uts
,fr
esh
.
Caulif
low
er
Leafy
sala
ds
Peas,
fresh
....
Oth
er
fresh
gre
en
veg
eta
ble
s
Tota
lFr
esh
Gre
en
Veg
eta
ble
s
Carr
ots
,fr
esh
Turn
ips
and
swed
es,
fresh
Oth
er
root
veg
eta
ble
s,fr
esh
Onio
ns,
shallo
ts,
leeks
,fr
esh
.C
ucu
mb
ers
,fr
esh
Mush
room
s,fr
esh
Mis
cella
neous
fresh
veg
eta
ble
sC
anned
peas
Canned
beans
Canned
veg
eta
ble
s,oth
er
than
air
-dri
ed
Air
-dri
ed
vegeta
ble
sC
hip
s,excl
ud
ing
quic
k-fr
oze
nO
ther
pota
top
rod
uct
s,not
quic
k-fr
oze
nO
ther
veg
eta
ble
pro
duct
sA
llq
uic
k-fr
oze
nveg
eta
ble
sand
veg
eta
ble
pro
duct
s,not
S3
puls
es
or
pota
toes
Dri
ed
puls
es,
oth
er
than
Tota
lO
ther
Veg
eta
ble
sand
Veg
eta
ble
Pro
duct
s
VEG
ETA
D
LES—
CO
fttd
.
Peas,
quic
k-fr
oze
n
Beans,
quic
k-fr
oze
n
speci
fied
ab
ove
Tb
fa/
Veg
eta
ble
s
Beans,
fresh
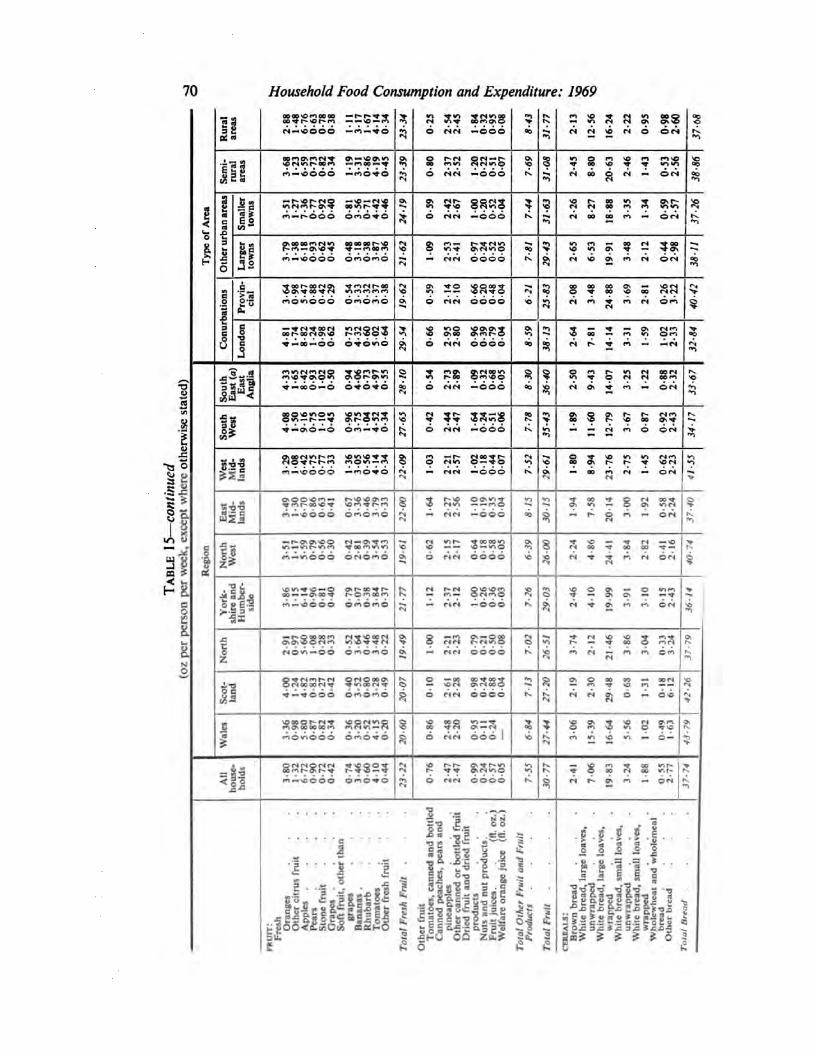
70 Household Food Consumption and Expenditure: 1969
a S3 SX «
111«2S
JLJ <2"5 5£ o
s § is
-r-, —T ©
COmOsmM xf os—soOnsoMmr^oom «noe«^r-j—COCO -tnO*0
-hvLh-rlO —sO—M SO»oM mr- os-3- aosor-m—r-OOO omo^O
OsOOoomM*-* oooooor-sor*m —ft«t v —moom
Soor- oofNOs *t mrs r- oo
Oi^oo**m iflnnnMno^ooo o^ociO
aor- oors onso r-mse©s©
fttoOn
m t *o ^ M «oooM tn^- oomonOC MM -CCO
© r-M ©m—r-oo mm (Nrjv,oO MM —OOO
Os Nl- QON}so *-s© ONTiO6 MM —OOO
8 m — htN«v-> - osm»o©— mm 6666
ON ^© «o»2m — — cn-rc6 mm 6666
* vio« Onoo On r- ©6 mm 6666
m s© ^ M !0 ooc>*n M M ON ©ss©
M M »C M 6 ON
in o m s© m (*i>o* oo so ^ T *•/-»M 00 © (N — ON
so r- oo w> onr-M M 00 m MM 00 00 m — 6<S
w-> m — oo M ooso sn on — -*onM SO Os m M OtN
00 00 30 0 — SOMJO "t OO -O M NNN «n n N 6<n
3
* " ^ — OS M**»s© oo — m m ©mm *«■ m — — m
*1
II1
!iJI
j< 8J i5 £ E-
•Si
cc7,
it
m\Cf 0\©»7>Os©r-Os»n^■—006—6 o 6 6
MA OSMOCO•o r^oo ©m05©6 MM —OOO
Q n N n n kinm *#• O M M 0OmM On ««■m — 6 M
Is
3
©to — r- —t osr-©v"tm
^j-
—on©—© 6m« ■*©n 55 SmI^S
6 MM —COO
os © as r- r»00 so P- SO 00 Q-*T— — Mm© OM
aooM»nr-msosnso^j-■<»■
O^T-f-m MO"!""*!n-si66o -^0*0
8 m — r- Moo^r-O MW> ©—^ O— MM —OOO
O * so «n »rt M^oo Os r- r- ^ som— 00 m rs — ©M
r*sosoos 3r-*o o»wj<NSO ——mo
— MM —OOO
00 O M OOTfCS «0 — O On «nM— t- C " — ©M
M
—r- osOs■r— . . r-m —«n©
soo M —os^m«nm ^oomsriio66 ©Mom©
M w>r- ^ 0000*n\© —— so-moO MM OOO©
sO — M —so00 '"f 00 00 —
m M ©M
nD»O'sTS0—© ONP-OO^T-00— osoo^- r-omoomm—soooo ©mom©
M r-M 0 sosom— m — o mm©— mm —666
sc O os — © «om— ON ON — —^CN x
j-
On m m ©M
—p^Ooooom M*sOooMOso>«©Mm sn\0 »N<NO so—O O ©m©m©
© —m Os—©00O MM r- <N«o0— mm 6666
^ M SO so -& m^rp^ — 00 o mnm M — m m ©m
M
8^Mmr-MM 00OOM^■—■^■OOO
© —00 00* 00— soM asm00©
6 MM OOOOOS ©— mM M
00 00 — COM-W so m ——
© — ©sO
so 00© «o—■»?■00 T M OS—M
6 mm 666 1
« 0s so M Osm© m »o *n © *son m so «n - O —
<|1
OMMOMM f-CQO-Toomr-osr--* r- >0—m —so6©0 O mC T O
so r~r- os r~*or- osM*o©
6 MM OOOC
— so m ^ 00 mr-^ © 00 M 00M r- On m — on
i
I . • • .j
• ■ ■
.J
1I1 Mini?
!lJIfS*i
S-o c _ 00
o c■o* -t) 2 • .etc ^: ,
iKlilMf is 1
3HU 0Q Zu.^ "3
8 8 8 I I> > £ i •>>
■°s> M 2a g*-ai J
: OJS 3£ six 3J= S££S —8» ? it * * 6 a
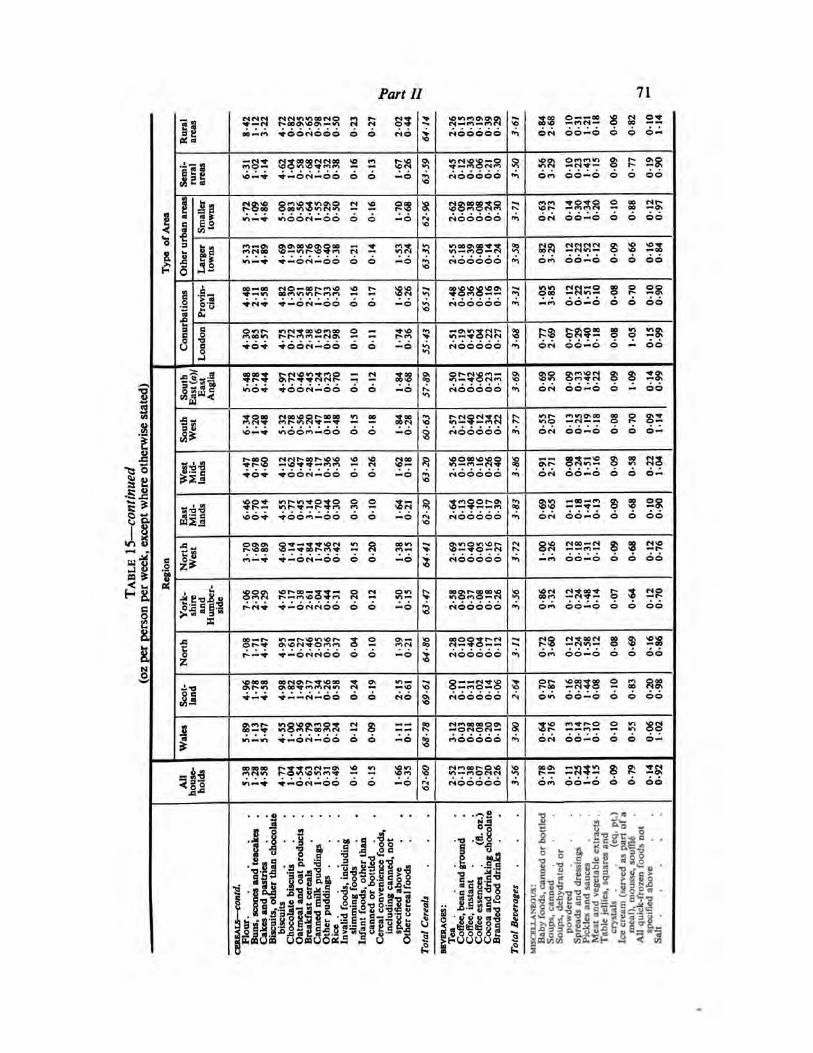
Part II 71
Rura
lare
as 32a sssissasi a r S5 -*
—.
0-8
42
-68
0-
10
0-
31
1-2
10
18
00
6
08
2
0-
10
1-
14
j eiooooo *l
Sem
i- a
63
11
02
41
4
4-6
21
-04
0-
58
2-6
81
-42
0-3
20
-38
0-1
6
0-
13
1-6
70
26
63
-59
|
2-4
50
12
0-3
60
-06
0-2
10
-30
3-5
0
|
0-5
63
-29
0-1
00
-2
31
- 43
01
5
00
9
0-7
7
01
90
-90
IO
ther
urb
an
are
as
Sm
alle
rto
wns P8S ssssaas 2 2 gs
62
-96
|S888SSn6s666 3
-7
1
0-6
32
-73
0-
14
0-
30
1-3
40
-20
0-1
0
0-8
8
01
20
-97
Typ
eof
Are
a
Larg
er
tow
ns
5-3
31
-21
4-8
9
4-6
91
19
0-
58
2-7
61
-69
0-4
00
-38
0-2
1
0-
14
1-
53
0-2
4
63
-35
|rJOOOOO
°o
0-8
23
-29
0-
12
0-
22
1-
52
01
2
00
9
0-6
6
01
60
84
Conurb
ati
ons
Pro
vin
cial
4-4
82
-11
4-5
8
4-8
21
-30
0-
51
2-5
81
-77
0-3
30
-3
6
01
6
01
7
1-
66
0-2
6
65
-51
1
2-4
80
-06
0-3
60
-06
01
60
-19
«n 1-0
53
-85
0-1
20
-2
21
- 51
0-1
0
00
8
0-7
0
0-1
00
-90
Lond
on
4-3
00
-85
4-5
7
4-7
50
-72
0-
34
2-3
81
-1
60
-23
0-9
8
01
0
0-
11
1-7
40
-36 5
n66666 ?
0-7
72
-69
0-0
70
-2
91
-40
01
8
0-0
8
10
5
01
50
-99
South
East
(a)/
East
Anglia S
3
*->
3-6
9
1SSS 8R«a 8 8 28:
«ot »oon-oo 0 0 —0 noooo 0 on 00—0 0 — 00
South
West
6-3
41
-20
4-4
8
5-3
20
-78
0-
56
3-2
01
-47
0-1
80
-4
8
01
5
01
8
1-8
40
-28
60
-63
1
2-5
70
-12
0-4
00
-12
0-3
40
-22
0-5
52
07
0-
13
0-
25
1-
19
0-1
8
0-0
8
0-7
0
00
91
-1
4
West
Mid
lands
4-4
70
-78
4-6
0
4-
12
0-6
20
-47
2-4
81
17
03
60
-36
0-1
6
0-
26
1-
62
0-1
8
63
-20
1
rsooooo 3-8
6
0-9
12
-71
0-0
80
-2
41
-51
01
6
00
9
0-5
8
0-2
21
04
East
Mid
lands
6-4
60
-70
4-1
4
4-5
50
-77
0-4
53
14
1-7
00
-44
0-3
0
0-3
0
01
0
16
40
-21
62
-30
csooooo 0-6
92
-65
0-1
10
-1
81
-41
01
3
00
9
0-6
8
01
00
-90
Nort
hW
est
3-7
01
-69
4-
89
4-6
01
-1
40
-4
12
-8
41
-74
0-3
60
-42
0-
15
02
0
1-3
80
15
2-6
90
-15
04
00
-05
0-1
60
-27
3-7
2
\1
-00
3-2
6
0-1
20
-1
81
-31
0-1
2
00
9
0-6
8
0-1
20
-76
Regio
n
63
-47
I
York
shir
eand
Hum
ber-
side
70
62
-30
4-2
9
4-7
61
17
0-3
82
-61
2-0
40
-44
0-3
1
0-2
0
0-
12
1-
50
0-1
5 K8RS28
0-8
63
-32
01
20
-2
41
-48
0-1
4
00
7
0-6
4
01
20
-70
e\£>oooo
Nort
h
70
8
1-
71
4-4
7
4-9
51
61
0-2
72
-4
62
05
0-3
60
-37
0-0
4
0-
10
1-
39
0-2
1
> 2-2
80
-10
0-4
00
-04
01
70
12
0-7
23
-60
0-
12
0-
24
1-
58
01
2
0-0
8
0-6
9
01
60
-86
Sco
tla
nd
4-9
61
-78
4-5
8
4-9
81
-82
1-
49
2-
37
1-3
40
-26
0-5
8
0-2
4
0-1
9
2-
15
0-6
1 32 2
00
01
10
-31
0-0
20
14
00
6 ?
0-7
05
-87
0-1
60
-2
81
-44
0-0
8
0-1
0
08
3
0-2
00
-98
Wale
s
5-8
91
-13
5-4
7
4-5
51
-00
0-
36
2-7
91
-83
0-3
00
-24
0-
12
00
9
1-1
10
-11
68
-78 —ono<s — S
0-6
42
-76
0-1
30
-1
41
- 37
01
0
0-1
0
0-5
5
0-0
6
1-
02
^66666 "n
All
hold
s
«n— 4 4 —6<n —66 6 6 —6
62
-60
|
2-5
20
13
03
80
-07
0-2
00
-26 »o
0-7
83
19
0-1
10
-2
51
-44
01
5
00
9
0-7
9
01
40
-92
Flour.
....
Buns,
scones
and
teaca
kes
Cake
sand
past
ries
Bis
cuit
s,oth
er
than
choco
late
bis
cuit
sC
hoco
late
bis
cuit
sO
atm
eal
and
oat
pro
duct
sB
reakf
ast
cere
als
Canned
milk
pud
din
gs
Oth
er
pud
din
gs
.
Ric
e canned
or
bott
led
Cere
al
convenie
nce
food
s,
speci
fied
ab
ove
.
.
Oth
er
cere
al
food
s
Tea
Coff
ee
ess
ence
s.
(fl.
oz.
)C
oco
aand
dri
nki
ng
choco
late
Bra
nd
ed
food
dri
nks
mis
cella
neous:
Bab
yfo
od
s,ca
nned
or
bott
led
Soup
s,ca
nned
Soup
s,d
ehyd
rate
dor
pow
dere
dS
pre
ad
sand
dre
ssin
gs
Pic
kles
and
sauce
sM
eat
and
vegeta
ble
extr
act
s
.
Tab
leje
llies,
square
sand
cryst
als
.
(eq
.p
t.)
Ice
cream
(serv
ed
as
part
of
a
meal)
,m
ouss
e,
souff
leA
Uq
uic
k-fr
oze
nfo
od
snot
speci
fied
above
Salt
CER
EA
LS—
CO
Md
.
Invalid
food
s,in
clud
ing
slim
min
gfo
od
sIn
fant
food
s,oth
er
than
incl
ud
ing
canned
,not
Tota
lC
ere
als
Coff
ee,
bean
and
gro
und
Coff
ee,
inst
ant
Tota
lB
evera
ges
BEV
ER
AG
ES
:


Tables relating to Income Group Differences in
Average Consumption, Expenditure or Prices, 1969
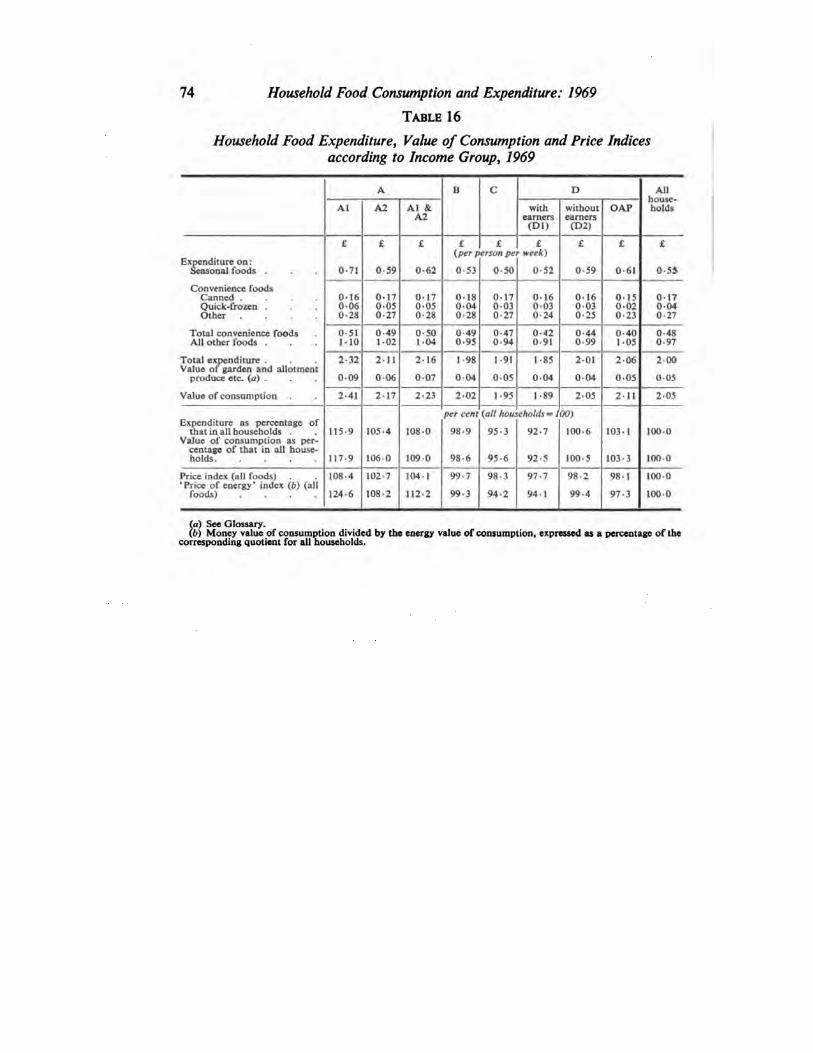
74 Household Food Consumption and Expenditure: 1969
Table 16
Household Food Expenditure, Value of Consumption and Price Indicesaccording to Income Group, 1969
A B C D All
Al A2 Al &A2
with without OAP holdsearners earners(Dl) (D2)
Expenditure on:Seasonal foods .
£ £
0-59
£
0-62
£ £ £(per person per week)
£
0-59
£
0-61
£
0-55
Convenience foodsCanned ....Quick-frozen .Other ....
0-71 0-53 0-50 0-52
0160060-28
0170-050-27
017 0180-040-28
0170030-27
0-160-030-24
0-160-030-25
0150020-23
0170040-27
0050-28
Total convenience foodsAll other foods .
0-511-10
0-491-02
0-501-04
0-490-95
0-470-94
0-420-91
0-440-99
0-401-05
0-480-97
Total expenditure .Value of garden and allotment
produce etc. (o) .
2-32
009
2-11
0-06
216
007
1 98
0-04
1-91
0-05
1-85
004
201
0-04
2-06
0-05
2 00
005
Value of consumption 2-41 2-17 2-23 202 1-93 1-89 205 2-11 2 05
Expenditure as percentage ofthat in all households . 115-9
117-9
105-4
106-0
1080
1090
per cent
98-9
(all hou.
95-3
eholds=100)
92-7 100-6 103-1
103-3
1000
100-0
Value of consumption as percentage of that in all households 98-6 95-6 92-5 100-5
Price index (all foods)'Price of energy' index (b) (all
foods) .... 108-4
124-6
102-7
1082
104-1
1122
99-7
99-3
98-3
94-2
97-7
94-1
98-2
99-4
981
97-3
1000
1000
(a) See Glossary.(b) Money value of consumption divided by the energy value of consumption, expressed as a percentage of the
corresponding quotient for all households.
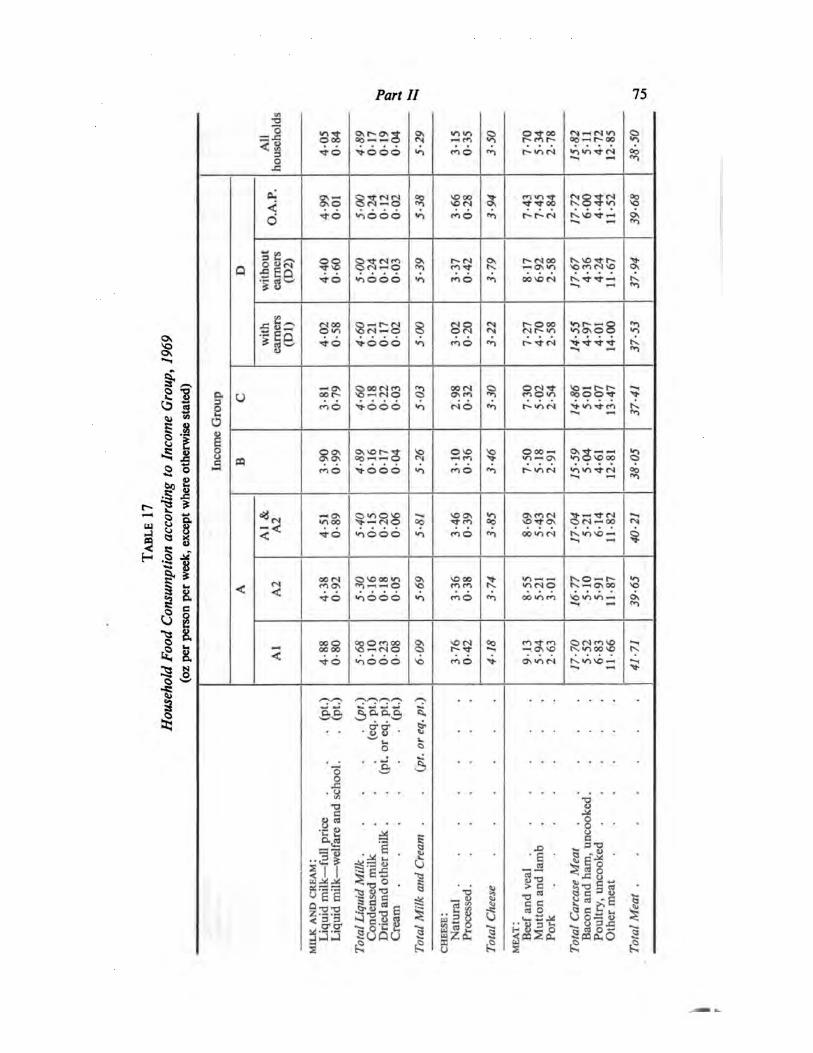
Table
17
House
hold
Food
Consu
mpti
on
acc
ord
ing
toIn
com
eG
roup,
19
69
(oz
per
pers
on
per
week,
exce
pt
where
oth
erw
ise
state
d)
All
house
hold
s
40
5
0-8
4
4-8
9
01
7
01
9
00
4
5-2
9
31
5
0-3
5
3-5
0
7-7
05
-34
2-7
8
15
-82
5-1
1
4-7
2
12
-85
38
-50
O.A
.P.
4-9
9
00
1
5-0
0
0-2
4
01
2
00
2
5-3
8
3-6
6
0-2
8
3-9
4
7-4
3
7-4
5
2-8
4
17
-72
60
0
4-4
4
11
-52
39
-68
wit
hout
earn
ers
(D2
)
4-4
0
0-6
0
5-0
0
0-2
4
01
2
00
3
5-3
9
3-3
7
0-4
2
3-7
9
81
7
6-9
2
2-5
8
17
-67
4-3
6
4-2
4
11
-67
37
-94D
wit
h
earn
ers
(Dl)
4-0
2
0-5
8
4-6
0
0-2
1
01
7
00
2
5-0
0
3
02
0-2
0
3-2
2
7-2
7
4-7
0
2-5
8
14
-55
4-9
7
40
1
14
00
37
-53
Inco
me
Gro
up C
3-8
1
0-7
9
4-6
0
01
8
0-2
2
00
3
5-0
3
2.9
8
0-3
2
3-3
0
7-3
0
5
02
2-5
4
14
-86
50
1
4-0
7
13
-47
37
-41
B
3-9
0
0-9
9
4-8
9
01
6
01
7
0-0
4
5-2
6
31
0
0-3
6
3-4
6
7-5
0
5-1
8
2-9
1
15
-59
5-0
4
4-6
1
12
-81
38
-05
Al
&A
2
4-5
10
-89
5-4
0
01
5
0-2
0
00
6
5-5
/
3-4
6
0-3
9
3-8
5
8-6
9
5-4
3
2-9
2
17
-04
5-
21
6-
14
11
-82
40
-21
A A2
4-3
8
0-9
2
5-3
0
01
6
01
8
00
5
5-6
9
3-3
6
0-3
8
.1-7
4
8-5
5
5-2
1
30
1
16
-77
51
0
5-9
1
11
-87
39
-65
Al
4-8
8
0-8
0
5-6
80
10
0-2
3
00
8
60
9
3-7
6
0-4
2
41
8
91
3
5-9
4
2-6
3
17
-70
5-
52
6-
83
11
-66
41
-71
Liq
uid
milk
—fu
llp
rice
.
.
.
(pt.
)
Liq
uid
milk
—w
elfare
and
school.
.
(pt.
)
•
(Pt.
)
■
(eq
.pt.
)
(pt.
or
eq
.pt.
)
.
•(p
t.)
(pt.
or
eq
.p
t.)
■
MIL
KA
ND
CR
EA
M
I
Tota
lLi
quid
Milk
.
Cond
ense
dm
ilkD
ried
and
oth
er
milk
.
Cre
am
....
Tota
lM
ilkand
Cre
am
.
Tota
lC
heese
Pork
....
Baco
nand
ham
,unco
oke
d.
Poult
ry,
unco
oke
d
.
Oth
er
meat
Tota
lM
eat
....
cheese
:
meat:
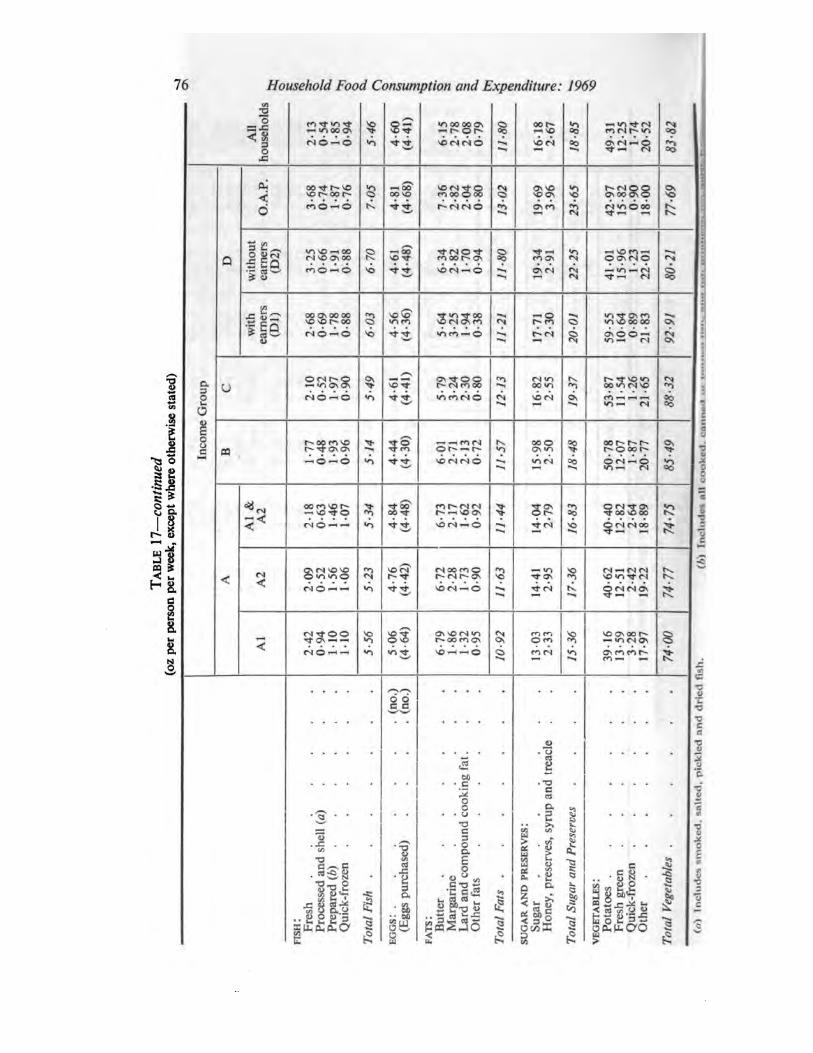
» Onto © S:6. $ toas: Ioa
Table
17
—co
nti
nued
(oz
per
pers
on
per
week,
exce
pt
where
oth
erw
ise
state
d)
All
house
hold
s
2-1
3
0-5
4
1-8
5
0-9
4
5-4
6
4-6
0
(4-4
1)
61
5
2-7
82
08
0-7
9
11
-80
16
-18
2-6
7
18
-85
49
-31
12
-25
1-7
4
20
-52
77
-69
83
-82
O.A
.P.
3-6
8
0-7
41
-87
0-7
6
7-0
5
4-8
1
(4-6
8)
7-3
62
-82
2-0
4
0-8
0
13
-02
19
-69
3-9
6
23
-65
42
-97
15
-82
0-9
0
18
00
D
wit
hout
earn
ers
(D2
)
3-2
5
0-6
6
1-9
10
-88
6-7
0
4-6
1
(4-4
8)
6-3
42
-82
1-7
0
0-9
4
11
-80
19
-34
2-9
1
22
-25
41
-01
15
-96
1-2
3
22
-01
80
-21
wit
h
earn
ers
(Dl)
2-6
8
0-6
9
1-7
8
0-8
8
6-0
3
4-5
6
(4-3
6)
5-6
4
3-2
5
1-9
4
0-3
8
11
-21
17
-71
2-3
0
20
-01
59
-55
10
-64
0-8
9
21
-83
92
-91
Gro
up C
21
0
0-5
2
1-9
7
0-9
0
5-4
9
4-6
1
(4-4
1)
5-7
9
3-2
4
2-3
0
0-8
0
12
-13
16
-82
2-5
5
19
-37
53
-87
11
-54
1-2
6
21
-65
74
-75
85
-49
88
-32
Inco
me
B
1-7
7
0-4
8
1-9
3
0-9
6
5-1
4
4-4
4
(4-3
0)
60
1
2-7
1
2-1
3
0-7
2
11
-57
15
-98
2-5
0
18
-48
50
-78
12
-07
1-8
7
20
-77
Al
&
A2
2-1
8
0-6
3
1-4
6
1-0
7
5-3
4
4-8
4
(4-4
8)
6-7
3
2-1
7
1-6
20
-92
11
-44
14
-04
2-7
9
16
-83
40
-40
12
-82
2-6
4
18
-89
(h)
A A2
20
9
0-5
2
1-5
6
1-0
6
5-2
3
A-1
6
(4-4
2)
6-7
2
2-2
8
1-7
3
0-9
0
11
-63
14
-41
2-9
5
17
-36
40
-62
12
-51
2-4
2
19
-22
74
-77
Al
2-4
2
0-9
4
11
0
1-1
0
5-5
6
50
6
(4-6
4)
6-7
9
1-8
6
1-3
2
0-9
5
10
-92
13
-03
2-3
3
15
-36
39
16
13
-59
3-2
8
17
-97
74
-00
sh.
(a)
Incl
ud
es
smoke
d,
salt
ed
,p
ickl
ed
and
dri
ed
f
Fresh
Pro
cess
ed
and
shell
(a)
...
Pre
pare
d(b
)
Quic
k-fr
oze
n
Tota
lFi
sh
eg
gs:
(no.)
(Eg
gs
purc
hase
d)
....
(no.)
Butt
er
Marg
ari
ne
......
Oth
er
fats
Tota
lFa
ts
Sug
ar
Tota
lS
ug
ar
and
Pre
serv
es
....
Pota
toes
.......
Fresh
gre
en
......
Quic
k-fr
oze
n......
Oth
er
Tota
lV
eg
eta
ble
s
fish
:
fats
: Lard
and
com
pound
cooki
ng
fat
.
SU
GA
RA
ND
PR
ES
ER
VES
!
Honey,
pre
serv
es,
syru
pand
treacl
e
VEG
ETA
BLE
S
:
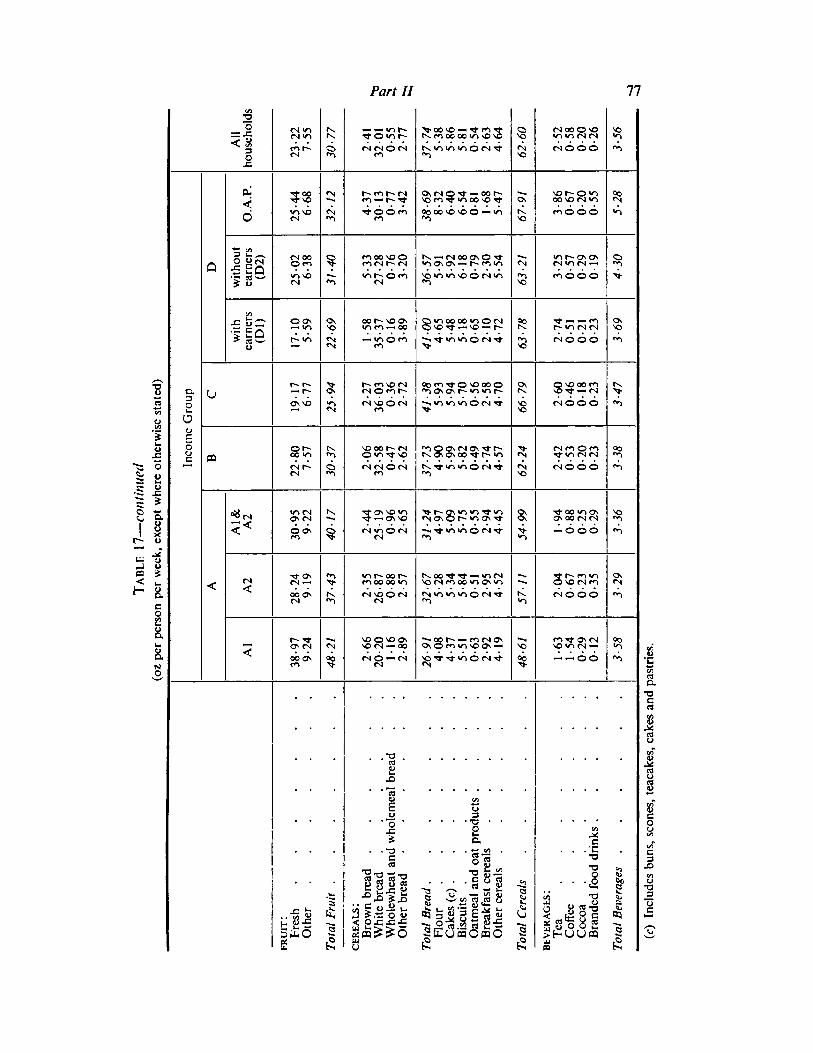
JTable
17
—co
nti
nued
(oz
per
pers
on
per
week,
exce
pt
where
oth
erw
ise
state
d)
All
house
hold
s
23
-22
7-5
5
30
-77
2-4
1
32
01
0-5
5
2-7
7
37
-74
5-3
8
5-8
6
5-8
1
0-5
4
2-6
3
4-6
4
62
-60
2-5
2
0-5
8
0-2
0
0-2
6
3-5
6
O.A
.P.
25
-44
6-6
8
32
-1
2
4-3
7
30
-1
3
0-7
7
3-4
2
38
-69
8-3
2
6-4
0
6-5
4
0-8
1
1-6
8
5-4
7
67
-91
3-8
6
0-6
7
0-2
0
0-5
5
5-2
8
wit
hout
earn
ers
(D2
)
25
02
6-3
8
31
-40
5-3
3
27
-28
0-7
6
3-2
0
36
-57
5-9
1
5-9
2
61
80
-79
2-3
0
5-5
4
63
-21
3-2
5
0-5
7
0-2
9
01
9
4-3
0D
wit
h
earn
ers
(Dl)
17
10
5-5
9
22
-69
1-5
8
35
-37
01
6
3-8
9
41
00
4-6
5
5-4
8
5-1
8
0-6
5
2-
10
4-7
2
63
-78
2-7
4
0-5
1
0-2
1
0-2
3
3-6
9
Inco
me
Gro
up C
19
-17
6-7
7
25
-94
2-2
7
36
03
0-3
6
2-7
2
41
-38
5-9
3
5-9
4
5-7
0
0-5
6
2-5
8
4-7
0
66
-79
2-6
0
0-4
6
0-1
8
0-2
3
3-4
7
B
22
-80
7-5
7
30
-37
2-0
6
32
-58
0-4
7
2-6
2
37
-73
4-9
0
5-9
9
5-8
2
0-4
9
2-7
4
4-5
7
62
24
2-4
2
0-5
3
0-2
0
0-2
3
3-3
8
A1
&
A2
30
-95
9-2
2
40
-17
2-4
4
25
19
0-9
6
2-6
5
31
-24
4-9
7
50
9
5-7
50
-55
2-9
4
4-4
5
54
-99
1-9
4
0-8
8
0-2
5
0-2
9
3-3
6
A A2
28
-24
91
9
37
-43
2-3
5
26
-87
0-8
8
2-5
7
32
-67
5-2
8
5-3
4
5-8
4
0-5
1
2-9
5
4-5
2
57
-11
2-0
4
0-6
7
0-2
3
0-3
5
3-2
9
Al
38
-97
9-2
4
48
-21
2-6
6
20
-20
11
6
2-8
9
26
-91
40
8
4-3
7
5-5
1
0-6
3
2-9
2
4-
19
48
-61
1-6
3
1-5
4
0-2
9
01
2
3-5
8
fruit
: Oth
er
Tota
lFr
uit
Bro
wn
bre
ad
Whit
eb
read
Whole
wheat
and
whole
meal
bre
ad
Oth
er
bre
ad
Tota
lB
read
Flour
Cake
s(c
)
Oatm
eal
and
oat
pro
duct
s....
Bre
akf
ast
cere
als
.....
Oth
er
cere
als
Tota
lC
ere
als
......
Tea
Coff
ee
.......
Coco
a
Bra
nd
ed
food
dri
nks
Tota
lB
evera
ges
......
cere
als
:
BEV
ER
AG
ES
:
(c)
Incl
ud
es
buns,
scones,
teaca
kes,
cake
sand
past
ries.
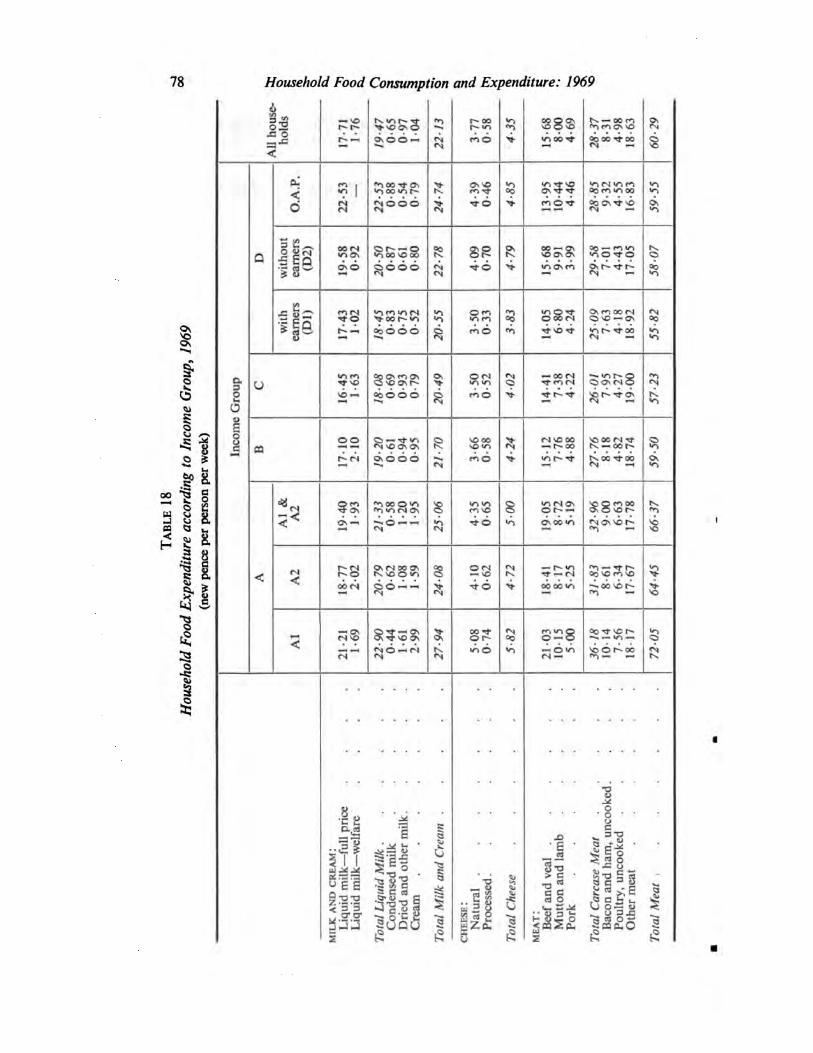
78 and Expenditure: 1969Household Food Consumption
hJ= o
in. wi r- ^
V* 00 ^en os so
PL
<c
w>■«*■soas ■*->r 00 m VI oo
CM
O 0<N•5 EO oooo
SOOnOS
»n as m s>r-
•lis
aocO
g
-~ vj oOOSNO
oo!—
95
(N COOS 3oo so r-
S ? 3 S> © 8\© O h* oo
0
§
2 6
>•aaa
o• o •gc
sax
5S<£^3
3 (J
3 £ I1«£o 1
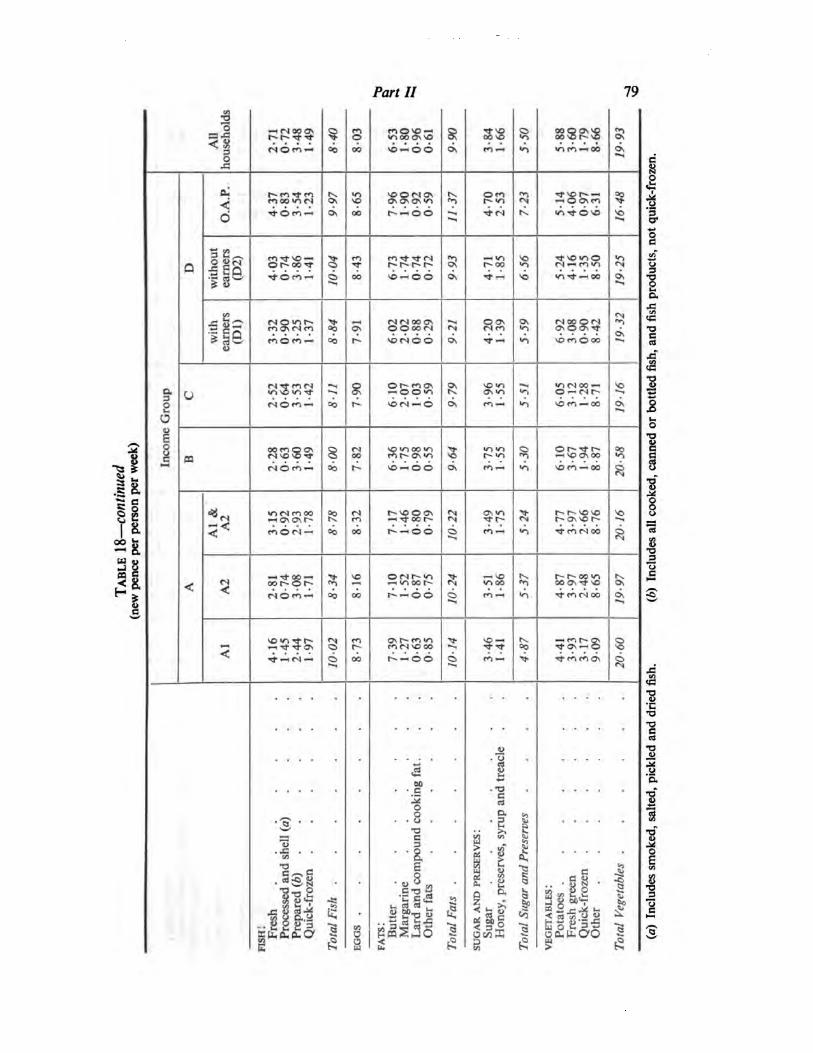
£Table
18
—co
nti
nued
(new
pence
per
pers
on
per
week)
All
house
hold
s
2-7
1
0-7
2
3-4
8
1-4
9
8-4
0
8
03
6-5
31
-80
0-9
6
0-6
1
99
0
3-8
4
1-6
6
5-5
0
5-8
8
3-6
0
1-7
9
8-6
6
19
-93
O.A
.P.
4-3
7
0-8
3
3-5
4
1-2
3
9-9
7
8-6
5
7-9
61
-90
0-9
2
0-5
9
11
-37
4-7
0
2-5
3
7-2
3
5-1
4
40
6
0-9
7
6-3
1
16
-48
D
wit
hout
earn
ers
(D2
)
40
3
0-7
4
3-8
6
1-4
1
10
-04
8-4
3
6-7
3
1-7
4
0-7
4
0-7
2
9-9
3
4-7
1
1
85
6-5
6
5-2
4
41
6
1-3
5
8-5
0
19
-25
wit
h
earn
ers
(Dl)
3-3
2
0-9
0
3-2
5
1-3
7
8-8
4
7-9
1
60
2
20
2
0-8
8
0-2
9
9-2
1
4-2
0
1-3
9
5-5
9
6-9
2
3
08
0-9
0
8-4
2
19
-32
Gro
up C
2-5
2
0-6
4
3-5
3
1-4
2
81
1
7-9
0
61
0
20
7
10
3
0-5
9
9-7
9
3-9
6
1-5
5
5-5
1
60
5
31
2
1-2
8
8-7
1
19
-16
Inco
me
B
2-2
8
0-6
3
3-6
0
1-4
9
8-0
0
7-8
2
6-3
6
1-7
5
0-9
8
0-5
5
9-6
4
3-7
5
1-5
5
5-3
0
61
0
3-6
7
1-9
4
8-8
7
20
-58
Al
&A
2
31
5
0-9
2
2-9
3
1-7
8
8-7
8
8-3
2
7-
17
1-4
6
0-8
0
07
9
10
-22
3-4
9
1-7
5
5-2
4
4-7
7
3-9
7
2-6
6
8-7
6
20
-1
6
A A2
2-8
1
0-7
4
30
8
1-7
1
8-3
4
8-1
6
71
0
1-5
2
0-8
7
0-7
5
10
24
3-5
1
1-8
6
5-3
7
4-8
7
3-9
7
2-4
8
8-6
5
19
-97
Al
41
6
1-4
5
2-4
4
1-9
7
10
02
8-7
3
7-3
9
1-2
7
0-6
3
0-8
5
10
-1
4
3-4
6
1-4
1
4-8
7
4-4
1
3-9
3
3-1
7
90
9
20
-60
Fresh
.
Pro
cess
ed
and
shell
(a)
.
.
Pre
pare
d(b
)
Quic
k-fr
oze
n
Tota
lFi
sh
EG
GS
Butt
er
Marg
ari
ne
......
Oth
er
fats
Tota
lFa
ts
Sug
ar
Honey,
pre
serv
es,
syru
pand
treacl
e
Tota
lS
ug
ar
and
Pre
serv
es
....
veg
eta
ble
s:
Pota
toes
.......
Fresh
gre
en
Quic
k-fr
oze
nO
ther
Tota
lV
eg
eta
ble
s......
fish
:
fats
: Lard
and
com
pound
cooki
ng
fat
.
sug
ar
and
pre
serv
es:
(a)
Incl
ud
es
smoke
d,
salt
ed
,p
ickl
ed
and
dri
ed
fish
.(b
)In
cludes
all
cooke
d,
canned
or
bott
led
fish
,and
fish
pro
duct
s,not
quic
k-fr
oze
n.
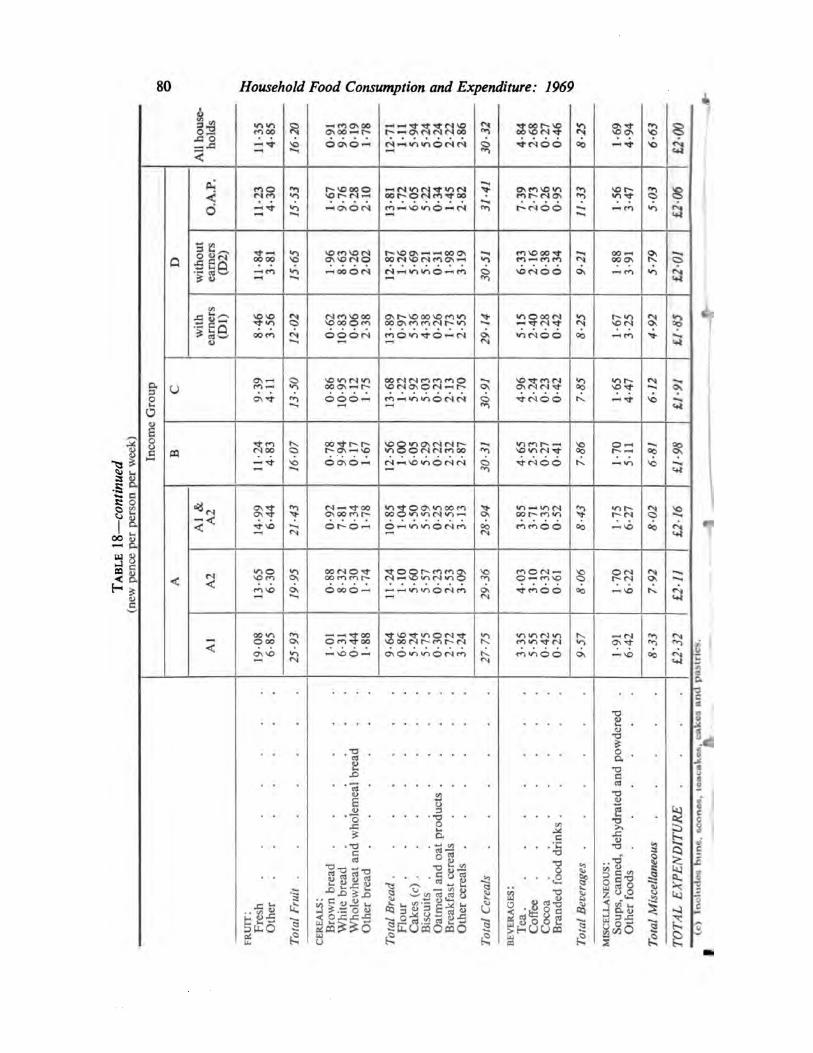
I 8o Ia. |I §a.§
All
house
hold
s
11
-35
4-8
5
16
-20
0-9
1
9-8
3
01
9
1-7
8
12
-71
1-1
1
5-9
4
5-2
4
0-2
4
2-2
2
2-8
6
30
-32
4-8
42
-68
0-2
7
0-4
6
8-2
5
1-6
9
4-9
4
6-6
3
12
-00
O.A
.P.
11
-23
4-3
0
15
-53
1-6
7
9-7
6
0-2
8
2-
10
13
-81
1-7
2
60
5
5-2
2
0-3
4
1-4
5
2-8
2
31
-41
7-3
9
2-7
3
0-2
6
0-9
5
11
-33
1-5
6
3-4
7
50
3
12
06
D
wit
hout
earn
ers
(D2
)
11
-84
3-8
1
15
-65
1-9
6
8-6
3
0-2
62
02
12
-87
1-2
6
5-6
9
5-2
1
0-3
1
1-9
8
3-1
9
30
-51
6-3
32
-16
0-3
8
0-3
4
9-2
1
1-8
8
3-9
1
5-7
9
12
-01
wit
h
earn
ers
(Dl)
8-4
6
3-5
6
12
02
0-6
2
10
-83
00
6
2-3
8
13
-89
0-9
7
5-3
6
4-3
8
0-2
6
1-7
32
-55
29
14
51
5
2-4
0
0-2
8
0-4
2
8-2
5
1-6
7
3-2
5
4-9
2
U-8
5
Inco
me
Gro
up C
9-3
9
41
1
13
-50
0-8
6
10
-95
01
2
1-7
5
13
-68
1-2
2
5-9
2
5
03
0-2
3
2-1
32
-70
30
-91
4-9
6
2-2
4
0-2
3
0-4
2
7-H
5
1-6
5
4-4
7
61
2
11
-91
(new
pence
per
pers
on
per
week)
B
11
-24
4-8
3
16
-07
0-7
8
9-9
4
01
7
1-6
7
12
-56
10
0
60
5
5-2
9
0-2
2
2-3
2
2-8
7
30
-31
4-6
5
2-5
30
-27
0-4
1
7-8
6
1-7
0
51
1
6-8
1
11
-98
Table
18
—co
nti
nued
Al
&A
2
14
-99
6-4
4
21
43
0-9
2
7-8
1
0-3
4
1-7
8
10
-85
10
4
5-5
0
5-5
9
0-2
5
2-5
8
31
3
28
-94
3-8
5
3-7
1
0-3
5
0-5
2
8-4
3
1-7
5
6-2
7
8-0
2
12
-16
A A2
13
-65
6-3
0
19
-95
0-8
8
8-3
2
0-3
0
1-7
4
11
-24
11
0
5-6
0
5-5
7
0-2
3
2-5
3
3-0
9
29
-36
40
3
31
0
0-3
2
0-6
1
8-0
6
1-7
0
6-2
2
7-9
2
12
-11
Al
19
08
6-8
5
25
-93
10
1
6-3
1
0-4
4
1-8
8
9-6
4
0-8
6
5-2
4
5-7
5
0-3
0
2-7
2
3-2
4
27
-75
3-3
5
5-5
5
0-4
2
0-2
5
9-5
7
1-9
16
-42
83
3
12
-32
Fresh
Oth
er
Tota
lFr
uit
Bro
wn
bre
ad
......
Whit
eb
read
Whole
wheat
and
whole
meal
bre
ad
Oth
er
bre
ad
Tota
lB
read
Cake
s(c
)B
iscu
its
Oatm
eal
and
oat
pro
duct
s....
Bre
akf
ast
cere
als
Oth
er
cere
als
Tota
lC
ere
als
......
Coff
ee
Coco
a
Bra
nd
ed
food
dri
nks
Tota
lB
evera
ges
......
mis
cella
neous:
Soup
s,ca
nned
,d
ehyd
rate
dand
pow
dere
dO
ther
food
s
Tota
lM
isce
llaneous
.....
TO
TA
LEX
PEN
DIT
UR
E....
fruit
:
cere
als
:
bevera
ges:
<r)
lm-1
n<
l<>
shun«;.
wnnn.
icui-
ukc
-i,
cakc
iam
ipuM
hL-
v
Tables relating to Household Composition Differences in
Average Consumption, Expenditure or Prices, 1969
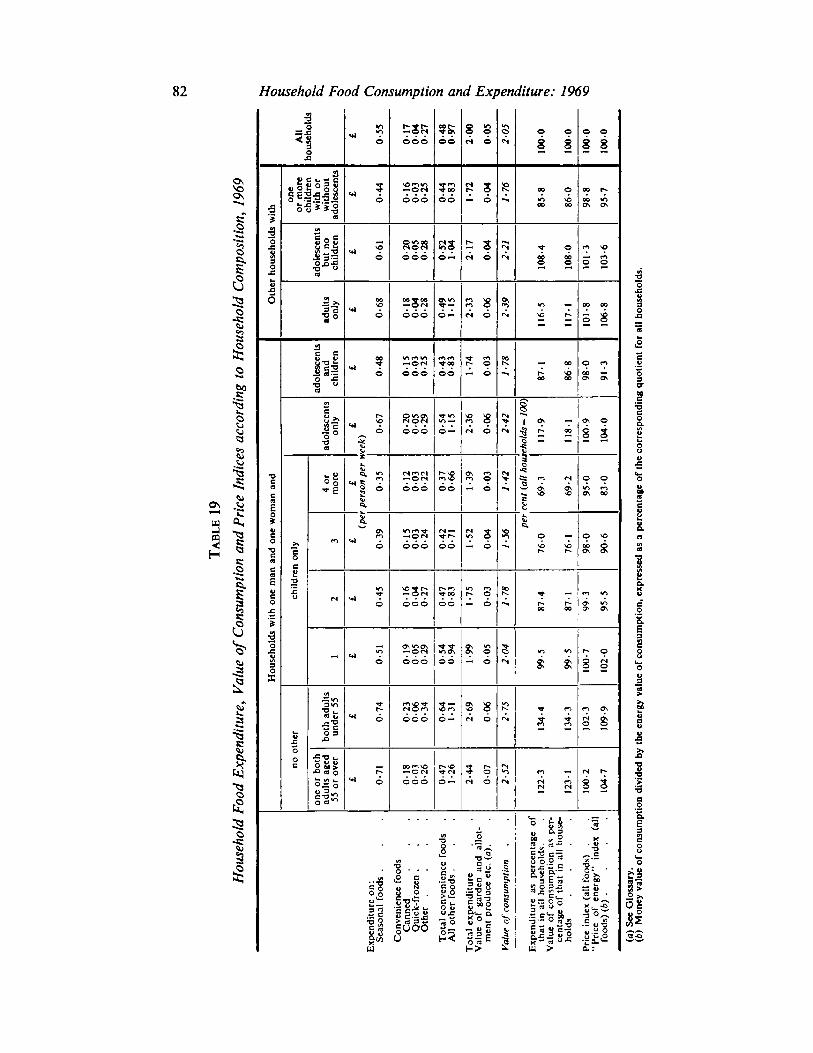
82 Household Food Consumption and Expenditure: 1969
OS
UJ
I
3H
ess;§11
I5*1
a >,
m
■*a
2
£8!
lis
ooo
ass
WONboo
00<£0Q-OM66b
2SS
066
2SS666
-ON666
2S8666
mo-*
666
■*0O66
as6 —
66
6 —
mo66
66
6 —
-i 6
E S
r- o~ 6
— 6
S o
3 B
8 S3 ■2 •
6^S
8 .
Jfc oS o111S'o11
5 ill I
S S
II ON
$ t-
£ *™V3-s:
3m
s
§ 8
00 00
s §
S 3
© o•ft m
8 S
8 S
Pi? '■a
D c aJOJj::5t5 & £
•°SC ■ gg •
0.3-1 SJa .§?£u
I'
> S:
2o
o8,
9
I?
Is
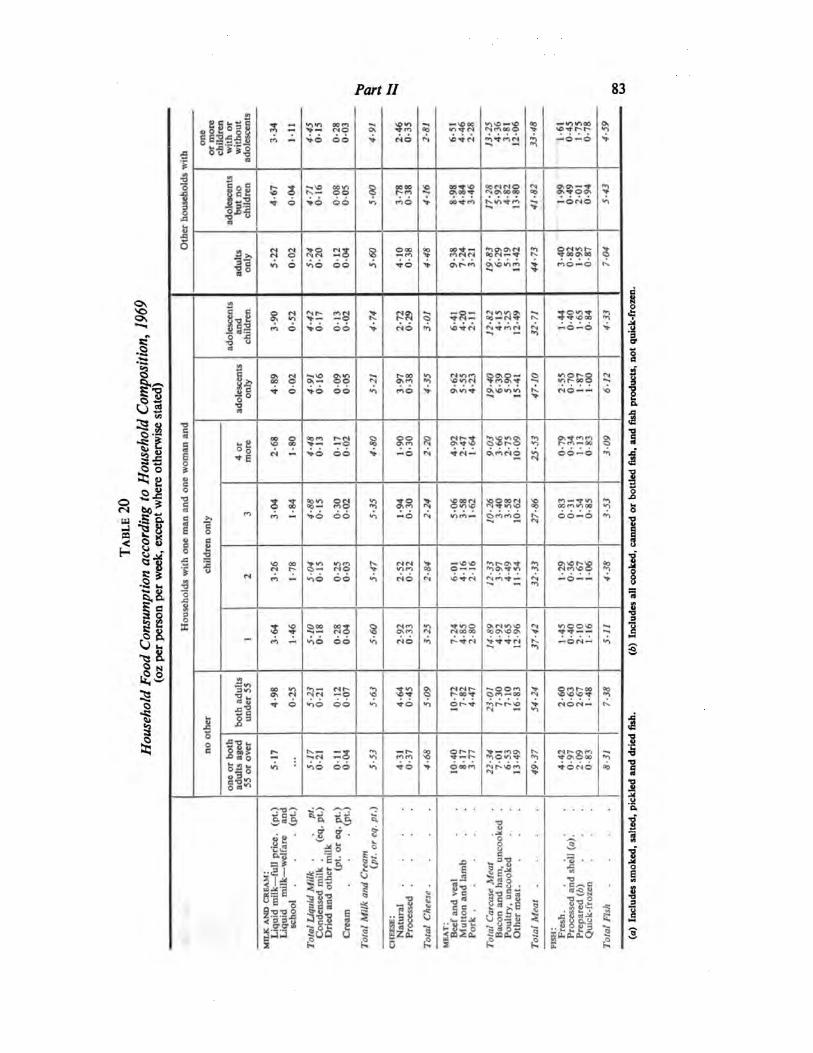
Part II 83
s
o06vo5§E2££8 NO
—\©0Ct/W(N fNWM ©
21dW©0\—on©
2* >0 N«±<nn —©"A6 66
^ OOCT\oo
«Nt- eies
<>— ©o>© 66
h e■*© oo "<ttN— o\m<s©
oo*n or*oo— WO>6 66 mo-
^©00 <N
66— c
5 to in(*i— NO•06 66
—v©v£>© ——
3 $ ^— NO^6 66
1
=5
I
3^; 33TO
lea
-^(N —©•06 66
Sr»r-?v600m 1
.- 9
111
HA
i5I
ill
lOOvD
*6n —
*-6n6
10.0
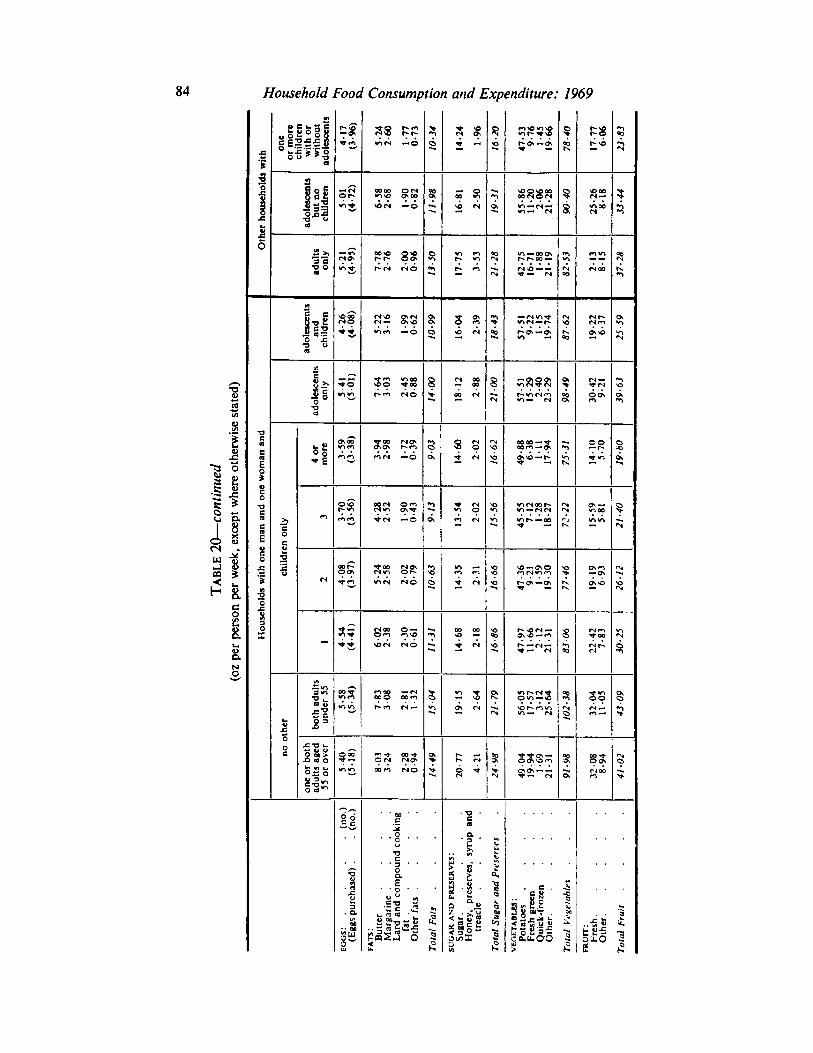
84 Household Food Consumption and Expenditure: 1969
"a o
3 aS" i>
j=
K sO —r
u.<J
1A(N--I 8CO i-
£
V C u t5 C„fc£°§S0 i-2 S 'So
o o * *-o
2 >.•3 c•n o
-> E
6£ o
o «">
££
355
II
8S
**© r*fn
p-r- oos
*-»«*>*-©
*-.*•* <so
fniN —O
«n ©r-"ON fSO
*OM NO
r*c» n«
L, a « ,
^s: ■£ --
3 2
•■o
;ssa
oom-o\vO-
«nr*^-oo
sss
2jc.il u
0\m
ocoX 5u-0 23
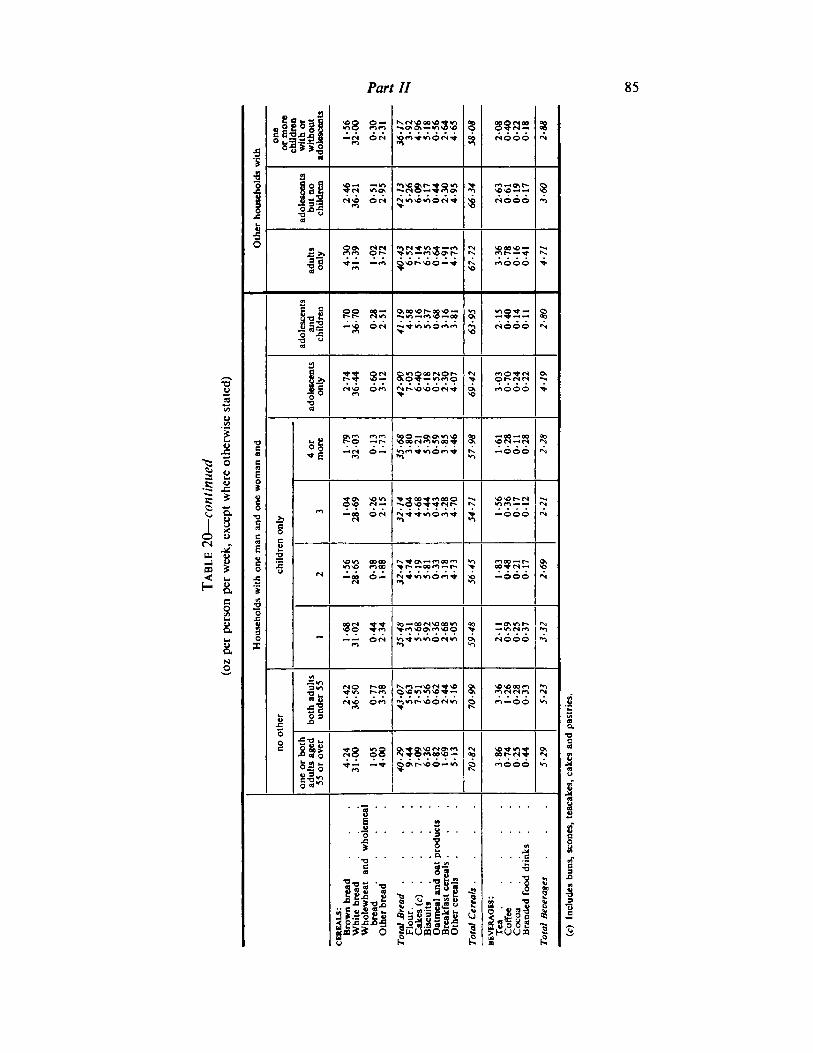
Part II 85
"S °
s: *o ■?;
1 1O o
J*
IEU-1CO<
co
K
■os
*8o
£*
is
°o
£•0 v.
<SO OtN
-*— «**>
-s
S3 3£
4-r -^4
■•tirtwortn
SS52KSS
XioOfNCuneO'«*1f*> t/10 «*»**
5SS55SS
f^tmnon*
»o■*v>«no <N*n
K.»o-*v©c*f©
BJllll «
buOnOnO s
<s©o©
rNO©6
or-Nwr.OOO
n-06
<nooo

86 Household Food Consumption and Expenditure: 1969
1
1I
I?— ^ S
4O
<N-»—
beU K-J •w
3 Ik
Ha
s
I
iIS
■3
I
• EI.-E»oS°§S
S—2
Iff 8
g g
11]■§ -s
♦ fi
siO 3
■57 v-IIIlis
CO*
—o
??nn
as
SI
38§
.3. .*
ill
a^rt ■•§ ■ -
E
il
l's
u
oil 1
S-o-o<'5'5
51
5-3 c 9 2
3 6 = E
OQO
s (2
8V*■4-6
«T\fN
46
46
NO
no
^6
■no
aor-*n
<jv— ^
assworn
mm©
ssssssOWO
sr-s
illA O
IB!
5ls£|S£o |
veinooso
cs64 —
won*r-wiaoM
©6 ——
-On-
c*oorunnonM
«aomtn—«Nmto— 4 —
5£££a |
I8-
«0 "
11
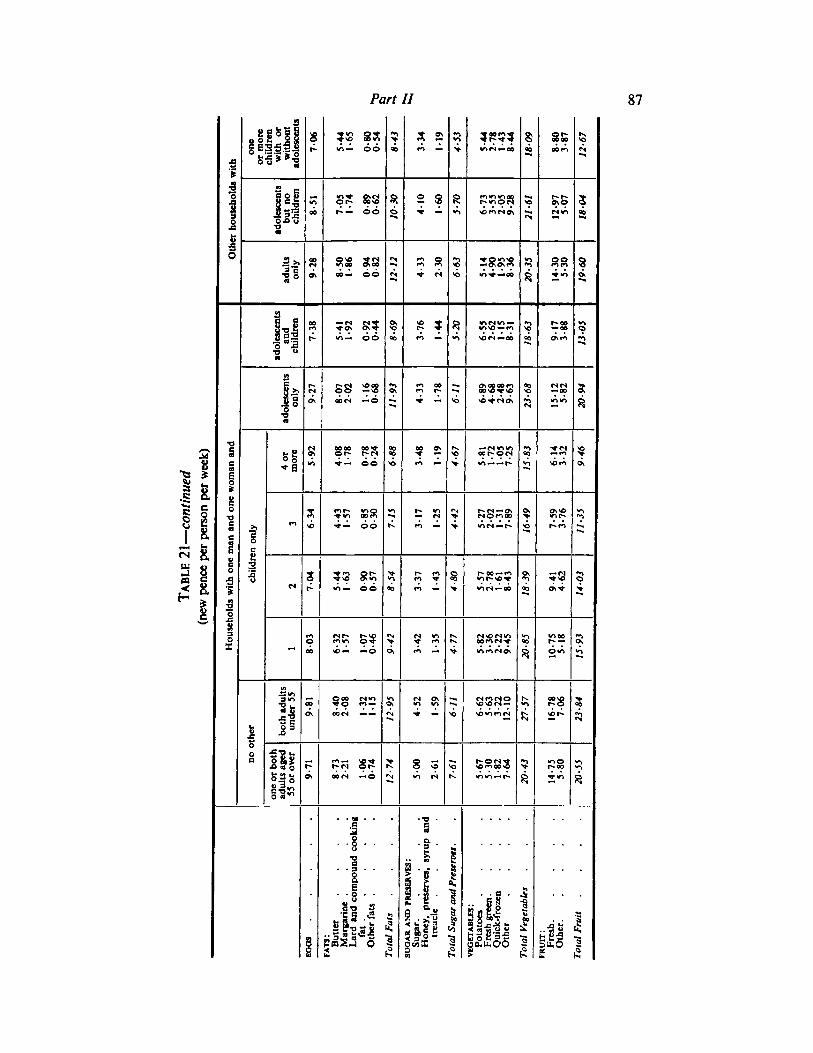
Part II 87
*1IsIIpa<
e3
I 5vS 8* > ?*
? ???* 8 SS ixV O
2338Mmit-> *n~ OO 00 m •- > «nM«ob oo 00fn <N
3 5*~i
&
| S«91 Mi »n ?? w ? 2 8 B fi in mooh«ON SO OsO 3S 00 ^.J. 6© C> 4 ii «n soi*»no\ ■h Min 001
1
^ <N ■*>»
y
131 ? moo Osoo
'••4 «n © so■*©«nso
S! as s
0)
o\ 00~ OO 4 M *o in^JigoR J in
Hs s 00
^■o\ o\<+OS
? * ?inwn** «-. r*oo •oro *o mso-^m T <- <s
1y
|N m — 66 00 •*> — «n soriMoo 00 o\«n a
ac8 &
r- SS 2S ?m oo r: OS000Or*1
8 3
11 MM —6OO^^-SD
iq
—op
(8
os *1* •* *o soi-Na inm R
131
CM0000 00*fr
?00 OS
SO—csininoor»©<H ? 2p» *
e1
<A ■*— ©6 *o m p* > <n----t^ —i son o\
§§Vao s **ir» m© »<-l r- in *N r^c?—os Os OSso •nT3
4— ©6—« — <s > fN©<*i0O > mr- V
5 >t n so rC r» *-i > WM-^N so r»m ■^c ■a
•■"i *^
I 0
gc0
1 s *m ©r-^■so *m 3 8 r-oo*-w
v>r*se^ ? ?? ?3 c* >A— ©6 ints^-oo o\4 'i'5 n- 00 **» — •<)■ 00M
-^
■oo
10 m Nh r»sorun ©v <N cs <n rx r^sorsm *o moo »nX
© > * «n t^ 00 r* — o.
H
00 \o— —© o\ e*i — > innNft R 6in «n
— «nam"2 * SS 82 s n as
m mdr*<s© tx P8 3
Hoo
4 •-•sosoH--.
6s oorj »-•- <s *o sommri rC »t^ B
V Is—* « <N <N
3oo lisc «, >h 3 3 -" <*i ■no *0■ca a r^ i^-n or. rx *o SOM00SO > r^oo •^
3 ° o\ oocs -*o in « N. inin»-t^ R ■*>n Rslsj
9 1
.. 1 1. .1 . . .
"S It IIt ia
15 a »
E
ml gjSJ 1
eMri 1 Ml ?•a b 15. S£u,oo 1
efc2 £ e 8 s 5 (5 (5

88 Expenditure: 1969Household Food Consumption and
VJ=o
in
If
•O "
a
3
8
4S
1-3
° o
3.n3 SO
1
lislis
AO OO
6oV 6—
SJol —Os
Os mm—6 6«N
OxOtoo ovo
82 ass— — ON
WW ©—6o\ 6—
os<n os^m\o om6co 6 —
6 CO 6 —
«r»o sc*so**> —wS09\ 6 —
O— ©IN
ooinv-i—->tsoQO00o <oINis r-
*->©—©—soooOs—v>oinos©
OsCOV"tS©f- 00
> —hWO-N
"i os5sr- msoin
SO S SO<NOS3
> INv»\o oot- —>00vO00—sOr-
<0VO"* OSOscoooosvi i—<sr*i
O oo-NSOOQOINt«*—00S>lN—f*>■s>«^<r~-soorsoo
<NSCOv*ov-,»or~OnOs m ^ 00
> — sotrto — CH
1Eu
1
C
1 Ji 8
o C u
£ O
1
2u,UfflOfflO
Sepoeo00<Nf*l
oo—csmv-itt cursor**©©
oc-«tOsoOOs —IN■*—66
Os**WHOOf*i —mm— 66
«fl<NOs00IN(Ncn—66
00O00<N
voOs5soso*o6
5J8RS
ooso—6
Os
3
3
"5 . ,
ilia=
311
II o
1
3B
I "°
1
Tables relating to Differences in Average Consumption
and Expenditure in Certain Household CompositionGroups within Income Groups, 1969
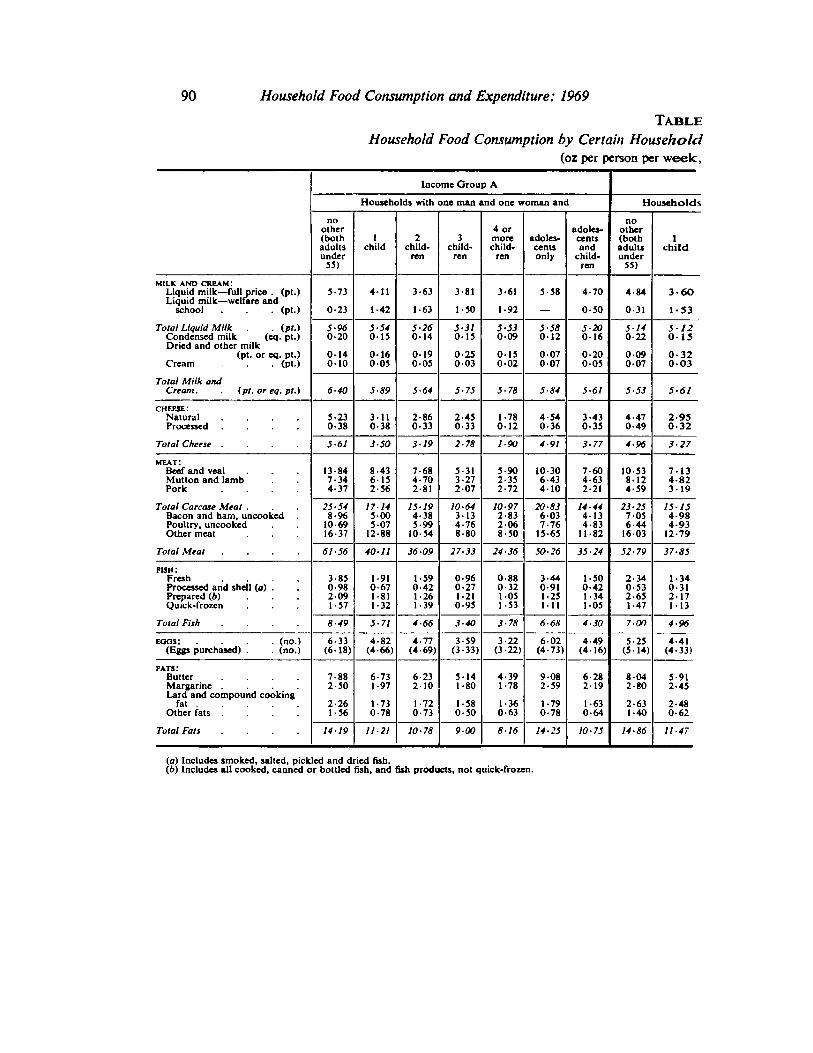
90 Household Food Consumption and Expenditure: 1969
TableHousehold Food Consumption by Certain Household
(oz per person per week,
Income Croup A
Households with one man and one woman and Households
no noother(bothadultsunder
other(bothadultsunder
55)
1child
2child
ren
3child
ren
4 ormorechild
ren
adolescentsonly
adolescentsand
children 55)
child
MILK AND CREAM:Liquid milk —full price . (pt.)Liquid milk — welfare and
school . . (pt.)
5-73
0-23
4-11
1-42
3-63
1-63
3-81
150
3-61
1-92
5-58 4-70
0-50
4-84
0-31
3-60
1-53
Total Liquid Milk . . (pt.)Condensed milk (eq. pt.)Dried and other milk
5-960-20
5-54015
5-26014
5-310-15
5-53009
5-580-12
5-200-16
5140-22
5-120-15
Total Milk andCream. (pt. or eq. pt.)
(pt. or eq. pt.)Cream . (pt.)
014010
0-16005
019005
0-25003
0150-02
007007
0-20005
009007
0-320O3
cheese:Natural ....Processed ....
6-40 5-89 5-64 5-75 5-78 5-84 561 5-53 5-61
5-230-38
3-110-38
2-860-33
2-450-33
1-780-12
4-540-36
3-430-35
4-470-49
2-950-32
Total Cheese .... 5-61 3-50 319 2-78 1-90 4-91 3-77 4-96 3-27
meat:Beef and vealMutton and lambPork .... 13-84 8-43
6-157-684-702-81
5-31 5-902-352-72
10-306- 434-10
7-604-63
10-538-124-59
7-137-344-37 2-56
3-272-07 2-21
4-823-19
Total Carcase Meat .Bacon and bam, uncookedPoultry, uncookedOther meat
25-548-96
10-6916-37
17-145-005-07
15-194-385-99
10-643134-768-80
10-972-832-068-50
20-836-037-76
14-444134-83
23-257-056-44
15 154-984-93
12-88 10-54 15-65 11-82 1603 12-79
Total Meat .... 61-56 4011 36-09 27-33 24-36 50-26 35-24 52-79 37-85
fish:Fresh ....Processed and shell (a) .Prepared (b) ...Quick-frozen
3-850-982-091-57
1-910-671-811-32
1-590421-261-39
0-960-271-210-95
0-880-321-051-53
3-440-911-251-11
1-500-421-34105
2-340-532-651-47
1-340-312- 17113
Total Fish .... 8-49 5-71 4-66 3-40 3-78 6-68 4-30 7-00 496
EOOS: .... (no.)(Eggs purchased) . . (no.)
6-33(6-18)
4-82(4-66)
4-77(4-69)
3-59(3-33)
3-22(3-22)
602(4-73)
4-49(4- 16)
5-25(5-14)
4-41
fats:Butter ....Margarine ....Lard and compound cooking
(4-33)
7-882-50
6-731-97
6-232-10
5141-80
4-391-78
9082-59
6-282- 19
8-042-80
5-912-45
fat 2-261-56
1-730-78
1-720-73
1-580-50
1-360-63
1-790-78
1-630-64
2-631-40
2-480-62
Total Fats ....Other fats ....14 19 11-21 10-78 900 816 14-25 10-75 14-86 11-47
(a) Includes smoked, salted, pickled and dried fish.(b) Includes all cooked, canned or bottled fish, and fish products, not quick-frozen.
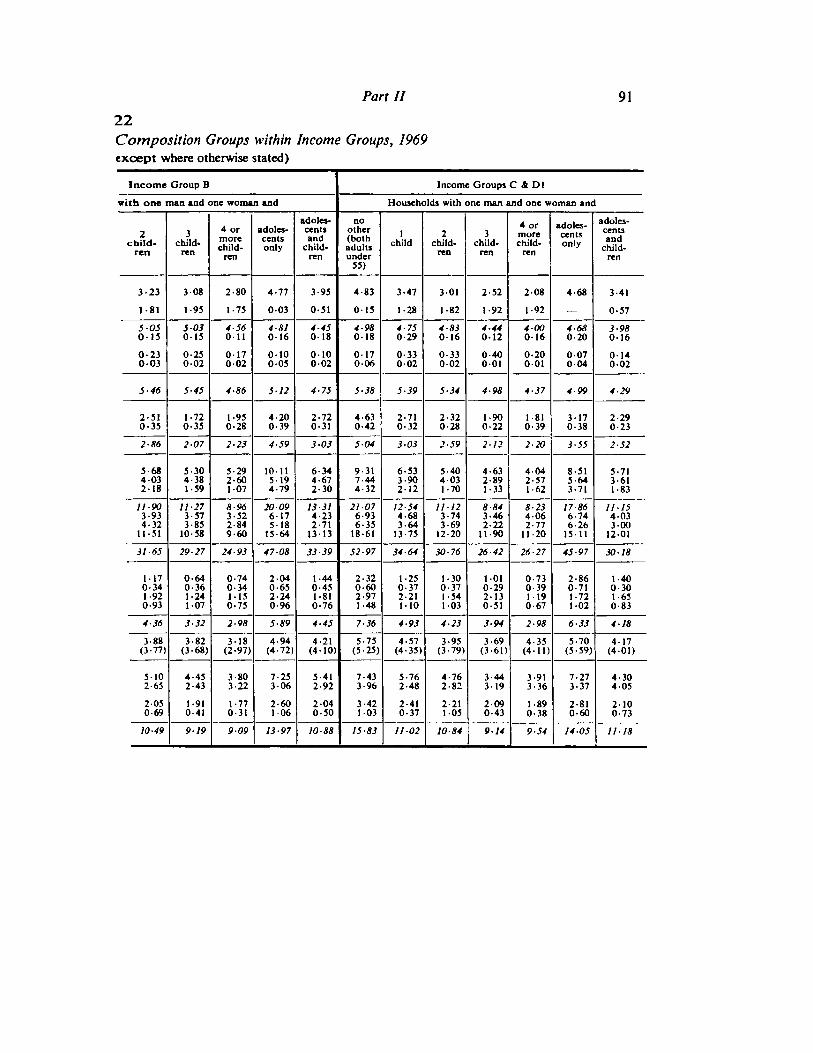
Part II 91
22Composition Groups within Income Groups, 1969
except where otherwise stated)
Income Group B Income Groups C & Dl
with one man and one woman and Households with one man and one woman and
2child
ren
34 ormorechild
ren
adolescentsonly
adolescentsand
children
noother(bothadultsunder
1child
2 34 ormorechild
ren
adolescentsonly
adolescentsand
children
children
55)
child-ren
children
3-23
1-81
3-08
1-95
2-80
1-75
4-77
003
3-95
0-51
483
015
3-47
1-28
301
1-82
2-52
1-92
2-08
1-92
4-68 3-41
0-57
SOS015
S-03015
4-56Oil
4-810-16
4-450-18
4-980-18
4-750-29
4-83016
4-44012
4-000-16
4-680-20
3-98016
0-23003
0-25002
0170-02
010 0-10002
017 0-33002
0-330-02
0-40001
0-200-01
0-070-04
0-14005 006 002
5-46 5-45 4-86 512 4-75 5-38 5-39 5-34 4-98 4-37 4-99 4-29
2-510-35
1-720-35
1-95 4-200-39
2-720-31
4630-42
2-710-32
2-320-28
1-900-22
1-81 3170-38
2-290230-28 0-39
2-86 207 2-23 4-59 3-03 5-04 3-03 2-59 212 2-20 3-55 2-52
5 684-03218
5-304-381-59
5-292-60107
10-11519
6-34 9-31 6-533-902-12
5-404031-70
4-632-891-33
4-042-57162
8-515-643-71
5-71
4-794-672-30
7-444-32
3-611-83
11-903-934<32
11-273-573-85
8-963-522-849-60
20-09617518
13-314-232-71
21-076-936-35
12-544-683-64
11123-743-69
8-843-462-22
11-90
8-234062-77
1120
17-866-746-26
11 154-03300
11-51 10-58 15-64 1313 18-61 13-75 1220 1511 1201
31- 6S 29-27 24-93 47-08 33-39 52-97 34-64 30-76 26-42 26-27 45-97 30-18
1170-341920-93
0-640-361-24107
0-740-341150-75
2-040-652-240-96
1-440-451-81
2-320-602-971-48
1-250-372-211-10
1-300-371-54103
1-010-292130-51
0-730-391190-67
2-860-711-721-02
1-400-301-650-830-76
4-36 332 2-98 5-89 4-4S 7-36 4-93 4-23 394 2-98 6-33 4-18
3-88(3-77)
3-82(3-68)
3-18 4-94(4-72)
4-21(4- 10)
5-75(5-25)
4-57(4-35)
3-93 3-69(3-61)
4-35(4-11)
5-70(5-59)
4-17(401)(2-97) (3-79)
5-10 4-452-43
3-803-22
7-25306
5-412-92
7-433-96
5-76248
4-76282
3-44319
3-913-36
7-273-37
4-304052-65
2050-69
1-91 1-770-31
2-60106
2-040-50
3-42103
2-410-37
2-21105
2-090-43
1890-38
2-810-60
2-100-730-41
10-49 9- 19 909 13-97 10-88 15-83 1102 10-84 9- 14 9-54 14 05 11 18

92 Household Food Consumption and Expenditure: 1969
Table 22—
(oz per person per week.
Households with one man and one woman and
Income Group A
Households
no noother(bothadultsunder
2child
ren
3child
ren
4 ormorechild
ren
adolescentsonly
adolescentsand
children
other(bothadultsunder
1
55)
child
55)
child
SUGAR AND PRESERVES:16-71
2-44
12-50
2-78
13-10
2-46
11-89
2-59
12-44
1-33
17-07
3-52
14-27
2-44
18-23 14-52
1-97Honey, preserves, syrup and
treacle .... 2-55
Total Sugar and Preserves 1915 15-28 15-56 14-48 13-77 20-60 16-71 20-78 16-49
VEGETABLES:49-78 43 09
1203303
19-94
36-4710-142-18
17-83
31-597-472-01
32- 105-773-08
48-88 42-47 53-29 49-28Potatoes ....Fresh green....Quick-frozen
21-32 15-36 10-22 1804 12-064-60 3-71 1-93 2-86 2-22
24-35 15-83 12-96 21-07 16-81 26-35 20-92
Total Vegetables 100-05 7809 66-60 56-91 53-93 89-02 71-41 100-53 84-47
fruit:Fresh ....Other
42-5912-47
30-389-03
25-62 20-606-78
24-745-36
40-2412-14
27-068-33
32-9211 05
22-027-798-85
Total Fruit .... 55-06 39-41 34-47 27-38 30-10 52-38 35-39 43-97 29-81
cereals:Brown breadWhite breadWholewheat and wholemeal
1-9526-55
2-11 1-97 1-5621-82
1-32 2-9927-24
20028-93
2-5534-53
1-5131-8824-08 23-25 20-31
bread ....Other bread
2013-20
0-782-91
0-731-51
0-732-61
0-27203
1-104-37
0-582-27
0-693-85
0-432-26
Total Bread .... 33-705-706-985-960-542-454-22
29-894-325-966-120-522-586-72
27-474-904-536-200-413-224-75
26-705-103-794-510-533-313-32
23-943-244-655-390-715004-18
35-706-676-266-960-822-564-19
33-794-064-685-510-813-533-76
41-635058-126-760-522-445- 16
36-074-325-785-910-342-754-83
Cakes (c) ....Biscuits ....Oatmeal and oat productsBreakfast cereals .Other cereals
Total Cereals .... 59-56 56-12 51-49 47-27 47-09 63-17 56 13 69-66 6001
BEVERAGES:1690-680-240-22
2-180-600-250-37
Tea 2-813-560-500-22
1-650-760-39
1-250-500-18015
1-280-270-100-89
2-660-720-170-37
1810-700-12013
3-320-840-210-32
Coffee ....Cocoa ....Branded food drinks 0-74
Total Beverages 708 3-54 2-83 2-08 2-55 3-93 2-77 4-69 3-40
EXPENDITURE—ALL FOODS £309 £2-24 £1-94 £1-61 £1-46 £2-57 £1-93 £2-64 £1-98
(c) Includes buns, scones, teacakes, cakes and pastries

Part II 93
continuedexcept where otherwise stated)
Income Group B Income Groups C & Dl
with one man and one woman and
adolescentsand
no
Households with one man and one woman and
2child
ren
3child
ren
adolescentsand
children
2child
ren
3child
ren
4 ormorechild
ren
adolescentsonly
other(bothadultsunder
55)
14 ormorechild
ren
adolescentsonlychild
renchild-
14-95
2-37
1416
1-90
13-59
2- 18
1705
2-42
1609
2-61
22-23
2-91
16-81
209
14-28
211
13-81
1-82
17-20
1-99
20-69
3-16
17-07
204
17-32 16-06 15-77 19-47 18-70 25 14 18-90 16-40 15-63 1919 23-85 19- 11
49-169-111-56
47097-651-35
49-886-960-94
5815 60-24 6409 49-979-311-19
53-598-321-21
53-18 62-955-370-32
65-14 61-877-250-74
15-73 1007 14-83 5-88 13-852-25 1-12 2-78 0-70 1-88
19-44 17-88 17-33 23-77 20-39 24-84 23-72 20-28 20-28 2201 24-14 20-40
79-27 73-98 75-12 99-91 91-82 106-54 84-18 83-40 80 05 90-64 105 00 90-27
18-856-65
15-92602
12-785-61
30-578-39
19-476-31
24-7810-42
15-637-04
14-42600
11-354-78
9865-84
22-778-41
14195-26
25-50 21-94 18-39 38-96 25-78 35-20 22-67 20-42 16 13 15-70 31 18 19-45
1-4629-49
I - 18 1-95 2-5839-22
1-85 2-34 1-7835 13
1-4231-21
0-51 1-5637-69
2-8338-78
1-3441-0127-93 31-77 36-89 46-02 34-36
0-292-03
017206
0-111-63
0-50300
0-292-45
0-262-65
0-06201
0-241-87
0-051-99
0081-69
0-342-55
0-092-67
33-283-975-515-820-293-354-74
31-343-904-905-850-283-485-59
35-454093-805- 100-743-574-23
45-317096-325-940-302153-94
41-474-935-625-660-602-803-83
51-266-406-786-540-852-445-26
38-974125-225-720-352-474-30
34-736-145-105-490-392-834-76
36-913-595-075-500-552-95416
41-023-344-415-560-403-494-92
44-497-856-836170-702-414-19
45-104-454-894-950-643-443-84
56-96 55-34 5700 71 03 64-92 79-51 61-17 59-43 J«-7i 63 15 72-65 67-31
1-810-42017015
1-620-350-26007
1-570-310-10012
3-010-730-23019
2-320-360-150-12
3-700-770-280-42
2-360-43012015
1-980-420-26019
1-670-31005015
1-820-250100-20
3-340-620-230-21
2-140-28015009
2-56 2-28 2-09 417 2-95 5-16 3-05 2-85 2- 18 2-37 4-39 2-67
11-73 11-54 11-35 12-35 tl-77 12-56 11-80 tl-63 11-43 £1-38 12-26 11-58

94 Household Food Consumption and Expenditure: 1969
Table 23
A. Household Food Expenditure by Certain Household CompositionGroups within Income Groups, 1969
(per week)
Income Group All Income Group All
A B C&D1households
(a)A B C&D1
households(a)
Per Per Per Per Per Per Per Perhead head head head house-
holdhousehold
household
household
Households with one man and£ £ £ £ £ £ £ £
one woman and:no other (both adults under 55) 309 2-64 2-56 2-69 617 5-28 512 5-381 child 2-24 1-98 1-80 1-99 6-71 5-95 5-41 5-972 children .... 1-94 1-73 1-63 1-75 7-77 6-93 6-52 6-993 children .... 1-61 1-54 1-43 1-52 807 7-70 7-14 7-604 or more children . (1-46) 1-35 1-38 1-39 (9-30) 8-88 8-99 904adolescents only 2-57 2-35 2-26 2-36 8-23 7-72 7-32 7-66adolescents and children . 1-93 1-77 1-58 1-74 9-66 9-20 8-68 914
All households (a) 216 1-98 1-90 200 7-56 6-78 604 6- 10
B. Average Declared™ Net Family Income in Certain HouseholdComposition Groups within Income Groups, 1969
(per week)
Income Group All Income Group Allhouse house
A B C&D1 holds(a)
A B CiDl holds(a)
Per Per Per Per Per Per Per Perhead head head head house
holdhousehold
household
household
Households with one man and£ £ £ £ £ £ £ £
one women and:no other (both adults under 55) 20-60 14-15 9-72 13-55 41-20 28-31 19-45 27- 101 child 12-11 7-87 5-43 7-98 36-33 23-62 16-30 23-932 children .... 9-67 6-22 4-55 6-36 38-68 24-87 18-19 25-453 children .... 8 05 5-15 3-82 5-25 40-25 25-75 19-08 26-264 or more children . (6-77) 4-30 301 4-16 (43-81) 28-33 19-57 27-22adolescents only 15-05 10-07 7-31 9-96 48-23 3340 24-29 32-50adolescents and children . 9-32 6-42 4-83 6-32 45-22 33-28 26-70 33-13
All households (a) 11-76 8-01 6-14 7-64 41-56 27-71 19-60 2304
(a) including household types not shown elsewhere in this table.See paragraph 66.
Figures in brackets are averages based on a sample of only 24 households; details of the number of households in each sub-group are shown in Table 7 of Appendix A.
Tables relating to Differences in Average Consumption
and Expenditure in Households Classified according to
Age of Housewife and Broad Socio-economic Grouping
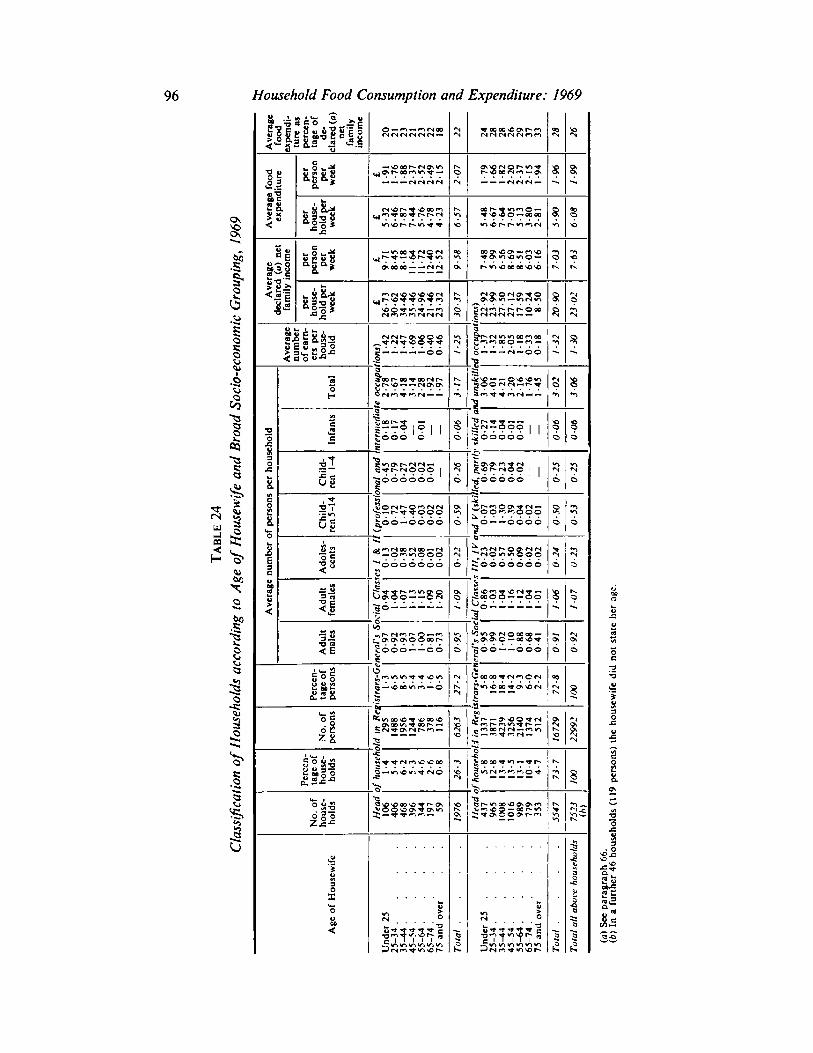
Household Food Consumption and Expenditure: 1969
Avera
ge
exp
end
itu
reas
perc
en
tag
eof
de
clare
d(a
)net
fam
ilyin
com
e
Si
per
pers
on
per
week —*eoor-r»o\«o
1-
79
1 -66
1
-82
2-2
02
-37
2-1
5
1 -94
1-9
6
1-9
9
exp
end
iture ^ ©\ oom»n*t —
\£
1
per
house
hold
per
weeki
!?«s?sss:?ss
5-9
0
6-0
8
<
per
|■
i
inco
me
week
£
9-7
18
-43
81
8
11
'64
12
-40
12
-32
9S
8 ?
*n•o
z r-<n*
jd
ecl
are
cfa
mily
per
1
hold
per
week
26
-73
30
-62
34
-46
35
-46
24
-96
21
-46
23
-32
30
-37 assess
20
-90 *N
O
«N
Avera
ge
num
ber
of
earn
ers
per
house
hold
ions) 1-4
21
-22
1-4
7
1 -69
1-0
60
-40
0-4
6
"»*
It- «sinifj oomoo*mmoo©— m —
13
0
teocc
upa,
Tota
l
2-7
83
- 67
41
83
-1
42
-28
1-9
21
-97 2* ——©*cow-i
1 ©o r* is —• S<
1
Avera
ge
num
ber
of
pers
ons
per
house
hold
Infa
nts
nte
rmedia
01
80
17
0-0
4
0-0
1 86
' skill
ed
ai
0-2
70
-14
0-0
40
-01
0-0
1 s
r
onal
and
i
0-4
50
-79
0-2
70
02
0-0
20
-01 I?*5??? 1 1
6
Child
-
0-2
6
0-2
5
0-2
J
i .^-6©o ©©J;
Child
ren
5-1
4
0-5
9
nd
V
(ski
00
71
03
1-3
00
-39
00
40
02
0-0
1
0-5
0 ?
^66—6666 6
Adole
sce
nts
5!
«6
u
0-2
3""6666066
S
gooooooo
I cial
Cla
si
Adult
0-9
4
1-
04
10
7
1•
13
11
51
09
1-2
0
60
1
^— — O
Adult
male
s
nera
Vs
Sc
0-9
70
-92
0-9
3
1 -07
1-0
00
-81
0-7
3
0-9
5
era
l'sSoc
0-9
50
-99
10
2 I•10
0-8
80
-68
0-4
1 *•«CA
0-$
>2
|
5
O
tage
of
«NIs.*»• 2
«
8
No.
of
pers
ons
>Id
inR
ei
29
51
48
81
95
61
24
47
86
37
81
16
62
63
Idin
Regi
13
37
38
71
42
39
32
56
21
40
13
74
51
2
O |
Perc
en
tag
eof
house
- * o
i
2j
^ (Nm»©« 00
R 8
No.
of
house
hold
s
19
76
Head
i
96
51
00
81
01
69
89
77
9
5S
47
3; —^ mm — 43
7
35
3
Ag
eof
House
wife
Und
er
23
23
-34
.3
5-4
4.
45
-54
....
55
-64
....
65
-74
....
75
and
over
Tota
l..
..
Und
er
25
.
25
-34
....
35
-44
....
45
-54
....
35
-64
....
65
-74
....
75
and
over
Tota
l..
..
Tota
lall
ab
ove
house
hold
s
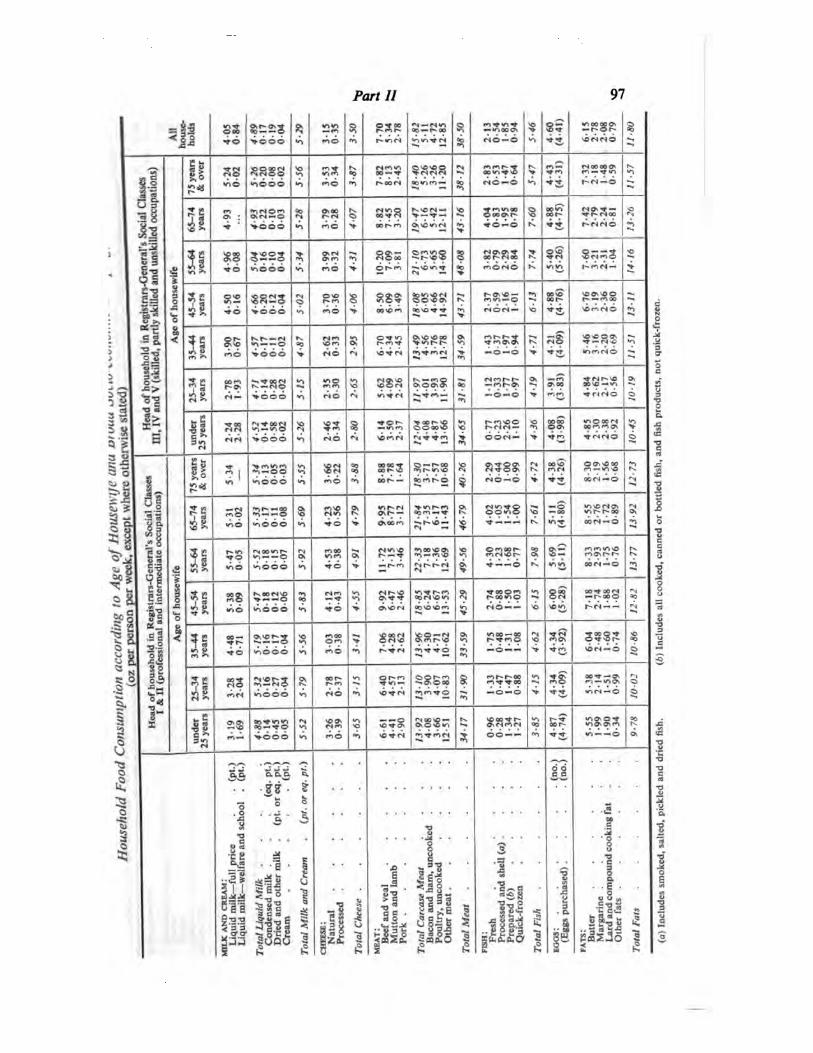
Part II 97
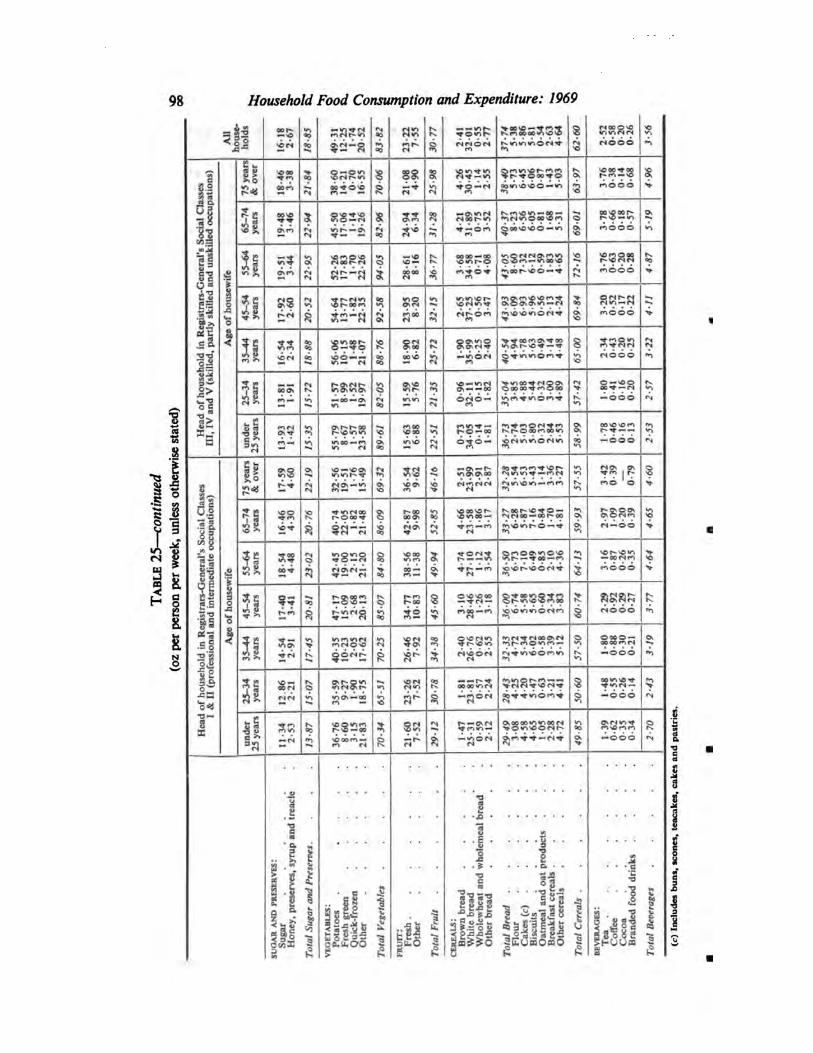
98 Household Food Consumption and Expenditure: 1969
3 i omc*r- >n
ia-a>»■oo\0 —• rt nr->r->aooo sov£> «TiVI (NfN
nooo
SO00 ©—0«n ooo> r- -«ro oo -o
■5
03vi'§■8CAS
11s =CO« n
11
.11
•g-o"
Bt>r>
O r*i•*■—O
<n*o«n—oo—
<nOO©
£3O f*%
- i r' —V ;T.-ZnOOO
NOnor- oo \ots *w
noOO
in f 0*00 jtmmOnt
33 isr-ooonootn>o<sv>«no <s»n
OO^NOm—ooo
ONO
*0ViONOOO<S »
A
<N<N
(NO
T .mo
U.9
OS'S.fiS
if.3 —
■a—
s
•»tm Soo^Or-
in oo—
S3-?
Koor-'O'to-<Ncsoo—oor- oo
no*nr- O —•
r- c>—o~0\ONnN —66
si■too
ootTfO-N
>©sor- noO <nif
Xj -o S —
S2
O sC00— CN— Sir oow>r- w-)o «or->oo
nooo
iS
CjocNr-
CT\~ 0O
»no r- m ——>(S <N -£!fS
3*'
oo^sottT v. r I —
—666
•a «*0O"inr-so —oosooom—'
o, oooo «noo<n or*mvO f>—666
I3 011 2 I! 5

Part II 99
*1r«iO soH500 -00
-•CiOpOv
I!IK*
ir-my as
*n66©
r^moo
TV0600OO
wot qo
O06668?mo
004 0000
fi 00
—QO
\06~6<noorNco00—0*
S3 3 *ooov,riO
O O —
sOI
2'S3
>*©qop-
vC—mW)
55MO
» s:<6vo6
oocNS\r-
o\oo-0000 O00ON
3 ^—<N
no00*— M
00<nr- 00
Uso* ■«6<N
iiien
• -i
piIII-5"w
1
i s
— ,0 ,0
1§
O uE =<Ael
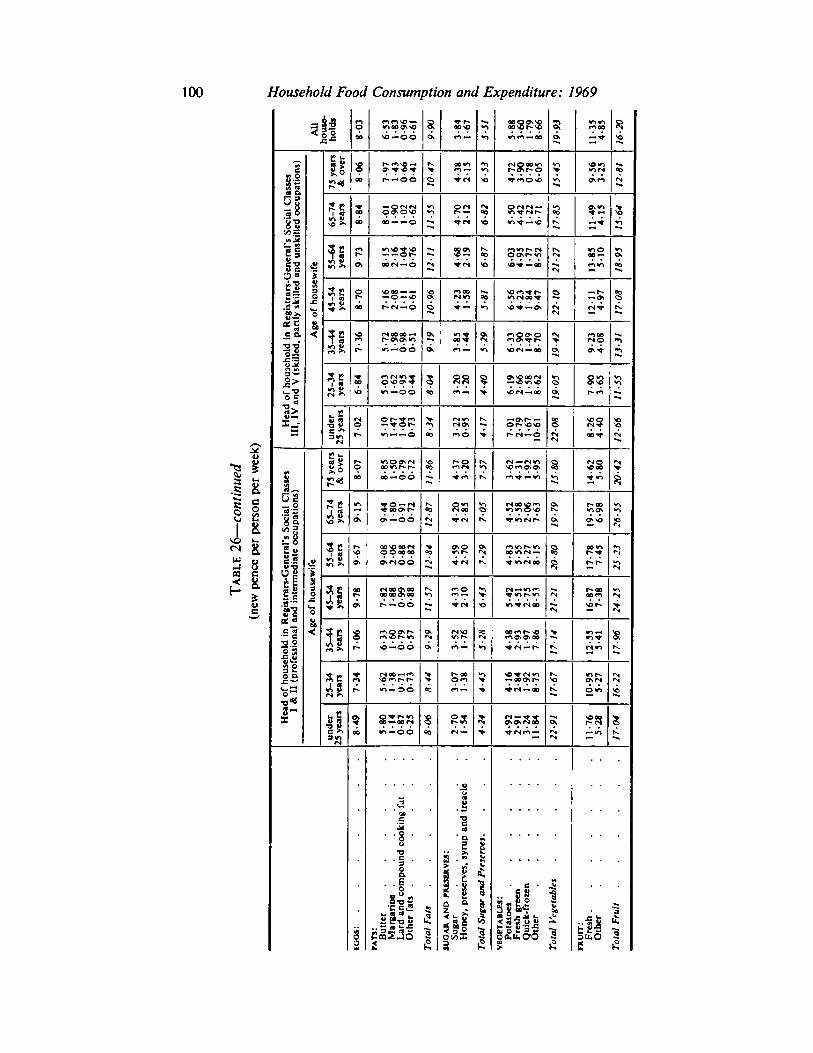
Household Food Consumption and Expenditure: 1969
All
house
hold
s
8-0
3
19
09
60
E8
1
9-9
0
3-8
41
-67
5?
5-8
83
-60
1-7
98
-66 a mm
moo
16
-20
ex —
Head
of
house
hold
inR
eg
istr
ars
-Genera
l'sS
oci
al
Cla
sses
III,
IVand
V
(ski
lled
,p
art
lysk
illed
and
unsk
illed
occ
up
ati
ons)
75
years
&
over
8-0
6
7-9
71
-43
0-6
60
-41
10
-47 ■cmr-i—■ ?
4-7
23
-90
0-7
86
-05
-A
*^
9-5
63
-25
12
-81
65
-74
years
8-8
4 —o rJ (Noaov
11
-55
4-7
02
12 3
5-5
04
-42
1-2
26
-7
1
17
-85
11
-49
41
5
QC—■ —O •A
55
-64
years
9-7
3
81
52
16
1-0
40
-76
4-6
82
19
K
op mv-ir~-<N
©Oit-m
21
-27
13
-85
5-1
0 3
Ag
eof
house
wife ■— « 6-i-«6
45
-54
years
8-7
0
71
62
-08
11
10
-61 S
moo<s*? vi cnoc<
vOTJ-— ^
22
-10
12
-11
4-9
7
17
-08
6—.
35
-44
years
7-3
6
61
-6\ ?? ft neftemcs^r- 38
13
-31
m —66 •n *or* —oc dt
25
-34
years s
50
31
-62
0-9
50
44
P0
S\ 3-2
01
-20
> 61
92
-66
1-5
88
-62 5
7-9
03
-65
•*-.
under
1
25
years
7-0
2
5-1
01
-47
10
40
-73 ?
oo 3-2
20
-95 IS,
70
12
-79
1-6
71
0-6
1
22
08
8-2
64
-40 s
>
Head
of
house
hold
inR
egis
trars
-Genera
l'sSoci
al
Cla
sses
I&11
(pro
fess
ional
and
inte
rmedia
teocc
upati
ons)
75
years
1
&
over
r—o
8-8
5IS
O0
-79
0-7
2
11
-86
14
-37
3-2
0IS.
8 (NOVOOO >
00 s> >n
65
-74
years V)
9-4
41
-80
0-9
10
-72
12
-87
4-2
02
-85 s <f)i^O^C
19
-79
19
-57
6-9
8 *^
eV Is
55
-64
years
9-6
7
90
82
-06
0-8
80
-82
12
-84
|
45
92
-70
7-2
9
|nwp. ir.oo«r>fN—
20
-80
17
-78
7-4
5
Age
of
house
wife
45
-54
years
9-7
8
7-8
21
-88
0-9
90
-88
11
-57
i
4-3
32
10
•«■«»->cnoo2
1-2
1
16
-87
7-3
8
a
years
|
9-2
9
j m^rcsoo j;
8
6-3
31
-60
0-7
90
-57
3-5
21
-76 oo*nr»« VI—
17
-96f*iC\©voo *??
years
| —r> rs. win
25
-34
7-3
4 fNCO—f-1 >
3
07
1-3
8
41
62
-84
19
28
*75
17
-67
10
-95
5-2
7
16
-22som r~r-
m—66<*
und
er
25
years
8-4
9
5-8
01
-14
0-8
7ft
.74
8-0
6
2-7
01
-54 5
11
-76
5-2
8
17
-04
fats
: Lard
and
com
pound
cooki
ng
fat
.
suoak
and
pri
soiv
b:
Hooey,
pre
serv
es,
syru
pand
treacl
e
Tota
lS
ug
ar
and
Pre
serv
es.
veg
eta
ble
s:
Oth
er
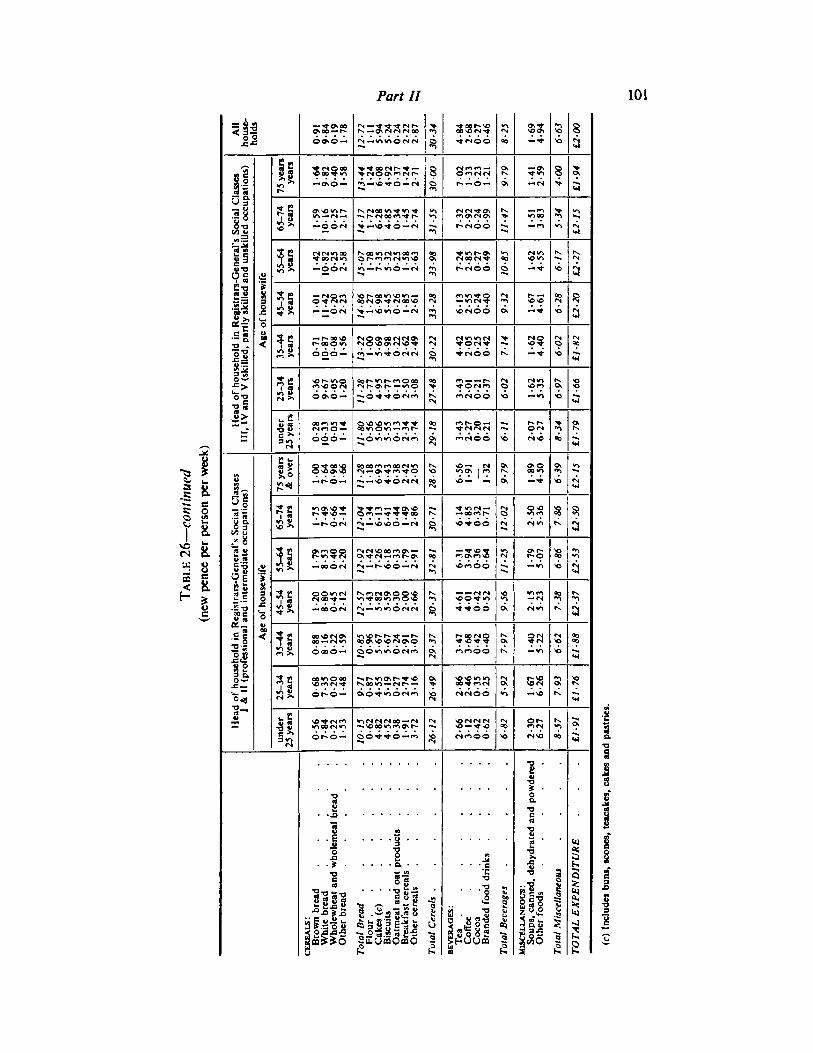
Part II 101
All
>ld
s
—3CN0O ts.—CTifS IS CS00 2**oT 00I-->>0oo 5rs -»t ?? ? s
SM 00\0 — <N—mm©eSfS 4 <s©6 •0 ~4 <e a
lass
es
rati
ons)
>» J*
m —<j\6 —^— "o-xro —<n
s O £ fNCSrC^.6 —
ft
Ot
8
>»
5
i Soci
al
C
lied
occ
ur
H
t*»<soom^ m^r>csooi*w r- CNCS^0> >
—r«imoo—
?
-Genera
l*!
and
unsl
ci
n
—66cs >— v©46 —fN
s
■A
ts.
<sin «
^oofsm Qr*-r*imcsm«<oJ«r *->©—rs
tsoots^r>cs©6 o — 4 <o
*sIS
-NOW *or- oomvom —ao<NCTv"<t<N 'O 2SSf 8
1
' house
hold
in
1
V
(ski
lled
,p
an
o —£«6cs CA — 4
C5
51
666— «->—«A-4-6<n???? > s§ s S
3
ao «nr*>f>©oo m —— 8 ^ ro S
■2
a
(S « oo* WNOO —*ri
*3
8>Is r-o — r>r- R
§1
rs rs cn OfN *nOOO — o •«mO fSCO fOfNO© fN« 00
Soci
al
Cla
sses
xupati
ons)
Ii gSSiif QO00f>r*i00rS"O rs. «0— <N fto\
CAO0O"ft —«
>o— — — 4
si
Ii K ^•inrs——'oomr. o « a
si
Regis
trars
-Genera
l'sand
inte
rmedia
teot
—r^-ors-*
«466 ts.
n
<N(SSO00r->O —OvTf(N—mr>o\ •0 ss »o
m—ooors - *N|
*>«OriOO
^< si
2 n (sop-* — •n^OOmroo-OK,*»
——rs<s mm—fS &
O—00©<N 4466 K si
ihold
in
B
ifess
ional
1 ooors<?soo—rsrn 00Onso\D<N<?»©
rs,???? Ot ?
11
©006 — ci6*i«ft6fN«*> —m «
OrntS^f*■«p-me\ i- ^ *orv.oo —<n •— >
so«o«n«ooo m<N S
— ^
?
0*1 fS >■ or-© —»^
NNOO v>
2"
a
I1
*N
S3 In.
£>644© —ro (S««n
«i
m
I ■
..1.
■a
■a a
■o
:::£:
B ■A
"8e
'
■o• ' i I-
J
HI*M
•■•I | ill1
1
| .Sa||
§ 5
8 • "SIt
1 l§1|ilJJll
3 03
"a
3 E h ■J
"a ShOUPQ
■
ss1 5 I


Tables relating to the Types of Shop used by
Housewives for Most of their Purchases

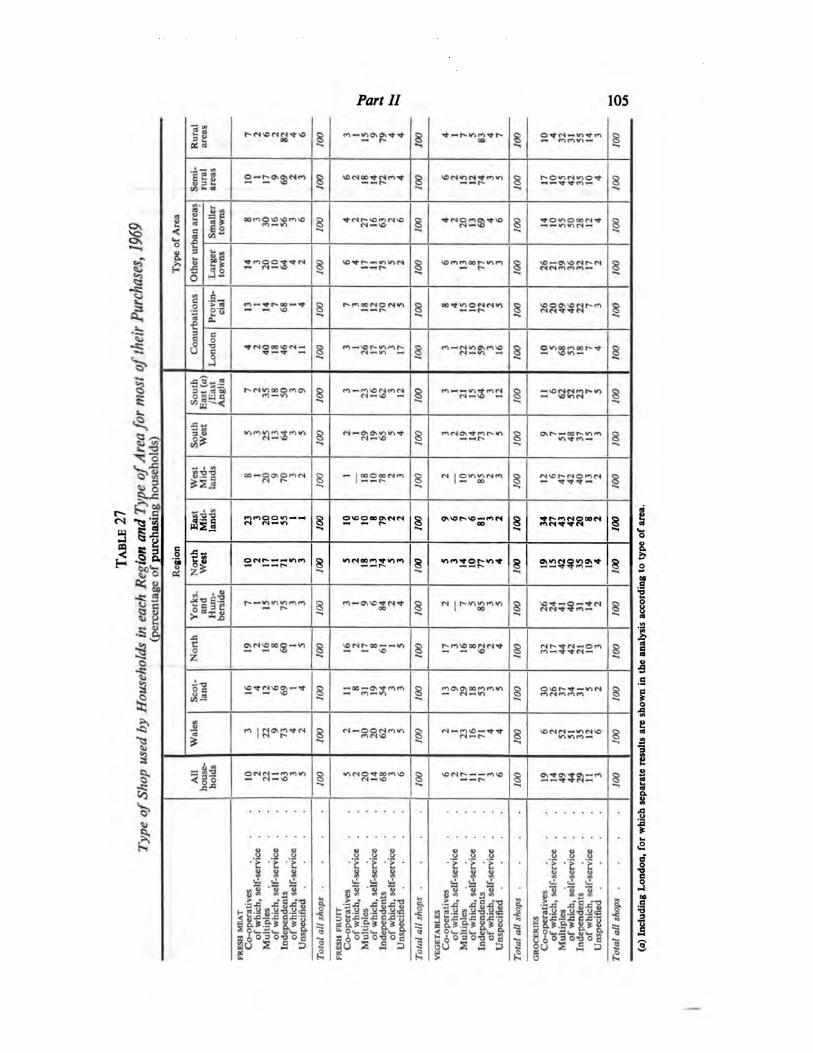
Part II 105
SO
2Js5
sa5^.
« , .
Si -3
- 3^>O6.
llH
(J g
ft
g
ij
h
Rura
lare
as
r- <N« (N(N SON 1
— £ OX C£ ■* 3 ^ mr- n n r-
00 § — m r«->«o— 8
Sem
i-
If 1 I 1 8
Typ
eof
Are
a
Oth
er
urb
an
are
as
Sm
alle
rto
wns
00mO « vO(*1so
1
<Nr-~SOc^lfSsofs|~ SO s 1 8
Larg
er
tow
ns
§
^ r- — jn in tN
1 8
Conurb
ati
ons
Pro
vin
cial rn— r- » —-<r s r»moor»io in »n—. —. r- § ~ ~ r» 8 1
Lond
on
""ejoojc."-. 1
«*»— jo r» jo «*>r- "i —rj^ON^^o 1 8
South
East
(a)
/East
Anglia I><s jn oo©rt c7\
1
m——«o m(Srj _ O — § 8
South
West mm jn n jm«r»
1 <N-• SO | ——r- 1
0\r» —oor- vim 8
West
Mid
lands
1
—
|
000 OOfSr^ 8 1
rNso fN
^
rn<n 8
All mr^OO«-i ——■
1
O SOO 00 C£ CN<N 8 OSsor- SO—r«-i<N
§ 8
Regio
n
Nort
hW
est
in <N—m
York
s.and
Hum
-bers
ide
o<sr- —«w>fn
00
1
S 1 223SS2" §— r- § 00 8 8 8
jj
~-
oZ
OstNsCOCO-V',
1 ^fsr-oc——wo | r- rn\ooors rs ^
1
(Nr- fN—O rn O
Sco
t-\ 2 * —
1,0
S *
1 8 1 |
Wale
s
8 8 1 8
All
hold
s
1 •OfSO^OOf^sO 8 vonr-; ——rnso
1 8
of
whic
h,
self-s
erv
ice
.
Mult
iple
s..
..
of
whic
h,
self-s
erv
ice
.
Unsp
eci
fied
....
Tota
lall
shop
s..
..
of
whic
h,
self-s
erv
ice
.
Mult
iple
s..
..
of
whic
h,
self-s
erv
ice
.
Unsp
eci
fied
....
Tota
lall
shop
s..
..
of
whic
h,
self-s
erv
ice
Mult
iple
s..
..
of
whic
h,
self-s
erv
ice
Unsp
eci
fied
....
Tota
lall
shop
s..
..
of
whic
h,
self-s
erv
ice
.
Mult
iple
s..
..
of
whic
h,
self-s
erv
ice
Unsp
eci
fied
....
Tota
lall
shop
s..
..
of
whic
h,
self-s
erv
ice
.
Ind
ep
end
ents
of
whic
h,
self-s
erv
ice
Ind
ep
end
ents
of
whic
h,
self-s
erv
ice
.
Ind
ep
end
ents
of
whic
h,
self-s
erv
ice
Ind
ep
end
ents
Co-o
pera
tives
Co-o
pera
tives
Co-o
pera
tives
Co-o
pera
tives
FRES
HM
EA
T
FRES
HFR
UIT
VEG
ETA
BLE
S
GR
OC
ER
IES

106 Household Food Consumption and Expenditure: 1969
Table 28
Type of Shop used by Households of each Income Group
for most of their Purchases, 1969
(percentage of purchasing households)
Income Group
All A B C DType ofShop house
holds Al A2 Al &A2 with without O.A.P.earners earners(Dl) (D2)
FRESH MEATCo-operatives 10 5 7 6 10 11 9 8 15
of which, self-service 2 1 1 1 2 2 1 1 3Multiples 22 19 22 21 24 23 28 24 19
of which, self-service 11 10 10 10 13 11 14 12 8Independents 63 71 66 67 61 62 61 64 62
of which, self-service 3 2 3 3 3 3 3 2 2Unspecified . 5 4 5 5 6 4 2 4 S
Total all shops 100 700 100 100 100 100 700 100 100
FRESH FRUTTCo-operatives 5 2 3 3 5 6 7 3 6
of which, self-service 2 1 1 1 2 3 3 1 3Multiples 20 19 22 21 21 20 23 22 16
of which, self-service 14 12 16 15 15 13 15 13 10Independents 68 75 70 71 68 68 64 66 68
of which, self-service 3 5 4 4 3 3 3 1 1Unspecified . 6 4 6 5 6 5 6 8 9
Total all shops 100 100 100 100 100 100 700 100 too
VEGETABLESCo-operatives 6 2 3 3 5 6 8 2 8
of which, self-service 2 1 1 1 3 3 3 1 4Multiples 17 IS 18 17 17 17 16 21 14
of which, self-service 1! 12 13 12 12 11 10 12 8Independents 71 79 73 74 72 70 69 68 70
of which, self-service 3 4 4 4 4 3 3 2 3Unspecified . 6 4 6 6 6 6 7 9 8
Total all shops 100 100 100 100 100 100 700 100 100
GROCERIESCo-operatives 19 8 11 10 17 21 22 15 26
of which, self-service 14 6 8 7 13 16 17 12 18Multiples 49 46 55 53 52 47 48 51 40
of which, self-service 44 43 50 48 48 43 43 44 34Independents 29 42 29 32 28 28 28 30 30
of which, self-service 11 11 11 11 12 11 10 12 8Unspecified . 3 4 5 4 3 3 2 4 3
Total all shops 100 100 100 100 100 100 700 100 100
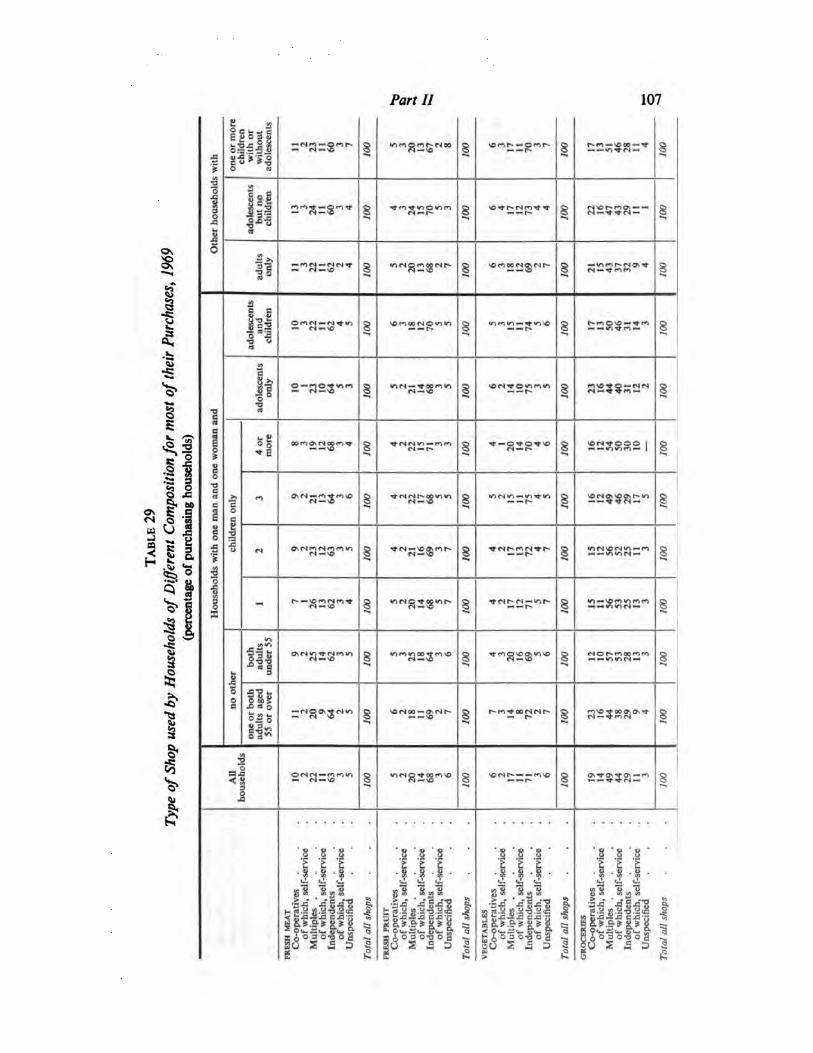
Part II 107
1
p o
•a 1
ISI3
I1
I
M*?3
c * I§ I K
11■20
IIJ c
-Nn-OMh
=^ar^(N—r*n^t
s«aC ", ri —n*)-w
00« Ov<Noori -<tIffiNCOP
0>N-M^n*
lis
fit111Sag
o\Nmf Nmm
0«M-pinir>sa=
ill8 '8
— — ~
K ■ ■ I
Pill ?
s a 5 a
"aacw-tmO rnr- CN00
"OfNOrtoofNr-',S2Sr
rlMM^-rin'ass'
*t<N—vo^mr-SS"
vi (*>v>oo t« **"S2
mNOtoon^c"S^S
I ".§
•8 -8
38 8,•a-o "rfjbaa g.a-t
2 Rill I
a
ill 1
fill 2
1 D
£
^npica«*•>as
r^n^ooNNt^
«Nr"--rt»
2 2■ ft
Si
8■
Ig
1
.=*
_8_
1
ex;
1 'i
U-J- ti ,) «,9-S *> £ o ~-
O 3 Ol
2 Dl
a«53R=-
r- c*io *o—^ten——.«nfflM
M«50- (N(N3SSC!r
>ONl>>C0(NOi«^r^«o
'0300»Osi«J':?sa
ov^^50\-f
'8 '8 '8
■
E 'E '£
•8 -8 -8 ■ •ja c, c
y in S M X
g.HK.H-S.H£ J
5u 2 £ d a
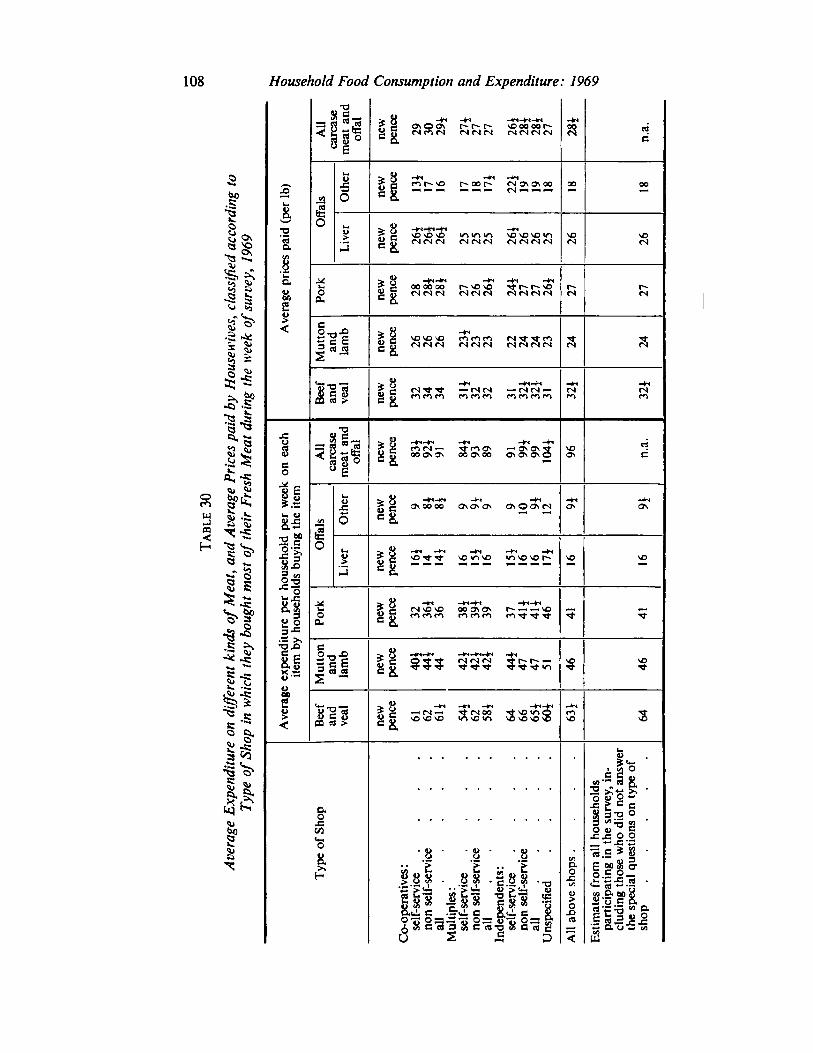
108 Household Food Consumption and Expenditure: 1969
oCI
I
I 363
8*5"
v\> •£
l-s
^■1
~*2££^
§?£
a S 55 ^-5
§5
I5s~. bo
•S ?>
*■§? ■«
S 3s
K§ 9-
3 SO
§ 8!
bo
All
carc
ase
meat
and
off
al > 8 _* -*» -+<-+••-+•
nSa o\oos r»r-r- vooooor-gB NnN <N(S«N NNNN c
u > 8 -+* *+* Hmxs Sa o<-so r-oor- <so\CT\oo 00 00
=2
23 0 S| ' N—
1t
g
0 UiK e so so so ininin s^so so <o
g j> <scs c-icncn Mtscsrsc-icncn Mtscsrs CM
y
3
a. js 000000 r-soso -*t— I^SO
g 5 <N «S(srj okscmcn«S(srj okscmcnItso 0-
< cS-o-B > g so so so f) r»>f> «N^ *t m
gS NNN <N fNCStStSfNCStStS s■sec^5
111
13
> 8 ■+* HN-+-)
a
0 *8r c6. -1
OS c
1M> .—I~ 4J
6£ g g Ovoooo CNOnOv OnOO\<S OS
8.5
1
O
O
2?5*15
> 8 "**• "It* hn hn -+<
s8.■o VO
fc-x:0
•> 8 -t* H^H^ HmHn>g CSvDvO MO\5i r~— i — vOc 5 ^ii £
.- >*T3X> c
S-g-S > 8 ■H^Hm *+i-¥**4n •+*&g -BE *C Q53 fS<Nrj 51^1-- — * SO
sS "~
-r) — '
^ y —i C4 — Hp<S00 *>C1Q
g 53 sovovo >ovo<o vo*m:\o s
<
self-s
erv
ice
....
aU
self-s
erv
ice
....
all
self-s
erv
ice
....
all
Unsp
eci
fied
....
part
icip
ati
ng
inth
esu
rvey,
incl
ud
ing
those
who
did
not
answ
er
the
speci
al
quest
ions
on
typ
eof
shop
~oa0
X
05 2<•*0
non
self-s
erv
ice
non
self-s
erv
ice
non
self-s
erv
ice
—a
Co-o
pera
tives:
Ind
ep
end
ents
:
a B
0ft
0JZV)
Mult
iple
s
:>
9
I
x>
E0]
1%
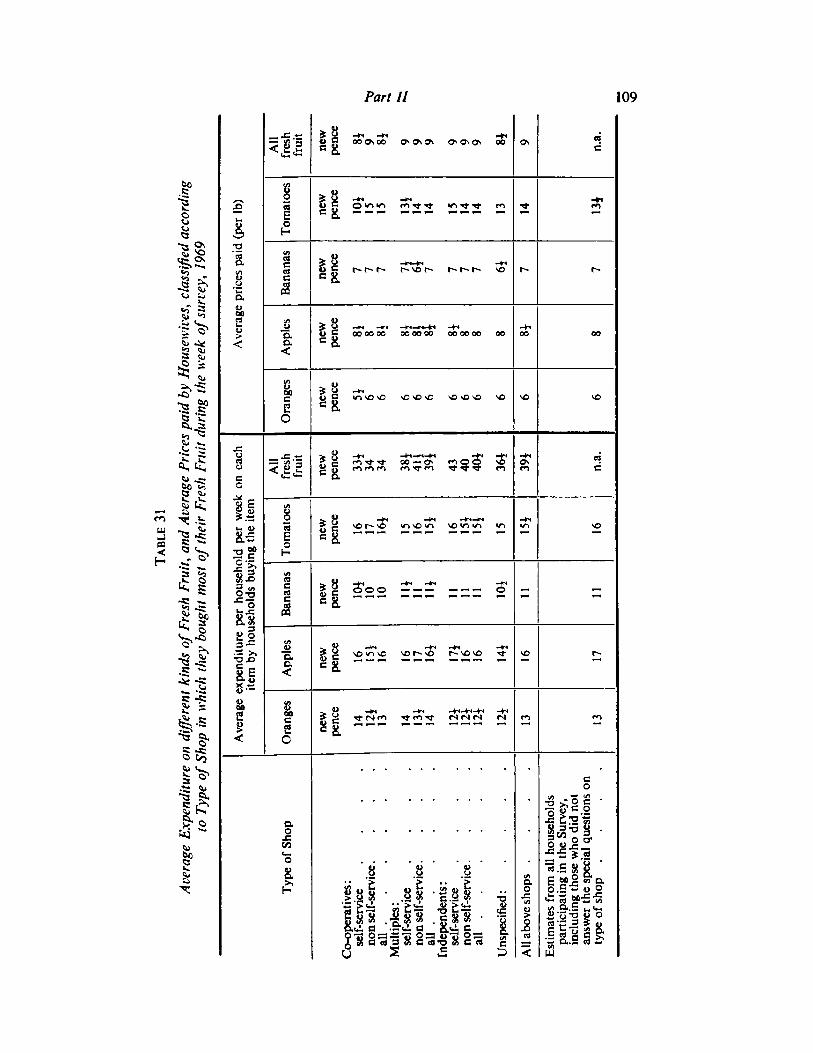
Table
31
Avera
ge
Exp
end
iture
on
diffe
rent
kinds
of
Fresh
Fruit
,and
Avera
ge
Pri
ces
paid
by
House
wiv
es,
class
ifie
dacc
ord
ing
toTyp
eof
Shop
in
whic
hth
ey
bought
most
of
their
Fresh
Fruit
duri
ng
the
week
of
surv
ey,
19
69
All
fresh
fruit
new
pence
8}9 8} 9 9 9 9 9 9 8} 9
n.a
.
Avera
ge
pri
ces
paid
(per
lb)
Tom
ato
es
new
pence
10
}1
5
15
13
}1
4
14
15
14
14
13 14
13
}
Bananas
new
pence 7 7 7 7f 6}7 7 7 7 6} 7 7
Ap
ple
s
new
pence
8}8 8} 8}
8}
8}
8}8 8 8 8} 8
Ora
nges
new
pence
5}6 6 6 6 6 6 6 6 6 6 6
Avera
ge
expendit
ure
per
house
hold
per
week
on
each
All
fresh
fruit
new
pence
33
}3
4
34
38
}
41
}
39
}
43
40
40
}
36
}
39
}
n.a
.
item
by
house
hold
sbuyin
gth
eit
em
Tom
ato
es
new
pence
16
17
16
}
15
16
15
}
16
15
}
15
}
15
15
}
16
Bananas
new
pence
10
}1
0
10
11
}1
1 "} 11
11
11
10
}
11
11
Apple
s
new
pence
16
15
11
6
16
17
16
}
17
}1
6
16
14
}
16
17
Ora
ng
es
new
pence
14
12
}1
3
14
13
}1
4
12
}
12
}
12
*
12
*
13
13
self-s
erv
ice
....
all
self-s
erv
ice
....
all
self-s
erv
ice
....
all
Unsp
eci
fied
:....
All
ab
ove
shop
s....
typ
eof
shop
....
answ
er
the
speci
al
quest
ions
on
Typ
eof
Shop
Co-o
pera
tives:
non
self-s
erv
ice
.
Mult
iple
s:
non
self-s
erv
ice.
Ind
ep
end
ents
:
non
self-s
erv
ice
.
Est
imate
sfr
om
all
house
hold
s
part
icip
ati
ng
inth
eS
urv
ey,
incl
ud
ing
those
who
did
not
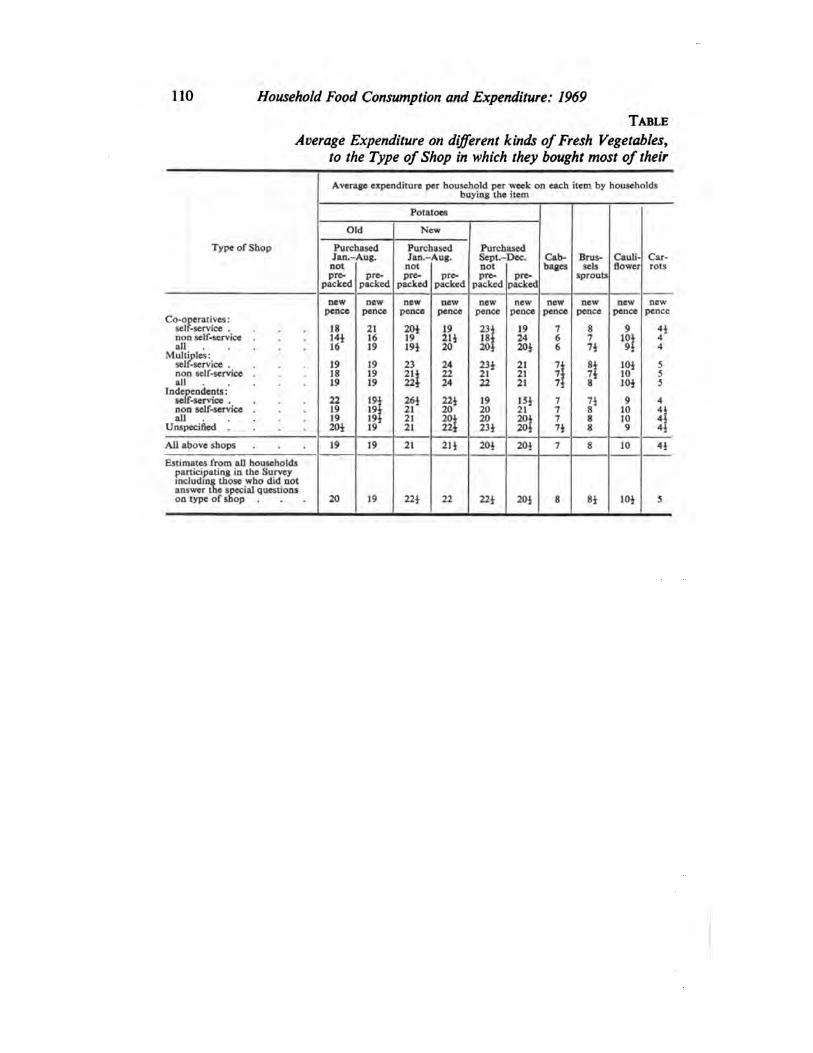
110 Household Food Consumption and Expenditure: 1969
Table
Average Expenditure on different kinds of Fresh Vegetables,
to the Type of Shop in which they bought most of their
Average expenditure per household per week on each item by householdsbuying the item
Potatoes
O d Ni :w
Type of Shop PureJan.-notpre
packed
lasedAug.
PurclJan.-
notpre
packed
tasedAug.
Purch asedDec.Sept. Cab
bagesBrussels
sprouts
Cauliflower
Carrots
prepacked
prepacked
notpre
packedpre
packed
Co-operatives:
newpence
newpence
newpence
newpence
newpence
newpence
newpence
newpence
newpence
newpence
self-service .... 18 211619
201 19 231 1924201
766
87
9non self-service 141 19 211
inall 16 191 20 71 4Multiples :
self-service . 19 191919
23 242224
ft22
212121
71717}
81718
101 555
non self-service 1819
211 10all 221 101
Independents:self-service .... 22
1919201
19119119119
261212121
22120
19 ft201201
77771
71888
91010
4non self-service 20
202.U
41all
LI 3Unspecified .... 9
All above shops 19 19 21 2U 201 201 7 8 10 41
Estimates from all householdsparticipating in the Surveyincluding those who did notanswer the special questionson type of shop . 20 19 221 22 221 201 8 81 101 5
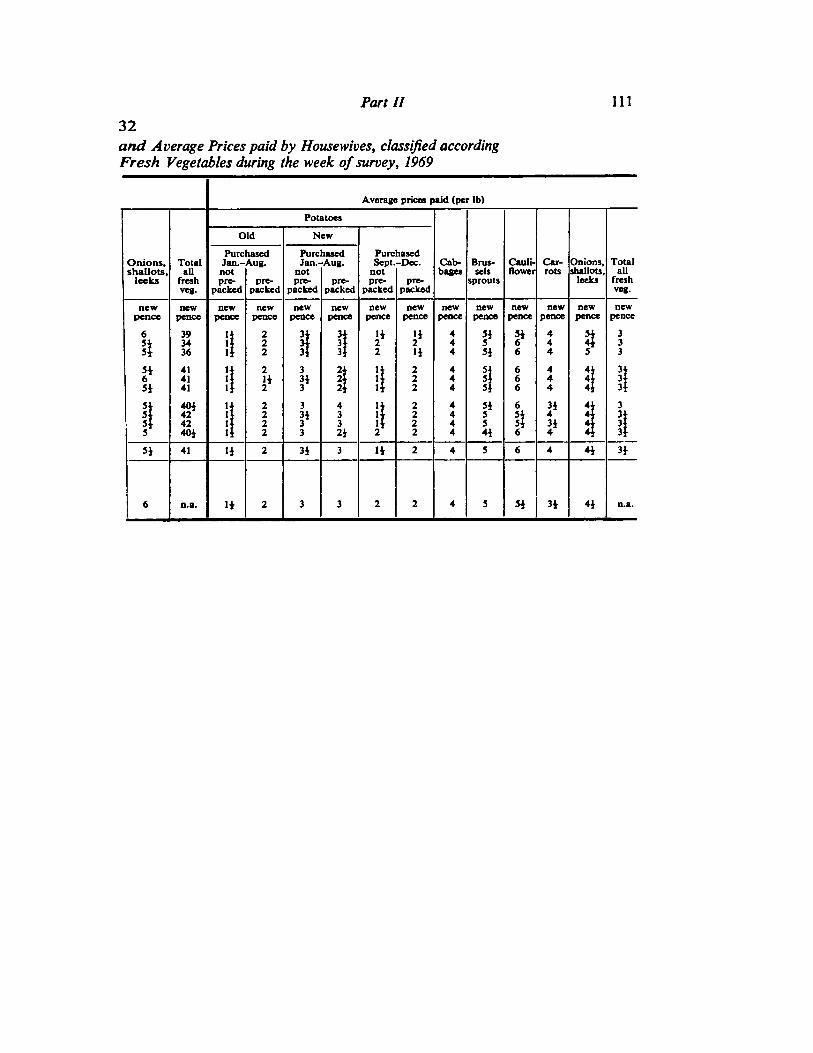
Part II 111
32
and Average Prices paid by Housewives, classified accordingFresh Vegetables during the week of survey, 1969
Average prices paid (per lb)
Onions,shallots,
leeks
newpence
Si
Potatoes
Totalall
freshveg.
newpence
393436
414141
40}424240J
41
Old
PurchasedJan. -Aug.notpre
packed
newpence
IJ
1}
prepacked
newpence
222
2H2
2222
PurchasedJan. -Aug.
notpre
packed
newpence
I3
33i33
IT
prepacked
newpence
PurchasedSept.-Dec.
notpre
packed
newpence
Vk
prepacked
newpence
a*i*
222
2222
Cabbages
newpence
444
444
4444
Brussels
sprouts
newpence
Si55i
5}
5}554}
Cauliflower
newpence
I*6
666
654SJ6
»
Carrots
newpence
444
444
3i4
?
H
Onions,shallots,
leeks
newpence
35
41
341
1
«i
Totalall
freshveg.
newpence
333
II3343431
31

112 Household Food Consumption and Expenditure: 1969
mw
.5
J?"5
8
a
i %•a v.
IIo
1 §f? ^SJ 5?
2 O
"S ?ft »*
2 5
s «v. to
gl1-5
© 35
| |
t
u as.-s
2|
eqfi
T33
si
II
e B a
~-—— (N'iJ'iJ-v-0\OiOv O^Q\9ff
*8 _a_ 0_# „M*Sg R t*ifi(*i i^*ncn (Officio
8|
f g "J-fN f f Tf ■*^t^'—
j js O*ooOs OnOnOn ^o*Ov©11
*
> 8 -t*-t*-t« ■**
a&
*1 ==;
85 — —— —'•HNO
j. .si
■ .8? ill •„
ss las |ss ~
S a 5
lis J
■=.E8»i
s s> s
8 -Sla s a
a '2 3 rt y>
I

Tables of Average Energy Value and
Nutrient Content of the Diet, 1969
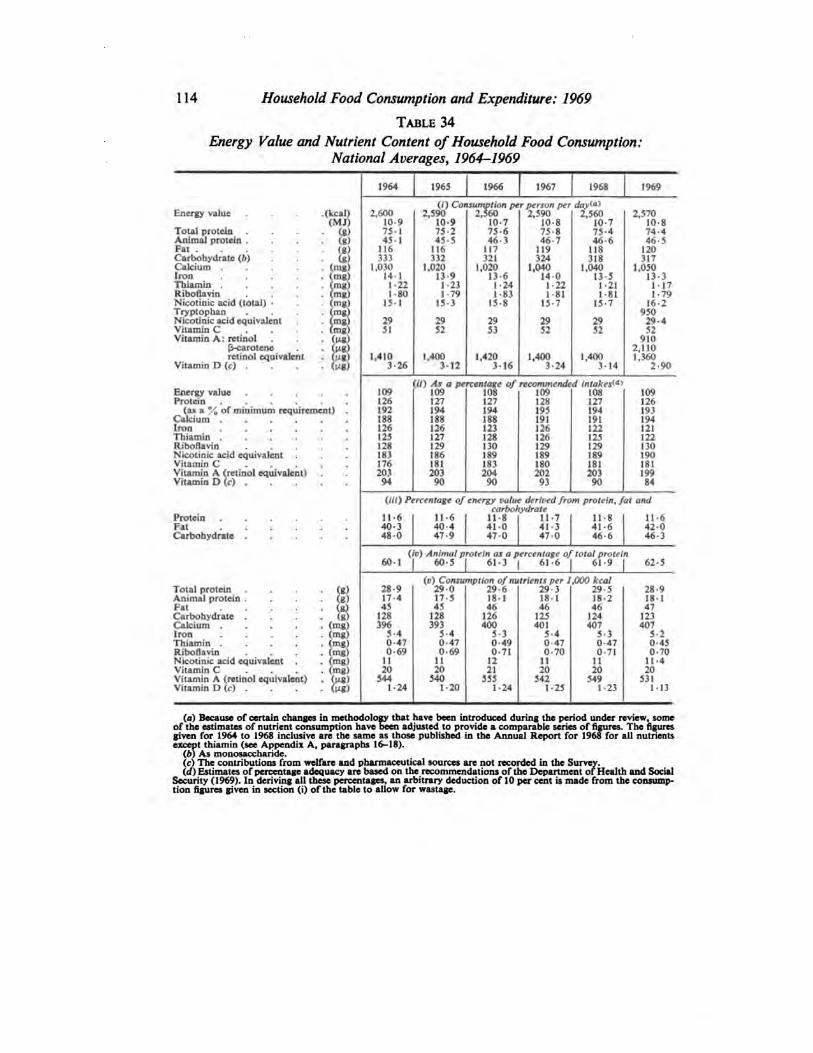
1 14 Household Food Consumption and Expenditure: 1969
Table 34
Energy Value and Nutrient Content of Household Food Consumption:National Averages, 1964-1969
1964 1965 1966 1967 1968 1969
(/) Consumption per person perEnergy value . (kcal) 2,600 2,590 2.560 2,590 2,560 2,570
(MJ) 10-9 10-9 10-7 10-8 10-7 108Total protein («) 75- 1 75-2 75-6 75-8 75-4 74-4Animal protein . (g) 45- 1 45-5 46-3 46-7 46-6 46-5
(g) 116 116 117 119 118 120Carbohydrate (6) (g) 333 332 321 324 318 317Calcium .... (mg) 1,030 1,020 1,020 1,040 1,040 1,050Iron .... (mg) 141 13-9 13-6 14-0 13-5 13-3Thiamin .... (mg) 1-22 1-23 1-24 1-22 1-21 117Riboflavin (mg) 1 80 1-79 1-83 1-81 1-81 1-79Nicotinic acid (total) • (mg) 151 15-3 15-8 15-7 15-7 162Tryptophan (mg) 950Nicotinic acid equivalent . (mg) 29 29 29 29 29 29-4Vitamin C (mg) 51 52 53 52 52 52Vitamin A: retinol . (ug)
(tig)910
2,110(J-caroteneretinol equivalent (ug) 1,410 1,400 1,420 1,400 1.400 1,360
Vitamin D (c) . (W3> 3-26
07) As a percentage of recommended intakes'-*'*
312 3-16 3-24 3-14 2-90
Energy value 109 109 108 109 108 109Protein .... 126 127 127 128 127 126
^(as a */, of minimum requirement) . 192
188194188
194188
195191
194191
193194
126 126 123 126 122 121125 127 128 126 125 122
Riboflavin 128 129 130 129 129 130Nicotinic acid equivalent . 183 186 189 189 189 190Vitamin C 176 181 183 180 181 181Vitamin A (retinol equivalent)Vitamin D (c) .
203 203 204 202 203 19994 90 90 93 90 84
(lit) Percentage of energy value derived from protein, fat andcarbohydrate
Protein .... 11-6 11-6 11-8 11-7 11-8 11-6Fat .... 403 41).4 41-0 41 -3 41-6 420
480
o) Animal protein as a percentage of total protei
47-9 47-0 470 46-6 46-3
601(
60-5 61-3 61-6 61-9■
62-5
(») Consumption of nutrients per 1,000 kcalTotal protein (g)
(g)28-9 29-0 29-6 29-3 29-5 28-9
Animal protein . 17-4 17-5 18-1 181 18-2 18-1Fat .... (g) 45 45 46 46 46 47Carbohydrate . (g) 128 128 126 125 124 123Calcium .... (mg) 396 393 400 401 407 407Iron .... (mg) 5-4 5-4 5-3 5-4 5-3 5-2Thiamin .... (mg) 0-47 0-47 0-49 0-47 0-47 0-45Riboflavin (mg) 0-69 0-69 0-71 0-70 0-71 0-70Nicotinic acid equivalent (mg) 11 11 12 11 11 114Vitamin C (mg)
(ug)20 20 21 20 20 20
Vitamin A (retinol equivalent) 544 540 555 542 549 531Vitamin D (c) . (txg) 1-24 1-20 1-24 1-25 1-23 113
(a) Because of certain changes in methodology that have been introduced during the period under review, someof the estimates of nutrient consumption have been adjusted to provide a comparable series of figures. The figuresgiven for 1964 to 1968 inclusive are the same as those published in the Annual Report for 1968 for all nutrientsexcept thiamin (see Appendix A, paragraphs 16-18).
(b) As monosaccharide.ic) The contributions from welfare and pharmaceutical sources are not recorded in the Survey.(a) Estimates of percentage adequacy are based on the recommendations of the Department of Health and Social
Security (1969). In deriving all these percentages, an arbitrary deduction of 10 per cent is made from the consumption figures given in section (i) of the table to allow for wastage.
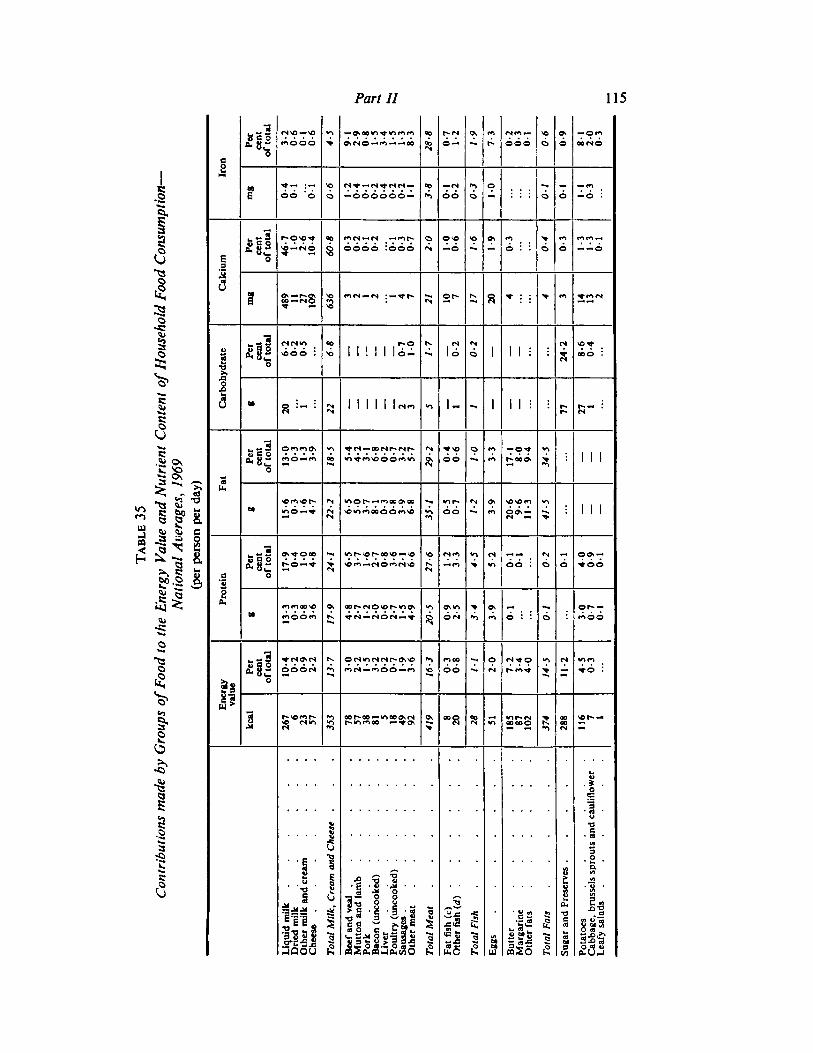
JTable
35
Contr
ibuti
ons
mad
eb
yG
roup
sof
Food
toth
eEnerg
yV
alu
eand
Nutr
ient
Conte
nt
of
House
hold
Food
Consu
mp
tion
—
Nati
onal
Avera
ges,
19
69
(per
pers
on
per
day)
cent
of
tota
l
3-2
0-6
0-1
0-6
4-5
91
2-9
0-8 1-5
3-4 1-5
1-3
8-3
28
-8
0-7 1-2
1-9
7-3
0-2
0-3
01
0-6
0-9 8-1
2-0
0-3
Iron
Per
mg
0-4
01
o'-'i
0-6 1-2
0-4
0-1
0-2
0-4
0-2
0-2 1-1
3-8
01
0-2
0-3 10 ::: 01
0-1 i-i
0-3
cent
of
tota
l
46
-7 10
2-6
10
-4
60
-8
0-3
0-2
01
0-2
0-1
0-3
0-7
20 1-0
0-6 1-6
1-9
0-3
0-4
0-3 1-3
1-3
0-1
Calc
ium
Per
flag
48
9 11
27
10
9
63
6 3 2 1 2 "i4 7
21 10 7
17
20 4 4 3 14
132
cent
of
tota
l
6-2
0-2
0-5
6-8
0-7 1-0
1-7
0-2
0-2
24
-2
8-6
0-4
Carb
ohydra
te Per
— —■
8
20 i"
22 2 3 5 1 / — —
77
27 1
cent
of
tota
l
13
-00
-3 1-3
3-9
18
-5
5-4
4-2
3-1
6-8
0-2
0-7
3-2
5-7
29
-2
0-4
0-6
10
3-3
17
18
-09
-4
34
5
Fat
Per
-
8
15
-60
-3 1-6
4-7
22
2
6-3
50
3-7
8-1
0-3
0-8
3-9
6-8
35
-1
0-5
0-7 1-2
3-9
20
-69
-61
1-3
41
5
-
cent
of
tota
l
17
-90
4 1-0
4-8
24
1
6-5
3-7 1-6
2-7
0-8 3-6
21
6-6
27
-6 1-2
3-3
4-5
5-2
0-1
01
0-2
0-1
40
0-9
0-1
Pro
tein
Per
8
13
-30
-30
-83
-6
17
-9
4-8
2-7 1-2
2-0
0-6
2-7 1-3
4-9
20
-5
0-9
2-3
3-4
3-9
01
01 30
0-7
01
cent
of
tota
l
10
-40
-20
-92
-2
13
-7
30
2-2
1-5
3-2
0-2
0-7 1-9
3-6
16
3
0-3
0-8 11
20
7-2
3-4
4-0
14
5
11
-2
4-5
0-3
Energ
yvalu
e
Per
kcal 6
26
7
23
57
35
3
78
37
38
815
18
49
92
41
9 8
20
28
31
18
38
71
02
37
4
28
8
11
67 1
! Oth
er
milk
and
cream
....
Tota
lM
ilk,
Cre
am
and
Cheese
.
Pork
Liver
Oth
er
fats
Tota
lFa
ta
Cab
bag
e,
bru
ssels
spro
uts
and
caulif
low
er
.Le
afy
sala
ds
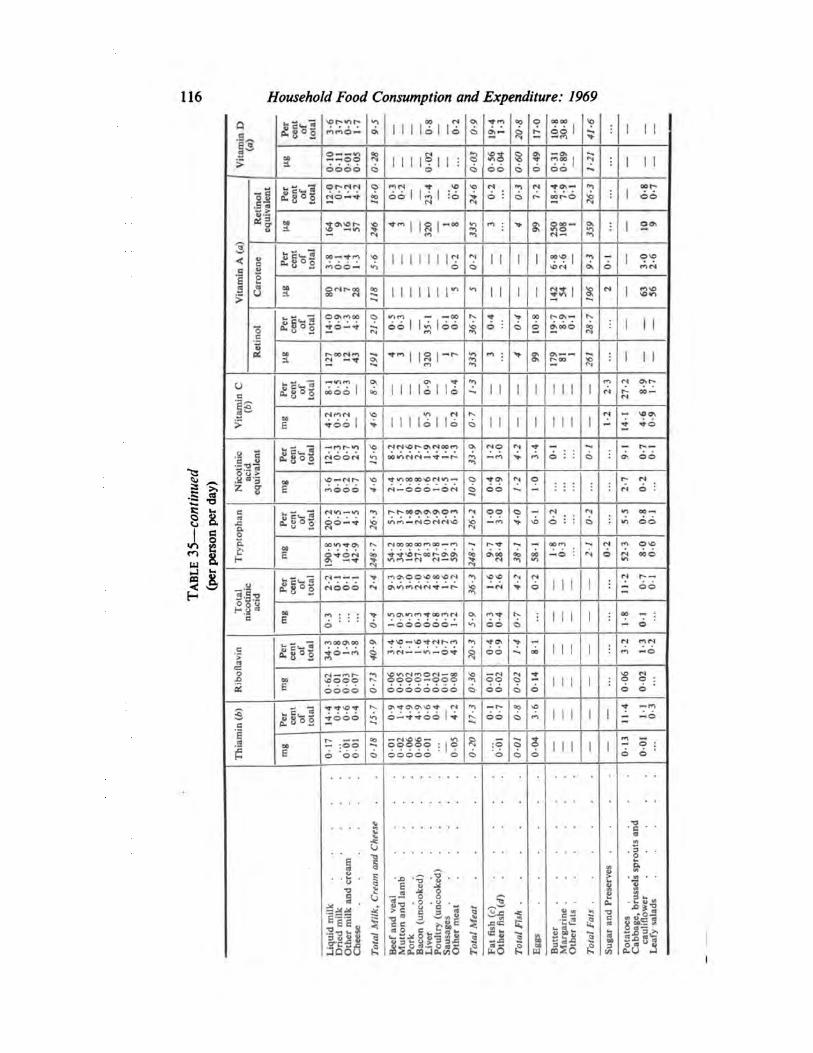
116 Household Food Consumption and Expenditure: 1969
Q
Per
cent
of
tota
l CO <N ->o
o oooo
c mmO — 1 1 1 16 1 16 66 1 I I I
13—m
3 O ——«n
ft
1 1 I l?l 1 i
2 ^5moOO
f^OO I IN|
I I I>——OO
6 0 C 66oooo O
08.Em
Jet."S8°o
OMNNgo 1 1 1 >o
oo :
■*o\—
1 66
I!
«o S 00t--O NO
ee •C •^ : ■* Ooo —•no 1 2*o a. C
m-a ON ft
< acuO
fe 8*3 oo—^-m
1 1 1 1 1 1 12
6 1 1 [ 1
DOvO1
NOfS
1 ot?
I
moo — *0 o o fNl
3
>
<3 ©<sr-oo
1 1 1 1 1 1 r "n
1 1 i 1
CN 1 ««a. 00 rj 2 1 >Oir>
*Hoosmoo ion — —oo
GO 1 1 «->1 O<0 o :
00 r^o\—
1 1 1
o o ONOOOc
3
r-oo m : -» $ ON——
1 1 1On r*-oo
—«nmoooo 1 11116 116
ON * •1
1 1 1 1 1 1 1 1
(*1 <s o»r-
c
>
r- oo—1 1 1 161 16 1 1 1 1 1 1 1
D — nOOn> ^
- *6
S e<_2o-gooc INC^Or»0\«N00C» 3, <NO mm r* —
.a c
■-.^ a
<SOOM J! 6 ■ 6 oV 66
inued
day)
0 o >M ■^■t/ioooo'OtNVi—
N-OOO-ONe
E moOO oo ri o :
c«
r-'r-oOONCTiOOr** oo *n oo—>n oo
i
c aop.>t
OO —f 8 mMH(SONN« —fn SO o :r*i S
t n
rv M000000'*l00^'*,>
V.O —<N <N—V»
00ei fN (*> o*
w a. H E 8*23 3 9 00 » —O ' l-J O «N ooo«o
Tabl (p
er fS ———
3 -tw,
1 1 1 1*s r- —
33s £s°2 r*ooo o\«rt<*ic*M*»—r» > O £. ©6
'5
M m ; ; ;
6
N.
1 1 1 1
oo •-> ;
— 6E
rt QOON00
6 —666666—^
66>
1 1 1 :c£S°2 join 3
c*i<N——«n—o* r -- QO «*) —o
1| —fH 5 S :00 \SOOO Is oooo— ooo
oooooooooooo 1 1 1 I 6 6E oooo o
§ £8oS fOOO —-
ON**ONON^-* (Noo 1 1 1 i 1 — «6
3
— :oo
6 '66■0 ooooo : j ©
ooooo ' 6
S3
a:5 Q s
1 1 1 i I
— o :
6 '6 6 6 6 6
S
^0
ai
•c
5
E
1
■■*>
■3
1i
■■g-9 ? • •
B 5 <3
>■•5
' '
■o«-2 o § 1
Si '8 "1 "3
3
a.
*1|S c 3 8
1 1
C
1 v eofE 3
In!eao c . £ 2?»»u-r:.* o S— % «
t- « l O eo-s .
1
1 §•5 «^
2
U 3 i- '->> 3 3 -C BasiJQ0U oJ. o «-£ o bj-:
aa 5 a. ca-l a.« 0 U.O
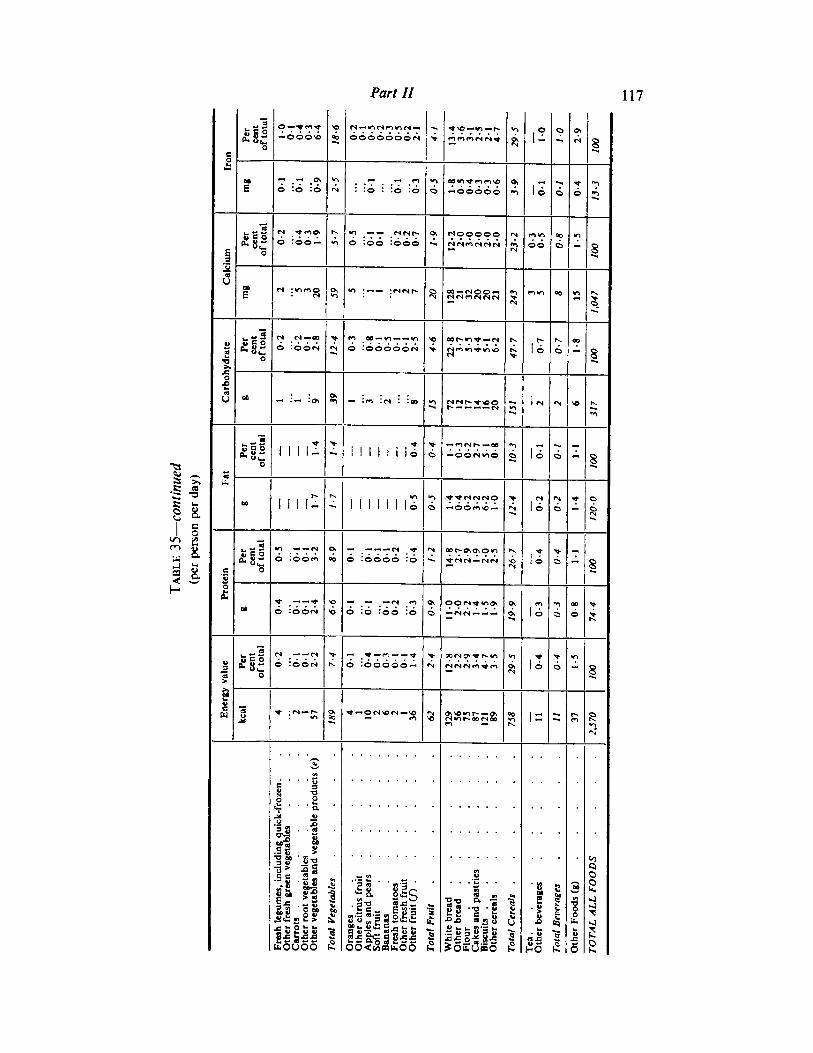
Part II 117
a.5s:
s
mua<
■3
0«ooo« "i
"^1!
0 OSOOOOOOOtN
« r'j
8
a0
•-1
E 0 :6 :6 6 -•66060 li •"N *0
"30
: :o : :o :© 6 6
6 ioo« 0 :©© =o66rtooooo
66 °? >rtI
6 8
I On <*»:«■*-« :w«r- 8 CO-NOO- **jw QO m Is.Ncnnw<N a;
V -si 0 :6o<s>
0 :66o66nV ^
16 6
00
g
> k
8
3s
0 >
Q-0
<3 00 — ;— :o* 8j •«: :n : :«o cicif-^s©© Ir. «N «
•*•
^"311 u2
>
1 1 1 1 1 1 16>
16
a)
0
—* 6 —- 6 - 8
M 1111Srv
1 1 1 1 1 1 16^
6 16 6
^»*
--1
— .-7 ——M /* •N 00r- on<*©«n rs.a > T
a"C0
00 100A 6 :oooo :6 6 8
1" .TTf ft 00 >
H O :66n 6 :o :6o :6 6 16 6 6
-3 r4 ——n M _-«*—M ——-^ aon on* t- **> «M
§
0
6 :66<n ts. 6 :6coo6« 16 6 8
cw
1
n
1 1
8 2 o\*o»or- —aNwir-oooioo
00
1 =
S . . .2
ll • -1
f| s
IS 'J5<2
si li
I
Q0do fl „
1 li- "jic ■otj 2. -a 1
2 s g
li.lf I "3 18 1 S
<->
S
a
■JJ
it ft!
"3
T_c u 0 *- 1-•5 I E B B "a ilifijlll
81
. S B =3
« 3 1
£oEOSo
"3
S3HO
i
fcOOOO B S s
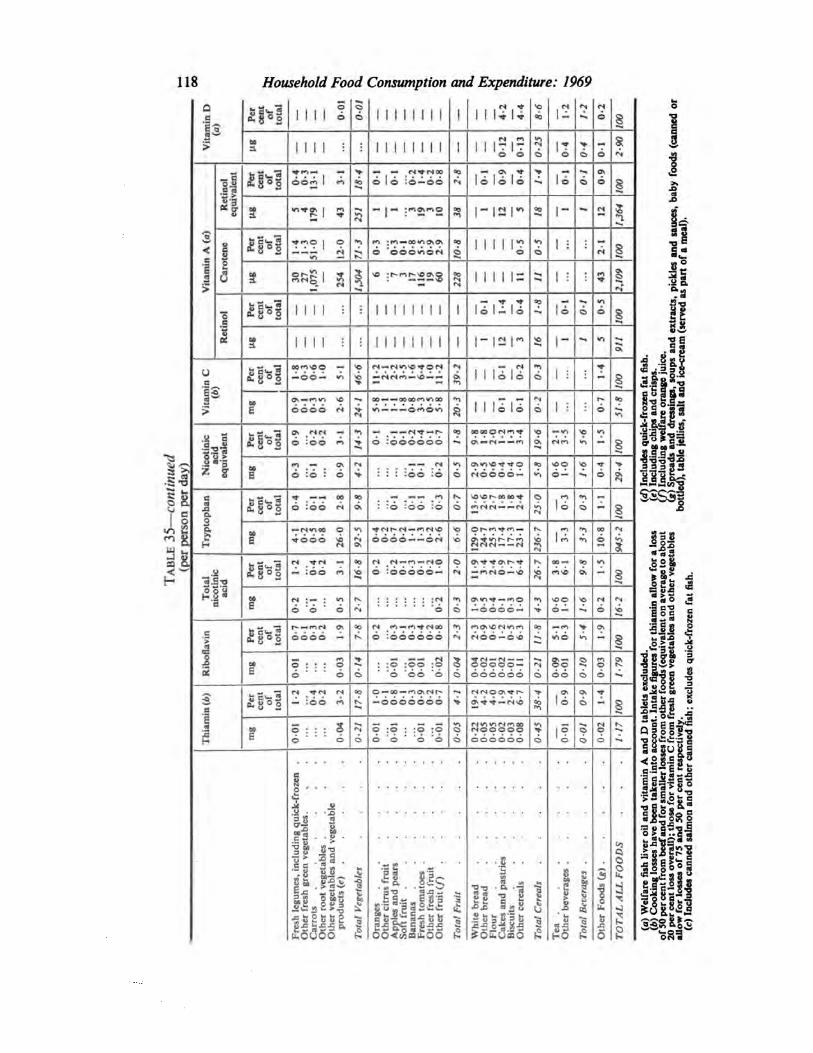
118 Household Food Consumption and Expenditure: 1969
t
I
Per
cent
of
tota
l mil 5
II II II II 1 mui: so1- 6 8
3Q 00
—™
H
i i i i ; M II 1 II 1 1 0 0 0 '2 6
S
°i
>
6 1 6 :6 —66«9
r'<
1 6 1 6 1 6
T
-i 16Os
"S >
©Of* 1 r*i —.
6 |
*l H —i
1 M —4 3 ria r CO 1-rj
a. A
1
■*MO j © *? m —oe»no\o\
6 "6 0 6 »n 6 1 1 1 1 12
0 1 ! 8
s
——— (Nm —
rJ
sagi g
« : r- r- ^ as0 11111= 1 :
>
— Tj> « V)
"ca
£ S0 1 MM i 1 M 1 II II 1 lol-lo 16 0 8
i
at Mil : II 1 1 1 1 M 1 r 12 r « 1- •*» sn
u —66 — »o —NNn- so— £ 0. II 16 16 6 1 ! 8a
§sCO 6666 <s
—* 00——oooomtnoo *->II 16 16 6 1 : 6
00•-1> B v. C —'. C ■ v.
Nic
oti
nic
IOs N« — — ——(NT — r- so OOCCO<N"1sf so —sn
MMo :oo > 0 :ooooo© ■»»on—<n——n OA •n 8
t
m — ^ os
: : : :©6 *:©—— (N
6ON«->SO '"fOr»6666 —
SOO so»■»6 :6 : 6 »n 6 — 6
Try
pto
phan o :©© w : :© :66 :©
K. sosor-oooo^-rn(N(N——r* 16
*? --Nmoo otooo jo
fS r- c«—r*>(N*OOOO ——©(N U
N
E s so OS «or- r- »nNNN — N«n O
Sc<~268°2
W -*-<N —
6 :ocooo- 9 os^'^Osr-'* 00— m
Tota
lnic
oti
nic
aci
d
« :66 -r*KSlO«SO (*iso 8*-■
to <s : — : «n
6 '6 ' 6
|S«N
:::::: :r*
6
•n
6
OSVI —*n0 SO© «N
1 6 — 0
Rib
oflavin
r- —f>n os K
6 :666666 "? wossoNri66 —6so
op > as
6666 — Is ~~- •no 8
M— #*»o : : ©
6
" ' 6
: :S :oo :©*6 "66 '6
s Soooo=666666
IN So66
m0 o\
E Q ci 6
Thia
min
(6) fN ^tS <N ■a O —00—mosMr- >
16Os **
— :66 A —• -6666666 > as ^j-
tj-—<nso
Si 6
1
5 : : : S © :© : :o : 0
6 *6' '6 *6
rNNO<0rN 00CNOOOOO 96 If O
6 ' ' 6 666666 6
o . . .3 .
P 11
a a . sss ■§ H lis
. . c . . .
1 8 s s<
3
OOu.
illiilll 1
gs •§ s i
§ irt *1 ■ 2 g
S »
X "-
■3
6
0u.
IIJlI1 I immi 1 iJisii 1
« JJ S (JuV
5 £
iiiJil
0 > a ..e a
-slisosc —> « K 0
§.S2°M
ONIs
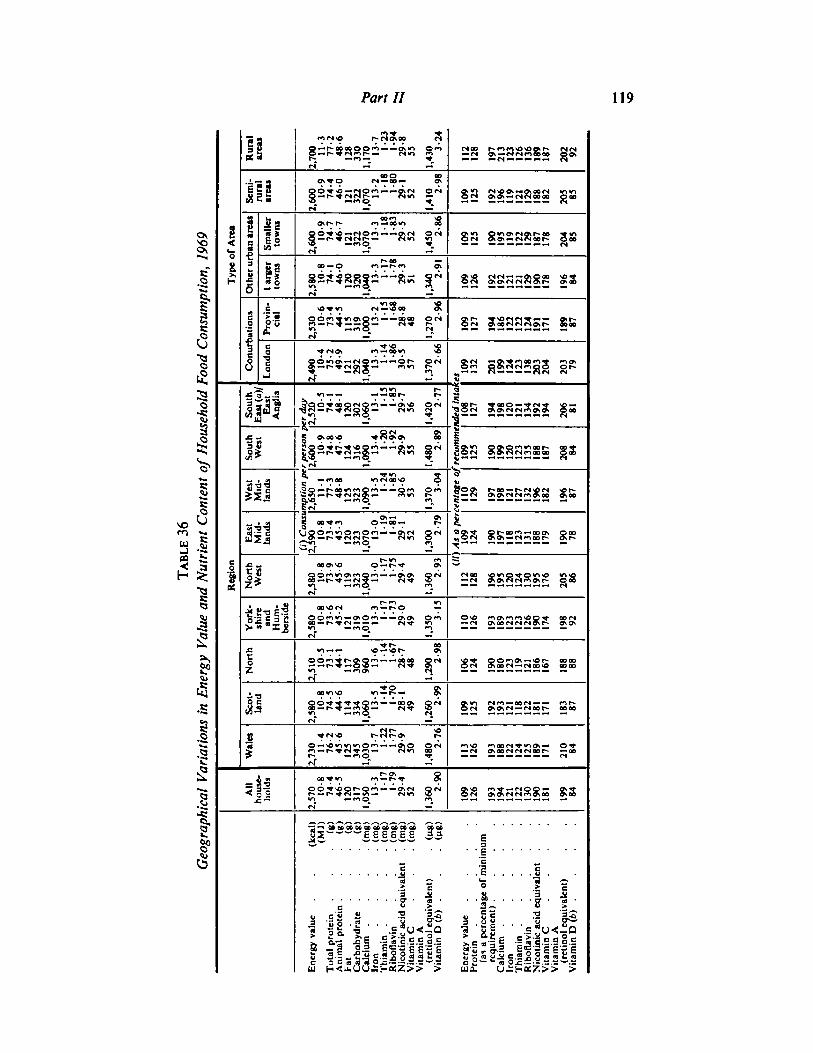
Table
36
Geog
rap
hic
al
Vari
ati
ons
in
Energ
yV
alu
eand
Nutr
ient
Conte
nt
of
House
hold
Food
Consu
mp
tion,
19
69
All
house
hold
s
Wale
sSco
tla
nd
Nort
hYork
shir
eand
Hum
-be
rsid
c
Regio
n
Nort
hW
est
East
Mid
lands
West
Mid
lands
South
West
South
East
(a)/
East
AngU
a
Conurb
ati
ons
Lond
on
Pro
vin
cial
Typ
eor
Are
a
Oth
er
urb
an
are
as
Larg
er
tow
ns
Sm
alle
rto
wns
Sem
i-ru
ral
Energ
yvalu
e
Tota
l
iI pro
tein
.
Fat
Carb
ohyd
rate
Iron
Thia
min
.
Rib
oflavin
Nic
oti
nic
aci
deq
uiv
ale
nt
Vit
am
inC
Vit
am
inA
(reti
nol
eq
uiv
ale
nt)
Vit
am
inD
(6)
.
Energ
yvalu
e
(as
a
perc
enta
ge
of
min
imum
Iron
Thia
min
Rib
oflavin
Nic
oti
nic
aci
deq
uiv
ale
nt
Vit
am
in
C
Vit
am
inA
(reti
nol
eq
uiv
ale
nt)
Vit
am
inD
(6)
.
2,5
70
10
-87
4-4
46
-51
20
31
71
,05
01
3-3
1-1
71
-79
29
-43
2
1,3
60 2-9
0
12
.73
0
76
45
12
53
45
1,0
30
13
7
1-2
21
-77
29
-93
0
1,4
80 2-
76
2,5
80
10
74
44
11
43
34
06
0 1311
28
49
1.2
60 2-9
9
2,5
10
10
-57
31
44
-11
17
30
99
60 13
-61
14
1-6
72
8-7
48
1,2
90 2-9
8
2,5
80
10
-87
3-6
45
-21
21
31
9.0
10
13
-3 I 1-7
32
90
49
1,3
50 31
5
2,5
80
10
-87
3-9
45
-61
19
32
31
,04
01
3-0
1-1
71
-75
29
-44
9
1,3
60 2-9
3
10
91
26
19
31
94
12
11
22
13
01
90
IS1
19
98
4
11
31
26
19
31
88
12
21
24
12
51
89
17
1
21
08
4
10
91
25
19
21
93
12
11
18
12
21
81
17
1
18
38
7
10
61
24
19
01
80
12
31
19
12
11
86
16
7
18
88
8
11
01
26
19
31
89
12
31
23
12
61
90
17
4
19
89
2
11
21
28
19
61
95
12
01
24
13
01
95
17
6
20
S8
6
(/)
Consu
mpti
on
per
pers
on
per
day
rtjjp
2,5
90
10
k7
3-4
45
-31
20
32
31
,07
01
30
11
9
1-
81
29
-
1
52
1,3
00 2-7
9
12
,65
01
17
74
81
25
32
31
,09
01
3
31 -2
41
-85
30
-63
3
1,3
70 3-0
4
12
,60
01
0-9
74
-84
76
12
43
16
1.0
90
13
-41
-20
1-9
22
9-9
33
1,4
80 2-
89
10
-57
4-1
48
-11
20
30
21
,06
01
31
11
51
-85
29
-73
6
1,4
20 2-7
7
2,4
90
10
-47
5-2
49
-91
21
29
21
.04
01
3-3
1-1
4
1-
86
30
-53
7
1,3
70 2-6
6
2,5
30
10
-67
3-4
44
-51
15
31
91
,00
01
3-2
1-1
31
-68
28
-84
8
1,2
70 2-9
6
2,5
80
10
-87
4-
1
46
01
20
32
01
,04
01
3-3
11
71
-78
29
-33
1
1,3
40 2-9
1
2,6
00
10
-97
4-7
46
-71
21
32
21
,07
01
3-3
11
81
-83
29
-53
2
1.4
50 2-8
6
2,6
00
10
-97
4-4
46
-01
21
32
21
,07
01
3-2
1-1
1in
29
-13
2
1,4
10 2-9
8
1
(//)
As
a
perc
enta
ge
of
reco
mm
ended
inta
kes
10
9
I 11
0I 1
09
10
8
|10
91
24
|12
9|1
25
|12
7
I13
2
19
01
97
11
81
23
13
11
88
17
9
19
07
8
19
71
98
12
11
27
13
21
96
18
2
19
68
7
19
01
99
12
01
23
13
51
88
18
7
20
88
4
19
41
98
12
01
21
13
41
92
19
4
20
68
1
20
11
99
12
41
23
13
82
03
20
4
20
37
9
10
91
27
19
41
86
12
21
22
12
41
91
17
1
18
98
7
10
91
26
19
21
92
12
11
21
12
91
90
17
8
19
68
4
10
91
25
19
01
95
11
91
22
12
91
87
17
8
20
48
3
10
91
25
19
21
96
11
91
21
12
91
88
18
2
20
38
3

o
Table
36
—co
nti
nued
All
house
hold
s
Regio
n
Wale
sSco
tla
nd
Nort
hYork
shir
eand
Hum
-be
rsid
e
Nort
hW
est
East
Mid
lands
West
Mid
lands
South
West
South
East
(a)/
East
Anglia
Typ
eof
Are
a
Conurb
ati
ons
Lond
on
Pro
vin
cial
Oth
er
urb
an
are
as
Larg
er
tow
ns
Sm
alle
rto
wns
Sem
i-ru
ral
are
as
Pro
tein
Fat
Carb
ohyd
rate
Tota
lp
rote
inA
nim
al
pro
tein
.
Fat
.
Carb
ohyd
rate
Calc
ium
.
Iron
Thia
min
.R
iboflavin
Nic
oti
nic
aci
deq
uiv
ale
nt
Vit
am
in
C
Vit
am
inA
(reti
nol
eq
uiv
ale
nt)
Vit
am
inD
(6)
.
11
-64
2-0
46
-3
11
-24
1-3
47
-4
11
.J
39
-74
8-6
11
-74
2-
1
46
-2
(M/)
Perc
enta
ge
of
energ
yvalu
ederi
ved
from
pro
tein
,fa
tand
carb
ohyd
rate
11
-44
2-2
46
-3
62
-55
9-8
59
-86
0-3
61
-4
28
-91
8-1
47
12
34
07 5
-20
-45
0-
70
11
-42
0
53
1 1-
13
27
-91
6-7
46
12
63
76 5-0
0-4
50
-65
11
01
8
54
2 10
1
28
-91
7-3
44
13
04
12 5
-20
-44
0-6
61
0-9
19
29
-
1
17
-64
71
23
38
4 5-4
0-*
0-6
11
-41
9
48
8 1'
16
51
4 1-1
9
28
-51
7-5
47
12
43
90 5-2
0-4
50
-6
71
1-2
19
52
1 1-2
2
U-5
41
-54
7-0
61
-7
11
-44
1-6
46
-9
11
-74
2-4
45
-8
11
-54
2-9
45
-5
U-8
43
-14
5-0
12
-14
3-
8
44
-
0
(iv)
Anim
al
pro
tein
as
a
perc
enta
ge
of
tota
lp
rote
in6
1-7
63
-26
3-6
|64
-8
j66-32
8 17
-74
61
25
40
2 50
0-4
50
-68
11
-41
9
52
9 11
3(o)
Consu
mpti
on
of
nutr
ients
per
tJO
OO
kcal
28
-41
7-5
46
12
54
14 5
-00
-46
0-
70
11
-22
0
50
3 1-
08
29
-21
8-3
47
12
24
12 5
10
-47
0-
70
11
-62
0
51
7 1-
15
28
81
8-3
48
12
14
19 5
-20
-46
0-7
41
1-5
21
57
0
29
-51
9-1
48
12
04
21 5
-20
-46
0-7
41
1-1
22
56
5 11
0
30
20
49
11
74
195
3
0-4
60
-7
51
2-2
23
55
01 1-
07
11
64
1-0
47
-2
11
-54
1-9
46
-5
II-S
42
-04
6-4
11
-44
1-9
46
-5
60
-76
20
62
-66
1-9
29 17
46
12
63
945
2
0-4
50
-67
11
-41
9
50
2 11
7
28
-71
7-8
47
12
44
03 5
-20
-45
0-
69
11
-32
0
51
9 1-1
3
28
-71
8-0
47
12
44
10 5
-10
-45
0-7
01
1-4
20
55
5 11
0
28
-61
7-7
47
12
44
11 5
10
-45
0-6
91
1-2
20
54
2 1-1
5
(a)
(b.) In
clud
ing
Lond
on,
for
whic
hse
para
tere
sult
sare
giv
en
inth
eanaly
sis
acc
ord
ing
toty
pe
of
are
a.
')
The
contr
ibuti
ons
from
welfare
and
pharm
ace
uti
cal
sourc
es
are
not
incl
uded
inth
eSurv
ey.
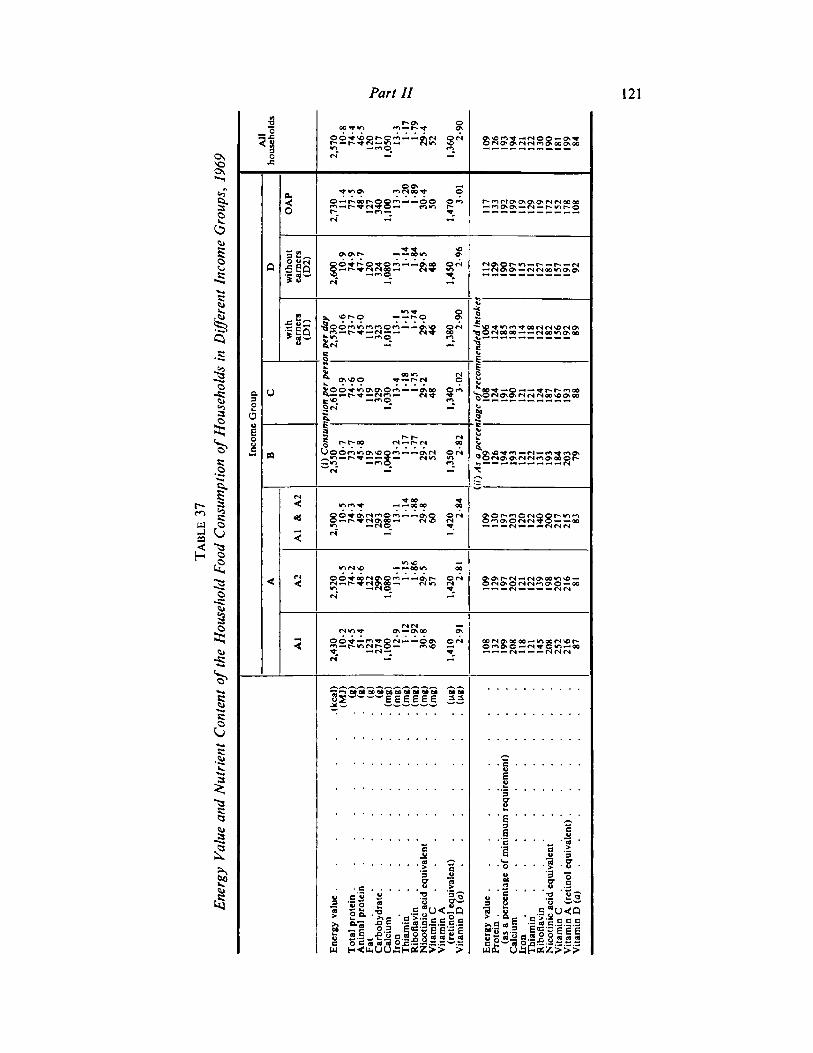
to
Table
37
Energ
yV
alu
eand
Nutr
ient
Conte
nt
of
the
House
hold
Food
Consu
mpti
on
of
House
hold
s
in
Diffe
rent
Inco
me
Gro
up
s,1
96
9
Inco
me
Gro
up
Al
A2
Al
&
A2
B
wit
hearn
ers
(Dl)
wit
hout
earn
ers
(D2
)
OA
P
All
house
hold
s
2.4
30 10
-27
4-5
51
-41
23
27
41
,10
01
2-9
11
21
92
30
86
9
1,4
10 2-9
1
2,5
20
10
5
74
-24
8-6
12
22
99
1,0
80
13
11
15
1-8
62
9-5
57
1,4
20 2-8
1
2,5
00
10
-57
4-3
49
-41
22
29
3
(0C
onsu
mpti
on
per
pers
on
per
day
13
1II-
1-8
12
9-8
60
1.4
20 2-8
4
2,5
50
10
-77
3-7
45
-81
19
31
61
,04
01
3-2
1-1
71
-77
29
-25
2
1,3
50 2-8
2
2,6
10
10
74
^4
51
19
32
91
,03
01
3 1 1
29
48
1,3
40 3-0
2
2,5
30
10
-67
3-7
45
-01
13
32
31
,01
01
31I 1-7
42
90
46
1,3
80 2-9
0
2,6
00
10
-97
4-9
47
-71
20
32
41
,08
01
31
1-1
41
-84
29
-54
8
1,4
50 2-9
6
2,7
30
11
-47
7-5
48
-91
27
34
01
,10
01
3-3
1-2
11
-8!
30
-45
0
1.4
70 30
1
2,5
70
10
-87
4-4
46
-51
20
31
71
,05
01
3-3
11
71
-79
29
-45
2
1,3
60 2-9
0
Energ
yvalu
e(k
cal)
(MJ)
Tota
lp
rote
in(g
)A
nim
al
pro
tein
(g)
Fat
(g)
Carb
ohyd
rate
(g)
Calc
ium
........
(mg)
Iron
....
....
.(m
g)
Thia
min
....
....
(mg)
Rib
oflavin
(mg)
Nic
oti
nic
aci
deq
uiv
ale
nt
.....
(mg)
Vit
am
in
C
(mg)
Vit
am
inA
(reti
nol
eq
uiv
ale
nt)
(u.g
)V
itam
inD
(u)
(u.g
)
Energ
yvalu
e..
.......
Pro
tein
....
....
..(a
s
a
perc
enta
ge
of
min
imum
req
uir
em
ent)
Calc
ium
....
.....
Iron
....
....
..Thia
min
....
.....
Rib
oflavin
....
.....
Nic
oti
nic
aci
deq
uiv
ale
nt
......
Vit
am
in
C
....
....
.
Vit
am
inA
(reti
nol
eq
uiv
ale
nt)
Vit
am
inD
(a)
10
81
32
19
92
08
11
81
21
14
52
08
25
22
16
87
10
91
29
19
72
02
12
11
22
13
91
98
20
52
16
81
10
91
30
19
72
03
12
01
22
14
02
00
21
72
15
83
(//)
As
aperc
enta
ge
of
reco
mm
end
ed
Inta
kes
10
91
26
19
41
93
12
11
22
13
11
93
18
42
03
79
10
81
24
19
11
90
12
11
21
12
41
87
16
71
93
10
61
24
18
51
83
11
41
18
12
21
82
15
61
92
89
11
21
29
19
01
97
11
51
21
12
71
31
15
71
91
92
11
71
33
19
21
99
11
91
29
11
91
72
15
21
78
10
8
10
91
26
19
31
94
12
11
22
13
01
90
18
11
99
84
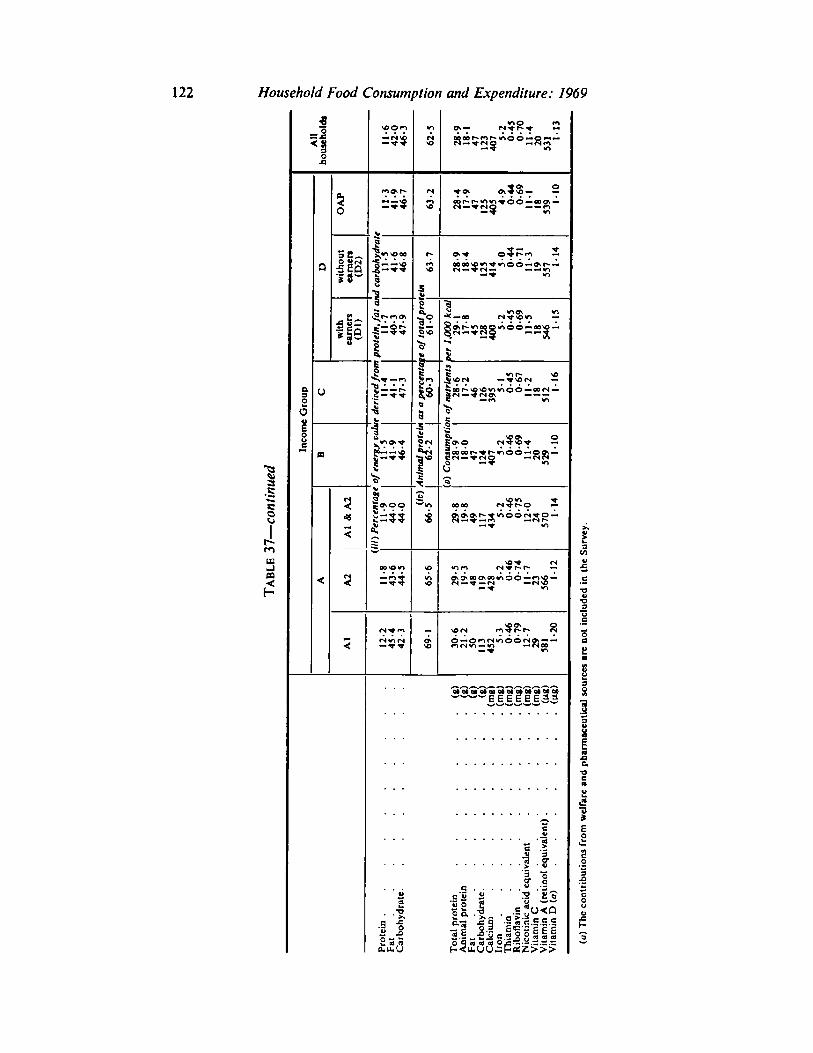
All
house
hold
s
1-1
3
11
-64
20
46
-3
53
1
62
-5
0-
70
11
-42
0
28
-91
8-1
47
12
34
07 5
-20
-45
Table
37
—co
nti
nued
OA
P
11
-34
1-9
46
-7
63
-2
28
-41
7-9
47
12
54
05 4-9
0-4
40
-69
11
-11
85
39 M
0
«
«/
carb
ohyd
rat
11
-54
1-6
46
-8
D
wit
hout
earn
ers
(D2
)
63
-7
28
91
8-4
46
12
54
14 5
00
44
0-7
11
1-3
19
55
7 11
4
elm
pro
tein
,fa
tw
r«of
tota
lp
ro6
1-0
oer
IftO
Okc
al
29
11
7-8
45
12
84
00 5
-20
-45
wit
hearn
ers
(Dl) 40
-34
7-9
0-
69
11
-51
8 1-
15
e
deri
ved
from
11
-44
1-1
47
-3
as
a
perc
enta
60
-3n
of
nutr
ients
28
-61
7-2
46
12
63
95 51
0-4
5
54
6
0-
67
11
-21
8 1-1
6
Inco
me
Gro
up c
of
energ
yca
ll
Anim
al
pro
tein
62
-2
p)
Consu
mpti
c2
8-9
18
-04
71
24
40
7 5-2
0-4
6
51
2
41
94
6-4
0-
69
11
-42
0 1-1
0
B
52
9
Al
&
A2
lit)
Perc
enta
ge
11
-94
40
44
-0
66
.r
29
-81
98
49
11
74
34 5
-20
-46
0-7
51
2-0
24 1
-1
4
1,-
8
(5
70
43
-
6
44
-
5
65
-6
29
-51
9-3
48
11
94
28 5
-20
-46
0-
74
11
-72
3 1-1
2
A A2
56
6
12
-24
5-4
42
-3
69
1
30
-62
1-2
50
11
34
52 5
-30
-46
0-
79
12
-72
9 1-2
0
Al
58
1
Rib
oflavin
.
(mg)
(u)
The
contr
ibuti
ons
from
welfare
and
pharm
ace
uti
cal
sourc
es
are
not
incl
uded
inth
eSurv
ey.
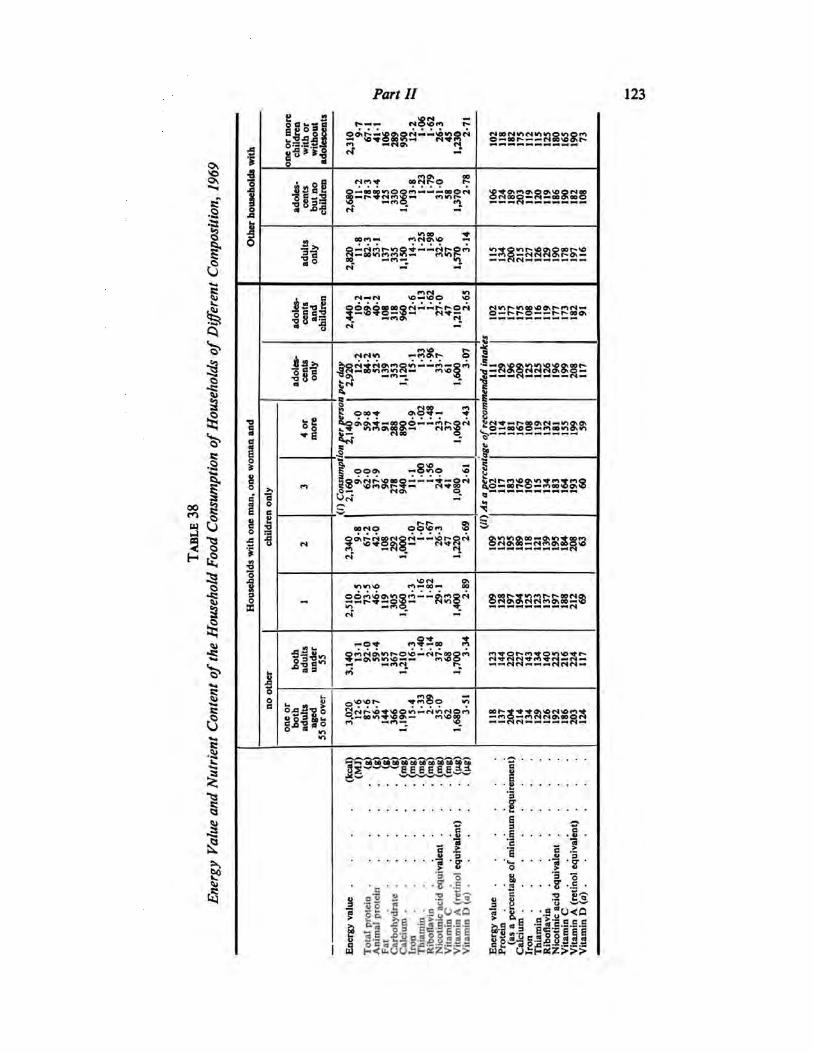
Part II 123
CIUJ-J
3
9 S teailJJ
32glo5 -2
611
532-aE°8§2
is*■o8 o
SS
oX
J5 b
sfi
8*1 «
5vocj r*-\pg\©rs-*— so*
Nn* oowr-CO —oooo»o©Om —— -oo—r»^c*»nsp« r
flMO\<0 -*
22SS12S2 —R$2M
3?-
-82ss°
i —fso r
o©o\o w>c
t- o\ «n<nso—— m*o
Ovovor- ^noo »ogMr-\o^\o©»n —«s»Afsgr*t
(N0Or.|w-iwi©(/-t©r"i©-«oor» ——'C*oo\o»t-
* <*osrt ^ p o\ \o ©rOnooo-M-wcKo
w>^©wir-\oc\poor*\o—fio —(NisFloSr-os —
-os.vp*«nvj^o>cs*oor-.-<NftQNNN*ffiQ-«
*-©—oovo©—*ioov»o>w-)
■4r-**lvOQ\«'>*T*"«*>©
-no-mNN»ooqrt——nfs ———— —(s —
—->OaoOoOQQafiMOOQOWWObou
i3
•?■
■ -J I -J •
I a-3 J=B .SSe.S.E.F.
& slaliglllllii
E
■36333 s-1
a "u■go^«E.So n B
Eg<0c c
11
0SZ>>>
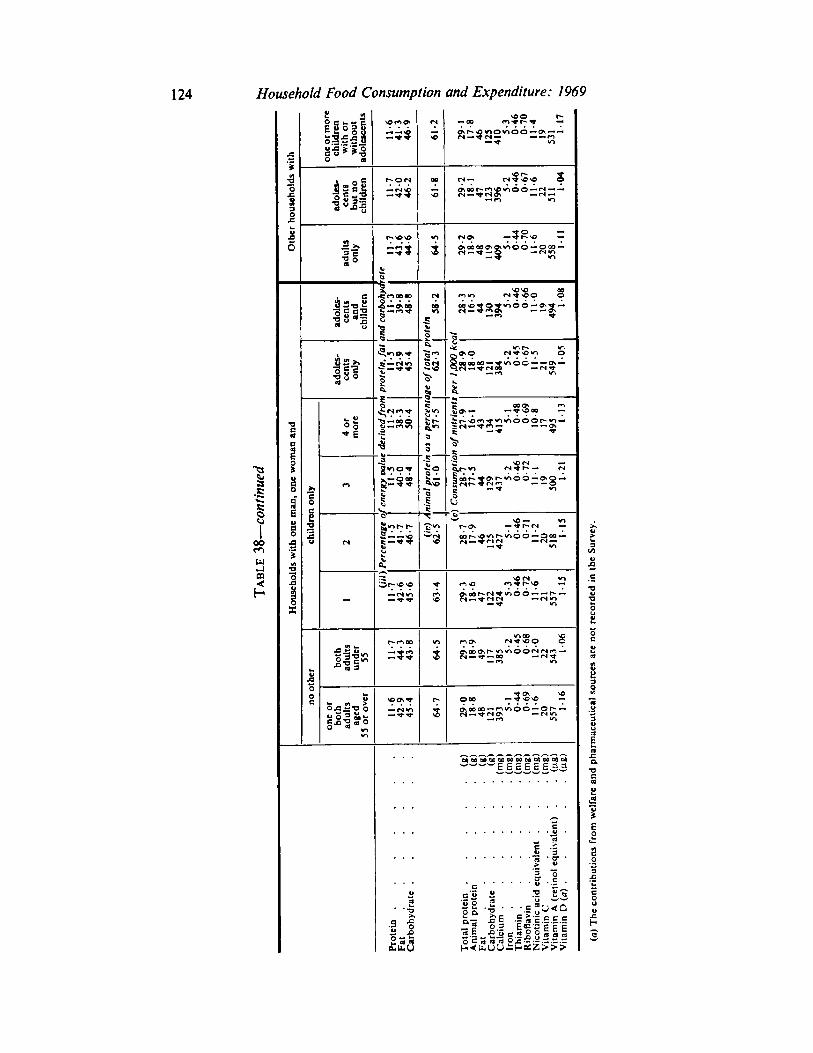
one
or
more
child
ren
wit
hor
wit
hout
29
-
1
17
-84
61
25
41
0 5-3
0-4
60
-70
11
-41
95
31 1
17
ad
ole
scents
CI
-2
11
-64
1-3
46
-9
Table
38
—co
nti
nued
Oth
er
house
hold
sw
ith
ad
ole
sce
nts
but
no
child
ren
11
-74
20
46
-2
61
-8
29
-21
8-1
47
12
33
96 5-2
0-4
60
-6
71
1-6
22
51
1 1-0
4
ad
ult
sonly U-7
43
.64
4-6
64
-5
29
-21
8-9
48
11
94
09 3
10
-44
0-
70
11
-62
05
58 1
-1
1
rate
ad
ole
sce
nts
and
child
ren
and
carb
ohyd
11
-33
9-8
48
-8
58
-2
28
-31
6-5
44
13
03
94 3-2
0-4
60
-66
11
01
94
94 1
08
'Ote
ln
a!
i pro
tein
,fa
t1
1-5
7geof
tota
l
p
62
-3
per
IfiO
Okc
28
-91
80
48
12
13
84 5-2
0-4
50
-67
11
-52
15
49 1
05
adole
sce
nts
only 42
-
9
43
-
4
House
hold
sw
ith
one
man,
one
wom
an
and
4
or
more
t deri
ved
fron
11
-23
8-3
50
-4
as
aperc
ent
57
-5
nof
nutr
ients
27
-91
6-1
43
13
44
13 5
10
-48
0-6
91
0-8
17
49
5 11
3
child
ren
only
3
f energ
yoalu
11
-34
0-0
48
-4
nim
al
pro
teii
61
0
) Consu
mpti
o2
8-7
77
-34
41
29
43
7 5-2
0-4
60
-7
21
11
19
50
0 1-
21
2
Perc
enta
ge
c
11
-34
1-7
46
-7 (f»M
62
-5-~
■(o
28
-71
7-9
46
12
54
27 5
10
-46
0-
71
11
-22
05
18 1
-1
5
1
(WO
11
-74
2-6
45
-6
63
-4
29
-31
8-6
47
12
24
24 5
-30
-46
0-7
21
1-6
21
55
7 MS
both
adult
sunder
55 11
-74
4-3
43
-8
64
-5
29
-31
8-9
49
11
73
85 5-2
0-4
50
-6
81
2-0
22
54
3 1-0
6
no
oth
er
one
or
both
ad
ult
sag
ed
53
or
over
11
-64
2-9
45
-4
64
-7
29
0I8
>
8
48
12
13
93 5-1
0-4
40
-69
11
62
05
57 1
16
Anim
al
pro
tein
.(g
)Fa
t(g
)
Nic
oti
nic
aci
deq
uiv
ale
nt
.
.
(mg
)V
itam
in
C
(mg
)V
itam
inA
(reti
nol
eq
uiv
ale
nt)
.
.
(ng
)
(a)
The
contr
ibuti
ons
from
welfare
and
pharm
ace
uti
cal
sourc
es
are
not
reco
rded
inth
eSurv
ey.
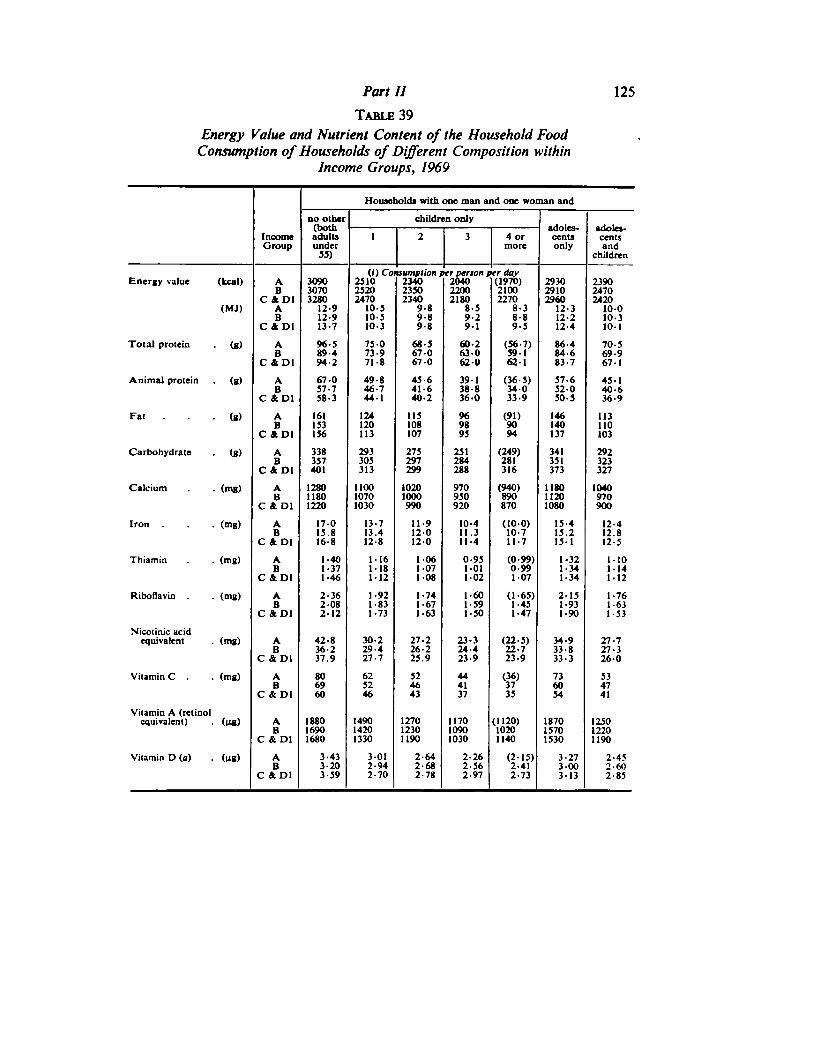
Part II 125
Table 39
Energy Value and Nutrient Content of the Household FoodConsumption of Households of Different Composition within
Income Groups, 1969
no other
Households with
children only
one man and one woman and
(both adolescentsonly
adolescentsand
children
IncomeGroup
adults 1 2 3 4 ormoreunder
Energy value (kcal)
(MJ)
35)
(I)Cot251023202470
sumption f*erperson per day(1970)21002270
8-38-89-5
A 3090 2340 2040 2930 2390B
C4D13070 2350 2200 2910 2470
A3280
12-912-913-7
10-52340
9-89-89-8
21808-59-29-1
296012-312-212-4
242010-010-310- 1
BC &D1
10-510-3
Total protein • (g) A 96-389-494-2
75 073-9
68-5670
60-2630620
(56-7)59-162-1
86-484-683-7
70-569-967-1
BC &D1 71-8 670
Animal protein (g) A 670 49-846-744-1
45-641-640-2
39-138-836-0
(36-5)34-033-9
57-6520
45-140-636-9C &D1
B 57-758-3 50-3
Fat (I) AB
161133136
124120113
115 96 (91)9094
146140137
113110103C &D1
108107
9895
Carbohydrate (g) A 338357401
293305313
275297299
251 (249)281316
341351
292
C4D1B 284
288 373323327
Calcium (mg) A 128011801220
110010701030
10201000990
970930920
(940)890870
11801120
1040970900C&D1
B1080
Iron (mg) A 17015.816-8
13-713.4128
11-912-012-0
10-411.311-4
(100)10-711-7
15-415.2151
12-412.812-5C&D1
B
Thiamin (mg) A 1-401-371-46
1161-18112
1-061071-08
0-951-011-02
(0-99)0-99107
1-321-341-34
MO1141-12C4D1
B
Riboflavin (mg) A 2-362-082- 12
1-921-831-73
1-741-671-63
1-601-591-50
(1-65)1-451-47
2-131-931-90
1-761-631-33
Nicotinic acidequivalent
C St.DlB
(mg) A 42-836-237.9
30-229-427-7
27-226-225.9
23-324-423-9
(22-5)22-723-9
34-933-833-3
27-727-326-0C&D1
B
Vitamin C . (mg) A 806960
625246
524643
444137
(36)3735
736034
534741
Vitamin A (retinolequivalent)
C &D1B
(ug) AB
188016901680
149014201330
127012301190
117010901030
(1120)10201140
187015701530
125012201190C &D1
Vitamin D (a) (t'8) A 3-433-203-59
3012-942-70
2-642-68
2-262-56
(2-15)2-412-73
3-27300313
2-452-602-85C 4D1
B2-78 2-97
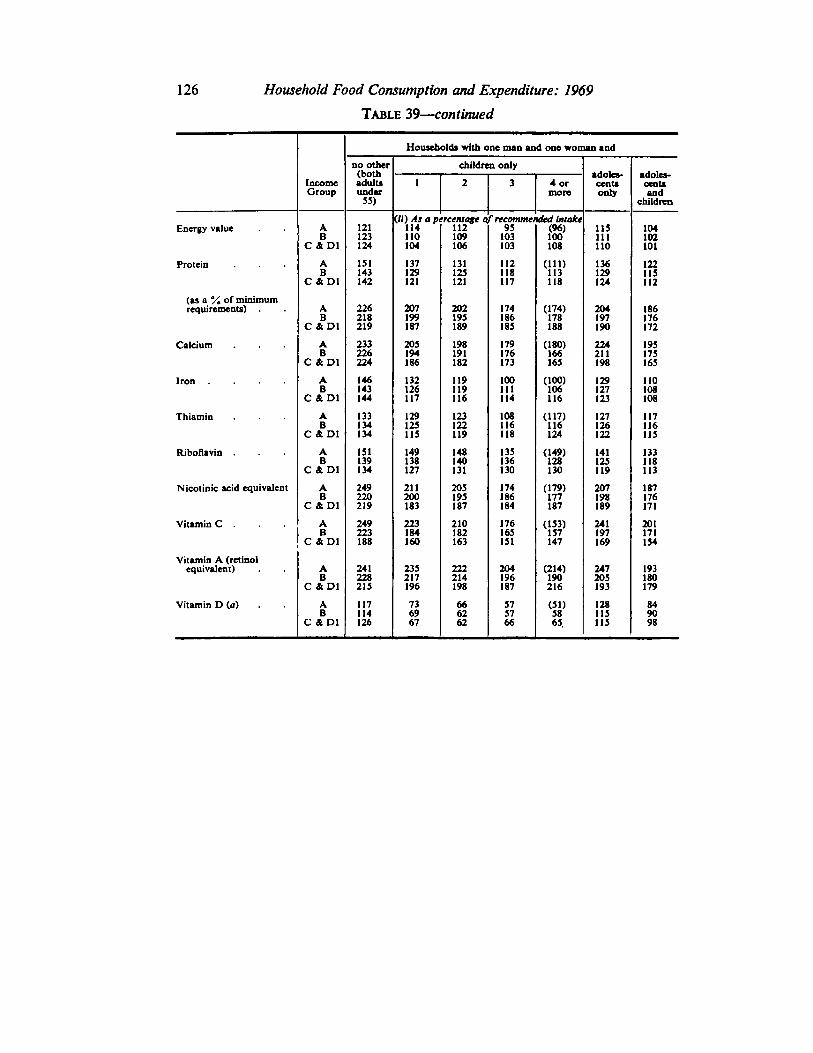
126 Household Food Consumption and Expenditure: 1969
Table 39—continued
no other
Households with one man and one woman and
children only(both adoles
centsonly
adolescentsand
children
IncomeGroup
adults 1 2 3 4 ormoreunder
35)
(if) Asap114110104
•rcentage o112109106
rrtcommei95
103103
idcd intake(96)100108
Energy value A 121123124
115111110
104102101C&D1
B
Protein A 131143142
137129121
131125121
112118117
(HI)113118
136129124
122115112C &D1
B
(as a V, of minimumrequirements) A
B226218219
207199187
202195189
174186185
(174)178188
204197190
186176172C &D1
Calcium AB
233226224
205194186
198191182
179176173
(180)166165
224211198
195175163C &D1
Iron .... A 146143
132126117
119119116
100HI114
(100)106116
129127123
110108108
BC &D1 144
Thiamin A 133134134
129123115
123122119
108116118
(117)116124
127126122
117116115C &D1
B
Riboflavin A 131139134
149138127
148140131
135136130
(149)128130
141125119
133118113C &D1
B
Nicotinic acid equivalent A 249220219
211 205195
174186184
(179)177187
207198189
187176171C &D1
B 200183 187
Vitamin C . A 249223188
223184160
210 176165151
(153)157147
241197169
201171154
BC &D1
182163
Vitamin A (retinolequivalent) A 241
228215
235217196
222214198
204196187
(214)190216
247205193
193180179
BC&D1
Vitamin D (o) A 117114126
736967
666262
575766
(31)5865
128USUS
849098C&D1
B
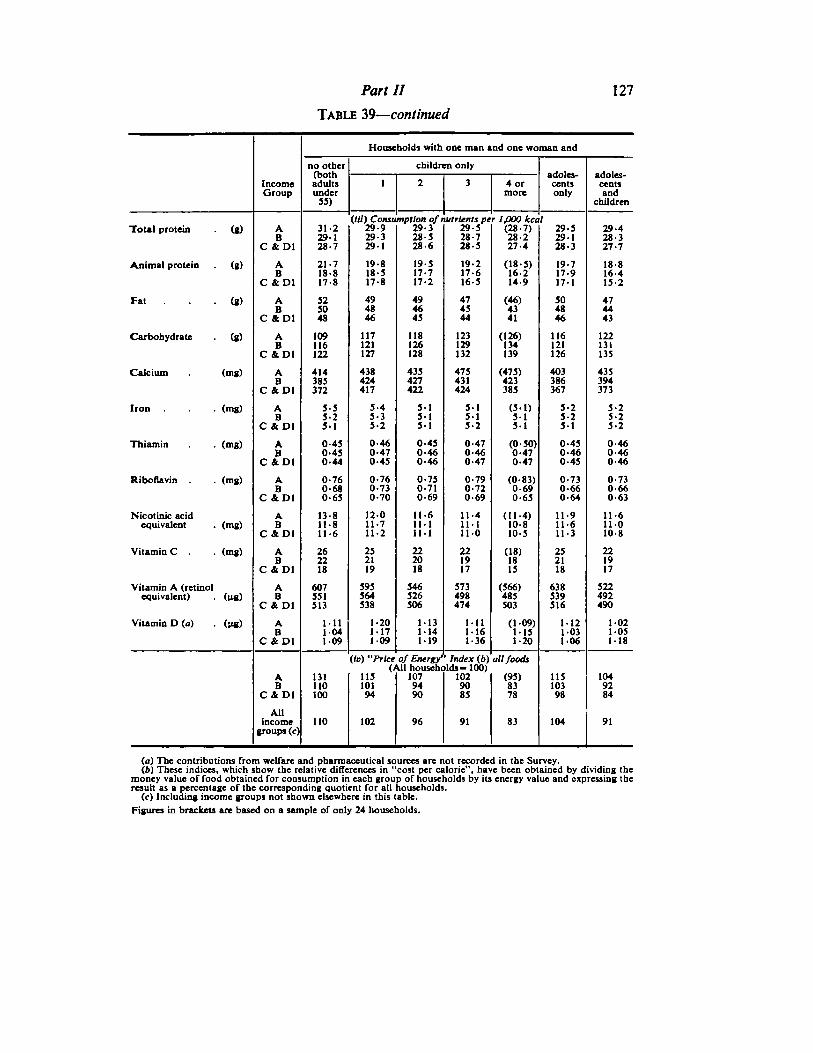
Part II 127
Table 39—continued
no other(bothaduluunder
55)
Households with one man a
children only
nd one wo man and
IncomeGroup
2 3 4 ormore
adolescentsonly
adolescentsand
children
(III) Consumption oft utrients per IfiOO kca•ITotal protein (g) A 31-2 29-9 29-3 29-5 (28-7) 29-5 29-4
B 29-1 29-3 285 28-7 28-2 29-1 28-3C &D1 28-7 29-1 286 285 27-4 28-3 27-7
Animal protein (*) A 21-7 19-8 19-5 19-2 (18-5) 19-7 18-8B 18-8 18-5 17-7 17-6 16-2 17-9 16-4
c &D1 17-8 17-8 17-2 16-5 14-9 171 15-2
Fat . . . (g) A 52 49 49 47 (46) SO 47B 50 48 46 45 43 48 44
c &D1 48 46 45 44 41 46 43
Carbohydrate (g) A 109 117 118 123 (126) 116 122B 116 121 126 129 134 121 131
c &D1 122 127 128 132 139 126 135
Calcium (mg) A 414 438 435 475 (475) 403 435B 385 424 427 431 423 386 394
c &D1 372 417 422 424 385 367 373
Iron (mg) A 5-5 5-4 51 5-1 (5-1) 3-2 S-2B 5-2 5-3 5-1 51 5-1 5-2 5-2
c & Dl 5-1 5-2 51 5-2 5-1 S-l S-2
Thiamin . . (mg) A 0-45 0-46 0-45 0-47 (0-50) 0-45 0-46B 0-45 0-47 0-46 0-46 0-47 0-46 0-46
c &D1 0-44 0-45 046 0-47 0-47 0-45 0-46
Riboflavin . (mg) A 0-76 0-76 0-75 0-79 (0-83) 0-73 0-73B 0-68 0-73 0-71 0-72 0-69 0-66 0-66
c &D1 0-65 0-70 0-69 0-69 0-65 0-64 0-63
Nicotinic acid A 13-8 12-0 11-6 11-4 (11-4) 11-9 11-6equivalent (mg) B 11-8 11-7 11-1 11-1 10-8 11-6 11-0
c &D1 11-6 11-2 11-1 110 10-5 no 10-8
Vitamin C . (mg) A 26 25 22 22 (18) 25 22B 22 21 20 19 18 21 19
c &D1 18 19 18 17 IS 18 17
Vitamin A (retinol A 607 595 546 573 (566) 638 522equivalent) (Hg) B 551 564 526 498 485 539 492
c &D1 513 538 506 474 503 516 490
Vitamin D (o) (ug) A 111 1-20 113 111 (1-09) 1-12 1-02B 104 MT 1-14 1-16 115 103 1-05
c 4D1 109 I 09 1-19 1-36 1-20 106 1-18
«t>)"Price(/
of EnergyUl househc
107
1Index (b)>Ids- 100)
102
all foods
AB
131110100
11510194
(95)8378
11510398
10494 90 92
84C &D1 90 85
Allincome
groups (c)110 102 96 91 83 104 91
(a) The contributions from welfare and pharmaceutical sources are not recorded in the Survey.(b) These indices, which show the relative differences in "cost per calorie", have been obtained by dividing the
money value of food obtained for consumption in each group of households by its energy value and expressing theresult as a percentage of the corresponding quotient for all households.
(c) Including income groups not shown elsewhere in this table.
Figures in brackets are based on a sample of only 24 households.
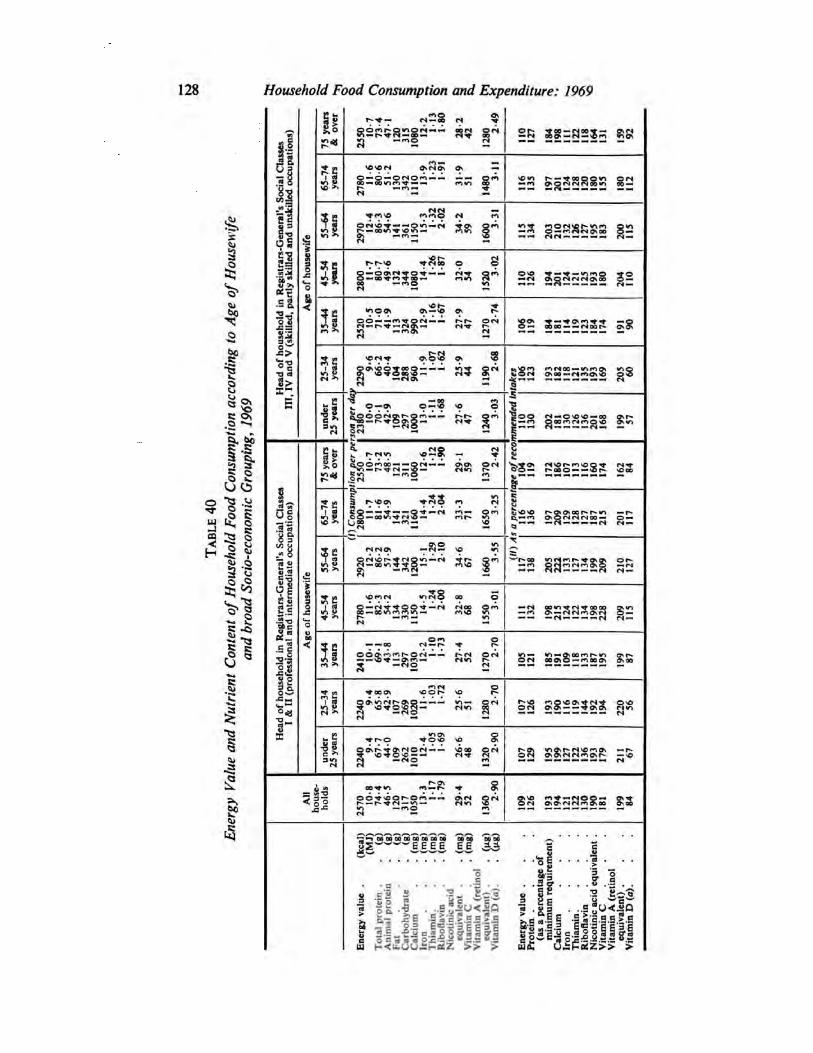
Table
40
Energ
yV
alu
eand
Nutr
ient
Conte
nt
of
House
hold
Food
Consu
mpti
on
acc
ord
ing
toA
ge
of
House
wife
and
bro
ad
Soci
o-e
conom
icG
roupin
g,
19
69
Head
of
house
hold
inR
eg
istr
ars
-Genera
l'sS
oci
al
Cla
sses
III,
IVand
V
(ski
lled
,p
art
lysk
illed
and
unsk
illed
occ
up
ati
ons)
75
years
&
over
25
50 10
-77
3-4
47
-
1
12
03
15
10
80
12
-21
13
18
0
28
-24
2
12
80 2-4
9
11
01
27
18
41
98
11
11
22
11
81
64
13
1
15
99
2
65
-74
years
27
80 11
-68
0.
6
51
-21
30
34
21
11
01
3-9
1-2
3 I -91
31
-95
1
14
80 3-1
1
11
61
35
19
72
01
12
41
28
12
01
80
15
5
18
01
12
Ag
eof
house
wife
55
-64
years
29
70 12
-48
6-3
54
-61
41
36
11
15
01
5-3
1-3
2
2
02
34
-23
9
16
00 3-3
1
11
51
34
20
32
10
13
21
26
12
71
95
18
3
20
01
15
45
-54
yean
28
00 11
-78
0-7
49
-61
32
34
41
08
01
4-4
1-2
61
-87
32
05
4
15
20 3-0
2
11
01
26
19
42
01
12
41
21
12
51
93
18
0
20
4no
35
^4
years
25
20 10
-57
10
41
-91
13
32
49
90 12
-91
16
1-6
7
27
-94
7
12
70 2-7
4
10
61
19
18
41
81
11
41
19
12
31
84
17
4
19
19
0
25
-34
years
22
90 9-6
66
-24
0-4
10
42
88
96
0 11
-91
07
16
2
25
-94
4
11
90 26
8
take
s1
06
12
3
19
31
82
11
81
21
13
51
93
16
9
20
56
0
y
nm
ended
it
under
25
years
■so
n per
da
10
-07
0-
1
42
-9
13
01
11
16
8
27
-6 3
03
23
80
10
92
97
10
00
47
12
40
11
01
30
20
21
81
13
01
26
13
62
01
16
8
19
95
7
75
years
&
over
t ion
per
pc
10
-77
3-2
48
-5
12
61
12
1-9
0
29
-1
2-4
2
age
ofr
eco
25
50
12
13
11
10
60
59
13
70
10
41
19
17
21
86
10
71
13
11
61
60
17
4
16
28
4
Head
of
house
hold
inR
egis
trars
-Genera
l'sSoci
al
Cla
sse
I &II
(pro
fess
ional
and
inte
rmedia
teocc
upati
ons)
63
-74
years
')
Consu
mp
11
-78
1-6
54
-9
14
41
-24
20
4
33
-3
3-2
5
sa
perc
ent
28
00
14
13
21
11
60
71
16
50
11
61
36
19
72
09
12
91
28
12
71
87
21
5
20
11
17
55
-64
years
(
12
-28
6-2
57
-9
15
11
-29
2-1
0
34
-6
3-5
5
UD
A
Age
of
house
wife
45
-54
years
29
20
11
-68
2-3
54
-21
44
34
21
20
01
4-5
1-2
42
00
32
-86
7
16
60
30
1
11
71
38
20
52
22
13
31
27
13
41
99
20
9
21
01
27
35
-44
years
27
80
10
-16
9-
1
43
-81
34
33
01
15
01
2-2
11
0
1 -73
27
-46
8
15
50
2-7
0
11
11
32
19
82
15
12
41
22
13
41
98
22
8
20
91
15
25
-34
years
24
10
9-4
65
-84
2-9
11
32
97
10
30
11
61
03
1-7
2
25
-65
2
12
70
2-7
0
10
51
21
18
51
91
10
91
18
13
31
87
19
5
19
98
7
und
er
25
years
22
40
9-4
67
-74
40
10
72
69
10
20
12
-41
05
1-6
9
26
-65
1
12
80
2-9
0
10
71
26
19
31
90
11
61
19
14
41
92
19
4
22
05
6
22
40
10
92
62
10
10
48
13
20
10
71
29
19
51
99
12
71
22
13
61
93
17
9
21
16
7
All
house
hold
s
25
70 10
.8
74
-44
6-5
12
03
17
10
50
13
-31
17
1-7
9
29
-45
2
13
60 2-9
0
10
91
26
19
31
94
12
11
22
13
01
90
18
1
19
98
4
Energ
yvalu
e
.
(kca
l)(M
J)Tota
lp
rote
in
.
.
(g)
Anim
al
pro
tein
.
(g)
Fat
(g)
Carb
ohyd
rate
(g)
Calc
ium
.
(mg
)Ir
on
.
(mg
)Thia
min
.
.
(mg
)R
iboflavin
.
(mg
)
eq
uiv
ale
nt
.
.
(mg
)V
itam
in
C
.
.
(mg
)
eq
uiv
ale
nt)
.
.
(pig
)V
itam
inD
(a).
.
(ng
)
Pro
tein
....
min
imum
req
uir
em
ent)
Iron
....
Nic
oti
nic
aci
deq
uiv
ale
nt
.
Nic
oti
nic
aci
d
Vit
am
inA
(reti
nol
Energ
yvalu
e
.
(as
a
perc
enta
ge
of
Vit
am
inA
(reti
nol
eq
uiv
ale
nt)
.
Vit
am
inD
(a).
Calc
ium
Thia
min
.R
iboflavin
Vit
am
in
C

Part II 129
gj it
59
||ill2- I
a;
IjS3
s>
IS i
=3
. - >P
cao
13§S H
9
OS
X 1
litI W l
Ii c >»
H
H">—<N—N«
—rub—
=3«
Q——
S —a.
■5
^-m^C—
8«
3i •
go>rt 00 5 r-
aoor- m<n ©O =s s°
5crso
(Msooo-nmdo»n—
^r^oo =8 3-
= 2
in
«vofS \D —<*sooovcvjos—mo©
- S
oor«»\pso©moo —os 00—
>oo »n r-•noo =s a-
—CI OS©
•3-Os o\ osr- —in ©©
00 H—m O —>—(S r-
o>osooosso«noo =S 8-
—— so—
in rs
- tj-rs >o
OS m—cs os——rs 00
=3$ 000r-ci r- v ~© ———fS m
■ B •
31 2
•E .9 5c;.= .E_c _s Pc; 3 c p
ll si? Sli^srll •|E
>

Tables of Average Consumption, Expenditure,
Prices and Nutrition relating to All Households
in the National Food Survey Sample, 1970
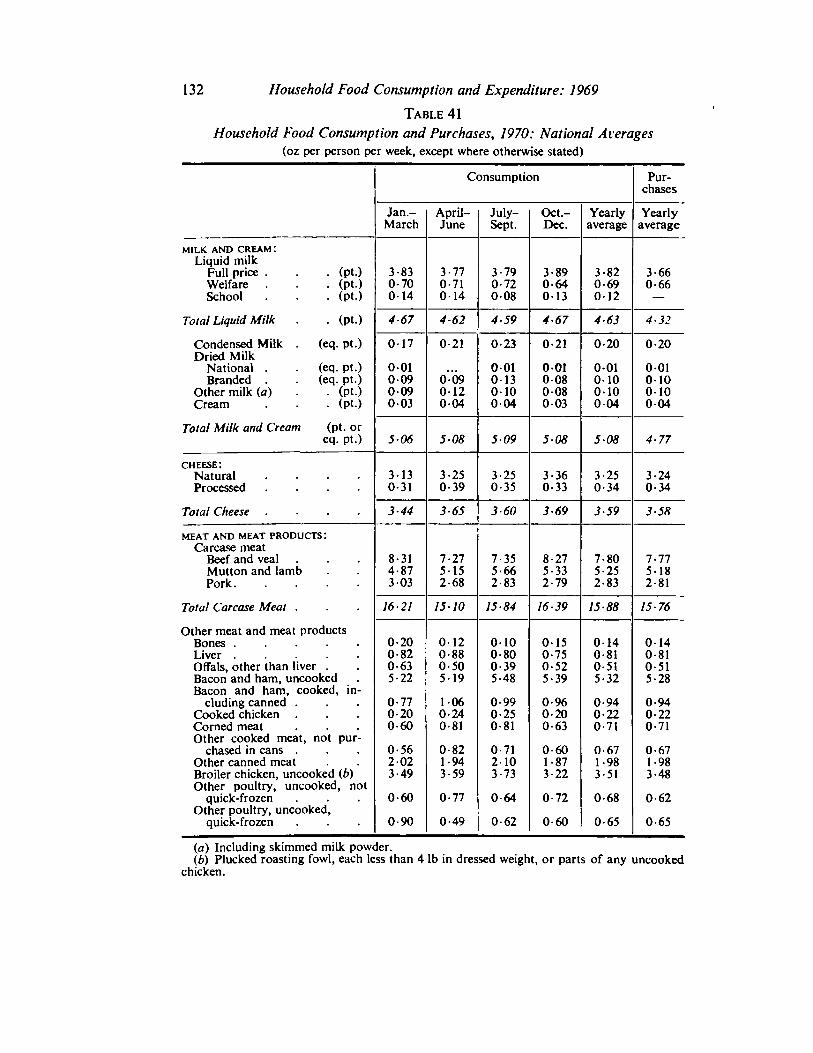
132 Household Food Consumption and Expenditure: 1969
Table 41
Household Food Consumption and Purchases, 1970: National Averages
(oz per person per week, except where otherwise stated)
Consumption Purchases
Jan- April- July- Oct- Yearly Yearly
MILK AND CREAM:
March June Sept. Dec. average average
Liquid milkFull price . . (pt.) 3-83 3-77 3-79 3-89 3-82 3-66Welfare . (pt.) 0-70 0-71 0-72 0-64 0-69 0-66School . . . (pt.) 014 014 0-08 013 012 —
Total Liquid Milk . . (pt.) 4-67 4-62 4-59 4-67 4-63 432
Condensed Milk . (eq. pt.) 017 0-21 0-23 0-21 0-20 0-20Dried Milk
National . (eq. pt.) 001 001 001 0-01 001Branded . . (eq. pt.) 009 0-09 013 008 010 010
Other milk (a) . (pt.) 009 012 010 0 08 010 010Cream . . (pt.) 003 004 004 003 004 004
Total Milk and Cream (pt. oreq. pt.) 506 5-08 509 5-08 508 4-77
cheese:Natural .... 313 3-25 3-25 3-36 3-25 3-24Processed .... 0-31 0-39 0-35 0-33 0-34 0-34
Total Cheese .... 3-44 365 3-60 369 3-59 3-58
MEAT AND MEAT PRODUCTS:Carcase meat
Beef and veal 8-31 7-27 7-35 8-27 7-80 7-77Mutton and lamb 4-87 515 5-66 5-33 5-25 5-18Pork 3 03 2-68 2-83 2-79 2-83 2-81
Total Carcase Meat . 16-21 15 10 15 84 16 39 75-85 15-76
Other meat and meat productsBones 0-20 012 010 015 014 0-14Liver 0-82 0-88 0-80 0-75 0-81 0 81
Offals, other than liver . 0-63 0-50 0-39 0-52 0-51 0-51Bacon and ham, uncooked 5-22 519 5-48 5-39 5-32 5-28Bacon and ham, cooked, in
cluding canned . 0-77 106 0-99 0-96 0-94 0-94Cooked chicken 0-20 0-24 0-25 0-20 0-22 0-22Corned meat 0-60 0-81 0-81 0-63 0-71 0-71Other cooked meat, not pur
chased in cans . 0-56 0-82 0-71 0-60 0-67 0-67Other canned meat 2-02 1-94 210 1-87 1-98 1-98Broiler chicken, uncooked (b) 3-49 3-59 3-73 3-22 3-51 3-48Other poultry, uncooked, not
quick-frozen 0-60 0-77 0-64 0-72 0-68 0-62Other poultry, uncooked,
quick-frozen 0-90 0-49 0-62 0-60 0-65 0-65
(a) Including skimmed milk powder.
(b) Plucked roasting fowl, each less than 4 lb in dressed weight, or parts of any uncookedchicken.

Part II 133
Table 41 —continued
(oz per person per week, except where otherwise stated)
Consumption
1970
Purchases
Jan- April- July- Oct- Yearly Yearly
Other meat and meat products —
March June Sept. Dec. average average
contd.Rabbit, game and other meat . 013 010 009 018 012 010Sausages, uncooked, pork 2-44 2-32 2-21 2-47 2-36 2-36Sausages, uncooked, beef 1-36 1-29 1-43 1-42 1-38 1-37Meat pies and sausage rolls,
ready-to-eat 0-82 0-77 0-74 0-75 0-77 0-77Quick-frozen meat (other than
uncooked poultry) and quick-frozen meat products . 0-59 0-49 0-61 0-52 0-55 0-55
Other meat products 2-24 2-38 2-26 2-44 2-33 2-32
Total Other Meat and Meat Products ..... 23 57 23-75 23-96 23-36 23-65 23-48
Total Meat and Meat Products . 39-78 38-85 39-80 39-75 39-53 39-24
fish:White, filleted, fresh 114 0-99 0-99 1-17 1-07 107White, unfilleted, fresh . 0-72 066 0-70 0-64 0-68 0-66White, uncooked, quick-frozen 0-33 0-34 0-34 0-29 0-32 0-32Herrings, filleted, fresh . 002 002 001 001 001Herrings, unfilleted, fresh 0 13 005 006 011 009 009Fat, fresh, other than herrings 011 012 013 008 011 0-10White processed 0-37 0-27 0-25 0-29 0-30 0-29Fat, processed, filleted . 008 007 007 006 007 007Fat, processed, unfilleted 015 012 017 016 015 015Shell 005 004 003 006 004 004Cooked .... 0-91 111 108 0-95 101 101Salmon, canned 0-30 0-38 0-39 0-44 0-38 0-38Other canned or bottled fish . 0-28 0-36 0-30 0-30 0-31 0-31Fish products, not quick-frozen 013 016 016 013 014 014Quick-frozen fish products, and
quick-frozen fish not specified above 0-64 0-74 0-66 0-63 0-67 0-67
Total Fish .... 5-34 5-42 5-36 5-31 5-35 5-31
eggs .... (no.) 4-54 4-79 4-70 4-63 4-66 4-44
fats:Butter 5-72 5-92 5-92 6-39 5-99 5-98Margarine .... 2-87 2-88 2-86 2-84 2-86 2-86Lard and compound cooking
fat 2-23 215 2-24 2-23 2-21 2-21Suet 014 008 007 0-20 012 012Vegetable and salad oils (fl. oz.) 0-61 0-58 0-53 0-77 0-62 0-62All other fats 015 017 013 015 015 015
Total Fats .... 11-72 11-79 11-76 12-58 11-95 11-94
SUGAR AND PRESERVES :
Sugar 16-32 16-82 17-61 16-99 16-94 16-94Jams, jellies and fruit curds . 1-30 1-34 1-32 1-26 1-30 1 -23Marmalade .... 0-91 0-77 0-86 0-86 0-85 0-85Syrup, treacle and honey 0-44 0-41 0-39 0-43 0-42 0-42
Total Sugar and Preserves . 18-97 19-34 20-19 19-55 19-51 19-44
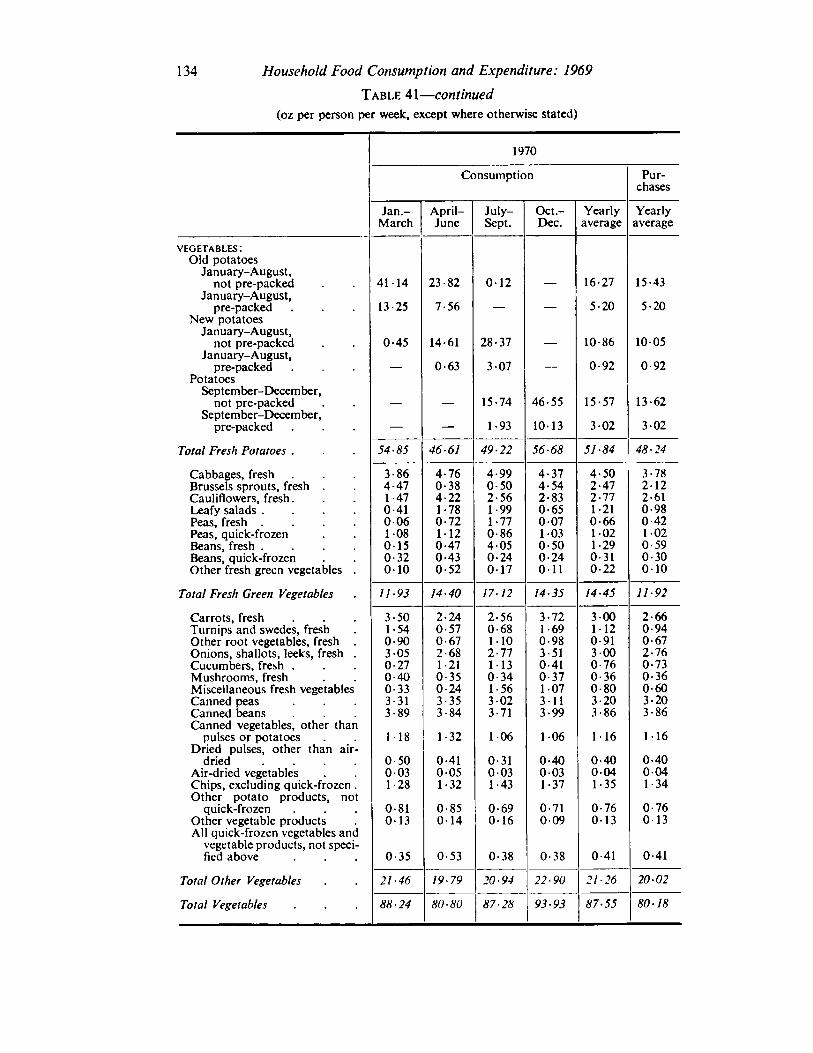
134 Household Food Consumption and Expenditure: 1969
Table 41 — continued
(oz per person per week, except where otherwise stated)
Consumption
1970
Purchases
Jan- April- July- Oct- Yearly Yearly
vegetables:
March June Sept. Dec. average average
Old potatoesJanuary- August ,
not pre-packed 41 14 23-82 012 — 16-27 15-43January-August,
pre-packed 13-25 7-56 — — 5-20 5-20New potatoes
January-August,not pre-packed 0-45 14-61 28-37 — 10-86 10 05
January-August,pre-packed — 0-63 307 — 0-92 0-92
PotatoesSeptember-December,
September-December,not pre-packed — — 15-74 46-55 15-57 13-62
pre-packed — — 1-93 1013 302 3 02
Total Fresh Potatoes . 54-85 46-61 49-22 56-68 51-84 48-24
Cabbages, fresh 3-86 4-76 4-99 4-37 4-50 3-78Brussels sprouts, fresh 4-47 0-38 0-50 4-54 2-47 212Cauliflowers, fresh . 1-47 4-22 2-56 2-83 2-77 2-61Leafy salads .... 0-41 1-78 1-99 0-65 1-21 0-98Peas, fresh .... 006 0-72 1-77 007 0-66 0-42Peas, quick-frozen 108 1-12 0-86 103 102 102Beans, fresh .... 015 0-47 405 0-50 1-29 0-59Beans, quick-frozen 0-32 0-43 0-24 0-24 0-31 0-30Other fresh green vegetables . 010 0-52 017 011 0-22 0-10
Total Fresh Green Vegetables 11-93 14-40 17-12 14-35 14-45 11-92
Carrots, fresh 3-50 2-24 2-56 3-72 300 2-66Turnips and swedes, fresh 1-54 0-57 0-68 1-69 112 0-94Other root vegetables, fresh 0-90 0-67 110 0-98 0-91 0-67Onions, shallots, leeks, fresh . 305 2-68 2-77 3-51 3-00 2-76Cucumbers, fresh . 0-27 1-21 113 0-41 0-76 0-73Mushrooms, fresh 0-40 0-35 0-34 0-37 0-36 0-36Miscellaneous fresh vegetables 0-33 0-24 1-56 107 0-80 0-60Canned peas 3-31 3-35 3 02 311 3-20 3-20Canned beans 3-89 3-84 3-71 3-99 3-86 3-86Canned vegetables, other than
pulses or potatoes 118 1-32 1-06 106 1-16 1-16Dried pulses, other than air-
dried .... 0-50 0-41 0-31 0-40 0-40 0-40Air-dried vegetables 003 005 0-03 003 0-04 004Chips, excluding quick-frozen . 1-28 1-32 1-43 1-37 1-35 134Other potato products, not
quick-frozen 0-81 0-85 0-69 0-71 0-76 0-76Other vegetable products 013 014 016 0-09 013 013All quick-frozen vegetables and
vegetable products, not specified above 035 0-53 0-38 0-38 0-41 0-41
Total Other Vegetables 21-46 19-79 20-94 22-90 21-26 20-02
Total Vegetables 88-24 80-80 87-28 93-93 87-55 80- 18
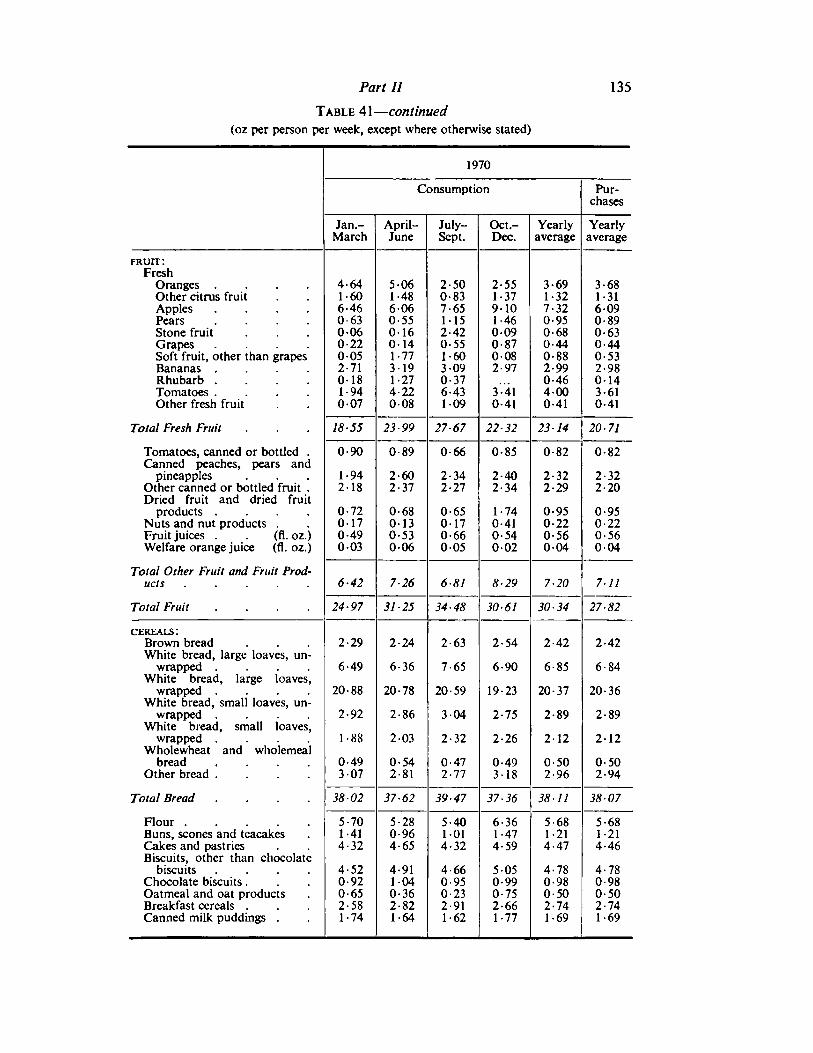
Part 11 135
Table 41 — continued
(oz per person per week, except where otherwise stated)
1970
Consumption Purchases
Jan- April- July- Oct- Yearly Yearly
fruit:
March June Sept. Dec. average average
FreshOranges .... 4 64 5 06 2-50 2-55 3 69 3-68Other citrus fruit 1 60 1 48 0-83 1-37 1 32 1-31Apples .... 6 46 6 06 7-65 910 7 32 6-09Pears .... 0 63 0 55 115 1-46 0 95 0-89Stone fruit 0 06 0 16 2-42 009 0 68 0-63Grapes .... 0 22 0 14 0-55 0-87 0 44 0-44Soft fruit, other than grapes 0 05 1 77 1-60 008 0 88 0-53Bananas .... 2 71 3 19 309 2-97 2 99 2-98Rhubarb .... 0 18 1 27 0-37 0 46 014Tomatoes .... 1 94 4 22 6-43 3-41 4 00 3-61Other fresh fruit 0 07 0 08 109 0-41 0 41 0-41
Total Fresh Fruit 18 55 23 99 27-67 22-32 23 14 20-71
Tomatoes, canned or bottled . 0 90 0 89 0-66 0-85 0 82 0-82Canned peaches, pears and
pineapples 1 94 2 60 2-34 2-40 2 32 2-32Other canned or bottled fruit . 2 18 2 37 2-27 2-34 2 29 2-20Dried fruit and dried fruit
products .... 0 72 0 68 0-65 1-74 0 95 0-95Nuts and nut products . 0 17 0 13 017 0-41 0 22 0-22Fruit juices . (fl. oz.) 0 49 0 53 0-66 0-54 0 56 0-56Welfare orange juice (fl. oz.) 0 03 0 06 005 002 0 04 004
Total Other Fruit and Fruit Products 6 42 7 26 6-81 8-29 7 20 711
Total Fruit .... 24 97 31 25 34-48 30-61 30 34 27-82
cereals:Brown bread 2 29 2 24 2-63 2-54 2 42 2-42White bread, large loaves, un
wrapped .... 6 49 6 36 7-65 6-90 6 85 6-84White bread, large loaves,
wrapped .... 20 88 20 78 20-59 19-23 20 37 20-36White bread, small loaves, un
wrapped .... 2 92 2 86 3-04 2-75 2 89 2-89White bread, small loaves,
wrapped .... 1 88 2 03 2-32 2-26 2 12 2-12Wholewheat and wholemeal
bread .... 0 49 0 54 0-47 0-49 0 50 0-50Other bread .... 3 07 2 81 2-77 3-18 2 96 2-94
Total Bread .... 38 02 37 62 39-47 37-36 38 11 38-07
Flour 5 70 5 28 5-40 6-36 5 68 5-68Buns, scones and teacakes 1 41 0 96 101 1-47 1 21 1-21Cakes and pastries 4 32 4 65 4-32 4-59 4 47 4-46Biscuits, other than chocolate
biscuits .... 4 52 4 91 4-66 505 4 78 4-78Chocolate biscuits . 0 92 1 04 0-95 0-99 0 98 0-98Oatmeal and oat products 0 65 0 36 0-23 0-75 0 50 0-50Breakfast cereals . 2 58 2 82 2-91 2-66 2 74 2-74Canned milk puddings . 1 74 1 64 1-62 1-77 1 69 1-69
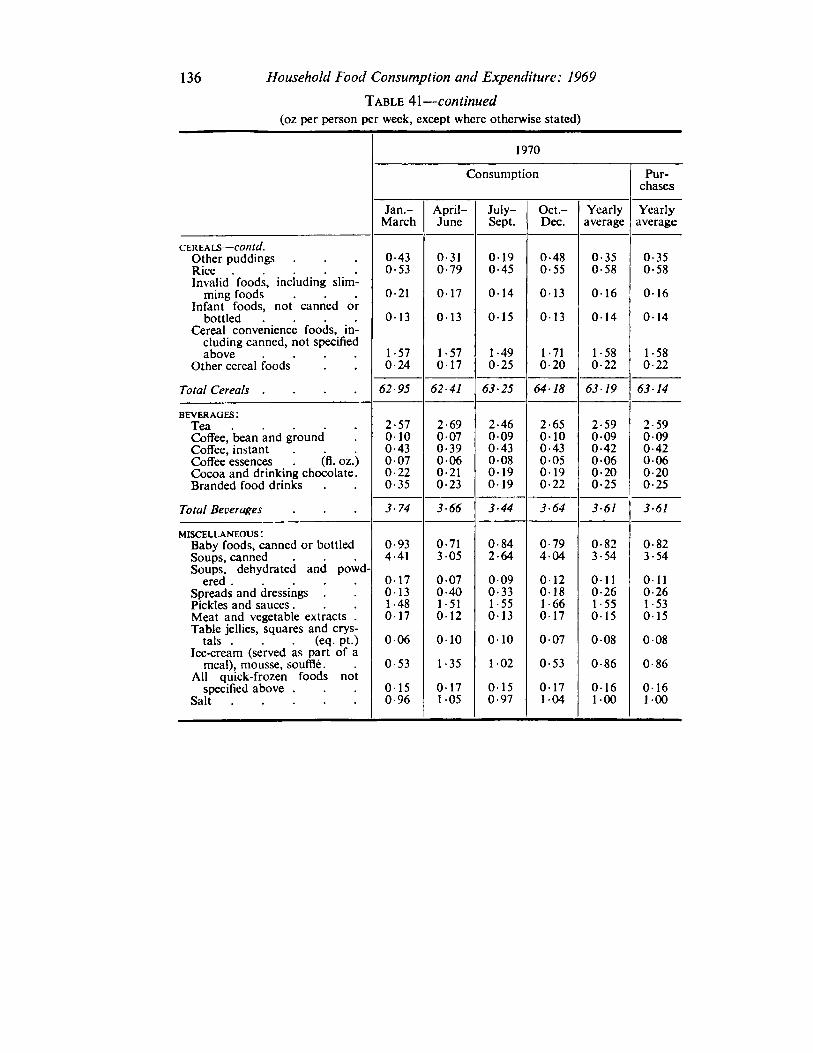
136 Household Food Consumption and Expenditure: 1969
Table 41 — continued
(oz per person per week, except where otherwise stated)
Consumption
1970
Purchases
Jan- April- July- Oct.- Yearly Yearly
CEREALS— COntd.
March June Sept. Dec. average average
Other puddings 0-43 0-31 019 0-48 0-35 0-35Rice 0-53 0-79 0-45 0-55 0-58 0-58Invalid foods, including slim
ming foods 0-21 017 014 013 016 016Infant foods, not canned or
bottled .... 013 013 015 013 014 014Cereal convenience foods, in
cluding canned, not specifiedabove .... 1-57 1-57 1-49 1-71 1-58 1-58
Other cereal foods 0-24 017 0-25 0-20 0-22 0-22
Total Cereals .... 62-95 62-41 63 25 64-18 63 19 63 14
beverages:
Tea 2-57 2-69 2-46 2-65 2-59 2-59Coffee, bean and ground 010 007 009 010 009 009Coffee, instant 0-43 0-39 0-43 0-43 0-42 0-42Coffee essences . (fl. oz.) 007 006 008 005 006 006Cocoa and drinking chocolate. 0-22 0-21 019 019 0-20 0-20Branded food drinks 0-35 0-23 019 0-22 0-25 0-25
Total Beverages 3-74 3-66 3-44 364 361 3-61
miscellaneous:Baby foods, canned or bottled 0-93 0-71 0-84 0-79 0-82 0-82Soups, canned 4-41 3 05 2-64 404 3-54 3-54Soups, dehydrated and powd
ered 017 007 009 012 011 011Spreads and dressings . 013 0-40 0-33 018 0-26 0-26Pickles and sauces . 1-48 1-51 1-55 1-66 1-55 1-53Meat and vegetable extracts . 017 012 013 017 015 015Table jellies, squares and crys
tals . . . (eq. pt.) 006 010 010 007 008 008Ice-cream (served as part of a
meal), mousse, souffle . 0-53 1-35 102 0-53 0-86 0-86All quick-frozen foods not
specified above . 015 017 015 017 016 0-16Salt 0-96 105 0-97 104 100 100
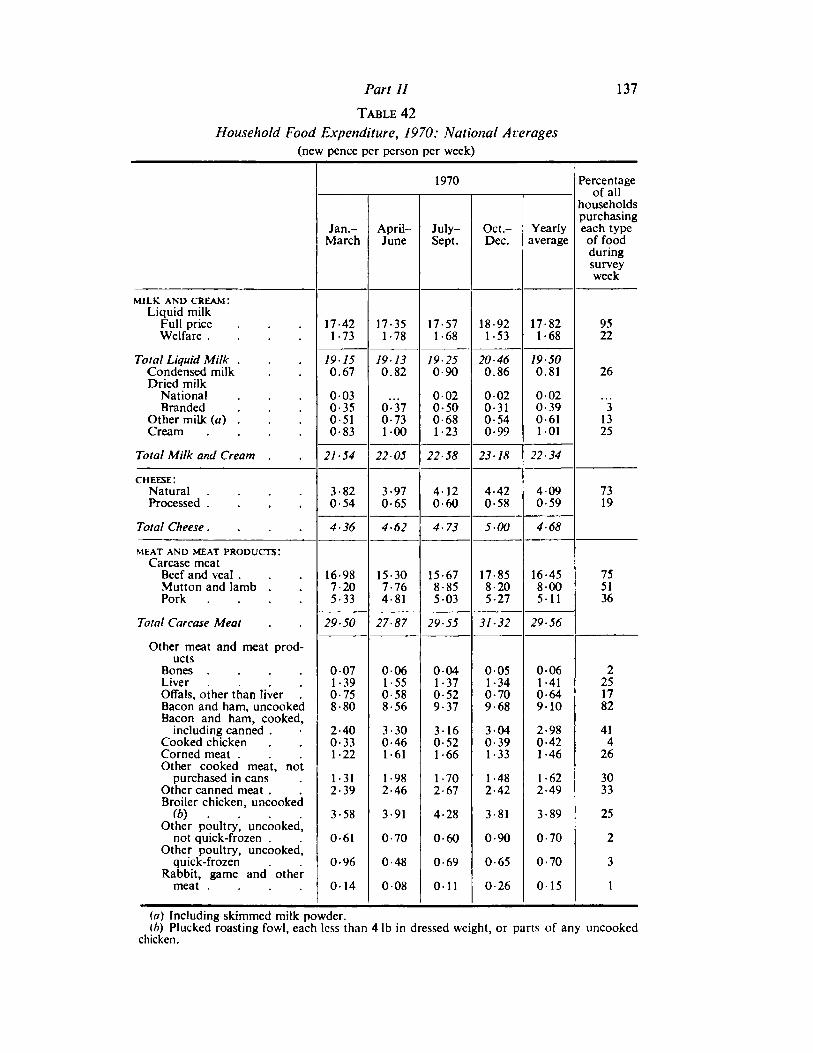
Part II 137
Table 42
Household Food Expenditure, 1970: National Averages
(new pence per person per week)
1970 Percentageof all
householdspurchasing
Jan- April- July- Oct- Yearly each type
MILK AND CREAM:
March June Sept. Dec. average of foodduringsurveyweek
Liquid milkFull price 17-42 17-35 17-57 18-92 17-82 95
Welfare.... 1-73 1-78 1-68 1-53 1-68 22
Total Liquid Milk . 19-15 19 13 19-25 20-46 19-50Condensed milk 0.67 0.82 0-90 0.86 0.81 26Dried milk
National 003 002 002 002Branded 0-35 0-37 0-50 0-31 0-39 3
Other milk (a) . 0-51 0-73 0-68 0-54 0-61 13
Cream .... 0-83 100 1-23 0-99 101 25
Total Milk and Cream . 21-54 22 05 22-58 23-18 22-34
cheese:Natural .... 3-82 3-97 412 4-42 409 73
Processed .... 0-54 0-65 0-60 0-58 0-59 19
Total Cheese.... 4-36 4-62 4-73 5-00 4-68
MEAT AND MEAT PRODUCTS:Carcase meat
Beef and veal . 16-98 15-30 15-67 17-85 16-45 75Mutton and lamb . 7-20 7-76 8-85 8-20 800 51
Pork .... 5-33 4-81 503 5-27 511 36
Total Carcase Meat 29-50 27-87 29-55 31-32 29-56
Other meat and meat products
Bones .... 007 006 004 005 0-06 2Liver .... 1-39 1-55 1-37 1-34 1-41 25Offals, other than liver 0-75 0-58 0-52 0-70 0-64 17
Bacon and ham, uncooked 8-80 8-56 9-37 9-68 910 82Bacon and ham, cooked,
including canned . 2-40 3-30 316 304 2-98 41
Cooked chicken 0-33 0-46 0-52 0-39 0-42 4Corned meat . 1-22 1-61 1-66 1-33 1-46 26Other cooked meat, not
purchased in cans 1-31 1-98 1-70 1-48 1-62 30Other canned meat . 2-39 2-46 2-67 2-42 2-49 33
Broiler chicken, uncooked
(b) . 3-58 3-91 4-28 3 81 3-89 25Other poultry, uncooked,
not quick-frozen . 0-61 0-70 0-60 0-90 0-70 2
Other poultry, uncooked,quick-frozen 0-96 0-48 0-69 0-65 0-70 3
Rabbit, game and othermeat .... 014 008 0-11 0-26 015 1
(a) Including skimmed milk powder.(b) Plucked roasting fowl, each less than 4 lb in dressed weight, or parts of any uncooked
chicken.

138 Household Food Consumption and Expenditure: 1969
Table 42—continued
(new pence per person per week)
1970 Percentage
Jan-March
April-June
July-Sept.
Oct-Dec.
Yearlyaverage
of allhouseholdspurchasingeach typeof foodduringsurvey
Other meat and meat
week
products—contd.Sausages, uncooked, pork 2-87 2-82 2-73 3-13 2-89 47Sausages, uncooked, beef.Meat pies and sausage rolls,
1-37 1-34 1-51 1-54 1-44 25
ready-to-cat 0-99 0-93 0-93 0-94 0-95 20
Quick-frozen meat (otherthan uncooked poultry)and quick-frozen meatproducts
Other meat products102 0-86 112 101 100 14
Total Other Meat and Meat
2-94 319 3 05 3-40 315 46
Products .... 33 16 34-88 36-01 36-08 35 05
Total Meat and Meat Products 62-67 62-74 65-56 67-39 64-61
fish:White, filleted, fresh . 1-65 1-48 1-45 1-80 1-59 21White, unfilleted, fresh 0-97 0-88 0-90 0-95 0-93 11
White, uncooked, quick-frozen .... 0-55 060 0-61 0-55 0-58 9
Herrings, filleted, fresh 002 002 001 001Herrings, unfilleted, fresh 0 09 004 005 010 007 "iFat, fresh, other than herrings 014 014 012 009 0-12 2
White, processed 0-50 0-40 0-35 0-41 0-42 1
Fat, processed, filleted 009 010 010 008 009 2
Fat, processed, unfilleted 012 012 016 016 0-14 3
Shell 015 012 008 0-25 015 2
Cooked .... 1-43 1-74 1-78 1-60 1-64 23
Salmon, canned . 100 1-27 1-29 1-42 1-25 16
Other canned or bottled fish . 0-49 0-64 0-57 0-56 0-56 13
Fish products, not quick-frozen .... 0-24 0-35 0-29 0-23 0-28 10
Quick-frozen fish products,and quick-frozen fish notspecified above 100 116 113 1-08 109 20
Total Fish .... 8-42 906 8-90 9-29 8-92
fats:
8-31 8-33 7-63 8-34 815 86
Butter ....Margarine.
6172-02
6-35206
6-49208
7-27219
6-57209
8448
Lard and compound cookingfat ....
Suet ....Vegetable and salad oilsAll other fats
1180120-53010
1-200080-47012
1-240070-45010
1-300170-70012
1-23011054011
4757
4
Total Fats .... 10-11 10-26 10-43 11-75 10-65
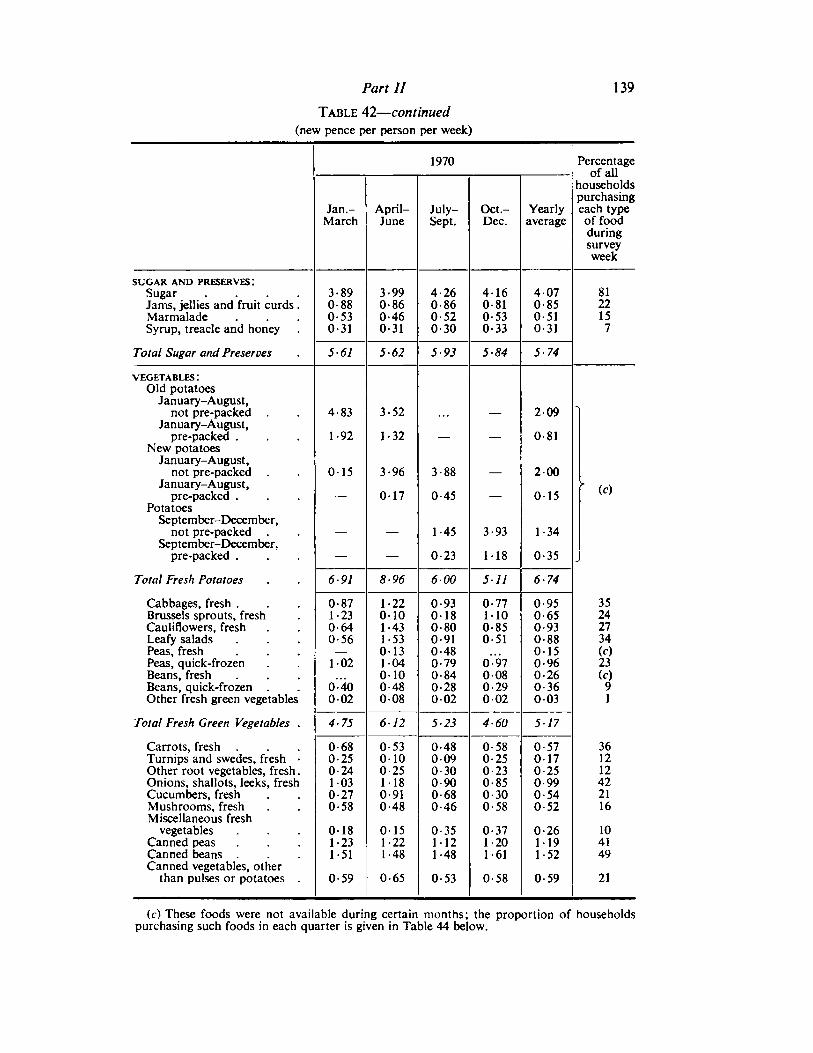
Part II 139
Table 42—continued
(new pence per person per week)
1970 Percentageof all
householdspurchasing
Jan.- April- July- Oct- Yearly each typeMarch June Sept. Dec. average of food
duringsurvey
SUGAR AND PRESERVES:
week
Sugar .... 3-89 3-99 4-26 4-16 407 81
Jams, jellies and fruit curds . 0-88 0-86 0-86 0-81 0-85 22Marmalade 0-53 0-46 0-52 0-53 0-51 15
Syrup, treacle and honey 0-31 0-31 0-30 0-33 0-31 7
Total Sugar and Preserves 5-61 562 5-93 584 5-74
vegetables:Old potatoes
January-August,not pre-packed 4-83 3-52 — 2-09
January-August,
New potatoespre-packed . 1-92 1-32 — — 0-81
January-August,
January-August,not pre-packed 015 3-96 3-88 — 200
'(c)
Potatoespre-packed . — 017 0-45 — 015
September-December,
September-December,not pre-packed — — 1-45 3-93 1-34
pre-packed . — — 0-23 1-18 0-35
Total Fresh Potatoes 6-91 8-96 600 511 6-74
Cabbages, fresh . 0-87 1-22 0-93 0-77 0-95 35
Brussels sprouts, fresh 1-23 010 0-18 1-10 0-65 24Cauliflowers, fresh 0-64 1-43 0-80 0-85 0-93 27Leafy salads 0-56 1-53 0-91 0-51 0-88 34Peas, fresh — 013 0-48 015 (c)Peas, quick-frozen 102 104 0-79 0-97 0-96 23
Beans, fresh 010 0-84 008 0-26 (c)Beans, quick-frozen . 0-40 0-48 0-28 0-29 0-36 9Other fresh green vegetables 002 008 002 002 003 1
Total Fresh Green Vegetables . 4-75 6- 12 523 4-60 5-17
Carrots, fresh 0-68 0-53 0-48 0-58 0-57 36Turnips and swedes, fresh ■ 0-25 010 009 0-25 017 12
Other root vegetables, fresh. 0-24 0-25 0-30 0-23 0-25 12
Onions, shallots, leeks, fresh 103 118 0-90 0-85 0-99 42Cucumbers, fresh 0-27 0-91 0-68 0-30 0-54 21
Mushrooms, fresh 0-58 0-48 0-46 0-58 0-52 16
Miscellaneous freshvegetables 018 015 0-35 0-37 0-26 10
Canned peas 1-23 1-22 112 1-20 119 41
Canned beans 1-51 1-48 1-48 1-61 1-52 49Canned vegetables, other
than pulses or potatoes . 0-59 0-65 0-53 0-58 0-59 21
(c) These foods were not available during certain months; the proportion of householdspurchasing such foods in each quarter is given in Table 44 below.
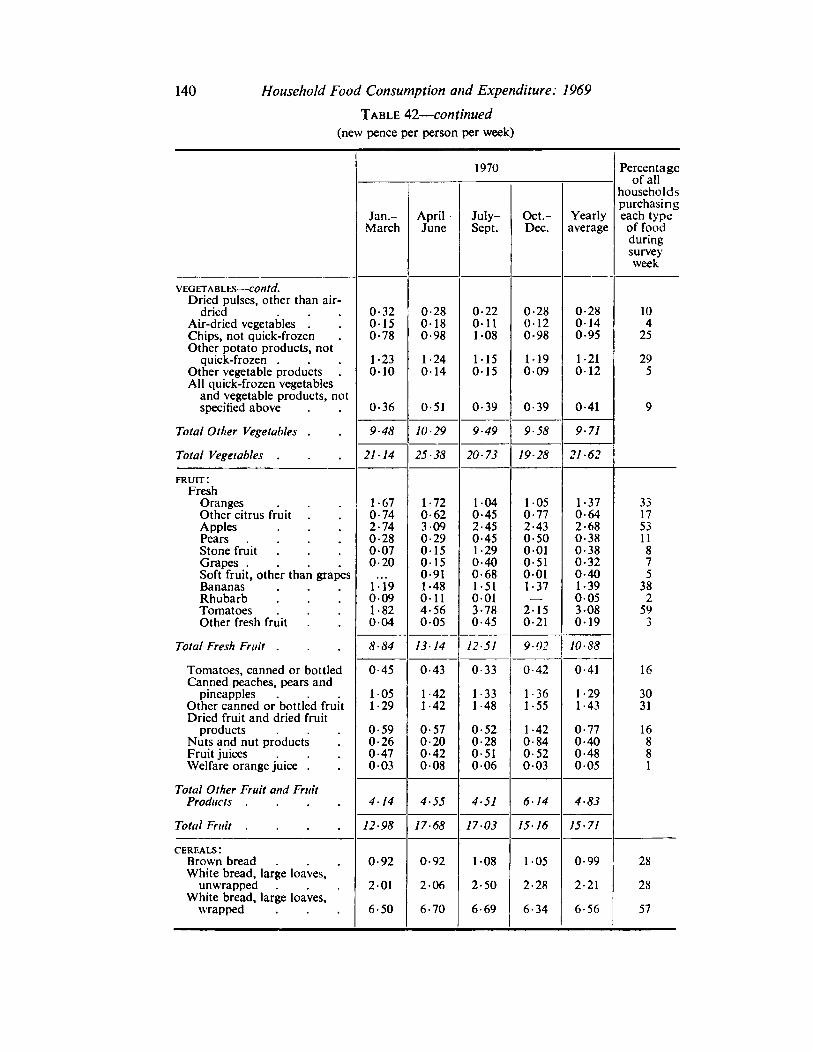
140 Household Food Consumption and Expenditure: 1969
Table 42—continued
(new pence per person per week)
1970 Percentageof all
householdspurchasing
Jan.- April- July- Oct- Yearly each type
VEGETABLES— CO/Ift/.
March June Sept. Dec. average of foodduringsurveyweek
Dried pulses, other than air-dried 0-32 0-28 0-22 0-28 0-28 10
Air-dried vegetables . 015 018 011 012 014 4Chips, not quick-frozen 0-78 0-98 1-08 0-98 0-95 25
Other potato products, notquick-frozen . 1-23 1-24 115 119 1-21 29
Other vegetable products 010 014 015 009 012 5
All quick-frozen vegetablesand vegetable products, notspecified above 0-36 0-51 0-39 0-39 0-41 9
Total Other Vegetables . 9-48 10-29 9-49 9-58 971
Total Vegetables . 21 14 25-38 20-73 19-28 21-62
fruit:Fresh
Oranges 1-67 1-72 104 105 1-37 33
Other citrus fruit 0-74 0-62 0-45 0-77 0-64 17
Apples 2-74 309 2-45 2-43 2-68 53
Pears .... 0-28 0-29 0-45 0-50 0-38 11
Stone fruit . 007 015 1-29 001 0-38 8
Grapes .... 0-20 015 0-40 0-51 0-32 7
Soft fruit, other than grapes 0-91 0-68 001 0-40 5
Bananas 1-19 1-48 1-51 1-37 1-39 38Rhubarb 009 011 001 — 005 2
Tomatoes 1-82 4-56 3-78 2-15 3-08 59Other fresh fruit 004 005 0-45 0-21 019 3
Total Fresh Fruit . 8-84 13- 14 12-51 9-02 10-88
Tomatoes, canned or bottled 0-45 0-43 0-33 0-42 0-41 16
Canned peaches, pears andpineapples
Other canned or bottled fruit1-05 1-42 1-33 1-36 1-29 30
Dried fruit and dried fruit1-29 1-42 1-48 1-55 1-43 31
products 0-59 0-57 0-52 1-42 0-77 16
Nuts and nut products 0-26 0-20 0-28 0-84 0-40 8
Fruit juices 0-47 0-42 0-51 0-52 0-48 8
Welfare orange juice . 003 008 006 003 005 1
Total Other Fruit and FruitProducts .... 4- 14 4-55 4-51 6- 14 4-83
Total Fruit .... 12-98 17-68 17-03 15- 16 15-71
cereals:Brown bread 0-92 0-92 108 105 0-99 28
White bread, large loaves,unwrapped 201 206 2-50 2-28 2-21 28
White bread, large loaves,wrapped 6-50 6-70 6-69 6-34 6-56 57
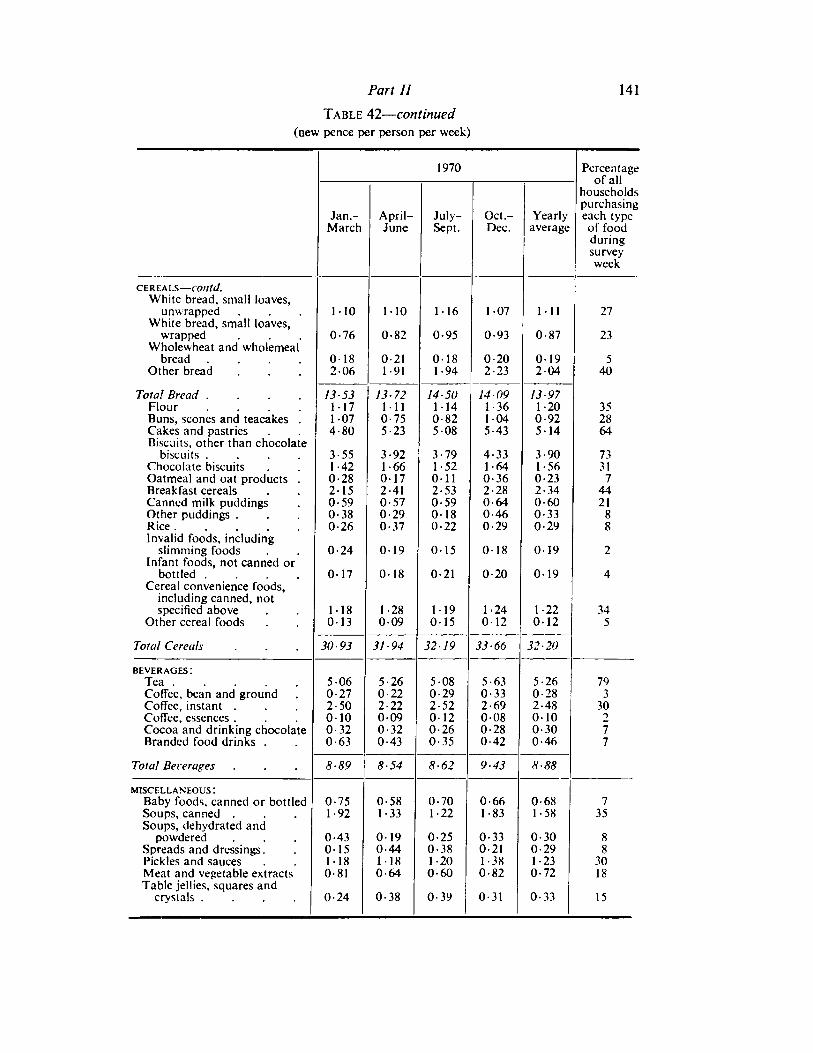
Part II 141
Table 42— continued
(new pence per person per week)
1970 Percentageof all
householdspurchasing
Jan- April- July- Oct- Yearly each type
CEREALS— COrltd.
March June Sept. Dec. average of foodduringsurveyweek
White bread, small loaves,unwrapped 110 110 116 107 111 27
White bread, small loaves,wrapped 0-76 0-82 0-95 0-93 0-87 23
Wholewheat and wholemealbread .... 018 0-21 018 0-20 019 5
Other bread 206 1-91 1-94 2-23 204 40
Total Bread .... 13-53 13-72 14-50 14-09 13-97Flour .... 117 111 1-14 1-36 1-20 35
Buns, scones and teacakes . 107 0-75 0-82 104 0-92 28Cakes and pastries 4-80 5-23 508 5-43 514 64Biscuits, other than chocolate
biscuits .... 3-55 3-92 3-79 4-33 3-90 73
Chocolate biscuits 1-42 1-66 1-52 1-64 1-56 31
Oatmeal and oat products . 0-28 017 011 0-36 0-23 7
Breakfast cereals 215 2-41 2-53 2-28 2-34 44Canned milk puddings 0-59 0-57 0-59 0-64 0-60 21Other puddings . 0-38 0-29 018 0-46 0-33 8
Rice 0-26 0-37 0-22 0-29 0-29 8Invalid foods, including
slimming foods 0-24 019 015 018 019 2
Infant foods, not canned orbottled .... 017 018 0-21 0-20 019 4
Cereal convenience foods,including canned, notspecified above 118 1-28 119 1-24 1-22 34
Other cereal foods 013 009 015 012 012 5
Total Cereals 30 93 31-94 32 19 33-66 32-20
beverages:
Tea 506 5-26 508 5-63 5-26 79
Coffee, bean and ground 0-27 0-22 0-29 0-33 0-28 3
Coffee, instant . 2-50 2-22 2-52 2-69 2-48 30Coffee, essences . 010 009 012 008 010 2
Cocoa and drinking chocolate 0-32 0-32 0-26 0-28 0-30 7
Branded food drinks . 0-63 0-43 0-35 0-42 0-46 7
Total Beverages 8-89 8-54 8-62 943 8-88
miscellaneous:Baby foods, canned or bottled 0-75 0-58 0-70 0-66 0-68 7
Soups, canned . 1-92 1-33 1-22 1-83 1-58 35
Soups, dehydrated andpowdered 0-43 019 0-25 0-33 0-30 8
Spreads and dressings . 015 0-44 0-38 0-21 0-29 8
Pickles and sauces 118 1-18 1-20 1-38 1-23 30
Meat and vegetable extracts 0-81 0-64 0-60 0-82 0-72 18
Table jellies, squares andcrystals .... 0-24 0-38 0-39 0-31 0-33 15
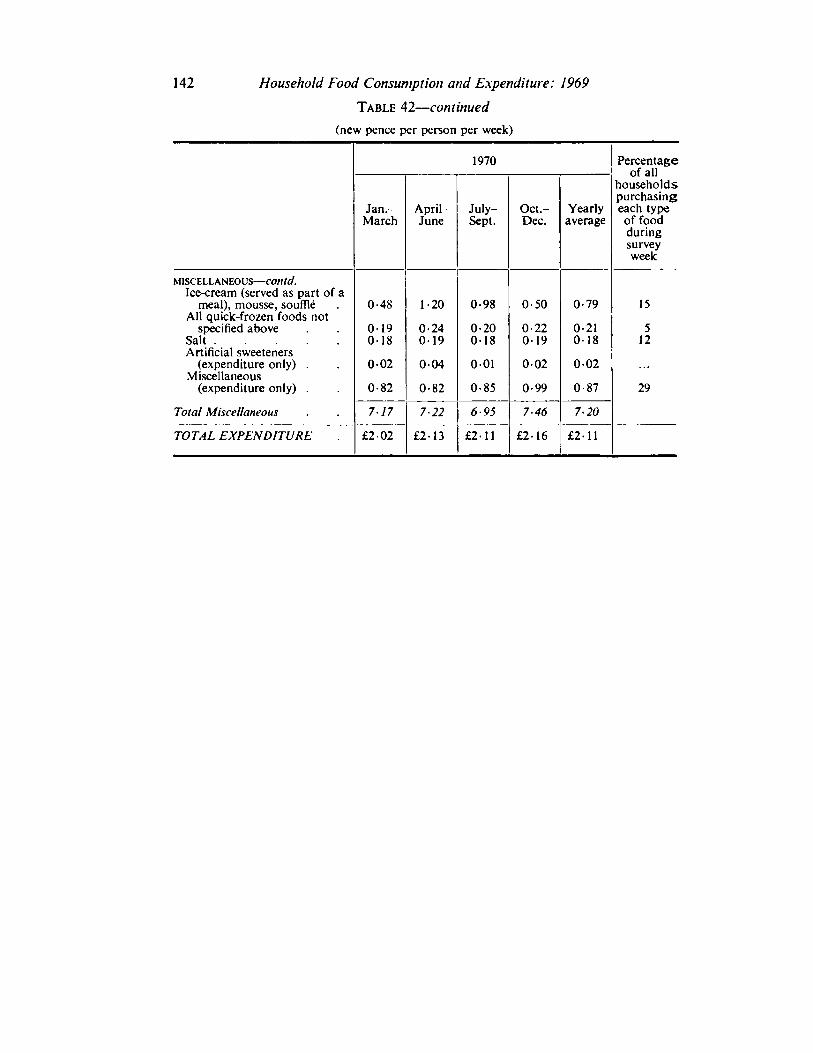
142 1969Household Food Consumption and Expenditure:
Table 42— continued
(new pence per person per week)
1970 Percentageof all
householdspurchasing
Jan- April- July- Oct- Yearly each type
MISCELLANEOUS—COtltd.
March June Sept. Dec. average of foodduringsurveyweek
Ice-cream (served as part of ameal), mousse, souffte 0-48 1-20 0-98 0-50 0-79 15
All quick-frozen foods notspecified above 019 0-24 0-20 0-22 0-21 5
Salt 018 019 018 019 018 12
Artificial sweeteners(expenditure only) . 0-02 004 001 002 002
Miscellaneous(expenditure only) . 0-82 0-82 0-85 0-99 0-87 29
Total Miscellaneous 717 7-22 6-95 7 46 7-20
TOTAL EXPENDITURE £202 £2-13 £2-11 £2-16 £211
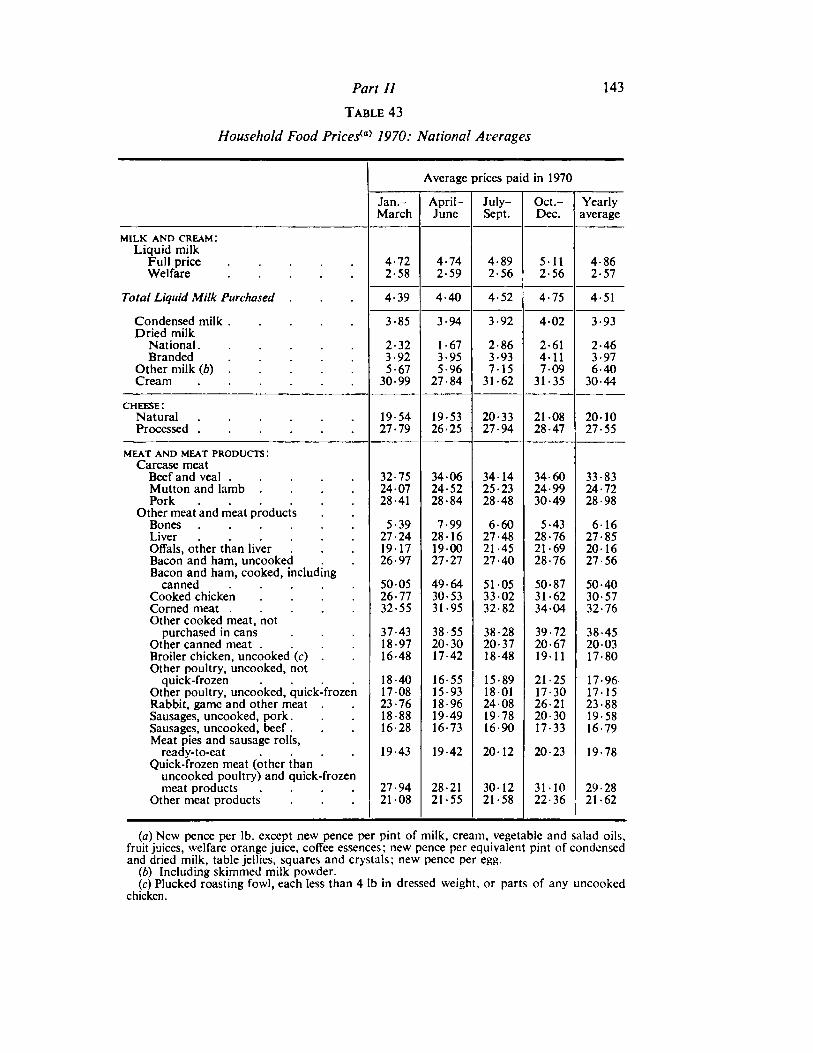
Part II 143
Table 43
Household Food Priced 1970: National Averages
Average prices paid in 1970
Jan- April- July- Oct.- Yearly
MILK AND CREAM:
March June Sept. Dec. average
Liquid milkFull price 4-72 4-74 4-89 511 4-86Welfare 2-58 2-59 2-56 2-56 2-57
Total Liquid Milk Purchased 4-39 4-40 4-52 4-75 4 51
Condensed milk 3-85 3-94 3-92 402 3-93Dried milk
National 2-32 1-67 2-86 2-61 2-46Branded ..... 3-92 3-95 3-93 411 3-97
Other milk (b) 5-67 5-96 7-15 7-09 6-40Cream 30-99 27-84 31-62 31-35 30-44
cheese:Natural 19-54 19-53 20-33 21 08 20-10Processed 27-79 26-25 27-94 28-47 27-55
MEAT AND MEAT PRODUCTS:Carcase meat
Beef and veal 32-75 3406 34- 14 34-60 33-83Mutton and lamb .... 2407 24-52 25-23 24-99 24-72Pork 28-41 28-84 28-48 30-49 28-98
Other meat and meat productsBones 5-39 7-99 6-60 5-43 6-16Liver ...... 27-24 28 16 27-48 28-76 27-85Offals, other than liver 19-17 1900 21-45 21-69 20- 16
Bacon and ham, uncooked 26-97 27-27 27-40 28-76 27-56Bacon and ham, cooked, including
canned ..... 50 05 49-64 51 05 50-87 50-40Cooked chicken .... 26-77 30-53 33 02 31-62 30-57Corned meat 32-55 31-95 32-82 3404 32-76Other cooked meat, not
purchased in cans 37-43 38-55 38-28 39-72 38-45Other canned meat .... 18-97 20-30 20-37 20-67 20 03Broiler chicken, uncooked (c) 16-48 17-42 18-48 1911 17-80Other poultry, uncooked, not
quick-frozen .... 18-40 16-55 15-89 21-25 17-96Other poultry, uncooked, quick-frozen 1708 15-93 18-01 17-30 17-15Rabbit, game and other meat 23-76 18-96 24 08 26-21 23-88Sausages, uncooked, pork. 18-88 19-49 19-78 20-30 19-58Sausages, uncooked, beef . 16-28 16-73 16-90 17-33 16-79Meat pies and sausage rolls,
ready-to-eat .... 19-43 19-42 2012 20-23 19-78
Quick-frozen meat (other thanuncooked poultry) and quick-frozenmeat products .... 27-94 28-21 30- 12 3110 29-28
Other meat products 21 08 21-55 21-58 22-36 21-62
(a) New pence per lb. except new pence per pint of milk, cream, vegetable and salad oils,fruit juices, welfare orange juice, coffee essences; new pence per equivalent pint of condensedand dried milk, table jellies, squares and crystals; new pence per egg.
(b) Including skimmed milk powder.
(c) Plucked roasting fowl, each less than 4 lb in dressed weight, or parts of any uncookedchicken.
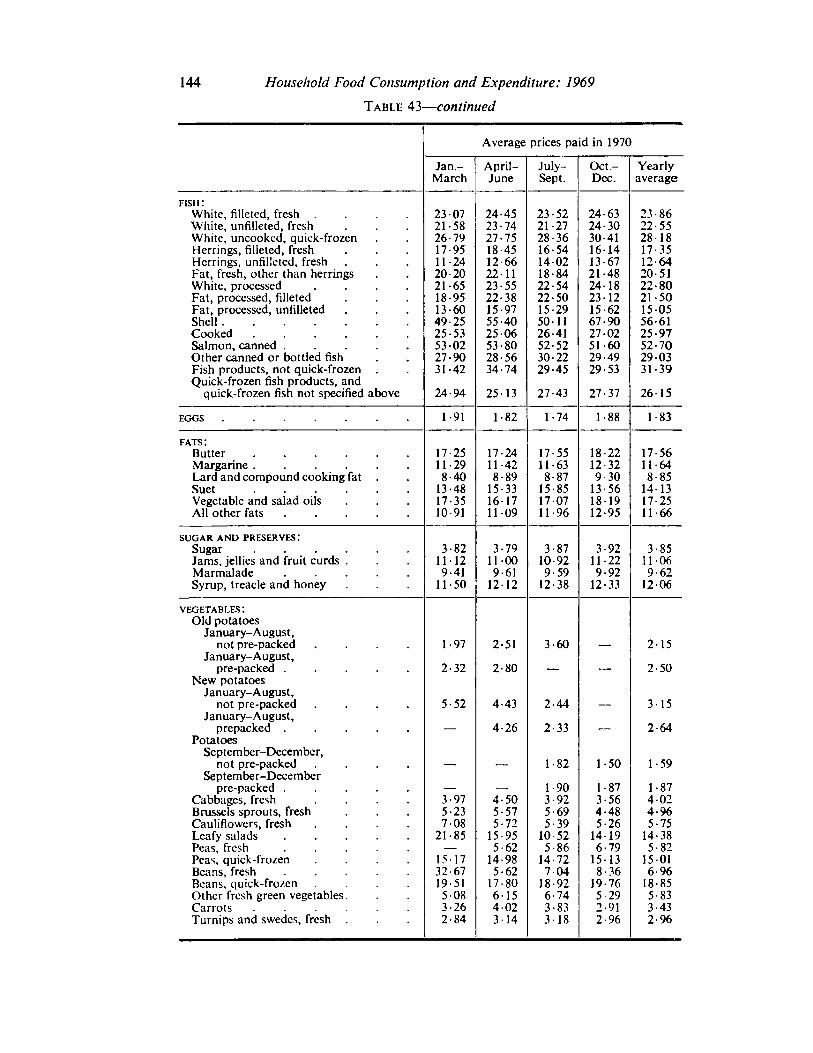
144 Household Food Consumption and Expenditure: 1969
Table 43—continued
Average prices paid in 1970
Jan- April- July- Oct- Yearly
fish:White, filleted, fresh .... March June Sept. Dec. average
23 07 24-45 23-52 24-63 23-86White, unfilleted, fresh 21-58 23-74 21-27 24-30 22-55White, uncooked, quick-frozen 26-79 27-75 28-36 30-41 28-18Herrings, filleted, fresh 17-95 18-45 16-54 1614 17-35Herrings, unfilleted, fresh 11-24 12-66 14 02 13-67 12-64Fat, fresh, other than herrings 20-20 22-11 18-84 21-48 20-51White, processed 21-65 23-55 22-54 24-18 22-80Fat, processed, filleted 18-95 22-38 22-50 23- 12 21-50Fat, processed, unfilleted 13-60 15-97 15-29 15-62 1505Shell 49-25 55-40 5011 67-90 56-61Cooked .... 25-53 2506 26-41 27-02 25-97Salmon, canned . 53 02 53-80 52-52 51-60 52-70Other canned or bottled fish 27-90 28-56 30-22 29-49 29 03Fish products, not quick-frozen 31-42 34-74 29-45 29-53 31-39Quick-frozen fish products, and
quick-frozen fish not specified above 24-94 2513 27-43 27-37 26- 15
EGGS 1-91 1-82 1-74 1-88 1-83
fats:Butter 17-25 17-24 17-55 18-22 17-56Margarine .... 11-29 11-42 11-63 12-32 11-64Lard and compound cooking fat 8-40 8-89 8-87 9-30 8-85Suet .... 13-48 15-33 15-85 13-56 1413Vegetable and salad oils 17-35 1617 17-07 18-19 17-25All other fats 10-91 1109 11-96 12-95 11-66
SUGAR AND PRESERVES:
Sugar 3-82 3-79 3-87 3-92 3-85Jams, jellies and fruit curds . 1112 1100 10-92 11-22 11-06Marmalade 9-41 9-61 9-59 9-92 9-62Syrup, treacle and honey 11-50 1212 12-38 12-33 1206
vegetables:Old potatoes
January-August,
January-August,not pre-packed .... 1-97 2-51 3-60 — 2-15
New potatoespre-packed ..... 2-32 2-80 — — 2-50
January-August,
January-August,not pre-packed .... 5-52 4-43 2-44 — 3-15
Potatoesprepacked — 4-26 2-33 — 2-64
September-December,
September-Decembernot pre-packed .... — — 1-82 1-50 1-59
pre-packed ..... — —. 1-90 1-87 1-87Cabbages, fresh 3-97 4-50 3-92 3-56 402Brussels sprouts, fresh 5-23 5-57 5-69 4-48 4-96Cauliflowers, fresh 7-08 5-72 5-39 5-26 5-75Leafy salads 21-85 15-95 10-52 1419 14-38Peas, fresh — 5-62 5-86 6-79 5-82Peas, quick-frozen 15-17 14-98 14-72 1513 1501Beans, fresh 32-67 5-62 704 8-36 6-96Beans, quick-frozen 19-51 17-80 18-92 19-76 18-85Other fresh green vegetables 5-08 615 6-74 5-29 5-83Carrots 3-26 402 3-83 2-91 3-43Turnips and swedes, fresh 2-84 314 318 2-96 2-96
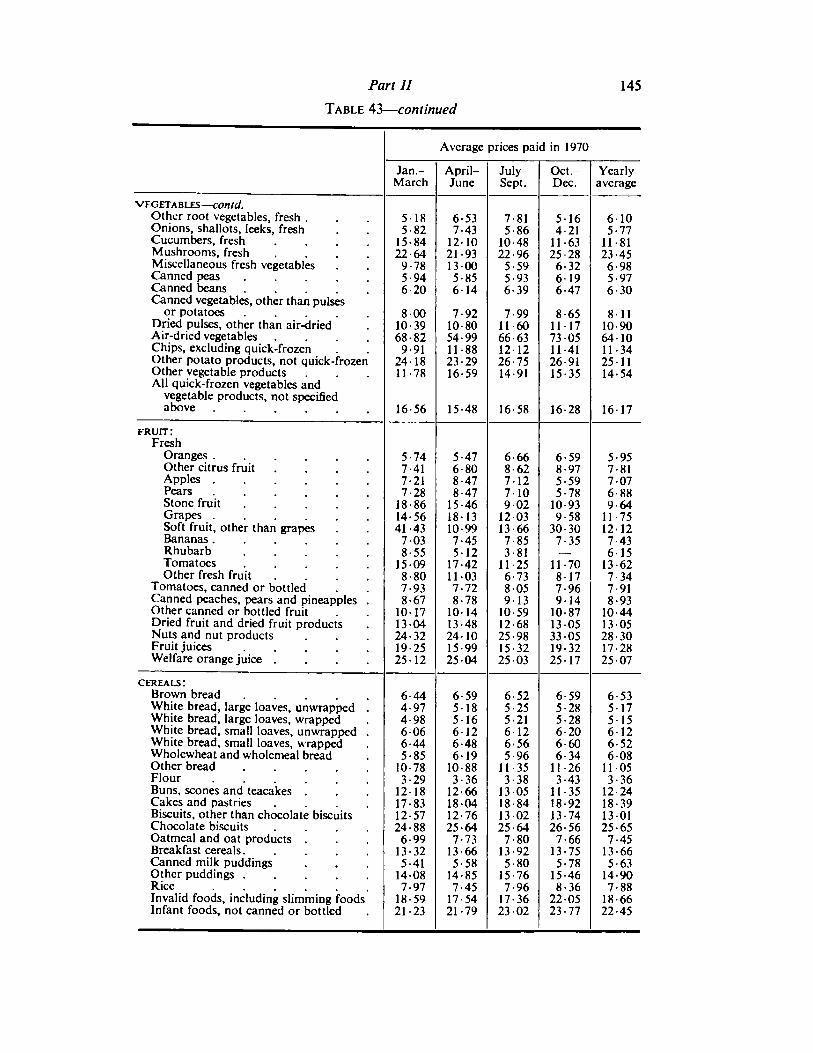
Part II 145
Table 43—continued
Average prices paid in 1970
Jan- April- July- Oct.- Yearly
VEGETABLES —COntd.
March June Sept. Dec. average
Other root vegetables, fresh . 518 6-53 7-81 516 610Onions, shallots, leeks, fresh 5-82 7-43 5-86 4-21 5-77Cucumbers, fresh .... 15-84 1210 10-48 11-63 11-81Mushrooms, fresh .... 22-64 21-93 22-96 25-28 23-45Miscellaneous fresh vegetables 9-78 13-00 5-59 6-32 6-98Canned peas ..... 5-94 5-85 5-93 619 5-97Canned beans 6-20 614 6-39 6-47 6-30Canned vegetables, other than pulses
or potatoes 800 7-92 7-99 8-65 811Dried pulses, other than air-dried 10-39 10-80 11-60 1117 10-90Air-dried vegetables .... 68-82 54-99 66-63 73 05 6410Chips, excluding quick-frozen 9-91 11-88 1212 11-41 11-34Other potato products, not quick-frozen 24-18 23-29 26-75 26-91 2511Other vegetable products 11-78 16-59 14-91 15-35 14-54All quick-frozen vegetables and
vegetable products, not specifiedabove 16-56 15-48 16-58 16-28 1617
fruit:Fresh
Oranges 5-74 5-47 6-66 6-59 5-95Other citrus fruit .... 7-41 6-80 8-62 8-97 7-81Apples 7-21 8-47 7-12 5-59 7-07Pears 7-28 8-47 710 5-78 6-88Stone fruit 18-86 15-46 902 10-93 9-64Grapes 14-56 1813 1203 9-58 11-75Soft fruit, other than grapes 41-43 10-99 13-66 30-30 1212Bananas 703 7-45 7-85 7-35 7-43Rhubarb 8-55 512 3-81 — 615Tomatoes 1509 17-42 11-25 11-70 13-62Other fresh fruit .... 8-80 11 03 6-73 8-17 7-34
Tomatoes, canned or bottled 7-93 7-72 8 05 7-96 7-91Canned peaches, pears and pineapples . 8-67 8-78 913 914 8-93Other canned or bottled fruit 1017 10-14 10-59 10-87 10-44Dried fruit and dried fruit products 1304 13-48 12-68 1305 1305Nuts and nut products 24-32 24- 10 25-98 33 05 28-30Fruit juices 19-25 15-99 15-32 19-32 17-28Welfare orange juice .... 25- 12 25 04 25-03 25- 17 25 07
cereals:Brown bread 6-44 6-59 6-52 6-59 6-53White bread, large loaves, unwrapped . 4-97 518 5-25 5-28 5-17White bread, large loaves, wrapped 4-98 516 5-21 5-28 515White bread, small loaves, unwrapped . 606 612 612 6-20 612White bread, small loaves, wrapped 6-44 6-48 6-56 6-60 6-52Wholewheat and wholemeal bread 5-85 6-19 5-96 6-34 608Other bread 10-78 10-88 11-35 11-26 11 05Flour 3-29 3-36 3-38 3-43 3-36Buns, scones and teacakes . 1218 12-66 1305 11-35 12-24Cakes and pastries .... 17-83 1804 18-84 18-92 18-39Biscuits, other than chocolate biscuits 12-57 12-76 13 02 13-74 1301Chocolate biscuits .... 24-88 25-64 25-64 26-56 25-65Oatmeal and oat products . 6-99 7-73 7-80 7-66 7-45Breakfast cereals 13-32 13-66 13-92 13-75 13-66Canned milk puddings 5-41 5-58 5-80 5-78 5-63Other puddings 14-08 14-85 15-76 15-46 14-90Rice 7-97 7-45 7-96 8-36 7-88Invalid foods, including slimming foods 18-59 17-54 17-36 22 05 18-66Infant foods, not canned or bottled 21-23 21-79 23 02 23-77 22-45
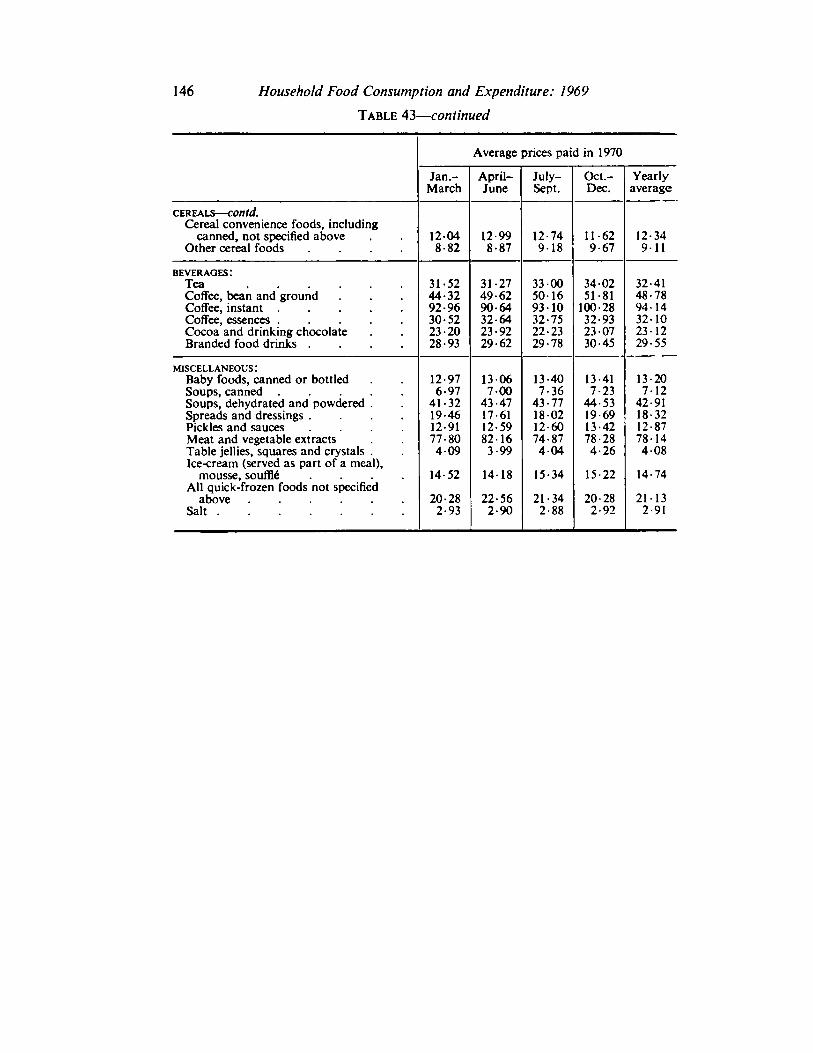
146 Household Food Consumption and Expenditure: 1969
Table 43— continued
Average prices paid in 1970
Jan.- April- July- Oct- Yearly
CEREALS —contd.
March June Sept. Dec. average
Cereal convenience foods, includingcanned, not specified above 1204 12-99 12-74 11-62 12-34
Other cereal foods .... 8-82 8-87 918 9-67 911
beverages:Tea 31-52 31-27 33 00 34 02 32-41Coffee, bean and ground 44-32 49-62 50- 16 51-81 48-78Coffee, instant 92-96 90-64 93 10 100-28 94- 14
Coffee, essences 30-52 32-64 32-75 32-93 32- 10
Cocoa and drinking chocolate 23-20 23-92 22-23 23 07 23- 12
Branded food drinks .... 28-93 29-62 29-78 30-45 29-55
miscellaneous:Baby foods, canned or bottled 12-97 1306 13-40 13-41 13-20Soups, canned 6-97 700 7-36 7-23 7-12Soups, dehydrated and powdered . 41-32 43-47 43-77 44-53 42-91Spreads and dressings .... 19-46 17-61 18 02 19-69 18-32Pickles and sauces .... 12-91 12-59 12-60 13-42 12-87Meat and vegetable extracts 77-80 82-16 74-87 78-28 78-14Table jellies, squares and crystals . 409 3-99 4-04 4-26 408Ice-cream (served as part of a meal),
mousse, souffle .... 14-52 1418 15-34 15-22 14-74All quick-frozen foods not specified
above 20-28 22-56 21-34 20-28 21 13
Salt 2-93 2-90 2-88 2-92 2 91
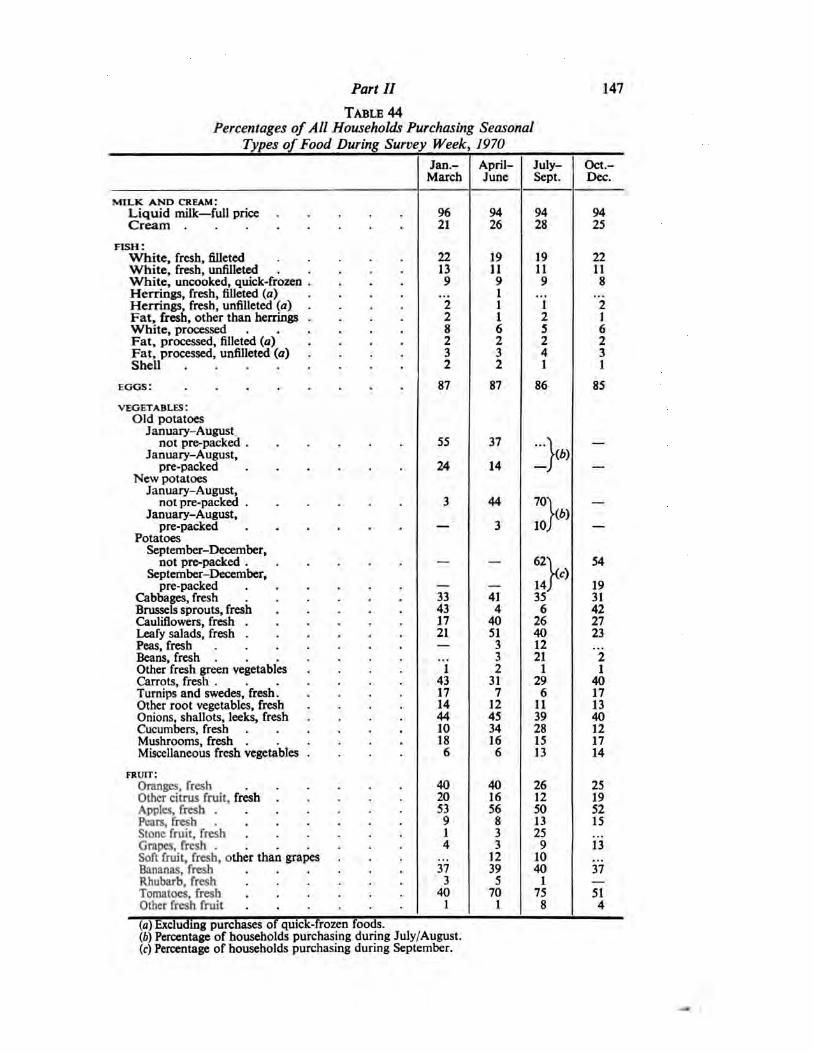
Part II 147
Table 44
Percentages of All Households Purchasing SeasonalTypes of Food During Survey Week, 1970
iJan.-March
April-June
July-Sept.
Oct.-Dec.
MILK AND CREAM:96 94 94 94
fish:
21 26 28 25
22 19 19 2213 11 11 11
White, uncooked, quick-frozen . 9 9 9 8
Herrings, fresh, filleted (a)"i
1
"i "lHerrings, fresh, unfilleted (a) 1
Fat, fresh, other than herrings . 2 1 2 1
8 6 5 6Fat, processed, filleted (a) 2 2 2 2Fat, processed, unfilleted (a) 3 3 4 3
2 2 1 1
vegetables:
87 87 86 85
Old potatoesJanuary-August.
January-August,55 37
Kb)
—
New potatoes24 14 —J —
January-August,
January-August,3 44
Kb)
—
Potatoes3 ioJ —
September-December,
September-December,
— —621
Kc)54
— — 14j 1933 41 35 3143 4 6 4217 40 26 2721 51 40 23— 3 12
"iBeans, fresh ...."i
3 21
Other fresh green vegetables 2 1 143 31 29 40
Turnips and swedes, fresh. 17 7 6 17
Other root vegetables, fresh 14 12 11 13
Onions, shallots, leeks, fresh 44 45 39 4010 34 28 1218 16 15 17
Miscellaneous fresh vegetables . 6 6 13 14
fruit:40 40 26 2520 16 12 19
53 56 50 529 8 13 15
Stone fruit, fresh 1 3 254 3 9 i'i
Soft fruit, fresh, other than grapes 12 1037 39 40 37
3 5 1 —Tomatoes, fresh 40 70 75 51
Other fresh fruit 1 1 8 4
(a) Excluding purchases of quick-frozen foods.
(6) Percentage of households purchasing during July/August.(c) Percentage of households purchasing during September.

148 Household Food Consumption and Expenditure: 1969
Table 45
Energy Value and Nutrient Content of Household Food Consumption:National Averages 1969 and 1970
1969 1970
(i) Consumption per person per dayEnergy value (kcal)
(MJ)Total protein (g)Animal protein (g)Fat (g)Carbohydrate (g)Calcium (mg)Iron (mg)Thiamin (mg)Riboflavin (mg)Nicotinic acid (total) (mg)Tryptophan (mg)Nicotinic acid equivalent (mg)Vitamin C (mg)Vitamin A: retinol ...... ((xg)
(3-carotene (t*g)retinol equivalent .... (;xg)
Vitamin D (a) (jig)
(ii) As percentage of recommended intakesEnergy value ........Protein .........
(as a percentage of minimum requirement) .CalciumIronThiaminRiboflavinNicotinic acid equivalentVitamin CVitamin A (retinol equivalent)Vitamin D (a)
(hi) Percentage of energy derived from protein, fat andcarbohydrateProteinFatCarbohydrate
(iv) Animal protein as a percentage of total protein .
2,5701074
46120
317
1,05013
1
1
16-2950
29-452
9102,1101,360
2
3
17
79
90
2,60010-974-946-2
121
322
1,05013-
1-
1-7916-4
95029-952
9102,1601,370
2-87
■7
•19
109
126
193
194
121
122
130
190
181
199
84
111
128
195
194
124
124
130
194
184
200
84
11-642046-3
11-541-846-5
62-5 61-7
(a) Excluding the contribution of welfare and pharmaceutical products.
APPENDIX A
Methodology of the National Food Survey(1>
and Composition of the Sample in 1969
1. The National Food Survey is a continuous sampling inquiry into the domesticfood consumption and expenditure of private households in Great Britain. TheSurvey was initiated in July 1940; no preliminary pilot inquiry was undertaken,but much use was made of the experience of the pre-war surveys carried out byCrawford and Broadley*2* and by the Carnegie United Kingdom Trust(3). UntilJanuary 1950, the main survey was confined to urban working-class households,but thereafter it was extended to all classes and to all parts of Great Britain.
2. Each household which participates in the Survey does so voluntarily, andwithout payment, for one week only. By completely changing the householdssurveyed each week, information is obtained continuously throughout the yearexcept for a short break at Christmas. Since the Survey aims to determine whatfamilies, rather than individuals, consume, the informant is the housewife, who,as the family caterer, is responsible for buying food, or utilizing free suppliesfrom, say, a garden or farm. Each household is visited by a fieldworker who seeksthe housewife's co-operation in the Survey and asks her to provide particulars ofthe composition of the household. If the housewife agrees to co-operate, thefieldworker, at this first interview, supplies her with a specially designed logbook in which she is asked to keep a record of the description, quantity and costof all food which enters the household on that and the next six days. Theinformation which the housewife is asked to provide must be within her knowledge. Thus the Survey excludes those items which other members of the familyoften purchase for themselves, such as chocolates and sugar confectionery,mineral waters, squashes and alcoholic drinks, and also ice-cream and fish andchips if obtained to eat outside the home. It further excludes vitamin preparations, the consumption of which by one or more members of the family mightdistort the general impression of the nutritional value of the family's food. Thehousewife is asked to give particulars of the number and type of meals obtainedand consumed outside the house by each member of the family, but not of thecost or composition of such meals; she is also asked to record the quantity ofmilk supplied to her children under the School Milk Scheme. At a second visit,the interviewer clears up any difficulties which may have arisen, and at the finalvisit, when the log-book is collected, she obtains if possible certain relevant supplementary data such as the income of the head of the household and of the family.In cases of difficulty the interviewer may pay more than three visits to a family.The information obtained from individual housewives is strictly confidential.
Selection of the sample
3. The National Food Survey sample is selected by means of a three-stage stratified random sampling scheme. The sampling frame covers the whole of GreatBritain. The first stage involves the selection of Parliamentary constituencies; the
(" A general account of the Survey has also been given by D. F. Hollingsworth and A. H. J.Baines in Family Living Studies (pages 120-138), International Labour Office, Geneva, 1961.
"' W. Crawford and H. Broadley, The People's Food, Heinemann, 1938.Rowett Research Institute, Family Diet and Health in Pre-War Britain, Carnegie United
Kingdom Trust, 1955. See also A. H. J. Baines, D. F. Hollingsworth and I. Leitch (1963),Nutrition Abstracts and Reviews 33, 653-668.
149
150 Household Food Consumption and Expenditure: 1969
second, the selection of polling districts or combinations thereof within the selec
ted constituencies; and the third or final stage, the selection of addresses withinthese polling districts.
4. First stage—The Parliamentary constituencies included in the sampling frameare first stratified according to the current standard regions, and then withineach region constituencies are divided into two groups—those in which theconstituency population is living wholly in urban areas and other constituencies.Within these strata they are further stratified as follows :
Wholly urban constituencies —by a "Conservative to Labour" vote ratio as a
measure of socio-economic classification arranged in descending order of theratio. With the change to Economic Planning regions in 1968 the opportunitywas taken to bring up-to-date the data on constituencies and the stratificationprocedure. Prior to 1968, constituencies in England and Wales had been classified according to a Juror Index, i.e. the proportion of the Electorate qualified forJuror service in 1955, while Scottish constituencies had been classified by rate
able value per head. Successive revaluations of domestic hereditaments hadextended the liability for jury service in England and Wales to so high a proportion that a Juror Index based on current information would not provide a satis
factory method of classification. The former classification was therefore replacedby a new indicator, and in the absence of other data for constituencies the onlysuitable stratification index available was the vote ratio based on the 1966 General Election results, the latest available at the time. The stratification procedurejust described applies to England, Wales and Scotland.
Mixed urban and rural constituencies —by the proportion of electorate living inrural administrative areas (the percentage rural) arranged in descending order ofthe rural proportion.
5. The sampling frame is divided into 44 groups of constituencies by region(1).
The electorate of the groups within a region are approximately equal, and oneconstituency is selected from each group with probability proportional to itselectorate. If a constituency had already been included in either of the twopreceding years' selection it is rejected and the process repeated.
6. Second stage. The second-stage units are polling districts, or where the elec
torate is small, combinations of polling districts together giving a minimumelectorate of 350. In selecting the second-stage units in each wholly urbanconstituency the polling districts are listed in the order in which they appear inthe electoral register and are then divided into four groups of approximatelyequal electorate. Four polling districts are selected at a time from each constituency, one being selected from each of the four groups with probability ofselection proportional to the size of the electorate. This operation is repeated
several times in order to give coverage over the whole year (see paragraph 8
below). In each mixed urban and rural constituency the second-stage units areselected in a similar manner except that a slightly different procedure is followed
(1>For reasons of economy, the number of parliamentary constituencies in the nationalsample was reduced from 60 in 1950-1956 to 50 in 1957-1962 (except that in 1960 the numberwas 48), and to 44 from 1963 onwards.
Appendix A 151
in building up the four groups of polling districts from which the selection ismade. This procedure entails listing the urban polling districts in the order inwhich they appear on the electoral register, and compiling a list, similarlyordered, of the rural polling districts (or combinations of contiguous pollingdistricts together giving a minimum electorate of 350). The percentage of the
constituency's electorate which is resident in rural polling districts is calculatedand then this percentage is used to determine how many of the four groups ofpolling districts are to be built up from the list of rural polling districts accordingto the following scheme:
Percentage of electorate resident in rural polling districts
less than12-5
12-5-37-4 37-5-62-4 62-5-87-4 87-5 andover
Number of groups of ruralpolling districts 0 1 2 3 4
In cases where the rural list is divided into two or more groups, the division is
made in such a way that each of the groups are of approximately equal electorate
and similarly when dividing the urban list into two or more groups. The sequencein which polling districts are used in the field is such that the distributionbetween urban and rural is as representative as possible.
7. Third stage. The design of the sample requires that a uniform overall samplingfraction should be applied, and as the preceding stages are drawn with probabilityproportional to size this necessitates the selection of a constant number of ad
dresses at the final stage. To meet this requirement, 20 addresses are drawn byinterval sampling from a random origin in the electoral register of each pollingdistrict (or combination of districts where they are small). Of the 15,000 addres
ses thus selected for the year, a few cannot be visited, and some are found to be
ineligible (e.g. being institutions), but of the total number of households contained in the remainder, between 50 and 60 per cent complete a satisfactorylog-book (response being rather greater in Scotland and northern England thanin Wales and southern England and least of all in parts of London), giving aneffective Survey sample of about 7,500 to 8,000 households. In a number ofcases where a log-book was not completed, some information on householdcomposition and income was obtained from the housewife or from another adultin the household. This information indicates that in respect of income group,household composition and geographical distribution, these partial non-respondents are usually similar to the fully participating households.
8. The fieldwork is organised so as to give information throughout the year.For this purpose the year, excluding Christmas, is divided into 17 intervals, each
of 21 days. For each interval, two of the selected polling districts are used; oneis used in the first part of the interval and another from the same constituencyfor the second part. In the first polling district the interviewers attempt to place
log-books with the pre-selected 20 housewives during the three days Monday toWednesday. The completed records are collected by the interviewers after a
period of seven days. Fieldwork in the second polling district begins in the middleof the 21 days, and the interviewer attempts to place log-books on Wednesdayafternoon and during the three days Thursday to Saturday. She collects the
152 Household Food Consumption and Expenditure: 1969
completed records seven days later, that is,
at the end of the interval. This cycleof operations is repeated throughout the year and in order to facilitate it the 44
constituencies are divided into 2 sets of 22. These two sets are used alternately, sothat in one interval, one set of 22 constituencies is used covering 44 polling districts. In the next interval the other set of 22 constituencies is used covering a
further 44 polling districts. However, as there are only 17 such intervals in the
year, the two sets of constituencies are not in complete balance, one set normallybeing used nine times and the other eight.
Composition of the Sample9. The 44 parliamentary constituencies selected for survey in 1969 are listed inTable 1 of this appendix. At the second stage of sampling, 877 polling districtswere selected, and at the third stage, 14,733 addresses. When visited, a few ofthese addresses were found to be those of institutions or other establishments noteligible for inclusion in the Survey. At some other addresses which were visited,
it was impossible to obtain any interview at all within the limited time availablefor making calls, and the number of households resident at some of these
addresses has been estimated. Subject to this qualification, and after allowingfor adjustments brought about by the presence of more than one household at
an address, the effective number of households in the sample was 14,144. Whenvisited, it proved impossible to obtain any contact at all within the time available with 2,182 (15 per cent) of these households; at another 1,834 (13 per cent)households, the housewife was seen but refused to give any information. A
further 1,447 (10 per cent) households answered a question naire(1) but declinedto keep a log-book, while 964 housewives (7 per cent) who undertook to keep a
log-book did not in fact complete it; finally 148 log-books were rejected at the
editing stage, leaving an effective sample of 7,569 households (54 per cent)compared with 7,888 households (56 per cent) in 1968 and 8,021 households
(57 per cent) in 1967<2). Because of the limited number of first-stage units, some
imbalance between types of area can be expected to occur in any one year, andthe national averages presented in this Report have been adjusted to correct theeffects of this imbalance.
10. The average household size in the sample in 1969 was 3-05 persons, compared with 3-07 persons in 1968 and in 1967, and 305 persons in 1966. Theaverage household size in each type of area in 1969 showed only small variationscompared with 1968. Thus, the average household size in the provincial conurbations, and in rural districts, continued to be slightly above the national average,and that in London and in small towns continued to be below it. The averagehousehold sizes in Scotland and in Wales and in the North, North West andEast Midlands regions of England were above the average for Great Britain,while those in the Yorkshire and Humberside, West Midlands, South West, andSouth East & East Anglia regions were below that average.
a> The questionnaire relates to family composition, occupation, etc.(2> A supplementary analysis carried out in 1961 indicated that at the time, the households
which answered a questionnaire but declined or failed to complete a log-book (more than 20per cent of the households drawn in the sample) were not distributed geographically or according to the Registrars-General's Social Classes in a significantly different manner from the fullyparticipating households; they were, however, very slightly differently distributed according tofamily composition (they included relatively fewer large families but relatively more whollyadult households), but the difference would have increased the estimate of the national averagefood expenditure by less than one per cent.
Appendix A 153
11. When households were grouped according to the gross weekly income of the
head of the household the average household size was greatest (3-6) in the
highest income group, lower (but still above the overall national average) inincome groups B and C (3 -4 and 3-2 persons respectively) and below the overallnational average in income groups Dl and D2, and in pensioner households(2-7, 1 -8 and 1 -5 persons respectively). The income ranges used to define in
come groups in 1969 are set out in paragraph 54 of the Report, together with the
distribution of households obtained. Further details of the samples from each
income group are given in Tables 6, 7 and 8 of this appendix, the two lattertables also giving some details of the distribution of the sample according tohousehold composition.
Information recorded by housewives
12. The log-book contains two pages for each day of the survey week. On one
page are entered the descriptions, quantity and cost of all items of food boughtfor the household supply ; food obtained from an employer, free of payment, isrecorded when it enters the household, but free food from the garden or allotment or from a farm or other business owned by a member of the household is
recorded only at the time it is consumed. To avoid double counting, gifts of foodreceived from another household in Great Britain are not recorded if they have
been purchased by the donating household. On each facing page are entered
particulars of the persons present at each meal and of the foods served, so that itis possible over the week to make an approximate check between the food enter
ing the house and the meals provided.
13. Before June 1951, detailed records were obtained of changes in larder stocksbetween the beginning and end of the survey week, but such recording was foundto involve so much time and trouble as to affect the response rate adversely, todistort the normal pattern of consumption (though not its total volume) and todepress the normal food expenditure by drawing the housewife's attention to her
existing stocks; these stocks she thereupon tended to use instead of food whichshe would otherwise have purchased during the week. The weighing and recording of larder stocks was therefore discontinued in June 1951, with a resultingimprovement in survey results except those for elderly women living alone(1), whonow, on average, increase their stocks of certain storable foods, particularlysugar and flour, during the survey week. There is evidence that this change intheir normal buying habits is confined to the first half of the survey week.
Although this "impact effect" is not confined to elderly women living alone,comparison of survey results obtained before and after the change of techniqueprovides no evidence that over-purchasing extends to the survey week as a wholein the other groups ; changes in the national averages are consistent with corres
ponding changes in estimates of food supplies moving into consumption.
14. The Survey thus records the quantity of food entering the household, not the
amount actually consumed; it cannot therefore provide frequency distributionsof households classified according to levels of food consumption or nutrition.Averaged over a sufficiently large number of households, the average quantity
(1) Cf. Domestic Food Consumption and Expenditure: 1959, paragraph 58, HMSO, 1961, andsee Piatt, Gray, Parr, Baines, Gayton, Hobson, Hollingsworth, Berry and Washington (1964),"The food purchases of elderly women living alone; a statistical inconsistency and its investigation", British Journal of Nutrition, 18, 413-429.
154 Household Food Consumption and Expenditure: 1969
obtained will, however, agree with the average quantity consumed (in the widestsense, including the quantity wasted or fed to pets) provided purchasing habitsare not upset and that there is no general accumulation or depletion of larderstocks. Such a general change in larder stocks is possible in the short run, orseasonally, but is very unlikely over a longer period of time.
Main Analyses of Survey Data15. The Survey data of food purchases, consumption, expenditure and prices aretabulated for each of 143 categories of foods; details of the classification are
given in Table 1 1 . Apart from the results for the sample as a whole (referred toin the Report as "national averages", "overall averages", or the results for"all households") the regular analyses are four in number:
(i) By region. Nine regions are distinguished, separate results being given for
Wales, for Scotland and for each of the standard regions of England, except
that East Anglia is not treated separately but is combined with the SouthEast region.
(ii) By type of area. Six types of area are distinguished according to degree ofurbanization, viz. London conurbation, provincial conurbations, largertowns, smaller towns, semi-rural areas and rural areas.
(iii) By income group, which for Survey purposes is defined in terms of the grossweekly income of the head of the household. Four broad groups are
distinguished (and described in descending order of the gross income of thehead of the household as groups A, B, C and D), but Group A is dividedinto two sub-groups (Al and A2), and group D into three, viz. householdscontaining one or more earners (group Dl), those containing no earners
(group D2) and households solely or mainly dependent on old age pensions
(abbreviated as OAP). As an exception to the general rule, if the grossweekly income of the head Of the household is within the income range forgroup D and the household contains more than one earner, the income ofthe principal earner is used to determine the income group, even thoughthat earner is not necessarily the head of the household. The ranges ofincome applicable to each group are redefined periodically so as to keep asconstant as possible the proportion of households in each group. The proportions aimed at are:- group Al 2\ per cent, group A2 1\ per cent, group
B 35 per cent, group C 35 per cent, group D 20 per cent. The proportionsactually achieved in 1969 are given in Chapter 3
, paragraph 54.
(iv) By household composition. The following types of family are distinguished :
(a) Household of one man and one woman with, respectively—no other (one or both 55 years of age or over) ; no other (both under 55
years of age); one child (under 15 years of age); two children; three
children; four or more children; one or more adolescents (15 to 20 years
of age, inclusive); adolescents and children.
(b) Other households with—adults only; one or more adolescents but no children; one or more morechildren, with or without adolescents.
Nutritional Analysis of Survey Results16. The energy value and nutrient content of the recorded quantities of foods
consumed (cf. paragraph 14) are evaluated using tables of food compositionwhich make automatic allowance for the presence of inedible material such as
Appendix A 155
bones, skins of fruits and vegetables and the outside leaves of such vegetables as
cabbage, but not for losses of edible material. In addition to making allowancefor inedible waste, allowance is also made in the conversion factors for seasonal
changes in the wastage and nutrient content of certain foods, for example,
potatoes. The nutrient conversion factors are especially compiled for applicationto the 143 categories of foods as classified in the National Food Survey; they are
reviewed annually and revised in the light of accumulating knowledge about the
composition of foods and the relative contribution of separate food items to the
composite codes. The conversion factors, especially the estimates for protein,fat and carbohydrate, are based largely on those given in The Composition ofFoodsa), although the nutritive value of bread and flour is estimated from continuing analyses of flour made by the Government Chemist, and the energy
conversion factors that are used for protein, fat and available carbohydrate(expressed in terms of monosaccharides) are respectively 4, 9 and 3 •75 kcal per
g425. The nutrient conversion factors for minerals and vitamins were thoroughlyrevised for application to the Survey data for 1969 and subsequent years.
17. Allowances are made for losses of vitamin C and thiamin during cooking.The vitamin C contribution from green vegetables is reduced by 75 per cent andthat from other vegetables by 50 per cent. In 1969 appropriate cooking or re
heating losses for thiamin have been applied to items within each major type offood in the diet, i.e. meat, fish, eggs, vegetables, fruit and cereals. The averageretention factors for each food group are based on values derived from an
extensive study of the literature. The weighted average loss of thiamin for the
whole diet is calculated to be about 20 per cent. Values for thiamin shown incertain tables of the Report for earlier years have been made comparable.
18. To allow comparison of the Survey results with the DHSS recommendedintakes of nutrients<4), values for vitamin A (retinol) and nicotinic acid are ex
pressed in terms of equivalents'5' in units of weight. Vitamin D is also expressedin units of weight; 1 i.u. vitamin D=0025 jig cholecalciferol. Energy is expressedin terms of kilocalories and also, in some instances, megajoules; 1,000 kcal =
4184MJ.
Retinol equivalentPreformed vitamin A (retinol) and carotene are added together to give the totalvitamin A activity or retinol equivalent in the diet; 1 \>.g retinol equivalent isdefined as 1 ng retinol or 6 jig p-carotene.(3) In earlier years total vitamin A was
expressed as international units, allowance having been made for (3-carotene
u> Medical Research Council Special Report Series No. 297, by R. A. McCance and E. M.Widdowson, HMSO, 1967.
'-' In order to make some allowance for losses in digestion and to maintain as much conformity as possible with pre- 1960 National Food Survey results. For fuller discussion see HouseholdFood Consumption and Expenditure: 1965, Appendix F, paragraph 14, HMSO, 1967; and see
Southgate & Durnin (1970), "Calorie conversion factors. An experimental re-assessment ofthe factors used in the calculation of the energy value of human diets", British Journal ofNutrition, 24, 517-535.
(3)Department of Health and Social Security, Recommended Intakes of Nutrients for theUnited Kingdom, Reports on Public Health and Medical Subjects, No. 120, HMSO, 1969.
<4)For fuller discussion see "The calculation of nicotinic acid equivalents and retinol equivalents in the British diet", Alison A. Paul (1969), Nutrition, Lond, 23, 131-136.
<•'Because the (3-carotene in milk appears to be more efficiently absorbed than that from othersources, the DHSS report recommended for milk the relationship 2 |zg (3<arotene=l u.gretinol equivalent; this has been adopted.
156 Household Food Consumption and Expenditure: 1969
being less biologically effective than retinol; 1 i.u. of retinol is defined as 0 -3 ngretinol, and therefore values expressed in previous Annual Reports in terms ofinternational units of vitamin A (or retinol) can be converted to retinol equivalents by multiplying by 0-3.
Nicotinic acid equivalent
Because the amino acid tryptophan (which occurs in almost all proteins) can bemetabolised by the body to nicotinic acid, the requirements for nicotinic acidmay be met by both nicotinic acid and tryptophan, 60 mg tryptophan beingequivalent to 1 mg nicotinic acid. The nicotinic acid equivalent in the diet is thesum of the available nicotinic acid, and of the tryptophan divided by 60:nicotinic acid found naturally in cereal foods (other than that added under thepolicy of fortification) is ignored as it occurs in a bound form considered to beunavailable to man. Tables 32 and 33 of the Report show, in addition to nicotinic acid equivalent in the average diet, the tryptophan content'1' and the totalnicotinic acid, which includes forms considered to be unavailable; such
" total"figures are similar to those for nicotinic acid published in the previous reports.
19. The estimates of the energy value and nutrient content of the food obtainedfor consumption are compared with estimates of nutritional need, these beingbased on the recommendations of the Department of Health and Social Security
(Table 9 of this appendix). Such a comparison provides a means of evaluating thenutritional status of groups varying in composition or from year to year but ithas to be remembered that the recommended intakes for nutrients are judged tobe sufficient or more than sufficient for practically all healthy persons in a population —and hence are necessarily in excess of the requirements of most individuals—while the recommended intake for energy is equated with the estimatedaverage requirement of a group, not of individuals. Two sorts of adjustmenthave to be made to the Survey data in order to compare them with the estimates
of nutritutional need. Thus, what might be termed "household recommendedintakes" are assessed, from a knowledge of the age, sex and occupation of themembers of the household, making allowance for the number and types of meals
taken outside the home by persons belonging to the household and inside thehome by visitors (see paragraph 20). Also an assumption is made that 10 percent(2) of all foods, and hence of all nutrients available for consumption, isnot ingested, but is lost through wastage or spoilage in the kitchen or on the
plate or is given to domestic pets (see paragraph 21).
20. Since the main purpose of the Survey is to study the pattern of the diet inthe home (household), its records relate to quantities of food obtained for con
sumption in the home, which are expressed "per person per week". For the
purpose of the Survey a "person" is defined as an individual eating at least
half of his meals at home during the survey week, the meals being weighted
according to the scale set out below; anyone eating fewer meals is a "visitor".
u) Calculated from The amino acid content of foods and biological data on proteins, FAONutritional Studies No. 24, 1970.
<3)This deduction of 10 per cent is somewhat arbitrary, and the degree of food wastage islikely to be far from uniform among different families. With this conventional deduction, theenergy value of the food obtained for consumption on average by all households, which underrationing was very close to the estimated requirements, has since 1954 been from 3 to 11 percent above them, and no doubt wastage vanes with the scarcity, or otherwise, of food.

Appendix A 157
In comparing the estimates of consumption with estimates of nutritional need,the recommended intakes for the household are adjusted to allow for visitors'consumption and for outside consumption by members of the household. It isassumed that the normal meal pattern is that of four meals (breakfast, dinner,tea and supper) each day. A person having all his meals at home during theweek is said to have a total net balance of 1 -00. When meals are eaten away fromhome'1' deductions are made from this total to give a "net balance" of mealseaten at home by that person: the scale of deductions currently used for thispurpose is as follows'3':
per day per week
BreakfastDinnerTeaSupper
002006
0140-420-141 , v
0-04) (a)
Total 0-98(say 1 -00)
(a) These weights are interchangeable, whichever meal isthe larger; if only one evening meal is taken the two weightsare combined.
Meals eaten by visitors are similarly weighted and are added to the householdtotal, so that a visitor's meal cancels a corresponding meal taken out by a similarperson. Household recommended intakes are calculated by reference to the netbalance for each person and for each visitor.
21. The procedure adopted for comparing the estimates of the energy value andnutrient content of food obtained for consumption with estimates of nutritional need is as follows. For each type of household analysed, the recommendedintakes given in Table 9 for each category of person are multiplied by the totalnet balance for that category; the products are summed over all categories (andin practice divided by the total number of persons in that household type) togive average recommended intakes (per person) for the group of households.Recorded nutrient consumptions (per person)—less 10 per cent (see paragraph19)—are then expressed as percentages of these household recommended intakes.Thus, if it is assumed that the nutritional value of similar meals eaten at homeand elsewhere is the same, it can be said that the nutritional value of foodobtained for consumption at home is being related to the nutritional needs ofthe members of the household when they eat at home ; the remainder of thenutritional needs is assumed to be met elsewhere.
Reconciliation of Nutritional Results22. The weighted daily per caput energy requirement of the British population,calculated according to the recommendations of the Department of Health andSocial Security, is about 2,350 kcal (9 ■8 MJ) at the level of ingestion. As the totalsupplies of food available for human consumption in recent years have been
equivalent to about 3,100 kcal (13 0 MJ) per head per day, this implies that
(" Packed meals, such as sandwiches, provided by the housewife for consumption awayfrom home, are treated as if they have been eaten at home.
m These values were changed in January 1960; for a fuller discussion see Household FoodConsumption and Expenditure: 1965, Appendix F, paragraph 16 and Table 2, HMSO, 1967.
158 Household Food Consumption and Expenditure: 1969
wastage (including food fed to animals) is of the order of 700 kcal per head perday, or more than one-fifth of the food supply. Such a large gap between suppliesand physiological requirements cannot yet be satisfactorily explained, but itsoccurrence in all well-developed countries is confirmed by comparing estimates
of the energy value of food supplies in FAO Food Balance Sheets with those ofenergy requirements according to the FAO recommendations. In this countrythe gap between the total supply and household consumption recorded by theSurvey can be bridged ; that between either of these estimates of food consumption and estimated physiological requirements cannot, unless wastage between
the level of measurement and actual intake is considerably greater than ordinarily assumed(1), or unless intakes are markedly in excess of physiological requirements which themselves may be inaccurately assessed.
Reliability of Survey Results23. The results obtained from the Survey are subject to chance variations, as are
all estimates from sampling investigations, but this "sampling error" will notnormally be more than two or three times the standard error. Estimates of thepercentage standard errors applicable to the annual averages of consumption forhouseholds of different composition are given in Table 10 of this Appendix.Estimates of the standard errors of the yearly national averages of expenditure,purchases and prices for each food in the Survey classification were given in the
Annual Report for 1966<2). Usually, the standard errors (and the percentagestandard errors) of the quarterly averages will be approximately double those forthe annual averages, but for some foods which have a marked seasonality the
standard errors can also vary throughout the year; some indication of thisvariation was given in the Annual Report for 1960c3). Estimates of the percentagestandard errors of average nutrient intake and adequacy in the larger familieswere given and discussed in the Annual Report for 1964(4). The estimates of the
standard errors were obtained by applying the formula for a single-stage randomsample and take no account of the complex nature of the sample which incorporates a multi-stage, stratified design. The reduction in sampling variance gainedfrom stratification is almost certainly more than offset by the increase in variancecaused by the use of several stages in the sample design, especially by the
limited number of first-stage units; the estimated standard errors may thereforebe understated in some cases.
(1) See footnote (1) to paragraph 1 of this Appendix.Household Food Consumption and Expenditure: 1966, Appendix E, paragraph 18, and
Table 3, HMSO, 1968.(3>Domestic Food Consumption and Expenditure: 1960, Appendix A, paragraphs 15, 16, and
17 and Tables 12 and 13, HMSO, 1962.<4)Domestic Food Consumption and Expenditure: 1964, Appendix F, paragraph 19 and Table
3, HMSO, 1966.
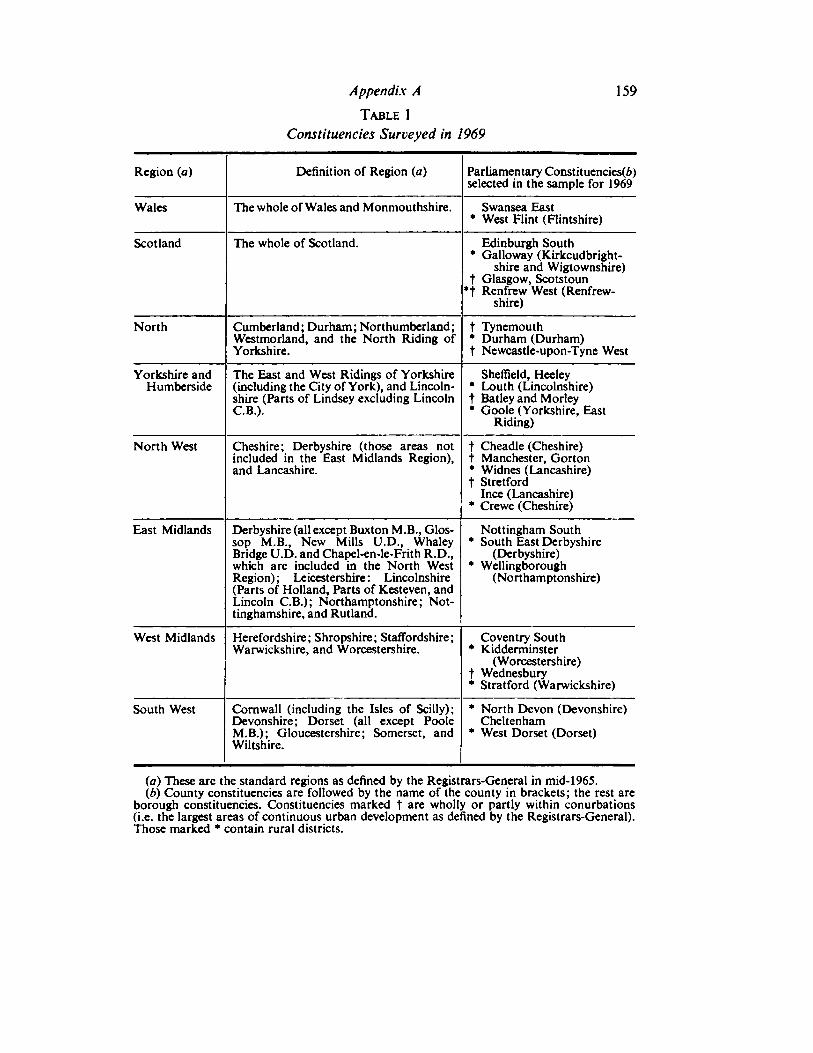
Appendix A 159
Table 1
Constituencies Surveyed in 1969
Region (a) Definition of Region (a) Parliamentary Constituencies^)selected in the sample for 1969
Wales The whole of Wales and Monmouthshire. Swansea East* West Flint (Flintshire)
Scotland The whole of Scotland. Edinburgh South♦ Galloway (Kirkcudbright
shire and Wigtownshire)t Glasgow, Scotstoun
*t Renfrew West (Renfrewshire)
North Cumberland ; Durham ; Northumberland ;
Westmorland, and the North Riding ofYorkshire.
t Tynemouth* Durham (Durham)t Newcastle-upon-Tyne West
Yorkshire andHumberside
The East and West Ridings of Yorkshire(including the City of York), and Lincolnshire (Parts of Lindsey excluding LincolnC.B.).
Sheffield, Heeley* Louth (Lincolnshire)t Batley and Morley* Goole (Yorkshire, East
Riding)
North West Cheshire; Derbyshire (those areas notincluded in the East Midlands Region),and Lancashire.
t Cheadle (Cheshire)t Manchester, Gorton* Widnes (Lancashire)t Stretford
Ince (Lancashire)* Crewe (Cheshire)
East Midlands Derbyshire (all except Buxton M.B., Glos-sop M.B., New Mills U.D., WhaleyBridge U.D. and Chapel-en-le-Frith R.D.,which are included in the North WestRegion); Leicestershire: Lincolnshire(Parts of Holland, Parts of Kesteven, andLincoln C.B.); Northamptonshire; Nottinghamshire, and Rutland.
Nottingham South* South East Derbyshire
(Derbyshire)* Wellingborough
(Northamptonshire)
West Midlands Herefordshire; Shropshire; Staffordshire;Warwickshire, and Worcestershire.
Coventry South* Kidderminster
(Worcestershire)t Wednesbury* Stratford (Warwickshire)
South West Cornwall (including the Isles of Scilly);Devonshire; Dorset (all except PooleM.B.); Gloucestershire; Somerset, andWiltshire.
* North Devon (Devonshire)Cheltenham
• West Dorset (Dorset)
(a) These are the standard regions as defined by the Registrars-General in mid-1965.
(6) County constituencies are followed by the name of the county in brackets; the rest areborough constituencies. Constituencies marked t are wholly or partly within conurbations(i.e. the largest areas of continuous urban development as defined by the Registrars-General).Those marked * contain rural districts.
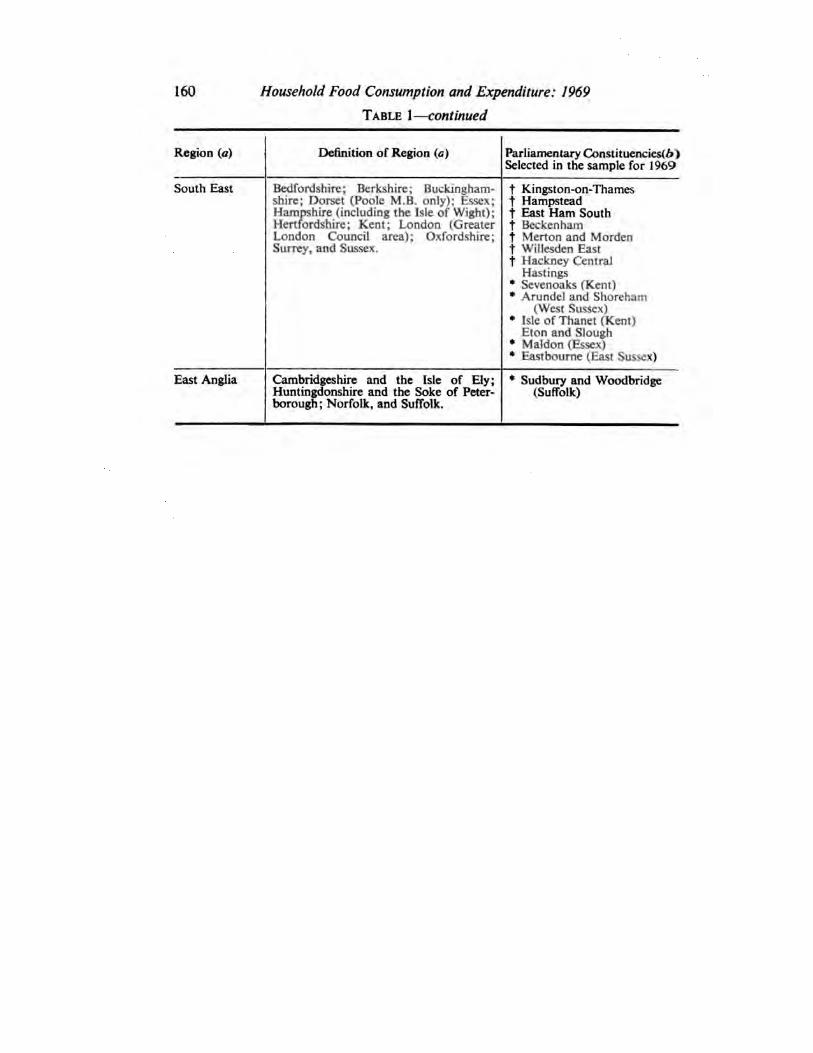
160 Household Food Consumption and Expenditure: 1969
Table 1—continued
Region (a) Definition of Region (o) Parliamentary Constituencies! /) >Selected in the sample for 1969
South East Bedfordshire; Berkshire; Buckinghamshire; Dorset (Poole M.B. only); Essex;Hampshire (including the Isle of Wight);Hertfordshire; Kent; London (GreaterLondon Council area); Oxfordshire;Surrey, and Sussex.
t Kingston-on-Thamest Hampsteadt East Ham Southt Beckenham
f Merton and Mordent Willesden East
t Hackney CentralHastings
* Sevenoaks (Kent)* Arundel and Shoreham
(West Sussex)* Isle of Thanet (Kent)
Eton and Slough* Maldon (Essex)* Eastbourne (East Sussex)
East Anglia Cambridgeshire and the Isle of Ely;Huntingdonshire and the Soke of Peterborough; Norfolk, and Suffolk.
* Sudbury and Woodbridge(Suffolk)
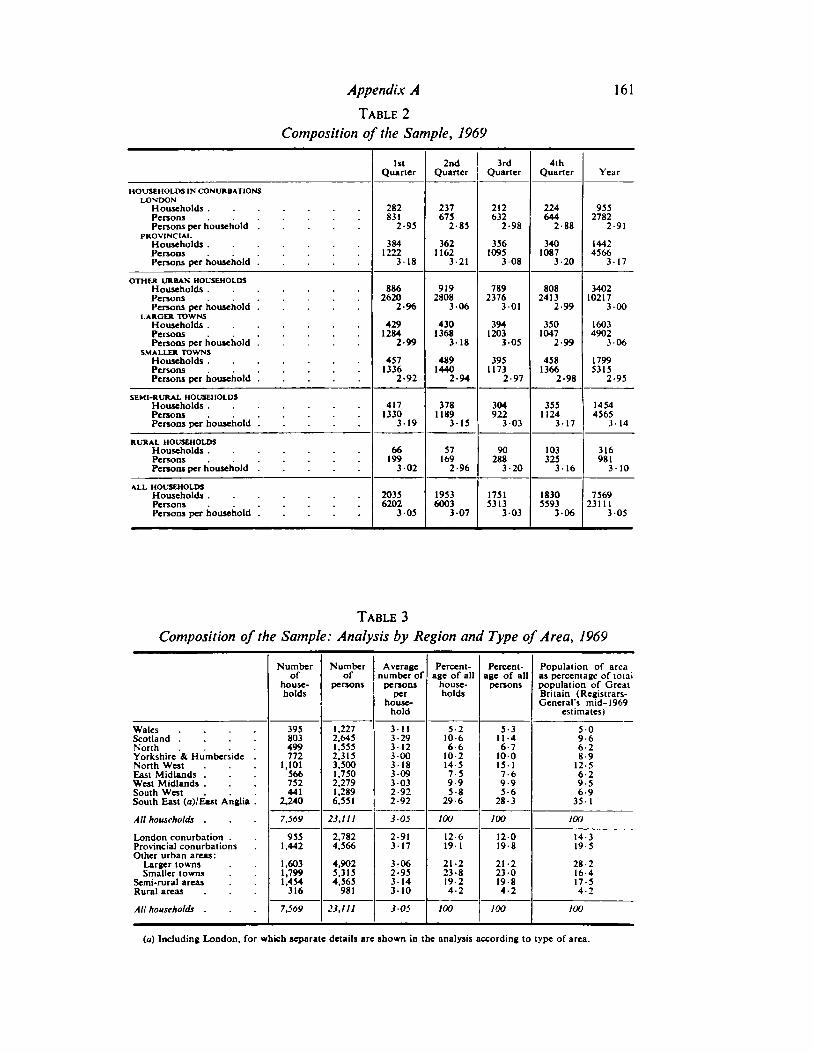
Appendix A 161
Table 2
Composition of the Sample, 1969
HOUSEHOLDS IN CONURBATIONSLONDON
1stQuarter
2ndQuarter
3rdQuarter
4thQuarter Year
Households 282831
2-95
237675
2-85
212632
2-98
224644
9552782
2-91Persons .......Persons per household 2-88
PROVINCIALHouseholds 384
1222318
3621162
3-21
3561095
3-08
3401087
3-20
14424566
317Persons .......Persons per household
OTHER URBAN HOUSEHOLDSHouseholds 886
26202-96
9192808
306
7892376
301
8082413
2-99
340210217
3 00PersonsPersons per household
LARGER TOWNSHouseholds ....... 429
12842-99
4301368
318
3941203
305
3501047
2-99
16034902
306PersonsPersons per household
SMALLER TOWNSHouseholds 437 489
14402-94
3951173
4581366
2-98
17995315
2-95Persons ....... 1336
2-92Persons per household 2-97
SEMI-RURAL HOUSEHOLDSHouseholds 417
1330319
3781189
315
304 3551124
317
14544565
3- 14
RURAL HOUSEHOLDS
Persons per household922
3-03
Households 66199
302
37169
2-96
90288
103325
316
316981
Persons per household 3-20 310
ALL HOUSEHOLDSHouseholds 2035
62023 05
19536003
3-07
17515313
303
18305593
306
756923111
3 05Persons .......Persons per household
Table 3
Composition of the Sample: Analysis by Region and Type of Area, 1969
Number Numberof
Averagenumber of
persons
Percentage of all
households
Percentage of all
persons
Population of areaas percentage of totalpopulation of GreatBritain (Registrars-General's mid-1969
estimates)
ofhouseholds per
household
Wales ....Scotland ....North ....Yorkshire & Humberside .NorthWestEast Midlands .West Midlands .Southwest
395803499772
1,2272,6451,5552,3153,5001,7502,2791,2896,551
3113-293-123-003183093 032-922-92
5- 210-6
5- 3114
509-66-2
1,101566752441
6- 610-214-5
6- 7100131
8- 912-5
7- 59-95-8
7- 69-93-6
6-29- 56-9
South East (a)/East Anglia . 2^40 29-6 28-3 351
AH households . 7J69 23,111 3-05 100 100 100
London conurbation .Provincial conurbationsOther urban areas:
9551,442
2,7824,566
2- 91 12 619 1
12019-8
14-319-53- 17
Larger towns 1,6031,7991,454
316
4,9025,3154,565
981
306 21-223-819-24-2
21-223-019-84-2
28-2Smaller towns
Semi-rural areasRural areas
2- 95 16-43- 14310
17- 54-2
Ail households . 7,569 23,111 3-03 100 100 100
(a) Including London, for which separate details are shown in the analysis according to type of area.
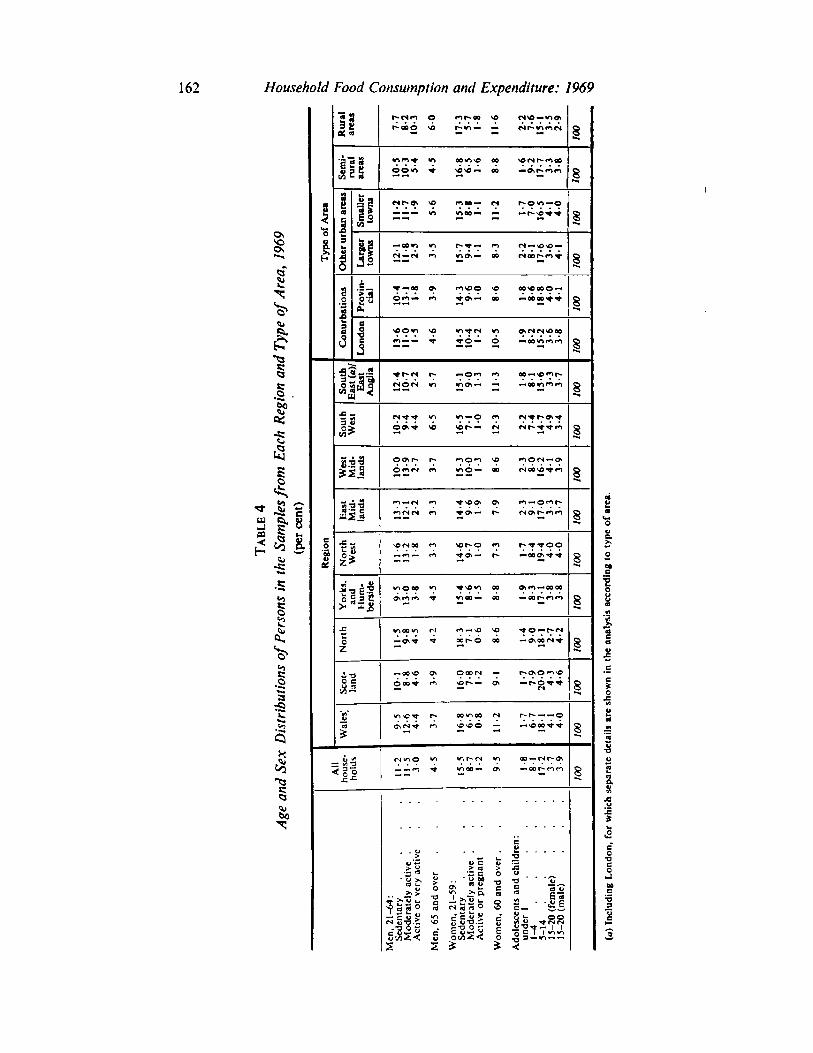
10 ONI 33- © I© ft.
a. ss> 5"II
Table
4
Ag
eand
Sex
Dis
trib
uti
ons
of
Pers
ons
in
the
Sam
ple
sfr
om
Each
Regio
nand
Typ
eof
Are
a,
19
69
(per
cent)
Rura
lare
as
7-7
8-2
10
-3
60
17
-3J-
7 1-8
11
-6
2-2
7-6
15
13
-52
-9
10
0
Sem
i-ru
ral
are
as
10
-51
0-3
5-4
16
-86
-5 1-6
1-6
4-5
8-8
9-2
17
-73
-33
-8
10
0
Typ
eof
Are
a
Oth
er
urb
an
are
as
Sm
alle
rto
wns
11
-21
1-7
1-9
5-6
15
-38
8 11
11
-2
1-7
7-0
16
-54
14
-0
10
0
Larg
er
tow
ns
12
-11
1-8
2-5
3-5
13
-79
-4 1-1
8-3
2-2
81
17
-63
-64
1
10
0
Conurb
ati
ons
Pro
vin
cial
10
-41
3-1
1-8
3-9
14
-39
-6 10
8-6
1-8
8-6
18
-84
-04
-1
10
0
Lond
on
13
-61
1-0
1-5
4-6
14
-51
0-4
1-2
10
-5
1-9
8-2
15
-23
-63
-8
10
0
South
East
(a)/
East
Anglia
12
-41
0-7
2-2
5-7
15
19
-0 1-3
11
-3
1-8
8-1
15
6
3-3
3-7
10
0
South
West
10
-29
-44
-4
6-5
16
57
-1 1-0
12
-3
2-2
7-4
14
-74
-93
-4
10
0
West
Mid
lands
10
-01
3-9
2-7 3-7
15
-31
0-0
1-3
8-6
2-3
80
16
24
1 3-9
10
0
East
Mid
lands
13
-31
2-1
2-2
3-3
14
-49
-6 1-9
7-9
2-3
9-1
17
03
-33
-7
10
0
Regio
n
Nort
hW
est
11
-61
3-2
1-8
3-3
14
-69
-7 1-0
7-3 1-7
8-4
19
-44
-04
0
10
0
York
s.and
Hum
-bers
ide
9-5
13
-03
-8
4-5
15
-48
-6 1-5
8-8 1-9
8-3
17
-13
-83
-8
10
0
Nort
h
11
-59
-84
-5
4-2
18
-37
-10
-6
86 1-4
90
18
-12
-74
-2
10
0
Sco
tla
nd
10
-18
-84
-6 3-9
16
07
-8 12
91 1-7
7-9
20
04
-34
-6
10
0
Wale
s'.
|
9-5
12
-64
-4 3-7
16
-86
-50
-8
11
-2
1-7
6-7
18
-14
-14
-0
10
0
All
house
hold
s
30
4-5
15
-58
-7 1-2
9-5 1-8
17
-23
-73
-9
11
-21
1-5
8-1
10
0
und
er
1
....
1-4
Sed
enta
ry....
Mod
era
tely
act
ive
.
Act
ive
or
very
act
ive
Sed
enta
ry....
Mod
era
tely
act
ive
.
Act
ive
or
pre
gnant
Wom
en,
60
and
over
.
Ad
ole
scents
and
child
ren:
5-1
4
Men,
21
-64
:
Men,
65
and
over
Wom
en,
21
-59
:
15
-20
(fem
ale
)1
5-2
0(m
ale
)
(a)
Incl
ud
ing
Lond
on,
for
whic
hse
para
ted
eta
ilsare
show
nin
the
analy
sis
acc
ord
ing
toty
pe
of
are
a.
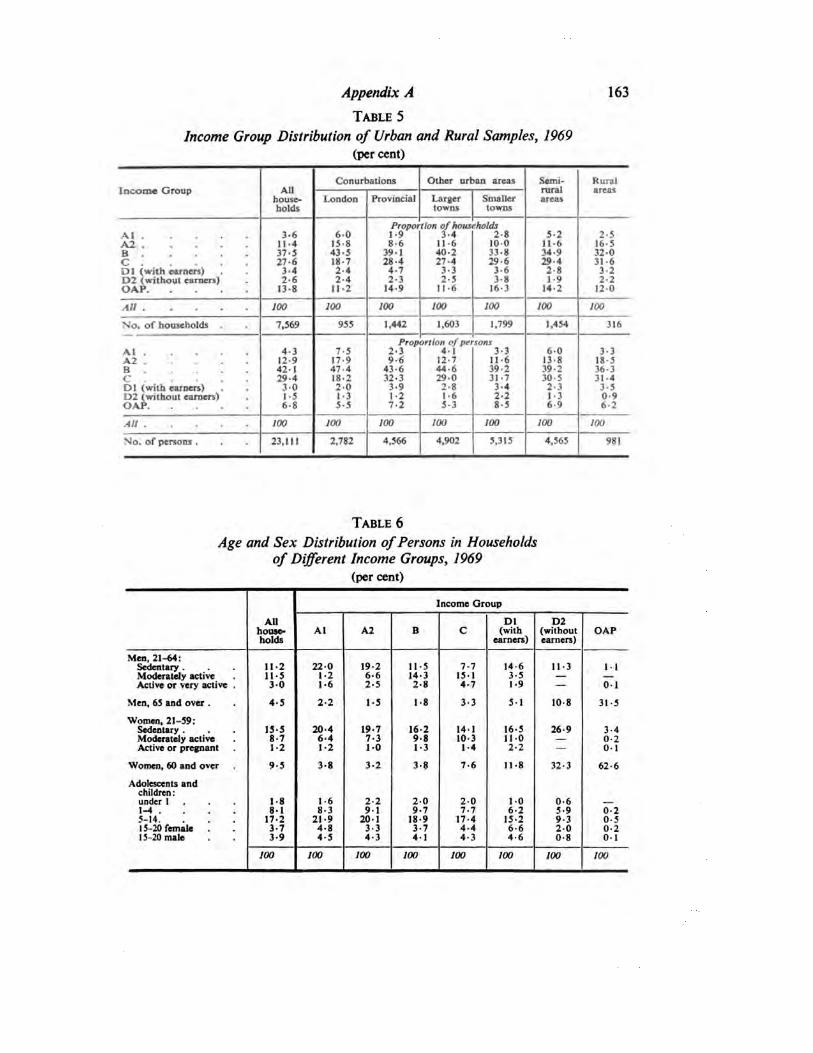
Appendix A 163
Table 5
Income Group Distribution of Urban and Rural Samples, 1969
(per cent)
Income Group AllConurbations Other urban areas Semi-
ruralRural
house London Provincial Larger Smaller areasholds
Proportion of households
towns towns
Al 3-6 60 1-9 3-4 2-8 5-2 2-5A2 11-4 15-8 8-6 11-6 100 11-6 16-5B 37-5 43-5 39- 1 40-2 33-8 34-9 32-0C 27-6 18-7 28-4 27-4 29-6 29-4 31-6D 1 (with earners) 3-4 2-4 4-7 3-3 3-6 2-8 3-2D2 (without earners) 2-6 2-4 2-3 2-5 3-8 1-9 2-2OAP 13-8 112 14-9 11-6 16-3 14-2 120
All 100 100 100 100 100 100 100
No. of households 7,569 955 1,442 1,603 1,799 1,454 316
Proportion of personsAl 4-3 7-5 2-3 41 3-3 6-0 3-3A2 12-9 17-9 9-6 12-7 11-6 13-8 18-5B 42-1 47-4 43-6 44-6 39-2 39-2 36-3C 29-4 18-2 32-3 290 31-7 30-5 314Dl (with earners) 30 2-0 3-9 2-8 3-4 2-3 3-5D2 (without earners) 1-5 1-3 1-2 1-6 2-2 13 0-9OAP 6-8 5-5 7-2 5-3 8-5 6-9 6-2
All 100 100 100 100 100 100 100
No. of persons . 23,111 2,782 4,566 4,902 5,315 4,565 981
Table 6
Age and Sex Distribution of Persons in Households
of Different Income Groups, 1969
(per cent)
All
Income Group
Dl D2house Al A2 B c (with (without OAP
Men, 21-64:
holds earners) earners)
Sedentary . 11-2 220 19-2 11-5 7-7 14-6 11-3 11Moderately active 11-5 1-2 6-6 143 15-1 3-5 — —Active or very active . 30 1-6 2-5 2-8 4-7 1-9 — 01
Men, 65 and over . 4-5 2-2 1-5 1-8 3-3 5-1 10-8 31 -5
Women. 21-59:Sedentary . 15-5 20-4 19-7 16-2 14-1 16-5 26-9 3-4Moderately active 8-7 6-4 7-3 9-8 10-3 110 — 0-2Active or pregnant 1-2 1-2 1-0 1-3 1-4 2-2 — 01
Women, 60 and over 9-5 3-8 3-2 3-8 7-6 11-8 32-3 626
Adolescents andchildren :under 1 1-8 1-6 2-2 2-0 20 1-0 0-61-4 . 81 8-3 9-1 9-7 7-7 6-2 5-9 0-25-14. 17-2 21-9 20- 1 18-9 17-4 15-2 9-3 0-515-20 female 3-7 4-8 3-3 3-7 4-4 6-6 2-0 0-215-20 male 3-9 4-5 4-3 4-1 4-3 4-6 0-8 0-1
100 700 100 100 100 100 100 100
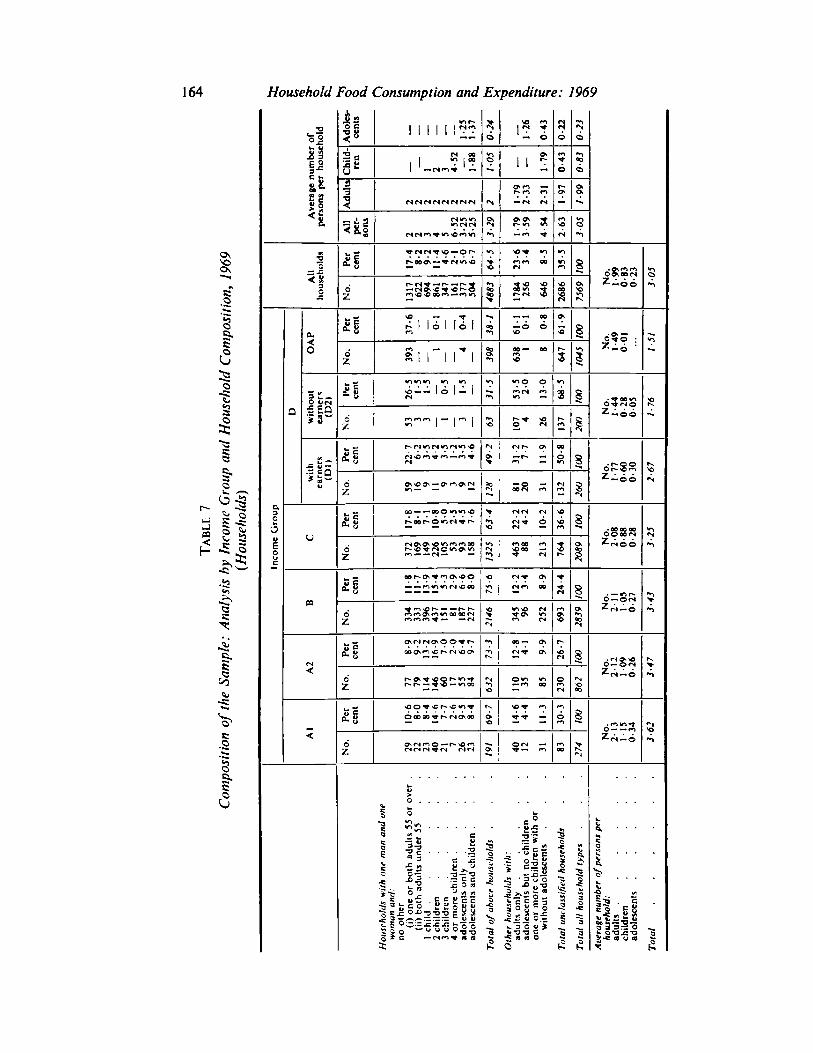
164 Household Food Consumption and Expenditure: 1969
62
o c1 1 1 1 1 Is??
nnt —
SI6
1 1
—m
o
•*rcs<N —©r»
r- m* —i- « r- *—<n no r- © !t*C soooto *
u P
*2W
5 =
fitslis£5
*l 16 I 16 1
I I
g-- 16 I- I »n -
oo——oDOm*r>vor-oot^O»r»fWr-
r>i»©>.\t>wn*»<*»00m ——fN— —
vpr- ——r*mr*i f»>w%oooort
00©\f~>«er-CN>OO\
r- r- * \£>—wi«
O r- vo«nO oooo•»r- n ono©
92 S
^3-
-ais
£-c a u a £"•5 £
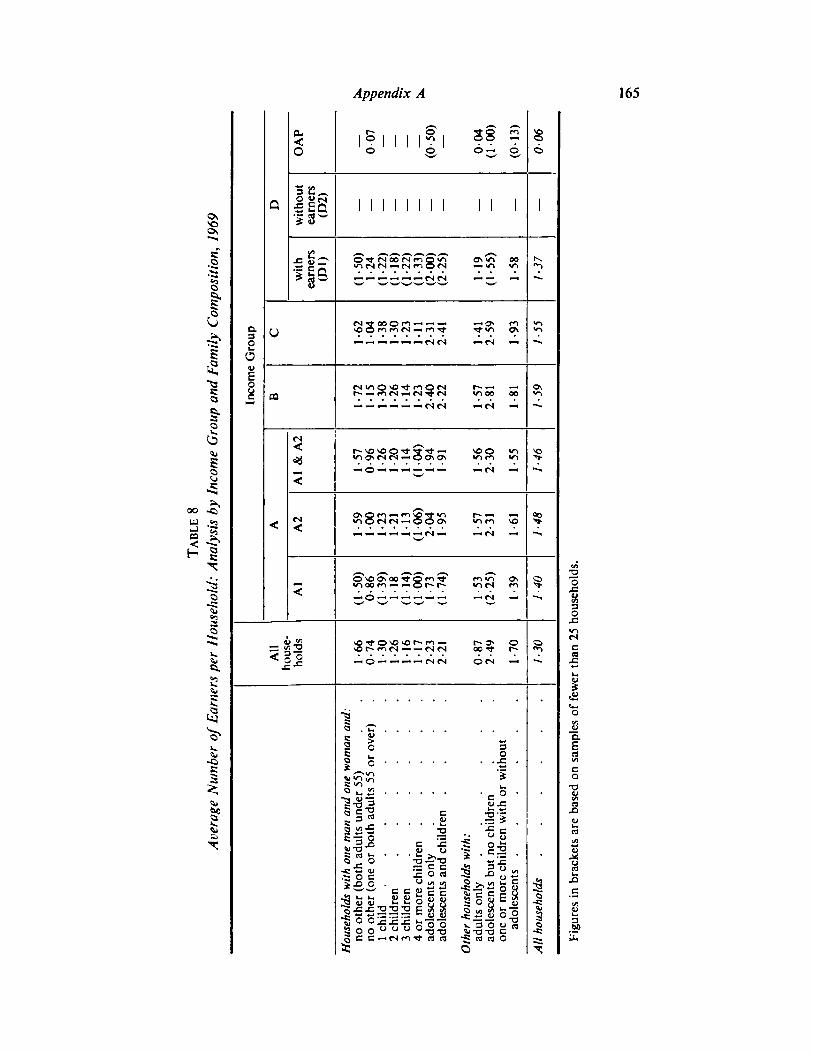
Appendix A 165
1
.3
sI
I
2
1
00 -C"
si B
o-5
3
£
o U«N•SEQ
o.
Oc0Eo
y
— &2
o6 I I
,g 38 2© r< p.
o\<n oo
«NCM .-i — rt
.2)
,!<
M M M M M <S
«S ir>o >o■<*m g (NI- -* r?l M —I CS* <N
mOlNN-OOiOi
mONNrtOOOv mm vo«„_«.* _hN —
9
_. O — — — — nrl00 Tj-
1
oi3
Ox:
cax:
Ia
E
a
Co
■a
«
32
Xic
i
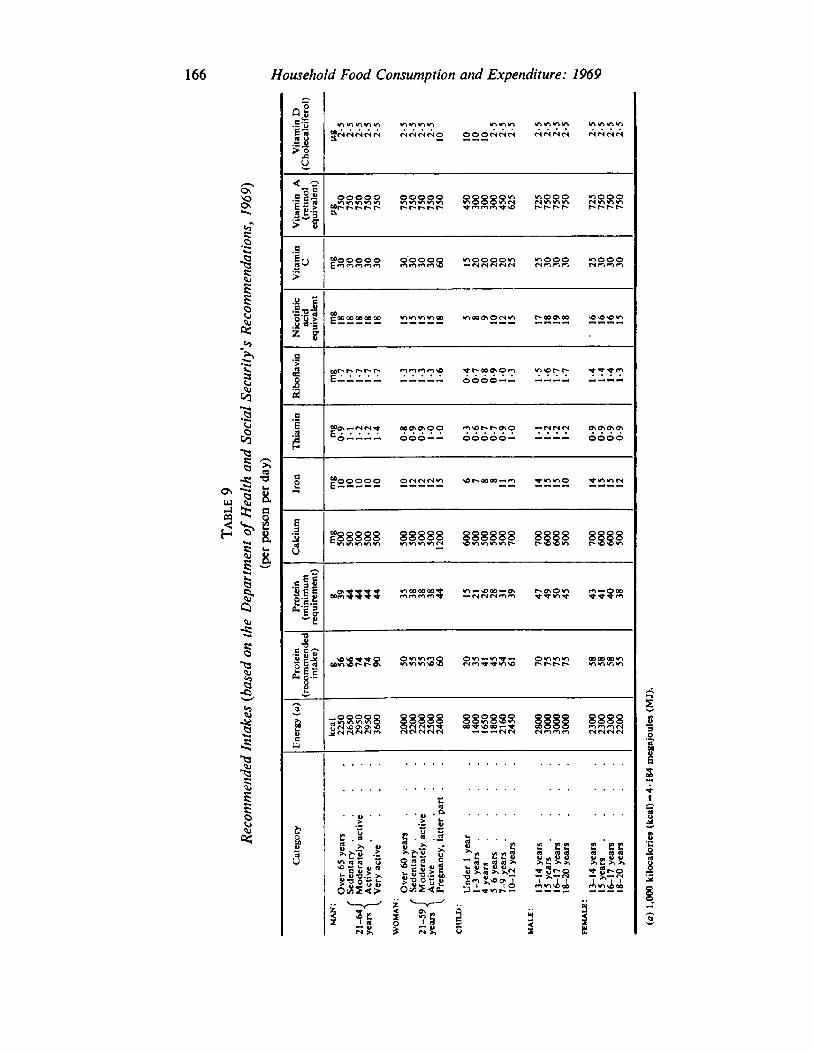
166 Household Food Consumption and Expenditure: 1969
sk:
■a
£5o
3
§
* "5
3£2 8.
i'I-£s:o
■ag
< o.allIII> I
JsJo y >
Z g"
.el|illS|.5
£11
I3
nirnnv\*r\ mmvivi *»<rt mMKfix?(N<N NMMMO OOOWMC1 f>IMMM NMNNNMMMO OOOWMC1 f>IMMM NMNN
ooooo„»0 VI V)*f)WlSk--r»r* r*»r-
ooooo wioo© >nooo
=*ooooo[J f*>c*lf*lf*lCi
©©OOQ
C OO000000OO nvtminn w-iooi^or)»n
»r- r*>r- r- r- f»**>**i**jso ^r-ooa\©c»OCOC--
ooo\<?©o©~« oococ-
0(N(N(S"Ti «r^oooo —in ^■vnn© ^«rt»ncs
fggggg 88888 gggggg gggg gggg"KKiAinm ininmviN yHftir.minr- r- <2*£v> r-»>Z>vi w-i"w-jwuomtn io«oiovi«n *c*r>w-i»nyi r-
»S35?3
»»n*or»p-*
_ooooo OOOOO OOOOQO■3»Sv>w^m5 poooo oomo3v-»
I 5
§888
klgllc=7"^D —t v>r- — m*n«oo
0 a o o
-i«n\C30
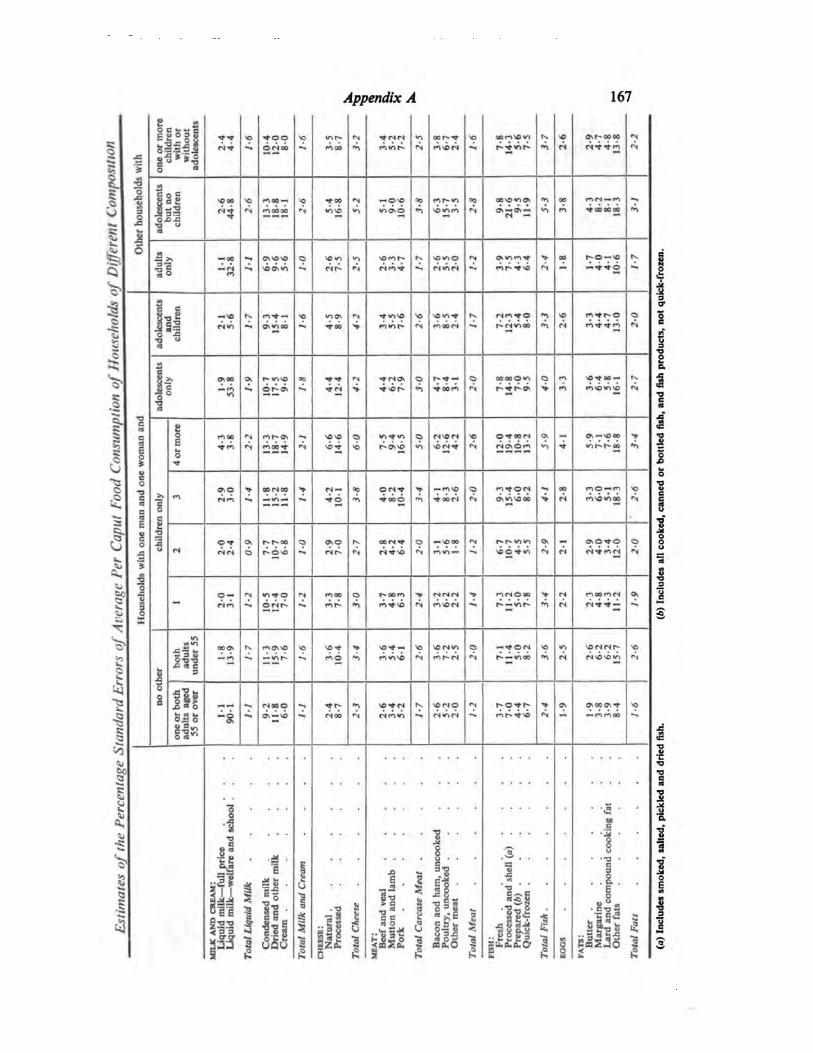
Appendix A 167
S aSSkttlEK °i« *■-* o ■-too « «nr* <N ■*MM <n oor-f ^o 00MSO«O hv o onr- oooo M
1 siiii M-* —. ©moo •*» MOO *t M«or- *n MOM -^ t-^nir- •n D M^^TM MA ■I'M
: '5 o "
L 3 a
|
oB -1 s. sc MOO— >c tOO •N —o\o 00 MMft 03 X 'CiC. •I 00 OM —M —,
j ■"3 *s 222 <N »ri\£> »^> »no\© ■^ SO»ftM M
M — »l M •4-0OOO0O»AOM I
3L.
1- c |k —00 —* o>\ono Q \o«n »0 \o<*ir- tv >om© <N OSVIM-^- '* 00 r^o —« rs.
5 11—M
m*"" soo\«rt —. csr* M MM'*' —i M"rtM -- Mr-^-NO *n -t*o ■*.
g| = fi
§■0^—'Ci N. Mt — ■■c CT\ r-t ^tmo VO *Wt r^ MM^O •n IS Mf r-o cs
^.111 M«n ■*( on"ioo ■"< ■^too>»■ Mmt- *N M0OM -~* t-Mmoo •? M M^^-M Mo -a
j- ■O "^ 1
** 31
fa E4 coo Oi r-w>NO r: "*-* M fNOi O r»t — O ooooov-i Q r^ NO^-00— K^. 11 —M ■* or-o^ ■-. ^■<N> •**r- ■n ■4-oom <N r-*r*» > n MNO«rt\0 M^ o° m •"■ ^
^ ■3*-
•o8
o c8
^lH
o MOO «N nh» *-- CO Q» <r)-*«n o M*OM <o O^J-OOM 0\ — OX—«00 >>^
Ca(4 *tM •1 n«* «N VO-* «o r*Os,« *o «Mt ^j MONOM >n -r v%r-.r-ao •*i
=: a o*" —"" ■* "™ rm MMMM
2 op **
§co
0\O > MNcn *> N — oo OM-* > —M^O O M^-OM -« oo MO —M xiti 1 j>. o MM "■>»—W-l— ^, -*o *n ^■oo© "1 tOOM «N OWtsOOO > ft MVO"O00 r"
-
^, (4 cc 0
te 9I 5
^ ■ 73
g e
o X ©■* o r-r»co o 0\0 ^ OON* Q —NOOO <N r-r-«o«rt Os — OnOiTO ow
J3 ■ «s MN o r-©>o ^. nr* <^i M^-« M M«n— *^ «Otn "1 M MtMM ■-\
i,^
3 ■O«> "o
O — *• vw© •N MOO r-ooM >»■MMM > M(N©00 > M fnooMM ON— mm -^ ©<Nr» *-- Mf- ^n Mf SO P« M^OM —- r- —w-,r- ■n M ri-r-t —
**
•i
0 MM **
^pI
>
? £ — u
mO00> Is. MO\N© vo *«■* ■* v£"<f— ^O \0N>n Q —t©M <o v. NOMMr* so
3 u
3 D I
3
—M —. —tnr- ■^ MO ft MIONO M Mt-M ^i r- —w^oo «*> ct MNOvOVi <-'
A 1
-y 00 ■sis
J c „ —i NOOO "-. ■^r* •1 SO^-M t^. «OM© M r*o^r* > o O*000*i NO
sss -8 -i On—SO —- MOO <N MM«rj »«| MT>M --■ nt-*« f»t — —1-11-100 *>
^r s-Sss o caw*
>5
&
3^~=:
S
u
1
•-<s
■
t
\s!
M
u •D "S
• ■ ■ 'M •.3
■8
>8"
1
! li3
§A **>
■■a% fl I | o ■
J o. . a .
1S 1 1
1 n 8^03o
illii ■ I * q ■o § 1
111"a
3 ii j •■a E 11nil*-a! 1, e c
1|
Jj «^
4
S-o-o \fi
5|
n o
<3
§11 I5f| 11! ■ 3 H ill •• £ 2 s 1 ■•3 S j: 50*0" 'a to PbSJO "5
pa 2 1 7.
fi 2 fi 3 fi
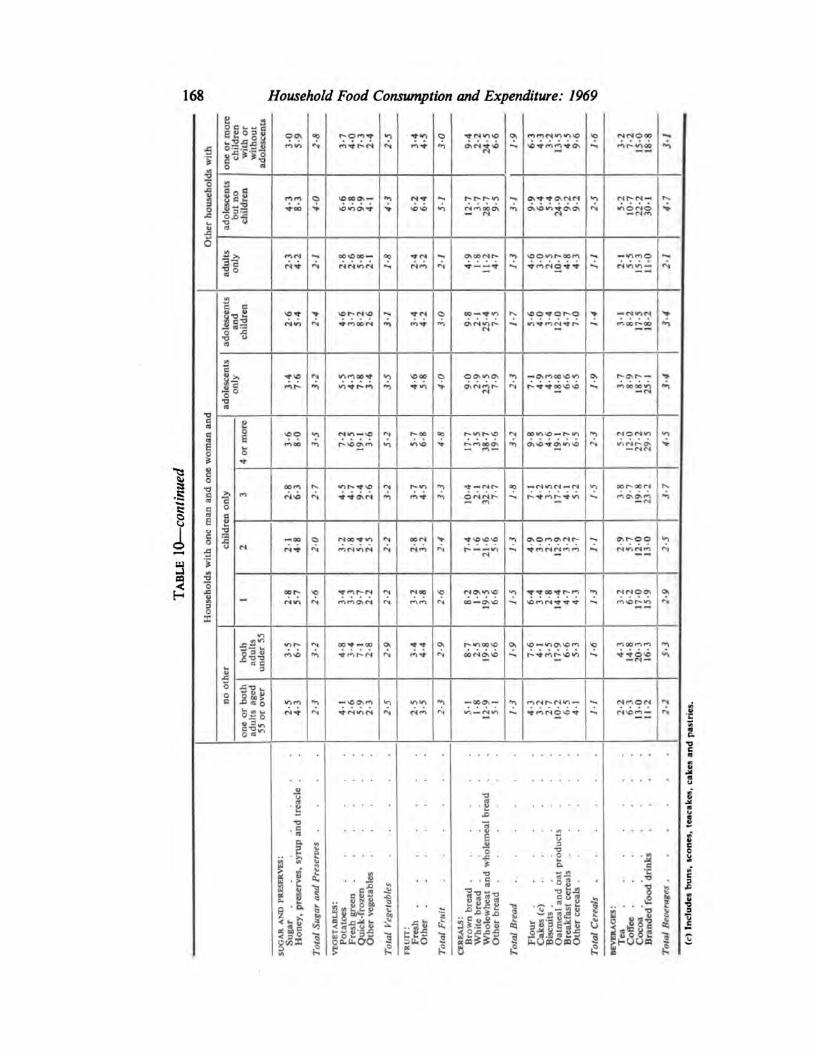
168 Household Food Consumption and Expenditure: 1969
S 30 C i . cc B o 3 B
mil
(11
OA
rs4
r- O ^ "»»•
C x J —
s©v-le^•*■
0OVO0O—rN<Nw~ifN <N
<Nrn00O\
<0♦ Oi
0\ Os*Nr**
NNO09
■a
3
s
1-ICO<
113 u
■♦moorsoo— >nOn<Nvi r-
soo^-or-ovi <tfr-irs -f r-
—rs v-»rs**ioor*»oo
—0\f*>00SO>rtr- rt oo* so
1
r- soosnr- oovi so
oo so—•r- »n
—r4(N
00«*1rs>o
<nr- -«rso44 o\*s
—<N*1<N— fr- -T r■t W
oor- aorsrt a o»g
r-OsO (*»o>c*r*
cor-m ft os<N
M9s«0\000—OS*
sr -* oo♦ r- m NNOOsmsor- *n
S3 o00-«*—oo !-»V)OOSO
oorj ovsoSO— OsSOmr- ♦ r~*o«/"> *nqso
■o« o0 2 o
lisin m »-vO **>
fSw->rs—0OOs—ir,—(Nwi
ill S9 l2
, C o
=2-uC
111!l8f
* BififJ| U,GmO»C
B g I< -In ;
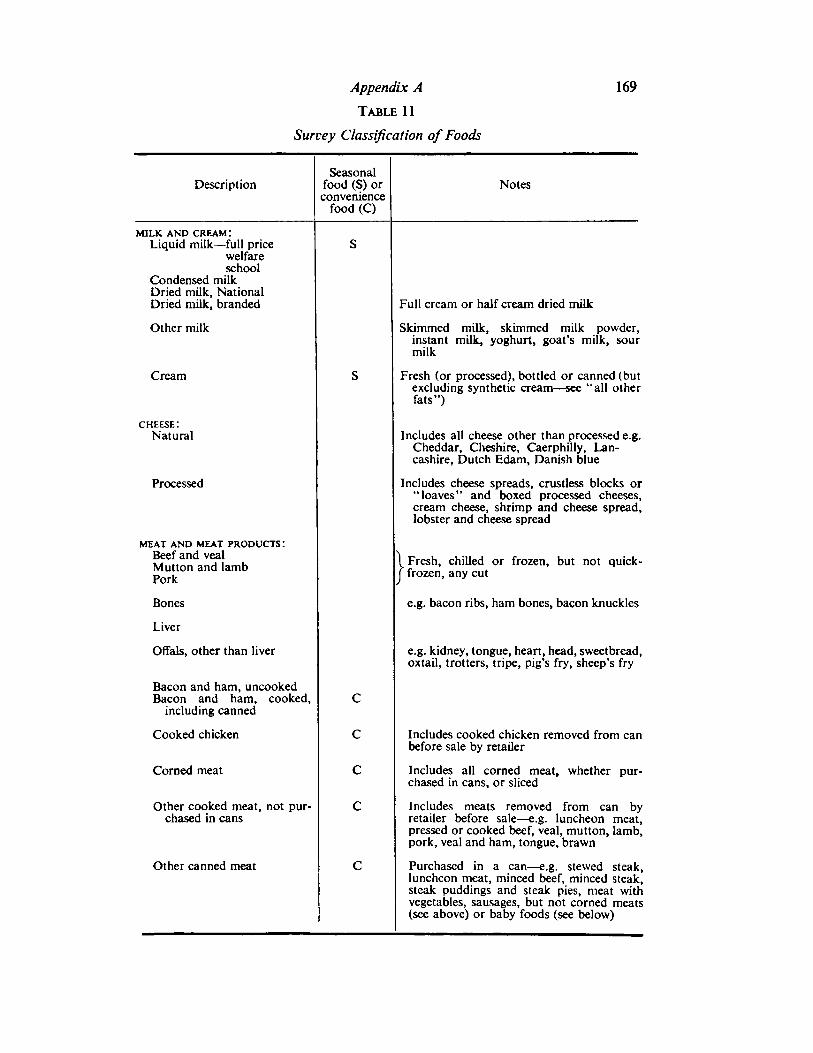
Appendix A 169
Table 11
Survey Classification of Foods
DescriptionSeasonal
food (S) orconvenience
food (Q
Notes
MILK AND CREAM:Liquid milk—full price
welfareschool
Condensed milkDried milk, NationalDried milk, branded
Other milk
Cream
cheese:Natural
Processed
MEAT AND MEAT PRODUCTS:Beef and vealMutton and lambPork
Bones
Liver
Offals, other than liver
Bacon and ham, uncookedBacon and ham, cooked,
including canned
Cooked chicken
Corned meat
Other cooked meat, not purchased in cans
Other canned meat
C
C
C
C
Full cream or half cream dried milk
Skimmed milk, skimmed milk powder,instant milk, yoghurt, goat's milk, sourmilk
Fresh (or processed), bottled or canned (butexcluding synthetic cream —see "all other
fats")
Includes all cheese other than processed e.g.Cheddar, Cheshire, Caerphilly, Lancashire, Dutch Edam, Danish blue
Includes cheese spreads, crustless blocks or"loaves" and boxed processed cheeses,cream cheese, shrimp and cheese spread,lobster and cheese spread
1 Fresh, chilled or frozen, but not quick-
J frozen, any cut
e.g. bacon ribs, ham bones, bacon knuckles
e.g. kidney, tongue, heart, head, sweetbread,oxtail, trotters, tripe, pig's fry, sheep's fry
Includes cooked chicken removed from canbefore sale by retailer
Includes all corned meat, whether purchased in cans, or sliced
Includes meats removed from can byretailer before sale—e.g. luncheon meat,pressed or cooked beef, veal, mutton, lamb,pork, veal and ham, tongue, brawn
Purchased in a can —e.g. stewed steak,luncheon meat, minced beef, minced steak,steak puddings and steak pies, meat withvegetables, sausages, but not corned meats(see above) or baby foods (see below)
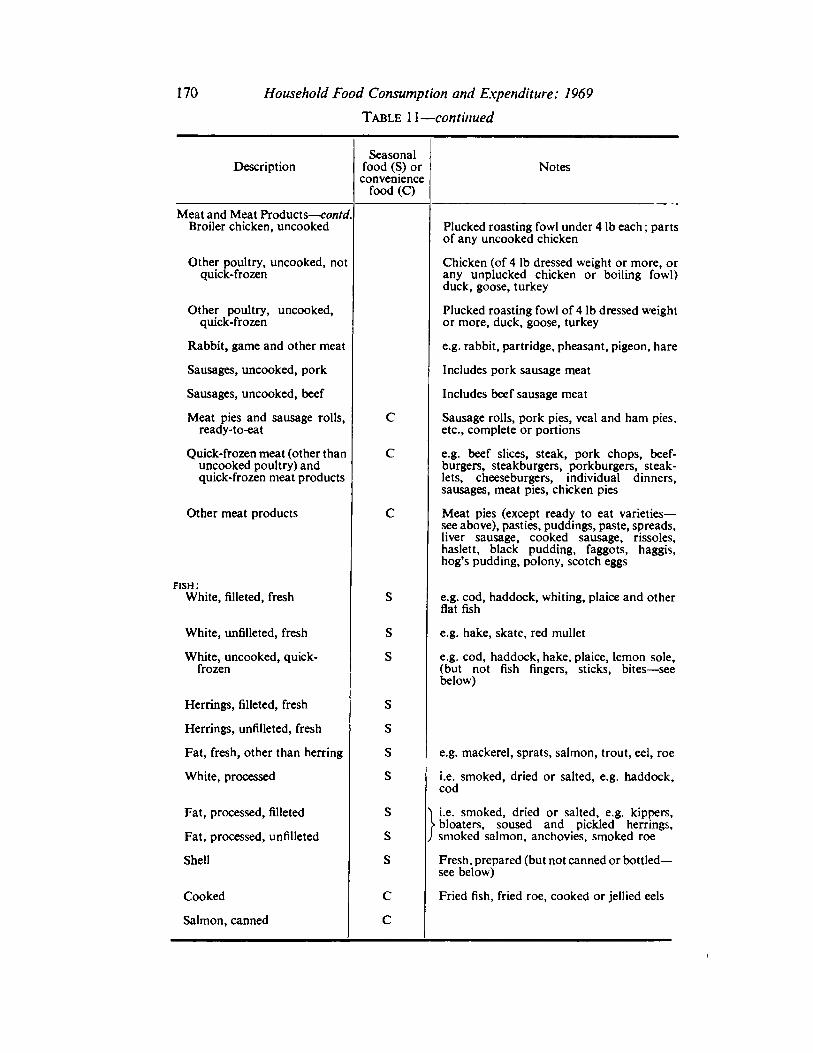
170 Household Food Consumption and Expenditure: 1969
Table 11 —continued
DescriptionSeasonal
food (S) orconvenience
food (C)
Meat and Meat Products —contd.Broiler chicken, uncooked
Other poultry, uncooked, notquick-frozen
Other poultry, uncooked,quick-frozen
Rabbit, game and other meat
Sausages, uncooked, pork
Sausages, uncooked, beef
Meat pies and sausage rolls,ready-to-eat
Quick-frozen meat (other thanuncooked poultry) andquick-frozen meat products
Other meat products
C
C
fish:White, filleted, fresh S e.g. cod, haddock, whiting, plaice and other
flatfish
White, unfilleted, fresh S e.g. hake, skate, red mullet
White, uncooked, quick-frozen
S e.g. cod, haddock, hake, plaice, lemon sole,(but not fish fingers, sticks, bites—see
below)
Herrings, filleted, fresh S
Herrings, unfilleted, fresh S
Fat, fresh, other than herring S e.g. mackerel, sprats, salmon, trout, eel, roe
White, processed s i.e. smoked, dried or salted, e.g. haddock,cod
Fat, processed, filleted
Fat, processed, unfilleted
s
s
1i.e. smoked, dried or salted, e.g. kippers,
> bloaters, soused and pickled herrings,J smoked salmon, anchovies, smoked roe
Shell s Fresh, prepared (but not canned or bottled —see below)
Cooked c Fried fish, fried roe, cooked or jellied eels
Salmon, canned c
Plucked roasting fowl under 4 lb each ; partsof any uncooked chicken
Chicken (of 4 lb dressed weight or more, orany unplucked chicken or boiling fowl)duck, goose, turkey
Plucked roasting fowl of 4 lb dressed weightor more, duck, goose, turkey
e.g. rabbit, partridge, pheasant, pigeon, hare
Includes pork sausage meat
Includes beef sausage meat
Sausage rolls, pork pies, veal and ham pies,etc., complete or portions
e.g. beef slices, steak, pork chops, beefburgers, steakburgers, porkburgers, steak-lets, cheeseburgers, individual dinners,sausages, meat pies, chicken pies
Meat pies (except ready to eat varieties —see above), pasties, puddings, paste, spreads,liver sausage, cooked sausage, rissoles,haslett, black pudding, faggots, haggis,hog's pudding, polony, scotch eggs
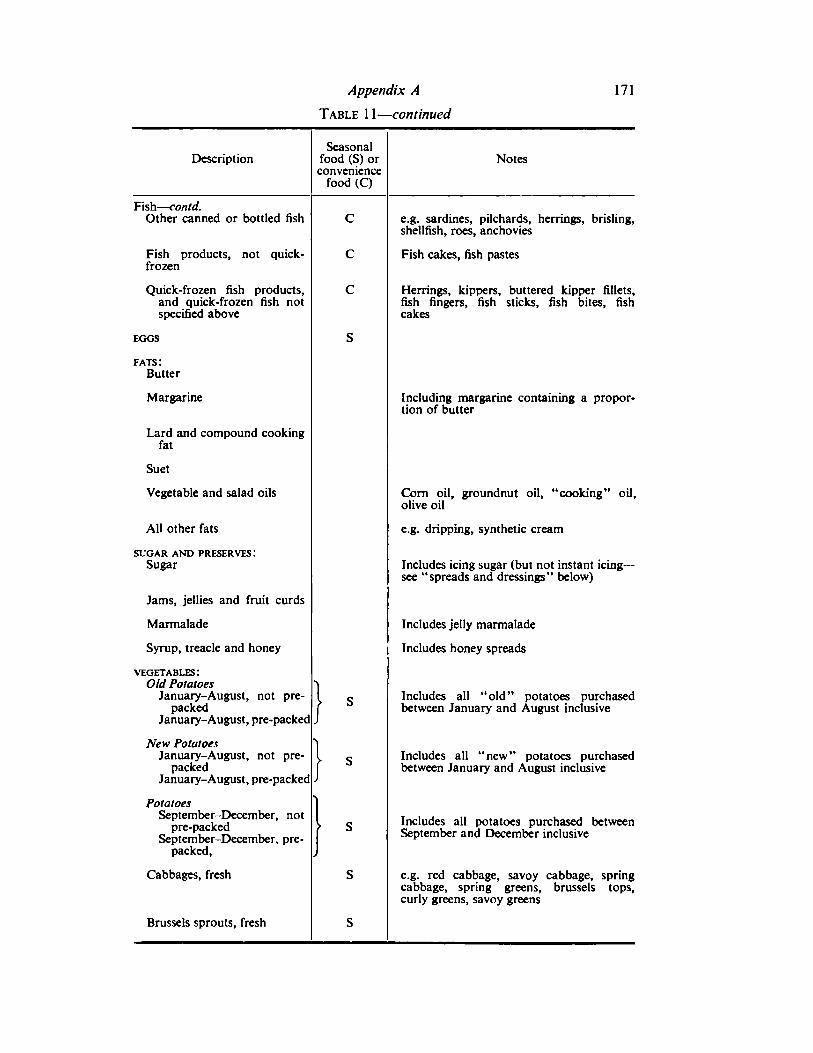
Appendix A 171
Table 11 — continued
DescriptionSeasonal
food (S) orconvenience
Notes
Fish —contd.Other canned or bottled fish
food(Q
C e.g. sardines, pilchards, herrings, brisling,shellfish, roes, anchovies
Fish products, not quick-frozen
C Fish cakes, fish pastes
Quick-frozen fish products,and quick-frozen fish notspecified above
c Herrings, kippers, buttered kipper fillets,fish fingers, fish sticks, fish bites, fishcakes
MUD
fats:Butter
Margarine Including margarine containing a proportion of butter
Lard and compound cookingfat
Suet
Vegetable and salad oils Corn oil, groundnut oil, "cooking" oil,olive oil
All other fats e.g. dripping, synthetic cream
SUGAR AND PRESERVES:Sugar Includes icing sugar (but not instant icing —
see "spreads and dressings" below)
Jams, jellies and fruit curds
Marmalade Includes jelly marmalade
Syrup, treacle and honey Includes honey spreads
vegetables:Old Potatoes
January-August, not prepacked
}• Includes all "old" potatoes purchased
between January and August inclusiveJanuary-August, pre-packed
New PotatoesJanuary-August, not pre
packed}
• Includes all "new" potatoes purchasedbetween January and August inclusive
January-August, pre-packed
PotatoesSeptember-December, not
pre-packed SIncludes all potatoes purchased betweenSeptember and December inclusiveSeptember-December, pre
packed,
Cabbages, fresh s e.g. red cabbage, savoy cabbage, springcabbage, spring greens, brussels tops,curly greens, savoy greens
Brussels sprouts, fresh s

172 Household Food Consumption and Expenditure: 1969
Table 11 —continued
Seasonalfood (S) orconvenience
Description Notes
food (Q
Vegetables —contd.Cauliflowers, fresh S Includes heading broccoli
Leafy salads, fresh S e.g. lettuce, endive, watercress, mustard &cress
Peas, fresh S
Peas, quick-frozen c
Beans, fresh s
Beans, quick-frozen c
Other fresh green vegetables s e.g. spinach, spinach beet, sproutingbroccoli, kale, turnip tops
Carrots, fresh s
Turnips and swedes, fresh s
Other root vegetables, fresh s e.g. parsnips, beetroot, kohlrabi, artichokes,horseradish
Onions, shallots, leeks, fresh s
Cucumbers, fresh s
Mushrooms, fresh s
Miscellaneous fresh vegetables s e.g. celery, radishes, marrow, asparagus,celeriac, sea-kale, chicory, pimentoes, aubergines, corn-on-the-cob, salsify, pot herbs
Canned peas c Garden, processed
Canned beans c Includes baked beans, broad beans, butterbeans, etc. but not runner beans or kidneybeans (see below)
Canned vegetables (other thanpulses or potatoes)
c e.g. carrots, beetroot, celery, spinach,runner beans, kidney beans, mixed vegetables, sweet corn, mushrooms, asparagustips, but not baby foods (see below)
Dried pulses, other than air- e.g. lentils, split peas, mixed barley, peasand lentils
Air-dried vegetables c e.g. peas, beans, onion flakes
Chips, excluding quick-frozen c
Other potato products, notquick-frozen
c e.g. crisps and sticks, puffs, potato scones,cakes, pies, salad, instant potato, cannedpotatoes
Other vegetable products c e.g. vegetable salad, sauerkraut, peasemeal,pease pudding, cheese and onion pie
All quick-frozen vegetablesand vegetable products, notspecified above
c e.g. asparagus, broccoli, brussels sprouts,cauliflower, mixed vegetables, spinach,corn-on-the-cob, potato chips
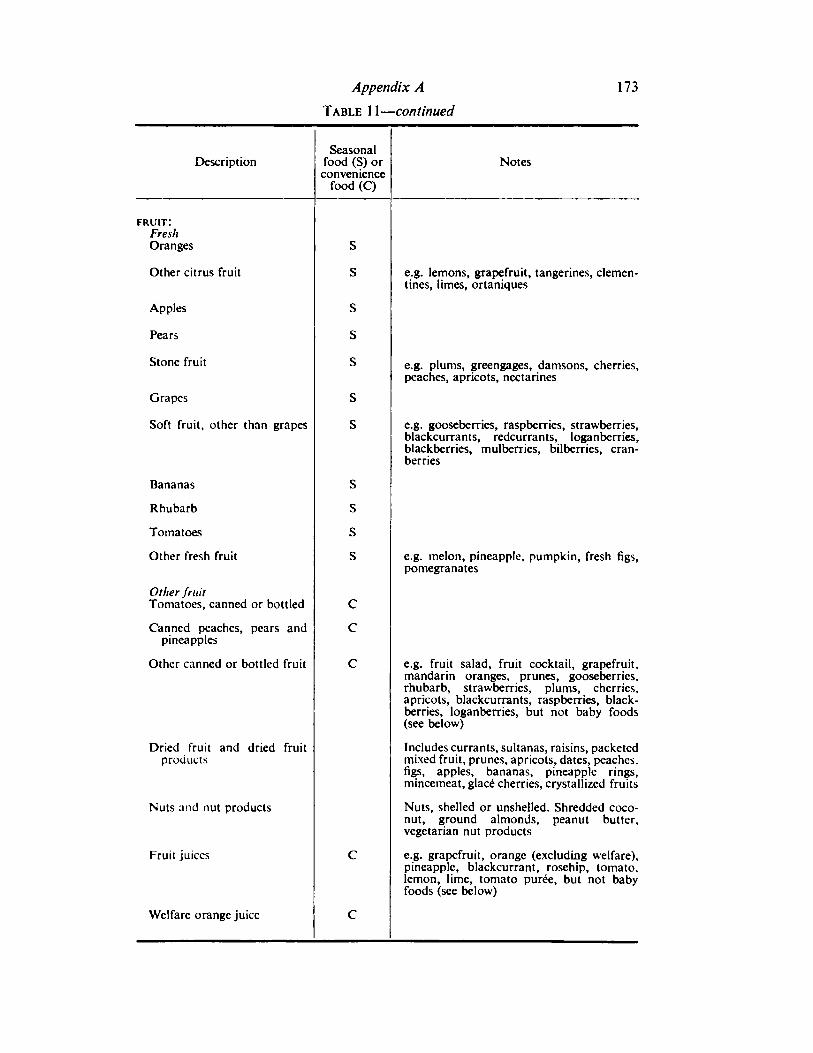
Appendix A 173
Table 11 —continued
DescriptionSeasonal
food (S) orconvenience
Notes
fruit:FreshOranges
food(C)
S
Other citrus fruit S e.g. lemons, grapefruit, tangerines, Clementines, limes, ortaniques
Apples S
Pears S
Stone fruit S e.g. plums, greengages, damsons, cherries,peaches, apricots, nectarines
Grapes S
Soft fruit, other than grapes S e.g. gooseberries, raspberries, strawberries,blackcurrants, redcurrants, loganberries,blackberries, mulberries, bilberries, cranberries
Bananas S
Rhubarb s
Tomatoes s
Other fresh fruit s e.g. melon, pineapple, pumpkin, fresh figs,pomegranates
Other fruitTomatoes, canned or bottled c
Canned peaches, pearspineapples
and c
Other canned or bottled fruit c e.g. fruit salad, fruit cocktail, grapefruit,mandarin oranges, prunes, gooseberries,rhubarb, strawberries, plums, cherries,apricots, blackcurrants, raspberries, blackberries, loganberries, but not baby foods(see below)
Dried fruit and driedproducts
fruit Includes currants, sultanas, raisins, packetedmixed fruit, prunes, apricots, dates, peaches,figs, apples, bananas, pineapple rings,mincemeat, glace cherries, crystallized fruits
Nuts and nut products Nuts, shelled or unshelled. Shredded coconut, ground almonds, peanut butter,vegetarian nut products
Fruit juices c e.g. grapefruit, orange (excluding welfare),pineapple, blackcurrant, rosehip, tomato,lemon, lime, tomato puree, but not babyfoods (see below)
Welfare orange juice c
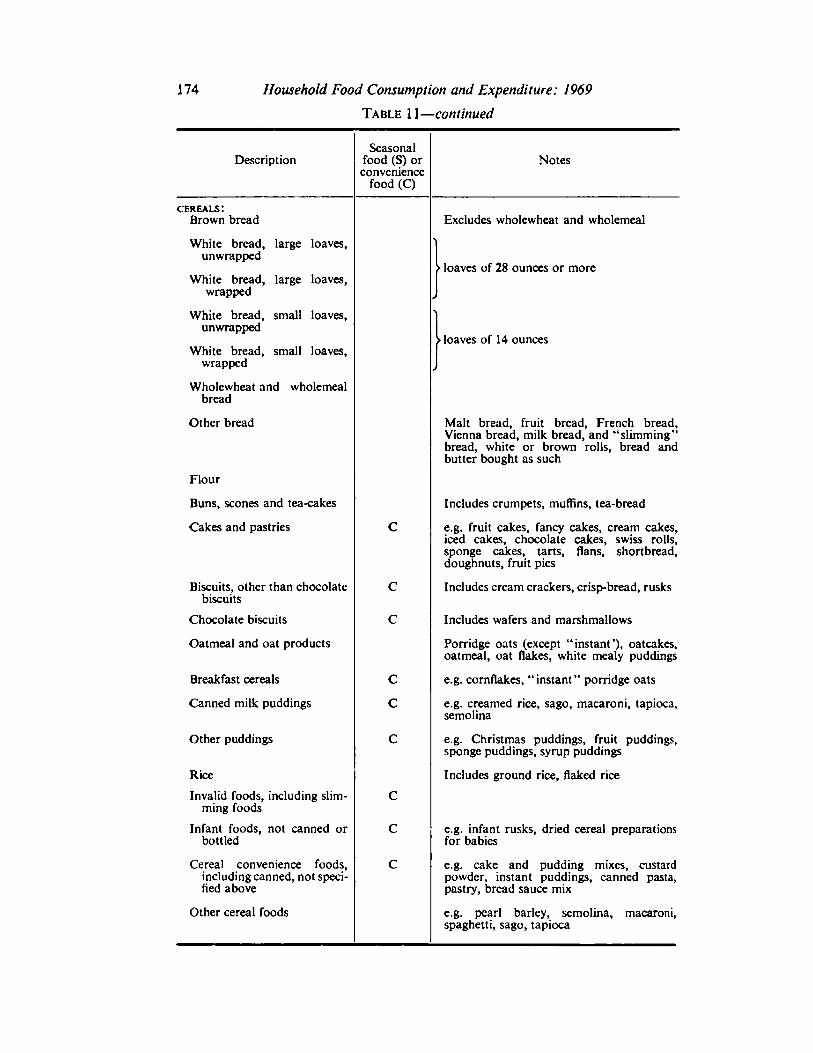
174 Household Food Consumption and Expenditure: 1969
Table 11 —continued
Seasonalfood (S) orconvenience
Description Notes
food (C)
cereals:Brown bread Excludes wholewheat and wholemeal
White bread, large loaves,unwrapped
•loaves of 28 ounces or moreWhite bread, large loaves,
wrapped
White bread, small loaves,unwrapped
|loaves of 14 ounces
White bread, small loaves,wrapped
Wholewheat and wholemealbread
Other bread Malt bread, fruit bread, French bread,Vienna bread, milk bread, and "slimming"bread, white or brown rolls, bread andbutter bought as such
Flour
Buns, scones and tea-cakes Includes crumpets, muffins, tea-bread
Cakes and pastries C e.g. fruit cakes, fancy cakes, cream cakes,iced cakes, chocolate cakes, swiss rolls,sponge cakes, tarts, flans, shortbread,doughnuts, fruit pies
Biscuits, other than chocolatebiscuits
C Includes cream crackers, crisp-bread, rusks
Chocolate biscuits C Includes wafers and marshmallows
Oatmeal and oat products Porridge oats (except "instant'), oatcakes,oatmeal, oat flakes, white mealy puddings
Breakfast cereals c e.g. cornflakes, "instant" porridge oats
Canned milk puddings c e.g. creamed rice, sago, macaroni, tapioca,semolina
Other puddings c e.g. Christmas puddings, fruit puddings,sponge puddings, syrup puddings
Rice Includes ground rice, flaked rice
Invalid foods, including slimming foods
c
Infant foods, not canned orbottled
c e.g. infant rusks, dried cereal preparationsfor babies
Cereal convenience foods,including canned, not specified above
c e.g. cake and pudding mixes, custardpowder, instant puddings, canned pasta,pastry, bread sauce mix
Other cereal foods e.g. pearl barley, semolina, macaroni,spaghetti, sago, tapioca
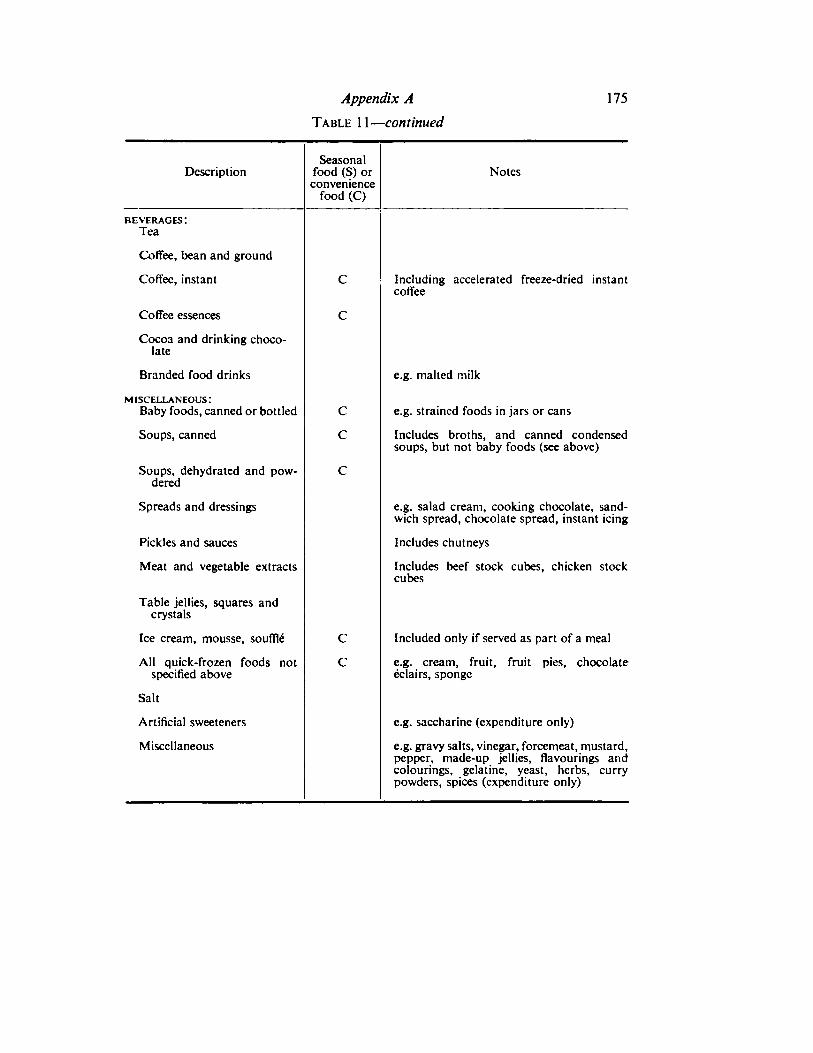
Appendix A 175
Table 11 — continued
Seasonalfood (S) orconvenience
Description Notes
food (C)
beverages:Tea
Coffee, bean and ground
Coffee, instant C Including accelerated freeze-dried instantcoffee
Coffee essences C
Cocoa and drinking chocolate
Branded food drinks e.g. malted milk
miscellaneous:Baby foods, canned or bottled c e.g. strained foods in jars or cans
Soups, canned c Includes broths, and canned condensedsoups, but not baby foods (see above)
Soups, dehydrated and powdered
c
Spreads and dressings e.g. salad cream, cooking chocolate, sandwich spread, chocolate spread, instant icing
Pickles and sauces Includes chutneys
Meat and vegetable extracts Includes beef stock cubes, chicken stockcubes
Table jellies, squares andcrystals
Ice cream, mousse, souffte c Included only if served as part of a meal
All quick-frozen foods notspecified above
c e.g. cream, fruit, fruit pies, chocolateeclairs, sponge
Salt
Artificial sweeteners e.g. saccharine (expenditure only)
Miscellaneous e.g. gravy salts, vinegar, forcemeat, mustard,pepper, made-up jellies, flavourings andcolourings, gelatine, yeast, herbs, currypowders, spices (expenditure only)
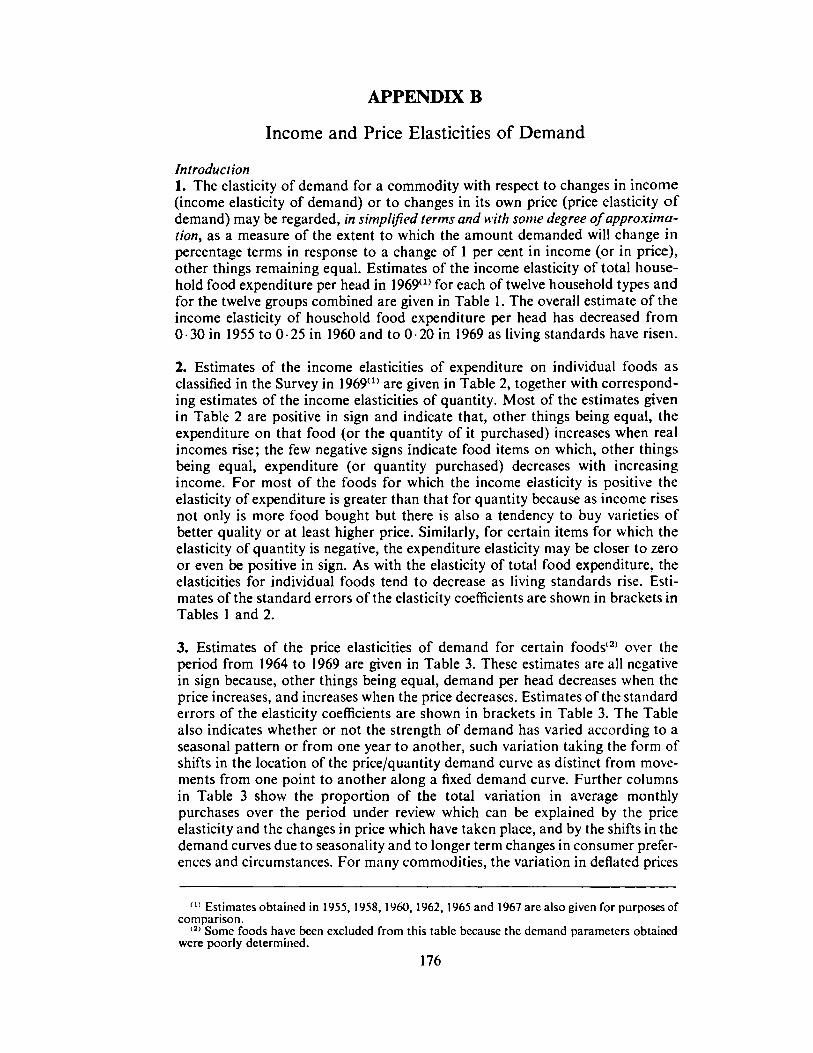
APPENDIX B
Income and Price Elasticities of Demand
Introduction1. The elasticity of demand for a commodity with respect to changes in income
(income elasticity of demand) or to changes in its own price (price elasticity ofdemand) may be regarded, in simplified terms and with some degree ofapproximation, as a measure of the extent to which the amount demanded will change inpercentage terms in response to a change of 1 per cent in income (or in price),other things remaining equal. Estimates of the income elasticity of total house
hold food expenditure per head in 1969(1) for each of twelve household types and
for the twelve groups combined are given in Table 1. The overall estimate of theincome elasticity of household food expenditure per head has decreased from0-30 in 1955 to 0-25 in 1960 and to 0-20 in 1969 as living standards have risen.
2. Estimates of the income elasticities of expenditure on individual foods as
classified in the Survey in 1969(1) are given in Table 2, together with corresponding estimates of the income elasticities of quantity. Most of the estimates given
in Table 2 are positive in sign and indicate that, other things being equal, theexpenditure on that food (or the quantity of it purchased) increases when real
incomes rise; the few negative signs indicate food items on which, other thingsbeing equal, expenditure (or quantity purchased) decreases with increasingincome. For most of the foods for which the income elasticity is positive the
elasticity of expenditure is greater than that for quantity because as income rises
not only is more food bought but there is also a tendency to buy varieties ofbetter quality or at least higher price. Similarly, for certain items for which the
elasticity of quantity is negative, the expenditure elasticity may be closer to zeroor even be positive in sign. As with the elasticity of total food expenditure, the
elasticities for individual foods tend to decrease as living standards rise. Estimates of the standard errors of the elasticity coefficients are shown in brackets inTables 1 and 2.
3. Estimates of the price elasticities of demand for certain foods(S) over the
period from 1964 to 1969 are given in Table 3. These estimates are all negative
in sign because, other things being equal, demand per head decreases when the
price increases, and increases when the price decreases. Estimates of the standarderrors of the elasticity coefficients are shown in brackets in Table 3. The Tablealso indicates whether or not the strength of demand has varied according to a
seasonal pattern or from one year to another, such variation taking the form ofshifts in the location of the price/quantity demand curve as distinct from move
ments from one point to another along a fixed demand curve. Further columnsin Table 3 show the proportion of the total variation in average monthlypurchases over the period under review which can be explained by the price
elasticity and the changes in price which have taken place, and by the shifts in the
demand curves due to seasonality and to longer term changes in consumer prefer
ences and circumstances. For many commodities, the variation in deflated prices
(" Estimates obtained in 1955, 1958, 1960, 1962, 1965 and 1967 are also given for purposes ofcomparison.
<2)Some foods have been excluded from this table because the demand parameters obtainedwere poorly determined.
176
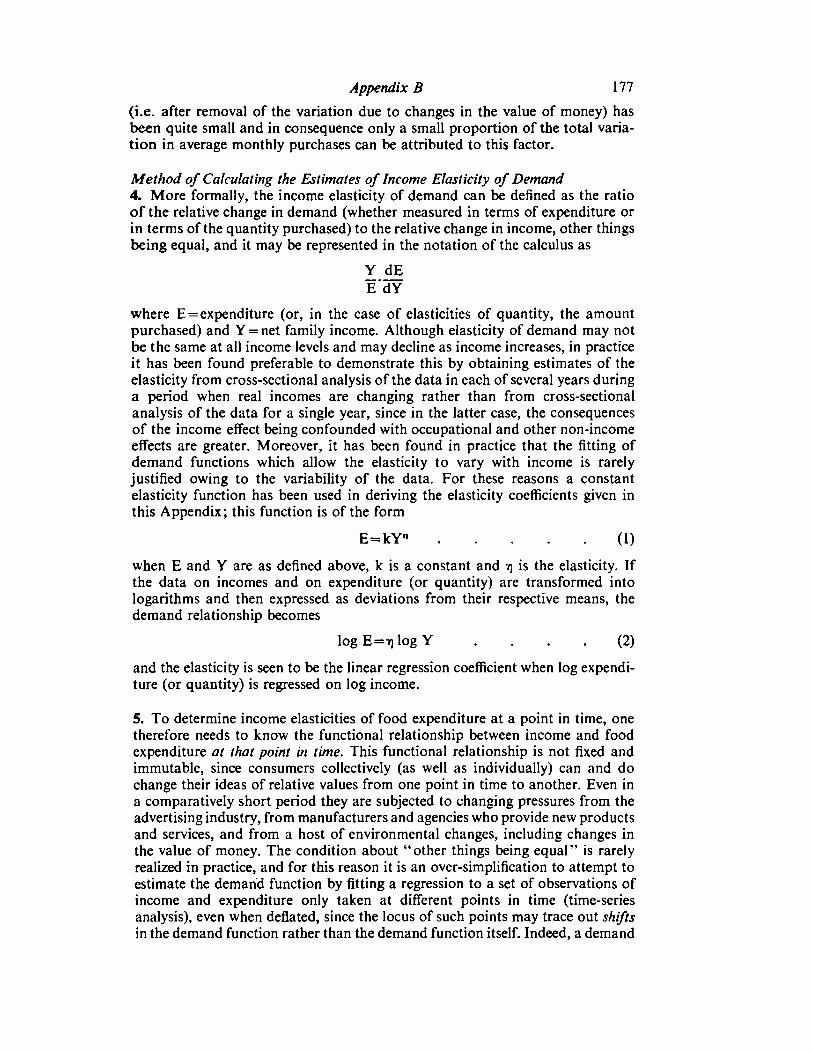
Appendix B 111
(i.e. after removal of the variation due to changes in the value of money) has
been quite small and in consequence only a small proportion of the total variation in average monthly purchases can be attributed to this factor.
Method of Calculating the Estimates of Income Elasticity of Demand4. More formally, the income elasticity of demand can be defined as the ratioof the relative change in demand (whether measured in terms of expenditure orin terms of the quantity purchased) to the relative change in income, other thingsbeing equal, and it may be represented in the notation of the calculus as
Y dEEdY
where E= expenditure (or, in the case of elasticities of quantity, the amountpurchased) and Y = net family income. Although elasticity of demand may notbe the same at all income levels and may decline as income increases, in practiceit has been found preferable to demonstrate this by obtaining estimates of the
elasticity from cross-sectional analysis of the data in each of several years duringa period when real incomes are changing rather than from cross-sectionalanalysis of the data for a single year, since in the latter case, the consequences
of the income effect being confounded with occupational and other non-incomeeffects are greater. Moreover, it has been found in practice that the fitting ofdemand functions which allow the elasticity to vary with income is rarelyjustified owing to the variability of the data. For these reasons a constantelasticity function has been used in deriving the elasticity coefficients given inthis Appendix; this function is of the form
E=kY" (1)
when E and Y are as defined above, k is a constant and tj is the elasticity. Ifthe data on incomes and on expenditure (or quantity) are transformed intologarithms and then expressed as deviations from their respective means, the
demand relationship becomes
logE=-»)logY .... (2)
and the elasticity is seen to be the linear regression coefficient when log expenditure (or quantity) is regressed on log income.
5. To determine income elasticities of food expenditure at a point in time, one
therefore needs to know the functional relationship between income and foodexpenditure at that point in time. This functional relationship is not fixed andimmutable, since consumers collectively (as well as individually) can and do
change their ideas of relative values from one point in time to another. Even ina comparatively short period they are subjected to changing pressures from the
advertising industry, from manufacturers and agencies who provide new productsand services, and from a host of environmental changes, including changes inthe value of money. The condition about "other things being equal" is rarelyrealized in practice, and for this reason it is an over-simplification to attempt toestimate the demand function by fitting a regression to a set of observations ofincome and expenditure only taken at different points in time (time-seriesanalysis), even when deflated, since the locus of such points may trace out shiftsin the demand function rather than the demand function itself. Indeed, a demand
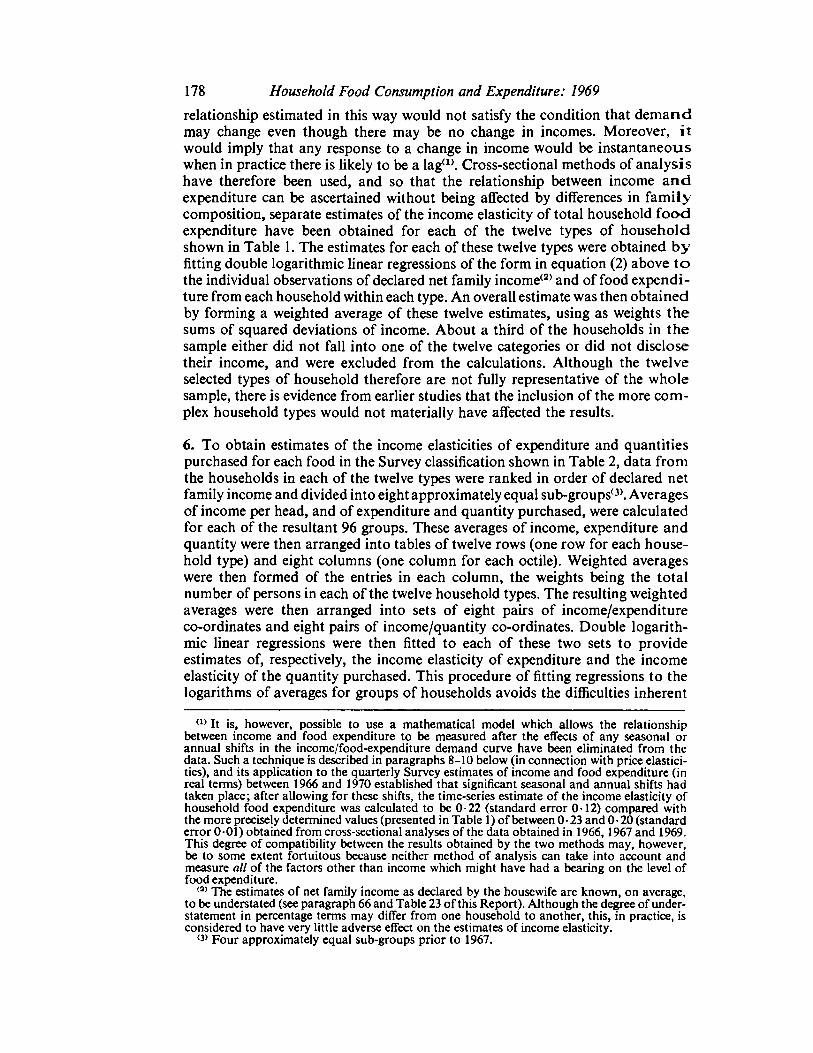
178 Household Food Consumption and Expenditure: 1969
relationship estimated in this way would not satisfy the condition that demandmay change even though there may be no change in incomes. Moreover, itwould imply that any response to a change in income would be instantaneouswhen in practice there is likely to be a lag(1>. Cross-sectional methods of analysishave therefore been used, and so that the relationship between income andexpenditure can be ascertained without being affected by differences in familycomposition, separate estimates of the income elasticity of total household foodexpenditure have been obtained for each of the twelve types of householdshown in Table 1. The estimates for each of these twelve types were obtained byfitting double logarithmic linear regressions of the form in equation (2) above tothe individual observations of declared net family income*2' and of food expenditure from each household within each type. An overall estimate was then obtainedby forming a weighted average of these twelve estimates, using as weights thesums of squared deviations of income. About a third of the households in thesample either did not fall into one of the twelve categories or did not disclosetheir income, and were excluded from the calculations. Although the twelveselected types of household therefore are not fully representative of the wholesample, there is evidence from earlier studies that the inclusion of the more complex household types would not materially have affected the results.
6. To obtain estimates of the income elasticities of expenditure and quantitiespurchased for each food in the Survey classification shown in Table 2, data fromthe households in each of the twelve types were ranked in order of declared netfamily income and divided into eight approximately equal sub-groups(3). Averagesof income per head, and of expenditure and quantity purchased, were calculatedfor each of the resultant 96 groups. These averages of income, expenditure andquantity were then arranged into tables of twelve rows (one row for each household type) and eight columns (one column for each octile). Weighted averages
were then formed of the entries in each column, the weights being the totalnumber of persons in each of the twelve household types. The resulting weightedaverages were then arranged into sets of eight pairs of income/expenditureco-ordinates and eight pairs of income/quantity co-ordinates. Double logarithmic linear regressions were then fitted to each of these two sets to provideestimates of, respectively, the income elasticity of expenditure and the incomeelasticity of the quantity purchased. This procedure of fitting regressions to the
logarithms of averages for groups of households avoids the difficulties inherent
a> It is, however, possible to use a mathematical model which allows the relationshipbetween income and food expenditure to be measured after the effects of any seasonal orannual shifts in the income/food-expenditure demand curve have been eliminated from thedata. Such a technique is described in paragraphs 8-10 below (in connection with price elasticities), and its application to the quarterly Survey estimates of income and food expenditure (inreal terms) between 1966 and 1970 established that significant seasonal and annual shifts hadtaken place; after allowing for these shifts, the time-series estimate of the income elasticity ofhousehold food expenditure was calculated to be 0-22 (standard error 0-12) compared withthe more precisely determined values (presented in Table 1) of between 0-23 and 0-20 (standarderror 0-01) obtained from cross-sectional analyses of the data obtained in 1966, 1967 and 1969.This degree of compatibility between the results obtained by the two methods may, however,be to some extent fortuitous because neither method of analysis can take into account andmeasure all of the factors other than income which might have had a bearing on the level offood expenditure.
<a)The estimates of net family income as declared by the housewife are known, on average,to be understated (see paragraph 66 and Table 23 of this Report). Although the degree of understatement in percentage terms may differ from one household to another, this, in practice, isconsidered to have very little adverse effect on the estimates of income elasticity.
Four approximately equal sub-groups prior to 1967.
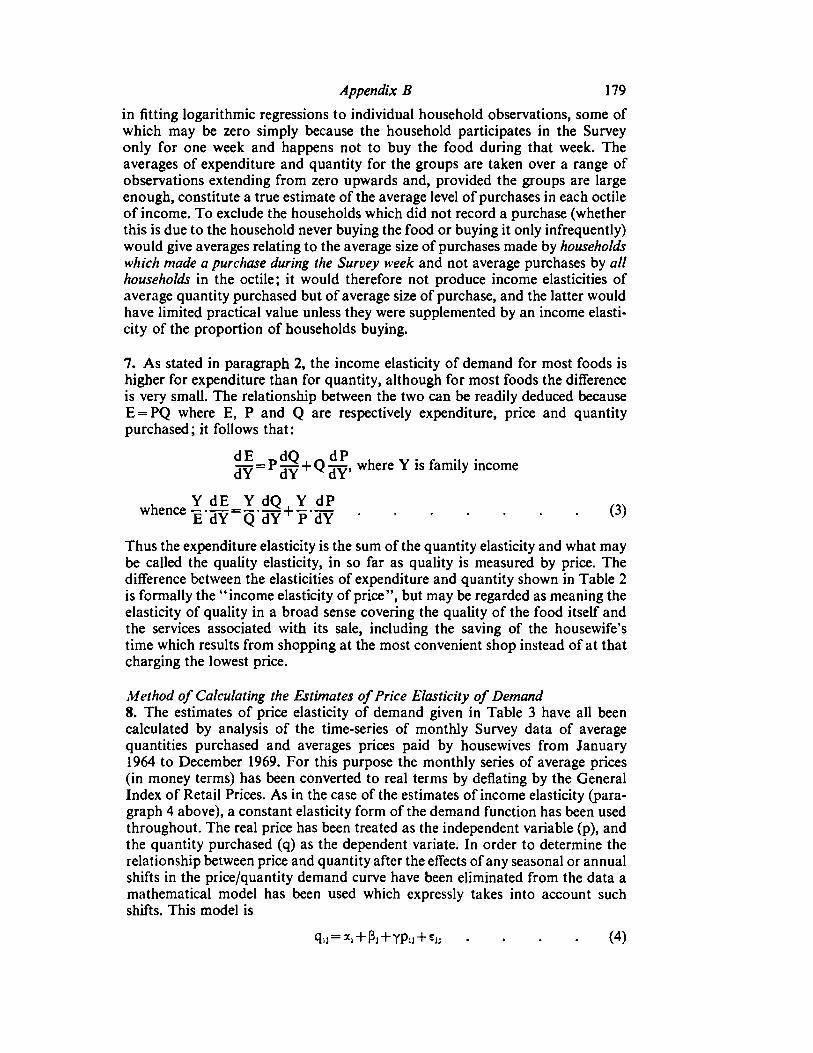
Appendix B 179
in fitting logarithmic regressions to individual household observations, some ofwhich may be zero simply because the household participates in the Surveyonly for one week and happens not to buy the food during that week. Theaverages of expenditure and quantity for the groups are taken over a range ofobservations extending from zero upwards and, provided the groups are large
enough, constitute a true estimate of the average level of purchases in each octileof income. To exclude the households which did not record a purchase (whetherthis is due to the household never buying the food or buying it only infrequently)would give averages relating to the average size of purchases made by households
which made a purchase during the Survey week and not average purchases by allhouseholds in the octile; it would therefore not produce income elasticities ofaverage quantity purchased but of average size of purchase, and the latter wouldhave limited practical value unless they were supplemented by an income elasti
city of the proportion of households buying.
7. As stated in paragraph 2, the income elasticity of demand for most foods ishigher for expenditure than for quantity, although for most foods the difference
is very small. The relationship between the two can be readily deduced because
E = PQ where E, P and Q are respectively expenditure, price and quantitypurchased; it follows that:
Thus the expenditure elasticity is the sum of the quantity elasticity and what maybe called the quality elasticity, in so far as quality is measured by price. Thedifference between the elasticities of expenditure and quantity shown in Table 2
is formally the "income elasticity of price", but may be regarded as meaning the
elasticity of quality in a broad sense covering the quality of the food itself andthe services associated with its sale, including the saving of the housewife'stime which results from shopping at the most convenient shop instead of at thatcharging the lowest price.
Method of Calculating the Estimates ofPrice Elasticity of Demand8. The estimates of price elasticity of demand given in Table 3 have all been
calculated by analysis of the time-series of monthly Survey data of average
quantities purchased and averages prices paid by housewives from January1964 to December 1969. For this purpose the monthly series of average prices
(in money terms) has been converted to real terms by deflating by the GeneralIndex of Retail Prices. As in the case of the estimates of income elasticity (paragraph 4 above), a constant elasticity form of the demand function has been used
throughout. The real price has been treated as the independent variable (p), andthe quantity purchased (q) as the dependent variate. In order to determine the
relationship between price and quantity after the effects of any seasonal or annualshifts in the price/quantity demand curve have been eliminated from the data a
mathematical model has been used which expressly takes into account suchshifts. This model is
where Y is family income
whenceY d_E=Y dQ Y dPEdY QdY+P'dY (3)
qy-«i+Pi+TPu+«u .... (4)
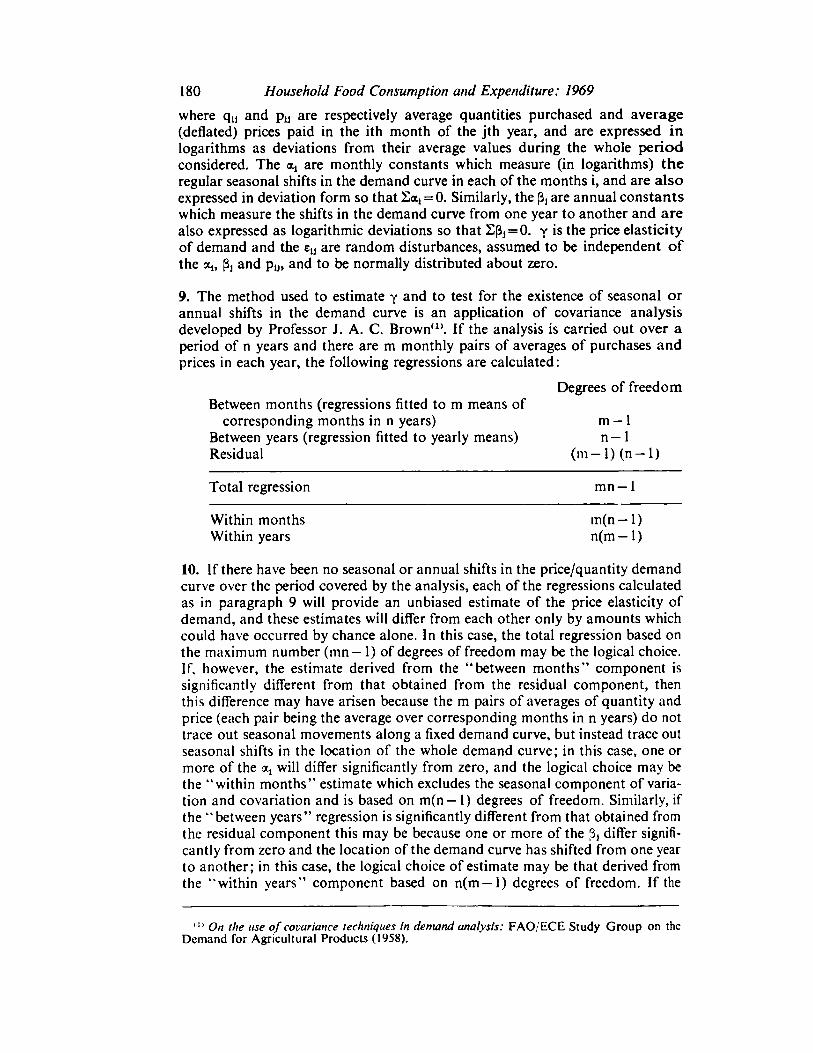
180 Household Food Consumption and Expenditure: 1969
where q(J and pu are respectively average quantities purchased and average
(deflated) prices paid in the ith month of the jth year, and are expressed inlogarithms as deviations from their average values during the whole periodconsidered. The are monthly constants which measure (in logarithms) theregular seasonal shifts in the demand curve in each of the months i, and are alsoexpressed in deviation form so that Sa,=0. Similarly, the Pj are annual constantswhich measure the shifts in the demand curve from one year to another and are
also expressed as logarithmic deviations so that EfJj=0. y is the price elasticityof demand and the are random disturbances, assumed to be independent ofthe a„ Pj and piS, and to be normally distributed about zero.
9. The method used to estimate y and to test for the existence of seasonal orannual shifts in the demand curve is an application of covariance analysisdeveloped by Professor J. A. C. Brown(1). If the analysis is carried out over a
period of n years and there are m monthly pairs of averages of purchases and
prices in each year, the following regressions are calculated :
Degrees of freedomBetween months (regressions fitted to m means of
corresponding months in n years) m — 1
Between years (regression fitted to yearly means) n— 1
Residual (m-l)(n-l)
Total regression mn — 1
Within months m(n — 1)
Within years n(m —1)
10. If there have been no seasonal or annual shifts in the price/quantity demandcurve over the period covered by the analysis, each of the regressions calculatedas in paragraph 9 will provide an unbiased estimate of the price elasticity ofdemand, and these estimates will differ from each other only by amounts which
could have occurred by chance alone. In this case, the total regression based on
the maximum number (mn —1) of degrees of freedom may be the logical choice.
If,
however, the estimate derived from the "between months" component issignificantly different from that obtained from the residual component, then
this difference may have arisen because the m pairs of averages of quantity and
price (each pair being the average over corresponding months in n years) do not
trace out seasonal movements along a fixed demand curve, but instead trace out
seasonal shifts in the location of the whole demand curve; in this case, one ormore of the a, will differ significantly from zero, and the logical choice may be
the "within months" estimate which excludes the seasonal component of varia
tion and covariation and is based on m(n— 1) degrees of freedom. Similarly, if
the "between years" regression is significantly different from that obtained from
the residual component this may be because one or more of the (3j differ signifi
cantly from zero and the location of the demand curve has shifted from one year
to another; in this case, the logical choice of estimate may be that derived from
the "within years" component based on n(m —
1) degrees of freedom. If the
(1) On the use of covariance techniques in demand analysis: FAO/ECE Study Group on the
Demand for Agricultural Products (1958).
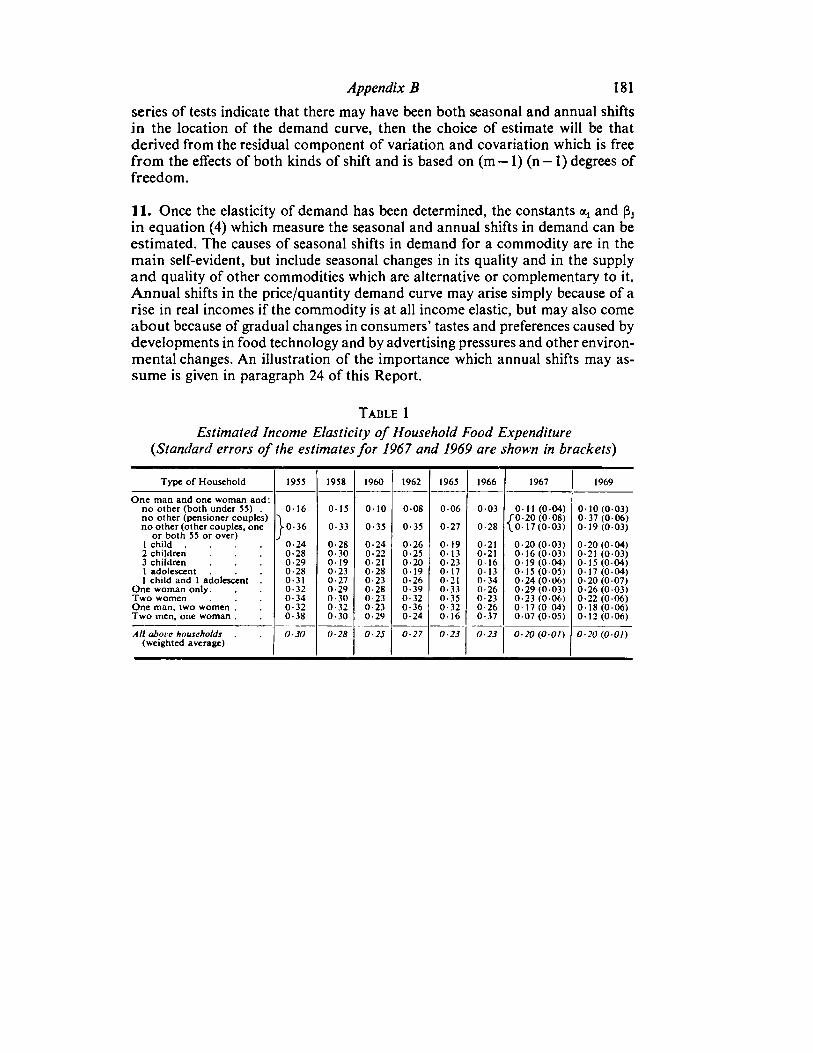
Appendix B 181
series of tests indicate that there may have been both seasonal and annual shiftsin the location of the demand curve, then the choice of estimate will be thatderived from the residual component of variation and covariation which is free
from the effects of both kinds of shift and is based on (m —1) (n —
1) degrees offreedom.
11. Once the elasticity of demand has been determined, the constants acj and (3j
in equation (4) which measure the seasonal and annual shifts in demand can be
estimated. The causes of seasonal shifts in demand for a commodity are in the
main self-evident, but include seasonal changes in its quality and in the supplyand quality of other commodities which are alternative or complementary to it.Annual shifts in the price/quantity demand curve may arise simply because of a
rise in real incomes if the commodity is at all income elastic, but may also come
about because of gradual changes in consumers' tastes and preferences caused bydevelopments in food technology and by advertising pressures and other environmental changes. An illustration of the importance which annual shifts may as
sume is given in paragraph 24 of this Report.
Table 1
Estimated Income Elasticity of Household Food Expenditure
(Standard errors of the estimates for 1967 and 1969 are shown in brackets)
Type of Household 1955 1958 1950 1962 1965 1966 1967 1969
One man and one woman and:no other (both under 55) . 016 015 010 008 006 003 0-11 (0-04) 0 10(0 03)no other (pensioner couples) "1 f0-20(0-08) 0-37 (0 06)no other (other couples, one ^■0-36 0-33 0-35 0-35 0-27 0-28 \0- 17 (0-03) 0 19(0 03)
or both 55 or over) /
1 child .... 0-24 0-28 0-24 0-26 0-19 0-21 0-20(0-03) 0-20 (0-04)
2 children 0.28 0-30 0-22 0-25 0-13 0-21 0-16 (0-03) 0-21 (0 03)
3 children 0-29 019 0.21 0-20 0-23 0-16 0-19 (0 04) 0-15(0-04)
1 adolescent 028 0-23 0-28 0-19 0-17 0-13 0 15 (0 05) 0-17 (0-04)
1 child and 1 adolescent 0-31 0-27 0-23 0-26 0-21 0-34 0-24 (0-06) 0-20 (0-07)One woman only. 0-32 0-29 0-28 0-39 0-33 0-26 0-29 (0-03) 0-26 (0 03)Two women 034 0-30 0-23 0-32 0-35 0-23 0-23 (0 06) 0-22 (0-06)One man, two women . 0-32 0-32 0-23 0-36 0-32 0-26 0- 17 (0 04) 0-18(0-06)Two men, one woman . 0-38 0-30 0-29 0-24 0-16 0-37 0 07 (0 05) 0-12(0-06)
All above households .(weighted average)
0-30 0-28 0-25 0-27 0-23 0-23 0-20(0-01) 0-20 (0 01)
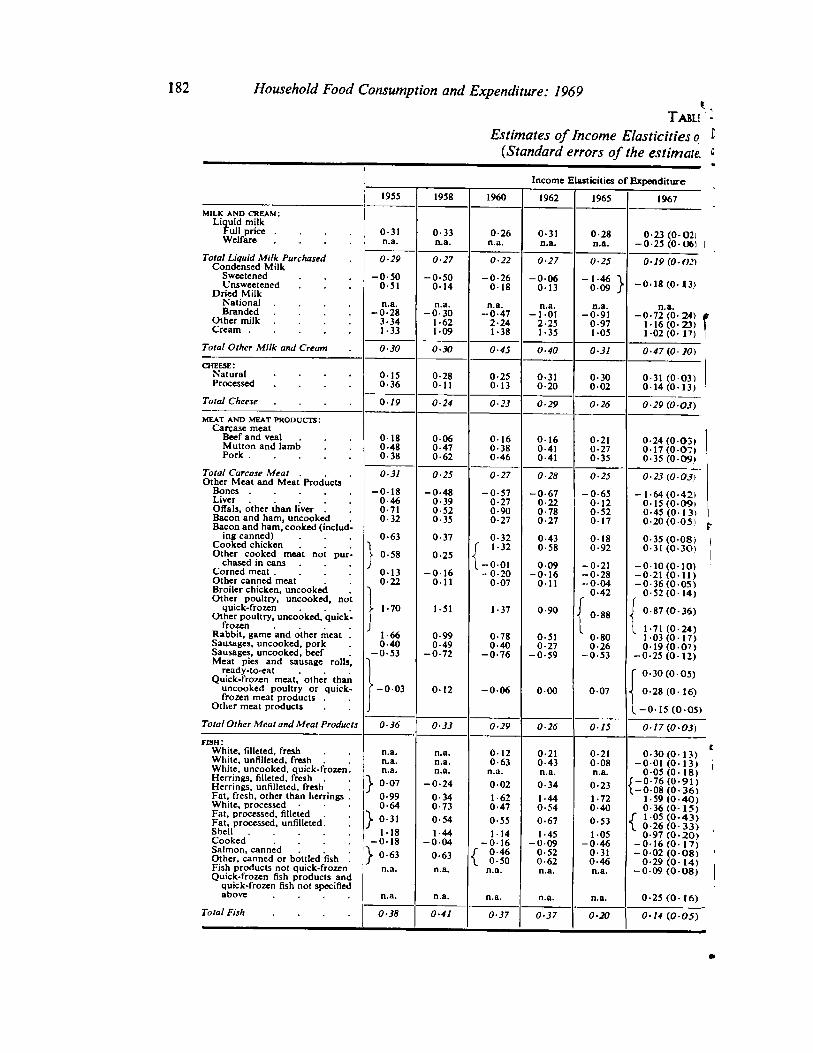
I
X182 Household Food Consumption and Expenditure: 1969
Tami1
Estimates of Income Elasticities oj "
(Standard errors of the estimate ">
Income Elasticities of Expenditure
MILK AND CREAM:
1955 1958 1960 1962 1965 1967
Liquid milkFull price ....Welfare .... 0-31 0-33 0-26 0-31 0-28 0-23(0-02)
n.a. ■ML n.a. n.a. n.a. -0- 25(0-06)Total Liquid Milk Purchased
Condensed Milk0-29 0-27 0-22 0-27 0-25 0-19 (0-O2)
UnsweetenedDried Milk
Sweetened -0-50 -0-50 -0-26 -0-06 -1-46 \0-09 / -0-18(0-13)0-51 014 0-18 0-13
Branded ....Other milk ....National .... n.a. n.a. n.a. n.a. n.a. n.a.
-0-283-34
-0-301-62
-0-472-24
-1012-25
-0-910-97
-0-72(0-34) I1-16(0-23)Cream 1-33 109 1-38 1-35 105 1-02(0-17)
Total Other Milk and Cream 0-30 0-30 0-45 0-40 0-31 0-47(0- 10)
cheese:Natural ....Processed .... 015
0-360-28011
0-25013
0-31 0-300-02
0-31 (003)0-14(0- 13)020
Total Cheese .... 0-79 0-24 0-23 0-29 0-26 0-29(0-03)MEAT AND MEAT PRODUCTS:
Carcase meatBeef and vealMutton and lamb
0-180-48
0060-47
0160-38
0-160-41
0-210-27
0-24 (003)Pork 0-38 0-62 0-46 0-41 0-35
0-17(0-07)0-35(0-09)
Total Carcase Meat . 0-31 0-25 0-27 0-28 0-25 0-23 (003)Other Meat and Meat ProductsBones -018 -0-48 -0-57 -0-67 -0-65 -1-64(0-42)Liver .....Offals, other than liver .
0-460-71
0-390-52
0-270-90
0-220-78
0120-52
015(009i0-45 (0-1 1i
Bacon and ham, uncooked 0-32 0-35 0-27 0-27 0-17 0-20(0-05)Bacon and ham, cooked (including canned)
Cooked chicken063
1
0-37 0-32f 1-32
0-430-58
0-180-92
0-35(0-08)0-31 (0-3O)Other cooked meat not pur } 0-58 0-25 i
Corned meat....chased in cans J t-001 009 -0-21 -0-10(0- 10)
Other canned meatBroiler chicken, uncookedOther poultry, uncooked, not
013 -016 -0-20 -0-16 -0-28 -0-21(0-11)0-22
1
011 007 0-11 -0040-42
-0-36(0-05)0-52(0-14)
quick-frozenOther poultry, uncooked, quick-
c
J 0-87(0-36)frozen ....
Rabbit, game and other meat .
f 1-70 1-51 1-37 0-90 I 0-88
L 1-71(0-24)1-03(0- 17)0-19(0-07)Sausages, uncooked, pork
1-66 0-99 0-78 0-51 0-80
Sausages, uncooked, beefMeat pies and sausage rolls.
0-40 0-49 0-40 0-27 0-26-0-53
1-0-72 -0-76 -0-59 -0-53 -0-25(0-12)
ready-to-eatQuick-frozen meat, other than J"
0-30 (005)uncooked poultry or quick-frozen meat products .
r-o-03 0-12 -006 0-00 007•j 0-28(0-16)
Other meat products J [-015(0.05)Total Other Meat and Meat Products 0-36 0-33 0-29 0-26 0-15 0-17(0-03)fish:
White, filleted, freshWhite, unfilleted, fresh
n.a. n.a. 012 0-21 0-21 0-30(0- 13)-001 (013)White, uncooked, quick -frozen.
n.a. n.a. 0-63 0-43 008
Herrings, filleted, freshHerrings, unfilleted, fresh
n.a. n.a. n.a. n.a. n.a. 0-05(0- 18)f-0-76(0-91)1-0-08(0-36)} 007 -0-24 002 0-34 0-23
Fat, fresh, other than herrings . 0-99 0-34 1-62 1-44 1-72 1-59(0-40)White, processed 0-64 0-73 0-47 0-54 0-40 0-36(0-15)/ 1-05(0-43)\ 0-26(0-33)
Fat, processed, filletedFat, processed, unfilleted. } 0-31 0-54 0-55 0-67 0-53Shell ..... 1-18 1-44 114 1-45 105 0-97 (0-20)Cooked .... -0-18 -004 -0-16 -009 -0-46 -0-16(0-17)Salmon, canned \ 0-63 0-63 J 0-46\ 0-50
0-520-62
0-310-46
-002(0-08)0-29 (0-14)Other, canned or bottled fish .
Fish products not quick-frozenQuick-frozen fish products and
quick-frozen fish not specified
n.a. n.a. n.a. n.a. n.a. -0-09(0-08)
above .... n.a. n.a. n.a. n.a. n.a. 0-25(0-16)Total Fish .... 0-38 0-41 0-37 0-37 0-20 014(005)
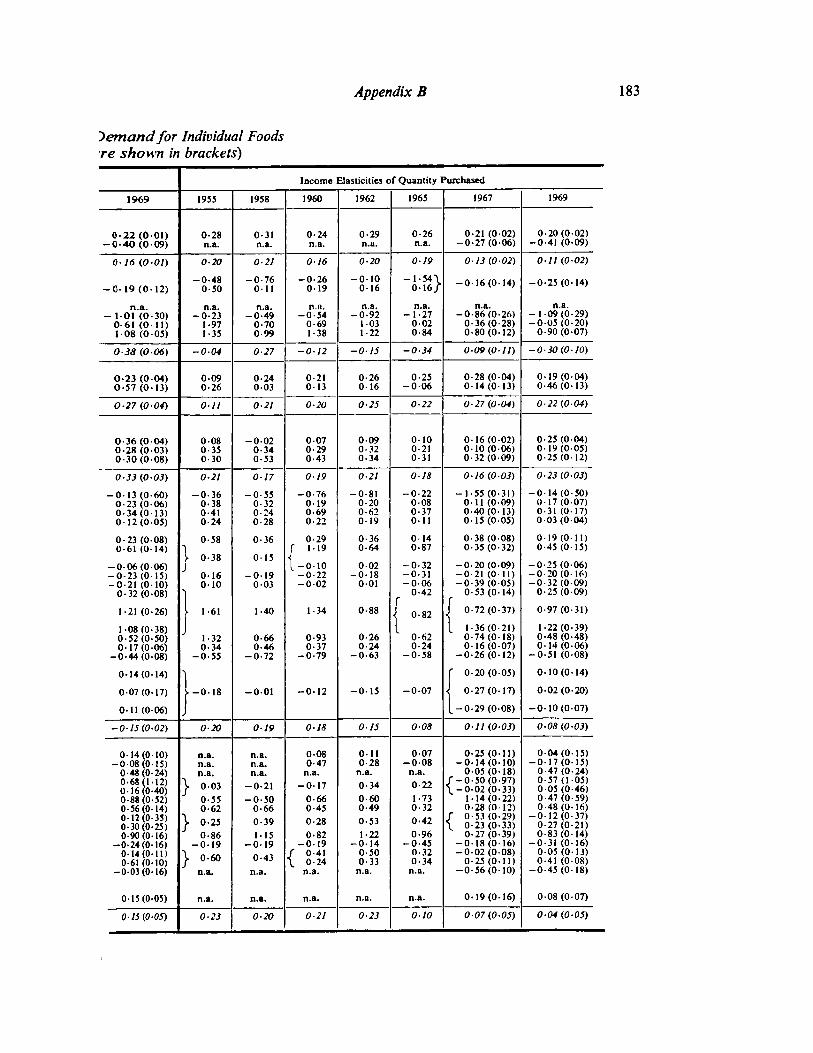
Appendix B 183
demand for Individual Foodsre shown in brackets)
Income Elasticities of Quantity Purchased
1969 1955 1958 1960 1962 1965 1967 1969
1-22(0-01) 0-28 0-31 0-24 0-29 0-26 0-21 (0-02)-0-27(0-06) -0-41 (009)
0-20 (002)-0-40(0-09) n.a. n.a. n.a. n.a. n.a.
016(001) 0-20 0-21 0-16 0-20 019 0-13(0-02) 01 1(0-02)
-0- 19(0- 12)-0-48
0-50-0-76
Oil-0-26
019-010
016-1-54-1
016/ -0-16(0-14) -0-25(0-14)
n.a. n.a. n.a. n.a. n.a. n.a. n.a.-1-09(0-29)
n.a.-1-01 (0-30) -0-23 -0-49 -0-54 -0-92 -1-27 -0-86(0-26)
0-61 (0-11)108 (005)
1-97 0-70 0-69 103 002 0-36(0-28) -0-05 (0-20)0-90(0-07)1-35 0-99 1-38 1-22 084 0-80(0-12)
0 38 0-06) -0-04 0-27 -012 -0-15 -0-34 0-09(0-11) -0-30(0-10)
0-23 (0 04) 009 0-24 0-21 0-26 0-25 0-28 (004) 0-19(0-04)0-57(0- 13) 0-26 0-03 013 016 -006 0-14(0-13) 0-46(0-13)
0-27 (004) on 0-21 0-20 0-25 0-22 0-27(0-04) 0-22(0-04)
0-36(0-04) 0-08 -0-02 007 0-09 0-10 0-16(0-02) 0-25 (0-04)0-28 (003) 0-35 0-34 0-29 0-32 0-21 0-10(0-06) 0-19(0-05)0-30(0-08) 0-30 0-53 0-43 0-34 0-31 0-32(0-09) 0-25(0-12)
0-33 (003) 0-21 0-17 0-19 0-21 0-18 0-16(0-03) 0-23 (0-03)
-0- 13 (0-60) -0-36 -0-55 -0-76 -0-81 -0-22 -1-55(0-31)0-11(0-09)
-0-14(0-50)017(007)0-23 (006) 0-38 0-32 019 0-20 0-08
0-40(0-13)0-15(0-05)
0-31 (0-17)0-34 (013) 0-41 0-24 0-69 0-62 0-370-03 (004)012(005) 0-24 0-28 0-22 019 0-11
0-23 (008)0-61(0-14)
0-58 0-36 0-29 0-36 0-14 0-38(0-08) 0-19(0- 11)0-45(0-15)
\ 0-38 0-15 J 119 0-64 0-87 0-35(0-32)
-0-06 (006) J 1-0-10 002 -0-32 -0-20(0-09) -0-25(0-06)-0-23(0-15) 0-16 -019 -0-22 -018 -0-31 -0-21 (0-11) -0-20(0-16)-0-21(0-10)
0-32(0-08)0-10 0-03 -002 0-01 -0-06 -0-39(0-05) -0-32(0-09)
0-25 (009)0-42 0-53(0-14)r
J 0-72(0-37) 0-97(0-31)1-21(0-26) - 1-61 1-40 1-34 0-88 i 0-82
1-08(0-38) 1 1 1-36(0-21) 1-22(0-39)
0-52(0-50)0-17 (0-06)
1-32 0-66 0-93 0-26 0-62 0-74(0-18)0-14(0-06)
-0-51(0-08)
0-48 (0-48)0-34 0-46 0-37 0-24 024 0-16(0-07)
-0-44(0-08) -0-55 -0-72 -0-79 -0-63 -0-58 -0-26(0-12)
0-14(0- 14) 1 f 0-20(0-05) 0-10(0- 14)
007 (0-17) L-0-18 -001 -012 -015 -0-07 ■1 0-27(0-17) 0-02(0-20)
0-11(0-06) J [-0-29(0-08) -0-10(0-07)
-0-15(0-02) 0-20 019 018 015 0-08 0-11(0-03) 0-08(0-03)
0-14(0-10)-0-08(0-15)
n.a. n.a. 0-08 Oil 007 0-25(0-11)-0-17(0-15)
0-04(0- 15)
0-48(0-24)0-68(1-12)0-16(0-40)0-88(0-52)
n.a. n.a. 0-47 0-28 -008 -0-14(0-10)0-05(0-18) 0-47 (0-24)n.a. n.a. n.a. n.a. n.a. / -0-50 (0-97)\ -0-02 (0-33)
0-57(1-05)0-05(0-46)0-47 (0-59)
\ 003 -0-21 -0-17 0-34 0-22J0-55 -0-50 0-66 0-60 1-73 1-14(0-22)
0-56(0-14)0-12(0-35)0-30(0-25)
0-62 0-66 0-45 0-49 0-32f 0-53(0-29)\ 0-23 (0-33)
0-28(0-12)-0-12(0-37)
0-27(0-21)
0-48(0-16)
\ 0-25 0-39 0-28 0-53 0-42
0-90 (0- 16) 0-86 1-15 0-82 1-22 0-96 0-27(0-39) 0-83(0-14)-0-24(0-16) -019 -019 -019 -0-14 -0-45 -0-18(0- 16)
-0-02 (0-08)-0-31 (0-16)
0-14(0-11) \ 0-60 0-43 / 0-41\ 0-240-50 0-32 0-05(0-13)
0-61(0-10) 0-33 0-34-0-56(0-10)
0-25(0-11)-0-45(0-18)
0-41 (0-08)-003(0- 16) n.a. n.a. n.a. n.a. n.a.
0-15(0-05) n.a. n.a. n.a. n.a. n.a. 0-19(0- 16) 008 (0-07)
0-15 (0-05) 0-23 020 0-21 0-23 0-10 0-07 (005) 0-04(0-05)
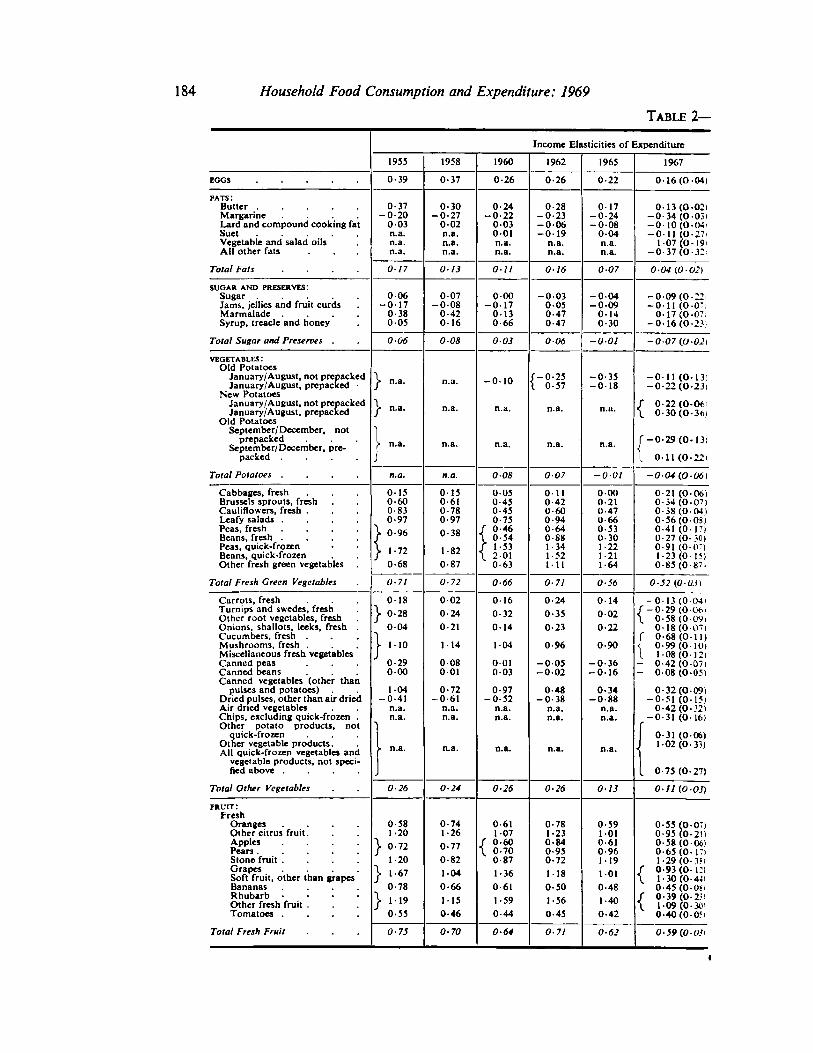
Household Food Consumption and Expenditure: 1969
Table 2—
Income Elasticities of Expenditure
1955 1958 1960 1962 1965 1967
EGGS 0-39 0-37 026 0-26 0-22 0 - 16 (0-04)
fats:0-37
-0-20003n.a.n.a.n.a.
0-30-0-27
002
0-24-0-22
003001n.a.n.a.
0-28-0-23-0-06-019
0-17-0-24-008
0 -13(0 02)-0-34(0-03)-0-10(0-04)-011 (0-27)
Margarine ....Lard and compound cooking fatSuet n.a. 0-04Vegetable and salad oils n.a. n.a. n.a. 1-07(0 -]9i
-0-37(0-321All other fats ... n.a. n.a. n.a.
Total Fats .... 0-17 013 0-11 016 0-07 0 04(0 02)
SUGAR AND PRESERVES:Sugar 006
-017038005
0-07-008
0-42016
000-017
0130-66
-0030-050-470-47
-0-04-009
0-140-30
-0 09 (0-22)-011 (0-07)
0-17(0-07l-0-16(0-23)
Jams, jellies and fruit curdsMarmalade ....Syrup, treacle and honey
Total Sugar and Preserves . 0-06 008 0-03 0-06 -001 -0 07(0-02)
vegetables:Old Potatoes
January/ August, not prepackedJanuary/August, prepacked •
New PotatoesJanuary /August, not prepackedJanuary/August, prepacked
Old Potatoes
> n.a.
■ n.a.
n.a.
n.a.
-010
n.a.
f-0-25X 0-57
-0-35-0-18
-011 (0-13)-0-22(0-23)
September/ December, not
n.a.
n.a.
n.a.
n.a.
f 0-22(0-06)\ 0-30(0-36)
prepackedSeptember/December, pre
packed .... » n.a. n.a. n.a. [-0-29(0-13)I 0-11(0-22)
Total Potatoes .... n.a. n.a. 0-08 007 -0-01 -0 04 (0 06)
Cabbages, fresh 0-150-600-830-97
0150-610-780-97
0-050-450-450-75/ 0-46\ 0-34
/ 1 53\ 2010-63
0-110-420-600-940-64
0000-210-470-660-53
0-21 (0-06)0-34(0-07)0-38 (0-04)0-56 (0-08)0-41 (0- 17)0-27 (0-30)
Brussels sprouts, freshCauliflowers, fresh .Leafy salads ....Peas, fresh ....
} 0-96 0- 38Beans, fresh ....\ 1-72
0-68
0- 88 0- 30Peas, quick-frozen 1- 82
0-87
1- 341-52111
1-221-211-64
0- 91 (0-07)Beans, quick-frozen 1-23(0-15)
0-85(0-87)Other fresh green vegetables
Total Fresh Green Vegetables 0-71 072 0-66 0-71 0-56 0-52 (0 03)
Carrots, freshTurnips and swedes, freshOther root vegetables, freshOnions, shallots, leeks, fresh .Cucumbers, fresh .Mushrooms, fresh .Miscellaneous fresh vegetablesCanned peasCanned beans
0-18
■0-28
0-04
0020-24
0-16 0-24
0-35
0-23
014 -0-13 (0-04)/ -0-29 (0-06)\ 0-58 (0 09)0-18 (0 07)
r 0-68(0-11)-! 0-99(0-10)1 108(0-12)
0- 32
014002
0- 21 022
- 110 1- 14 1-04 096 0-90
0-29 0-08001
001003
-005-002
-0-36-016
- 0-42(0-07)
Canned vegetables (other thanpulses and potatoes) .
0- 00 - 0 08 (0-05)
1-04-0-41
0-72-0-61
n.a.n.a.
0-97-0-52
n.a.n.a.
0-48 0-34-0-88
n.a.n.a.
0-32(0-09)-0-51 (0-15)Dried pulses, other than air dried -0-38
n.a.n-a.
Air dried vegetables n.a.n.a.
0-42(0-32)-0-31 (0-16)Chips, excluding quick-frozen .
Other potato products, notquick-frozen f ?^&9?J 1-02(0-33)Other vegetable products. • n.a. n.a. n.a. n.a. n.a.All quick-frozen vegetables andvegetable products, not specified above .... [ 0-75(0.27)
Total Other Vegetables 0-26 0-24 0-26 0-26 013 011 (0-03)
fruit:Fresh
Oranges .... 0- 58 0- 74 061107/ 0-60\ 0-70
0- 78 0-591010-610-96119
0-55(0-07)0-93 (0-21)0-58 (0-06)
Other citrus fruit. 1- 20 1-26 1-230-840-950-72
Apples ....} 0-72
1-20
0-770- 65 (017)
Stone fruit ....Grapes ....Soft fruit, other than grapesBananas ....Rhubarb ....Other fresh fruit .Tomatoes ....
0- 82 0- 87 1-29(0-3SI/ 0-93(0-12)\ 1-30(0-44)\ 1-67
0-78
1-04
0-66
1150-46
1- 36 118 1010- 61 0- 50 0- 48 0-45 (O-OS)f 0-39(0-23)\ 1-09(0-301}M9
0-55
1- 59
0-44
1- S6
0-45
1-40
042 0-40 (0-05)
Total Fresh Fruit 0-75 0-70 0-64 071 0-62 0-59 (00!)
<
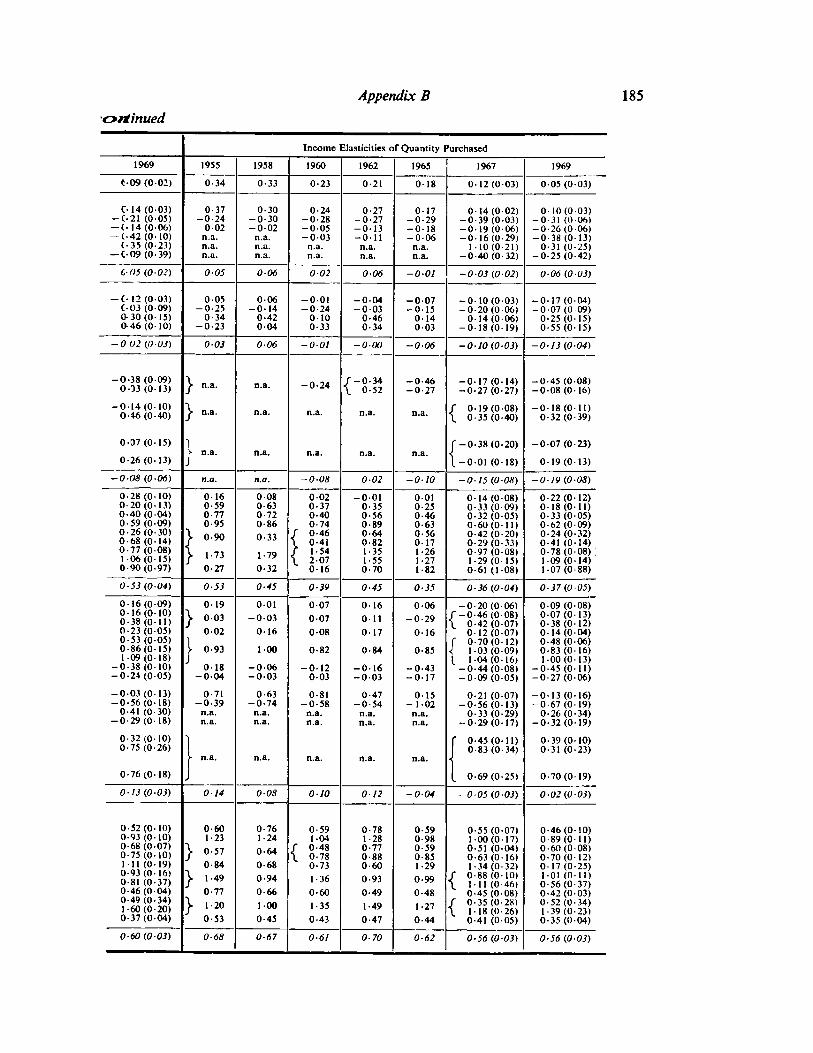
Appendix B 185
ortinued
Income Elasticities of Quantity Purchased
1969 1955 1958 1960 1962 1965 1967 1969
«09 (002) 0-34 0-33 0-23 0-21 0-18 012(003) 0-05 (0-03)
C- 14 (0-03) 0-37 0-30 0-24 0-27 017 0-14(0-02) 010(003)— C-21 (005) -0-24 -0-30 -0-28 -0-27 -0-29 -0-39(0-03) -0-31 (006)— (-14(006) 002 -002 -005 -013 -0-18 -0-19(0-06) -0-26 (006)— (-42(0-10)(-35(0-23)
n.a. n.a. -003 -Oil -0-06 -0-16(0-29)1-10(0-21)
-0-38(0-13)0-31 (0-25)— C-09 (0-39)
n.a. n.a. n.a. n.a. n.a.-0-40(0-32) -0-25 (0-42)n.a. n.a. n.a. n.a. n.a.
6-05(0 02) 0-05 0-06 002 0-06 -0-01 -0-03 (0-02) 0-06 (003)
— (■12(0-03) 005 006 -001 -004 -0-07 -010(003) -0-17(0-04)C-03 (009) -0-25 -014 -0-24 -003 -0-15 -0-20(0-06) -0-07(0-09)0-30(0-15) 0-34 0-42 010 0-46 0-14 0-14(006) 0-25(0-15)0-46(0-10) -0-23 0-04 0-33 0-34 003 -0-18(0-19) 0-55(0- 15)
-0 02(0 03) 0-03 0-06 -001 -000 -0-06 -0-10(0-03) -0-13(0-04)
-0-38 (0-09)0O3 (013) } -0-24 /-0-34\ 0-52
-0-46 -0-17(0- 14) -0-45(0-08)-0-27 -0-27 (0-27) -0-08(0- 16)
-0-14(0-10)0-46(0-40) }
n.a. n.a. n.a. n.a. n.a. / 0-19(008)\ 0-35(0-40)-0-18(0-11)
0-32(0-39)
0-07(0-15) 1 f -0-38 (0-20) -0-07(0-23)
J n.a. n.a. n.a. n.a. n.a. -{0-26(0-13) 1-0-01(0-18) 0-19(0- 13)
-0-08 (006) rut. n.a. -008 002 -0-10 -015(008) -019(008)
0-28(0-10) 0-16 0-08 0-02 -001 001 0-14(0-08) 0-22(0-12)0-20(0-13) 0-59 0-63 0-37 0-35 0-25 0-33(0-09) 0-18(0-11)0-40 (004) 0-77 0-72 0-40 0-56 0-46 0-32 (005) 0-33(0-05)0-59(0-09) 0-95 0-86 0-74 0-89 0-63 0-60(0-11) 0-62(0-09)0-26(0-30) \ 0-90 0-33 f 0-46 0-64 0-56 0-42 (0-20) 0-24(0-32)0-68(0-14) / \ 0-41 0-82 017 0-29(0-33) 0-41 (0-14)0-77 (0-08) \ 1-73 1-79 / 1-54 1-35 1-26 0-97 (0-08) 0-78 (008)
1-09(0-14)1-06(0-15) j \ 207 1-55 1-27 1-29(0-15)0-90 (0-97) 0-27 0-32 016 0-70 182 0-61 (1-08) 1-07(0-88)
0-53 (004) 0-53 0-45 0-39 0-45 0-35 0-36(0-04) 0-37(0-05)
0-16(009) 019 0-01 007 0-16 0-06 -0-20(0-06) 0-09(0-08)0-16(0-10)0-38(0-11) }
003 -003 007 Oil -0-29 r -0-46 (008)\ 0-42 (007)0-07(0-13)0-38(0-12)
0-23 (005) 0-02 0-16 008 0-17 0-16 0-12(0-07) 0-14(0-04)0-53(0-05)
1f 0-70(0-12) 0-48 (0-06)
0-86(0-15) 0-93 1-00 0-82 0-84 0-85 1. 1-03(0-09) 0-83(0- 16)1-09(0-18) J 1 1-04(0- 16) 1-00(0-13)
-0-38(0-10) 0-18 -006 -012 -016 -0-43 -0-44 (008) -0-45(0-11)-0-24(0-05) -004 -0-03 003 -003 -017 -009(005) -0-27(0-06)
-0-03(0- 13) 0-71 0-63 0-81 0-47 015 0-21 (007) -0-13(0- 16)-0-56(0-18)
0-41 (0-30)-0-39 -0-74 -0-58 -0-54 -102 -0-56(0-13) -0-67(0-19)
0-26(0-34)-0-29(0-18)
n.a. n.a. n.a. n.a. n.a. 0-33(0-29)-0-29(0-17) -0-32(0-19)
0-32(0-10)]
n.a. n.a. n.a. n.a. n.a.
f 0-45(0-11) 0-39(0-10)0-75 (0-26) [ 0-83(0-34) 0-31 (0-23)
Jn.a. n.a. n.a. n.a. n.a. j
0-76(0-18) (. 0-69(0-25) 0-70(0-19)
0-13(0-03) 014 0-08 0-10 0-12 -004 -0-05(0-03) -0-02(0-03)
0-52(0-10) 0-60 0-76 0-59 0-78 0-59 0-55(0-07) 0-46(0-10)0-93(0-10) 1-23 1-24 1-04 1-28 0-98 1-00(0-17) 0-89(0-11)0-68(0-07)
} 0-57 0-64 / 0-48\ 0-780-77 0-59 0-51 (004) 0-60 (008)
0-75 (0-10) 0-88 0-85 0-63(0-16) 0-70(0-12)1-11 (0-19) 0-84 068 0-73 0-60 1-29 1-34(0-32) 0-17(0-25)0-93(0-16)0-81 (0-37) } 1-49 0-94 136 0-93 0-99 / 0-88(0-10)\ 1-11(0-46)
1-01(0-11)0-56(0-37)
0-46(0-04) 0-77 0-66 0-60 0-49 0-48 0-45(0-08) 0-42(0-03)0-49(0-34)1-60(0-20) } 1-20 100 1-35 1-49 1-27 / 0-35(0-28)\ 1-18(0-26)
0-52(0-34)1-39(0-23)
0-37(0-04) 0-53 0-45 0-43 0-47 0-44 0-41 (0-05) 0-35(0-04)
0-60 (003) 0-68 0-67 0-61 0-70 0-62 0-56(0-03) 0-56(0-03)
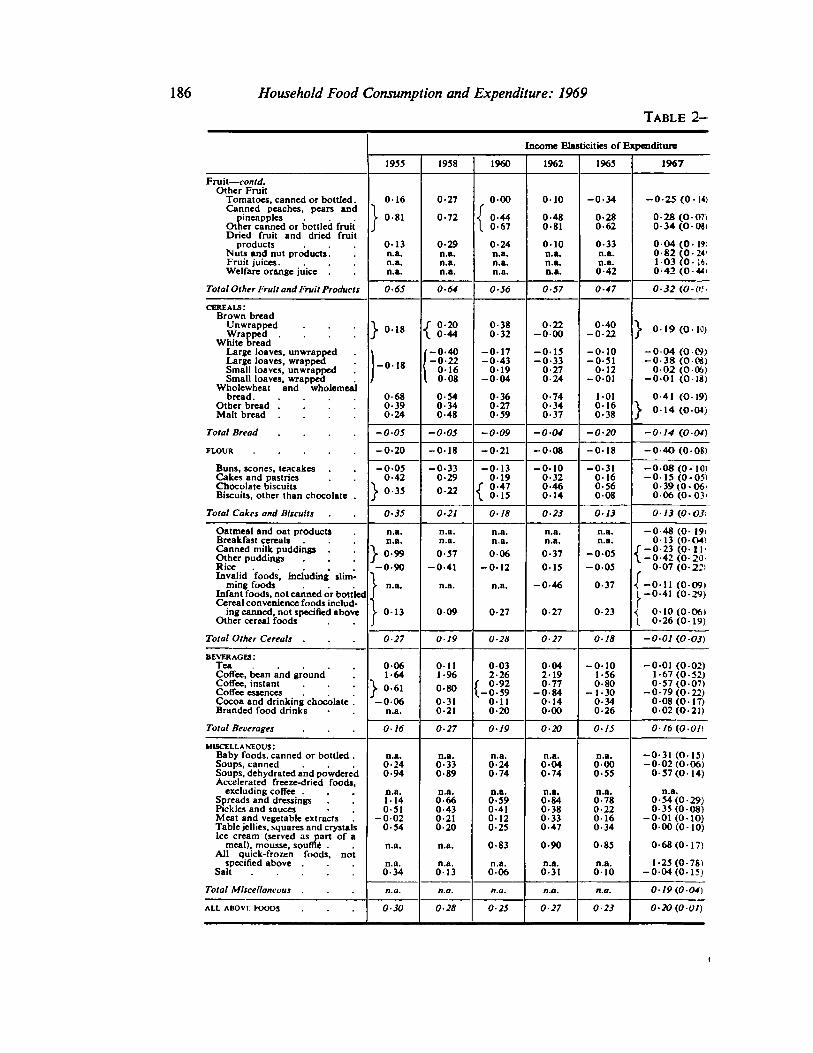
186 Household Food Consumption and Expenditure: 1969
Table 2Income Elasticities of Expenditure
Fruit —could.
1955 1958 1960 1962 1965 1967
Other FruitTomatoes, canned or bottled . 0-16 0-27 000 010 -0-34 -0-25 (0-14)Canned peaches, pears and 1 r
pineapples r 0-81 0-72 i 0-44 0-48 0-28 0-28(0-07)Other canned or bottled fruit J I 0-67 0-81 0-62 034(008)Dried fruit and dried fruit
products 013 0-29 0-24 010 0-33 0-04 (0-19)Nuts and nut products. n.a. n.a. n.a. n.a. n.a. 0-82(0-24)Fruit juices. n.a. n.a. n.a. n.a. n.a. 1-03 (0-l«iWelfare orange juice n-a. n.a. n.a. n.a. 0-42 0-42 (0-44)
Total Other Fruit and Fruit Products 0-65 0-64 0-56 0-57 0-47 0-32(0-0!)
cereals:Brown bread
Unwrapped \ 018 S 0-20\ 0-440-380-32
0-22-0-00
0-40-0-22 y 0-19(0-10)
White breadWrapped ....Large loaves, unwrapped ) /-0-40 -017 -015 -0-10 -0-04(0-0))Large loaves, wrapped
J—018 1-0-22 -0-43 -0-33 -0-51 -0-38 (008)
Small loaves, unwrapped)
\ 0-16 019 0-27 012 0-02 (006)
Wholewheat and wholemealSmall loaves, wrapped I 008 -004 0-24 -001 -001 (018)
0-68 0-54 0-36 0-74 1-01 0-41 (0-19)Other bread .... 0-39 0-34 0-27 0-34 0-16
y 014(004)Malt bread .... 0-24 0-48 0-59 0-37 0-38
Total Bread .... -0-05 -0 05 -0-09 -004 -0-20 -014 (004)
FLOUR -0-20 -018 -0-21 -0-08 -0-18 -0-40(0-08)
Buns, scones, teacakes -0-05 -0-33 -013 -0-10 -0-31 -0-08(0-10)Cakes and pastries 0-42 0-29 0-19 0-32 0-16 -015(0-05)Chocolate biscuits \ 0-35 0-22 / 0-47\ 015
0-46 0-56 0-39(0-06)Biscuits, other than chocolate . 014 008 0-06(0-03)
Total Cakes and Biscuits 0-35 0-21 018 0-23 0-13 0-13(0-03)
Oatmeal and oat products n.a. n.a. n.a. n.a. n.a. -0-48(0-19)Breakfast cereals n.a. n.a. n.a. n.a. n.a. 0-13 (0-O4)Canned milk puddingsOther puddings y 0-99 0-57 006 0-37 -0-05 / -0-23 (0-11)\ -0-42 (0-201Rice -0-90 -0-41 -012 015 -005 007 (0-22)Invalid foods, including slim ") r
ming foods r n.a. n.a. n.a. -0-46 0-37 < -011 (009)Infant foods, not canned or bottled J 1 -0-41 (0-29)Cereal convenience foods includ | r
ing canned, not specified above \ 0-13 0-09 0-27 0-27 0-23 < 010(006)t 0-26(0-19)Other cereal foods J
Total Other Cereals . 0-27 0-19 0-28 0-27 0-18 -001 (003)beverages:
Tea 0-06 011 003 004 -010 -001 (002)Coffee, bean and ground 1-64 1-96 2-26 2- 19 1-56 1-67(0-52)Coffee, instant \ 0-61 0-80 f 0-92
1-0-590-77 0-80 0-57 (0-07)
CofTee essences -0-84 -1-30 -0-79(0-22)Cocoa and drinking chocolate . -006 0-31 011 0-14 0-34 008(0-17)Branded food drinks n.a. 0-21 0-20 0-00 0-26 0-02(0-21)
Total Beverages 0-16 0-27 019 0-20 015 016(001)
miscellaneous:Baby foods, canned or bottled . n.a. n.a. n.a. n.a. n.a. -0-31 (015)Soups, canned 0-24 0-33 0-24 004 0-00 -002(006)
0-57(0-14)Soups, dehydrated and powdered 0-94 0-89 0-74 0-74 0-55Accelerated freeze-dried foods.
excluding coffee . n.a. n.a. n.a. n.a. n.a. n.a.Spreads and dressings 114 0-66 0-59 0-84 0-78 0-54(0-29)Pickles and sauces 0-51 0-43 0-41 0-38 0-22 0-35(0-08)Meat and vegetable extracts -0-02 0-21 0-12 0-33 0-16 -0-01(0- 10)
0-00(0-10)Table jellies, squares and crystals 0-54 0-20 0-25 0-47 0-34Ice cream (served as part of a
All quick-frozen foods, notmeal), mousse, souffle' . n.a. n.a. 0-83 0-90 0-85 0-68(0-17)
specified above . n.a. n.a. n.a. n.a. n.a. 1-25(0-78)Salt 0-34 013 0-06 0-31 010 -0-04(0-15)
Total Miscellaneous njs. n :i. I'M. n.a. n.n. 0-19(0-04)
ALL ABOVE POODS 0-30 0-28 025 0-27 023 0-20(0-01)
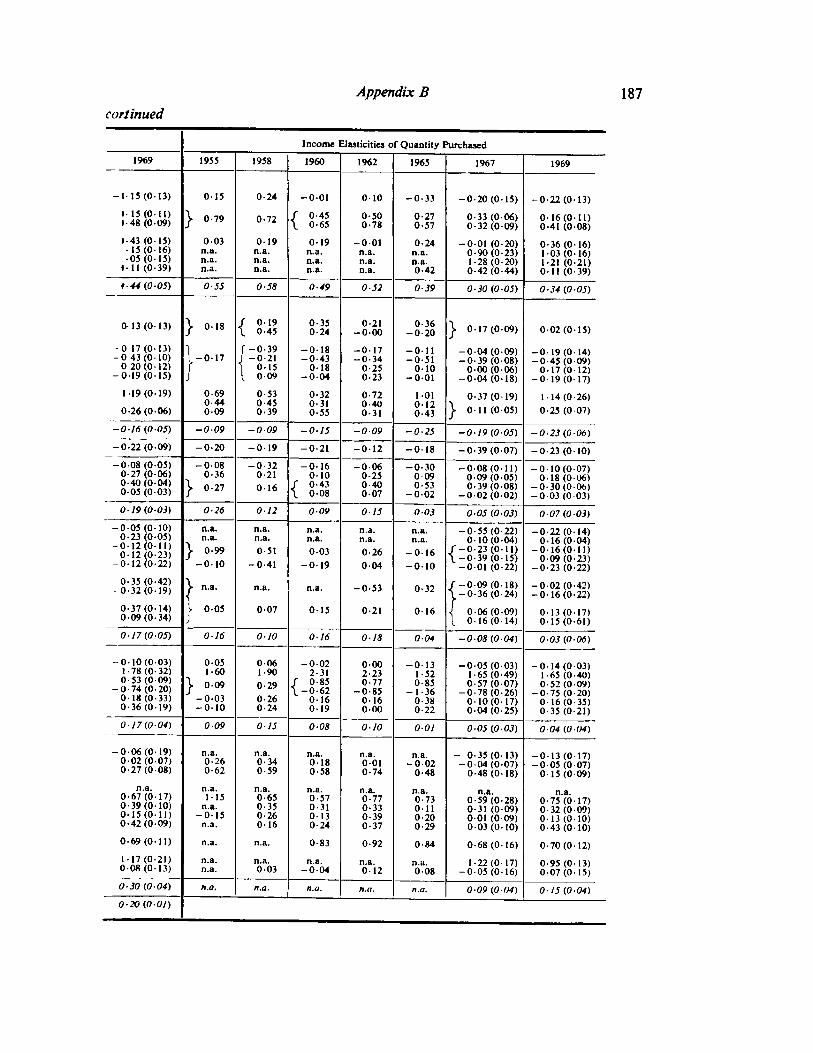
Appendix B 187
cortinued
Income Elasticities of Quantity Purchased
1969 1955 1958 1960 1962 1965 1967 1969
-1-13 (0-13) 0-15 024 -001 010 -0-33 -0-20(0- 15) -0-22(0-13)• 15(0-11)
} 0-79 0-72 / 0-45\ 0-650-500-78
0-270-57
0-33 (006)0-32(0-09)
016(011)0-41 (0-08)
•■48(009)
•-43(0-15)- 15 (0- 16)
003n.a.n.a.n.a.
019n.a.n.a.n.a.
019 -001 0*24n.a.n.a.
-0-01 (0-20) 0-36(0- 16)1-03 (0- 16)1-21 (0-21)0-11 (0-39)
:-05(0- 15)n.a.n.a.n.a.
n.a.n.a.
0-90 (0-23)1-28(0-20)0-42(0-44)••11(0-39) n.a. 0-42
i-44(0-05) 0-55 0-58 0-49 0-52 0-39 0-30(0-05) 0- 34 (005)
0-13(0-13) y o-is J 019 0-350-24
0-21-000
0-36-0-20 y 017(009) 0-02(0- 15)\ 0-45
-017(0-13)1—0-17
r-O-39J -0-211 0-15
-018 -017 -Oil -004(009) -0-19(0- 14)-0 43(0- 10) -0-43 -0-34 -0-51 -0-39(0-08) -0-45 (009)0 20(0-12){ 0-09
0-18 0-25 0-10 0-00(0-06) 0-17(0-12)-0-19(0- 15) -004 0-23 -001 -0-04(0-18) -0-19(0-17)
1-19(0-19)
0-26 (006)
0-69 0-530-450-39
0-320-310-55
0-720-400-31
1-010120-43
0-37(0-19)
} 011(005)1-14(0-26)
0-25(0-07)0-440-09
-0-16 (005) -009 -009 -0-15 -009 -0-25 -019(005) -0-23(0-06)
-0-22(0-09) -0-20 -019 -0-21 -012 -018 -0-39(0-07) -0-23(0-10)-0-08 (005)
0-27 (0-06)040(0-04)0-05 (0-03)
-0080-36
-0-320-21
-016 -0-060-250-40
-0-300-090-53
-0-08(0-11)009(0-05)0-39 (008)
-0-10(0-07)
} 0-27 016 / 0-430-10
-0-30(0-06)0-18(0-06)
\ 008 007 -0-02 -0-02(0-02) -003(003)019(005) 0-26 012 009 015 0-03 005 (003) 007(0-03)
-0-05(0- 10)0-23 (005)
n.a.n.a.
n.a.n.a.
n.a. n.a. n.a.n.a.
-0-55(0-22) -0-22(0-14)0-16(0-04)-012 (Oil)
0-12(0-23) } 0-99 0-51
n.a. n.a.
S -0-23 (0-11)0-10(0-04)
-016(011)0-09(0-23)-0-12(0-22) -010 -0-41
003
-0190-26
004-016 \- 0-39 (0-15)-010 -001 (0-22) -0-23(0-22)
0-35(0-42)-0-32(0-19) \ n.a. n.a. n.a. -0-53 0-32 / -0-09(0- 18)\ -0-36 (0-24)
-0-02(0-42)-0-16(0-22)
0-37(0-14)0-09(0-34)
1 0-05 007 015 0-21 0-16 -1 006(009)I 0-16(0-14)
0-13(0-17)0-15(0-61)J
0-17(0-05) 016 010 016 018 0-0* -0-08 (004) 0-OJ (0-06)
-010(003)1-78(0-32)0-53 (009)
0051-60
0-061-90
-002 0002-230-77
-0-85016000
-0131-520-85
-005(003)1-65(0-49)0-57(0-07)
-014(003)1-65(0-40)0-52(0-09)
-0-74(0-20)0-18(0-33)0-36(0-19)
"V 0-09 0-29 / 0-852-31
-003-010
0-260-24
\-0-62016
-1-360-380-22
-0-78(0-26)0-10(0- 17)0-04(0-25)
-0-75(0-20)0-16(0-35)0-35(0-21)019
0-17(0-04) 009 0-15 008 010 001 005(003) 0-04(0-04)
-0-06(0- 19)0-02(0-07)0-27 (0-08)
n.a.0-260-62
n.a.0-340-59
n.a. n.a.0-010-74
n.a.-002
0-48
- 0-35(0-13) -0-13(0-17)0-18 -0-04(0-07) -003(007)0-58 0-48(0-18) 015(009)
n.a.0-67(0-17)0-39(0-10)0-15(0-11)0-42 (009)
n.a.115
n.a.-015
n.a.
n.a.0-650-350-260-16
n.a.0-570-310-130-24
n.a, n.a. n.a.0-75(0-17)0-32(0-09)0-13(0-10)0-43(0-10)
0-77 0-73 0-59(0-28)0-31 (009)001 (0-09)0-03(0- 10)
0-33 0-110-39 0-200-37 0-29
0-69(0-11) n.a. n.a. 0-83 0-92 0-84 0-68(0-16) 0-70(0-12)1-17(0-21)008(0-13)
n.a.n.a.
n.a.003
n.a.-0-04
n.a.012
n.a.0-08
1-22(0-17)-0-05(0- 16)
0-95(0-13)0-07(0-15)
0-30(0-04) KM. nut. n.a. n.n ':.". 0-09 (004) 0-15(0-04)
0-20(0-01)

188 Household Food Consumption and Expenditure: 1969
Table 3
Estimates of Price Elasticities of Demand for Certain Foods, 1964-1969
Proportion of variationin monthly averagepurchases explained
Estimated price Significant by the by the priceelasticity and seasonal (S) price elasticity andits standard or annual (A) elasticity any significant
error shifts in 00 seasonal ordemand annual shifts
in demand
Condensed milk -2-33 (0-55) S & A 0-25 0-54Cheese, processed . -1-59(0.51) S & A 015 0-55
Beef & veal .... -1-24(0-15) (b) S 0-55 0-86Mutton & lamb -0-47 (0-27) (b) S & A 005 0-67Pork -1-12(0-31) (b) S & A 019 0-81
All carcase meat . -0-67(0-20) S & A 0-18 0-82Offals (including liver) -0-59(0-31) S & A 0-06 0-78Bacon & ham, uncooked -0-53 (0-32) S& A 005 0-46Bacon & ham, cooked (incl.
canned) .... -0-78(0-40) S & A 007 0-76Chicken, cooked -2-04(0-37) S & A 0-37 0-70Other canned meat (excl.
corned meat) -1-14(0-38) S & A 015 0-54Cooked & canned meat (excl.
chicken, ham, & corned) -0-99 (0-21) S& A 0-30 0-72Sausages, uncooked -0-77(0-56) S & A 003 0-51
Herrings & processed fish -0-62(0-30) S & A 007 0-78Canned salmon -1-59(0-45) S & A 019 0-80Other canned or bottled fish . -0-70(0-19) S 019 0-50Fish products (excl. quick-
frozen) .... -1-18(0-13) — 0-53 0-53
Eggs . . . -0 13 (0 08) S &A 005 0-47
-0-35(0-17) S & A 0-07 0-61Jams, jellies & fruits curd -0-63 (0-54) S & A 002 0-61Marmalade .... -1-13(0-44) S & A 011 0-30Syrup, treacle & honey . -0-53 (0-25) S 007 0-62
Potatoes .... -0 10(0 06) S 004 0-82Cabbages .... -0-52(0-11) S 0-29 0-76Cauliflowers .... -1-49(0-24) S 0-40 0-88Leafy salads .... -0-34(0-21) S & A 005 0-97
Quick-frozen peas . -1-22(0-77) S 004 0-81Fresh beans (c) -0-87(0-40) s 0-16 0-90Brassicas .... -0-57 (0 08) S 0-45 0-88Carrots -0-44(0-12) S 019 0-92Cucumbers (1966-1969) . -1-74(0-60) S & A 0-21 0-96Canned peas .... -1-48(0-37) S & A 0-23 0-65Canned beans -0-84(0-13) S 0-40 0-50Canned vegetables (other than
pulses or potatoes) -0-51 (0-31) S&A 005 0-80Dried pulses other than air-
-0-84(0-43) S & A 007 0-81
Oranges .... -1-27(0-29) S 0-25 0-91Other citrus fruit . -2-15(0-36) S&A 0-40 0-77
-0-44(0-10) S&A 0-28 0-84Pears — 1-31 (0-22) S&A 0-40 0-84Stone fruit, fresh (c) -1-89(0-30) S 0-62 0-91Tomatoes, fresh -0-36(0-11) S 016 0-98Tomatoes, canned & bottled . -0-79 (0-23) s 016 0-54
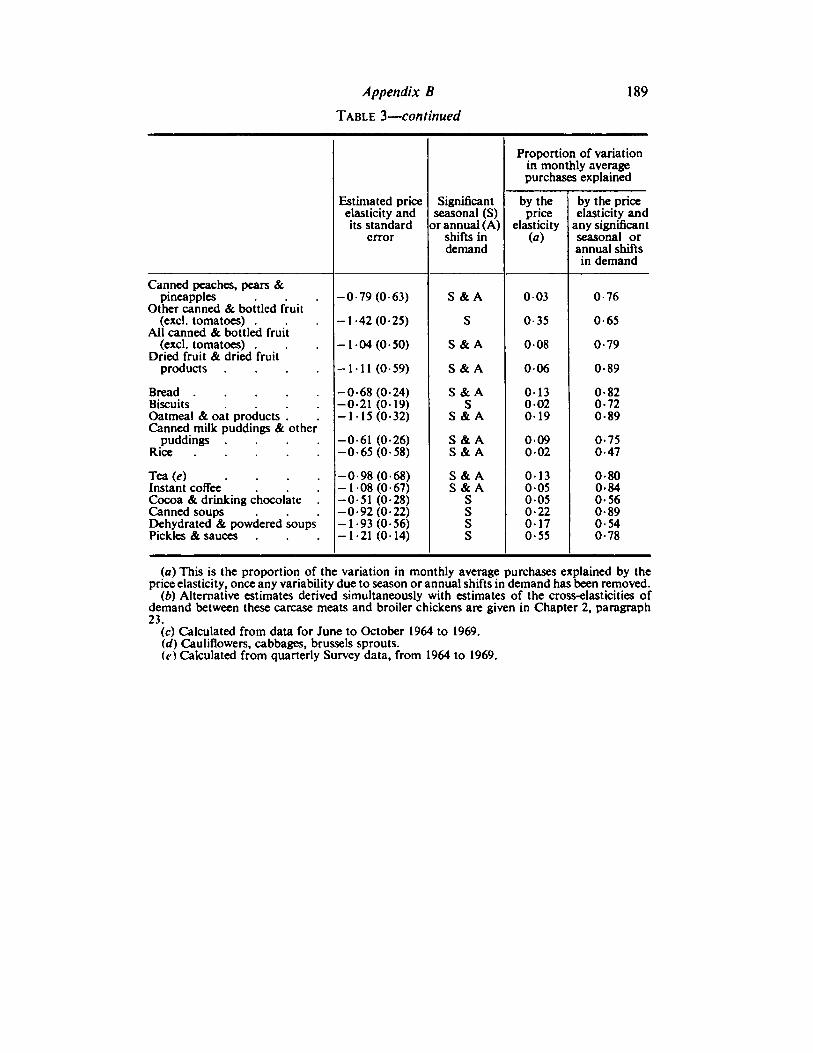
Appendix B 189
Table 3—continued
Proportion of variationin monthly averagepurchases explained
Canned peaches, pears &
Estimated priceelasticity andits standard
error
Significantseasonal (S)
or annual (A)shifts indemand
by theprice
elasticity
(a)
by the priceelasticity and
any significantseasonal orannual shiftsin demand
pineapplesOther canned & bottled fruit
-0-79(0-63)
-1-42(0-25)
-1-04(0-50)
-1 11 (0-59)
S & A 003
0-35
008
006
0-76
0-65
0-79
0-89
(excl. tomatoes) .All canned & bottled fruit
S
(excl. tomatoes) .
Dried fruit & dried fruitS & A
S & Aproducts ....Bread .....Biscuits ....Oatmeal & oat products .
Canned milk puddings & otherpuddings ....
Rice
-0-68(0-24)-0-21 (019)-1-15(0-32)
S & AS
013002019
0-820-720-89S & A
-0-61 (0-26)-0-65 (0-58)
S & AS & A
009002
0-750-47
Tea(e) ....Instant coffee
-0-98 (0-68)-1-08(0-67)-0-51 (0-28)-0-92(0-22)-1-93 (0-56)-1-21 (014)
S & AS & A
S
0130050050-220170-55
0-800-840-560-890-540-78
Cocoa & drinking chocolate .
Canned soups sss
Dehydrated & powdered soupsPickles & sauces .
(a) This is the proportion of the variation in monthly average purchases explained by theprice elasticity, once any variability due to season or annual shifts in demand has been removed.
(b) Alternative estimates derived simultaneously with estimates of the cross-elasticities ofdemand between these carcase meats and broiler chickens are given in Chapter 2, paragraph23.
(c) Calculated from data for June to October 1964 to 1969.
(d) Cauliflowers, cabbages, brussels sprouts.
(e) Calculated from quarterly Survey data, from 1964 to 1969.
APPENDIX C
Estimates of National Supplies of FoodMoving into Consumption
The National Food Survey estimates of average consumption per head presentedin this Report relate only to food consumed in private households in GreatBritain. For some purposes, however, it is useful to have estimates of the totalquantities of food obtained for consumption in the whole of the UnitedKingdom, including food used in the manufacture of soft drinks and sweets,
food consumed in catering establishments or in institutions such as hospitals,boarding schools and prisons, food consumed by HM Forces and food which,though purchased by individuals living in private households, is not taken hometo form part of the household supply. In practice it is necessary to obtain suchoverall estimates not by measuring the quantities consumed by each of the
various categories of final user but by making measurements at an earlier stagein the distributive chain(1). Estimates (expressed as averages per head per year)
of national supplies of the main foods moving into consumption in the UnitedKingdom for each of the years 1964 to 1969 are given below.
(1) The relationship between National Food Survey results and estimates of national suppliesof food moving into consumption was discussed in the Annual Report for 1967, HouseholdFood Consumption and Expenditure: 1967, Appendix F, HMSO, 1969.
190
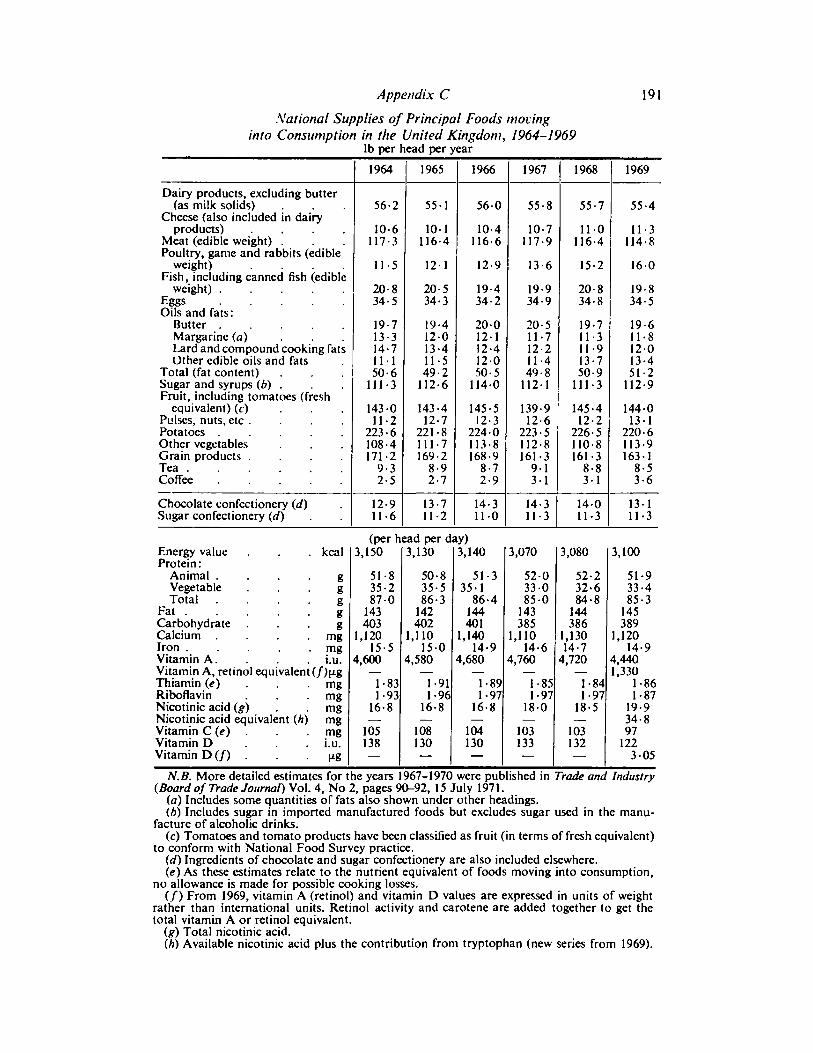
Appendix C 191
National Supplies of Principal Foods movinginto Consumption in the United Kingdom, 1964-1969
lb per head per year
Dairy products, excluding butter
1964 1965 1966 1967 1968 1969
(as milk solids) 56-2 551 560 55-8 55-7 55-4Cheese (also included in dairy
products) .... 10-6 101 10-4 10-7 110 11-3Meat (edible weight) . 117-3 116-4 116-6 117-9 116-4 114-8Poultry, game and rabbits (edible
weight) .... 11-5 121 12-9 13-6 15-2 160Fish, including canned fish (edible
20-8 20-5 19-4 19-9 20-8 19-8Eggs 34-5 34-3 34-2 34-9 34-8 34-5Oils and fats:
Butter 19-7 19-4 200 20-5 19-7 19-6Margarine (a) ... 13-3 120 121 11-7 11-3 11-8Lard and compound cooking fats 14-7 13-4 12-4 12-2 11-9 120Other edible oils and fats 111 11-5 120 11-4 13-7 13-4
Total (fat content) 50-6 49-2 50-5 49-8 50-9 51-2Sugar and syrups (6) . 111-3 112-6 1140 1121 111-3 112-9Fruit, including tomatoes (fresh
equivalent) (c) ... 143-0 143-4 145-5 139-9 145-4 1440Pulses, nuts, etc . 112 12-7 12-3 12-6 12-2 131Potatoes 223-6 221-8 224-0 223-5 226-5 220-6Other vegetables 108-4 111-7 113-8 112-8 110-8 113-9Grain products .... 171-2 169-2 168-9 161-3 161-3 163-1Tea 9-3 8-9 8-7 9-1 8-8 8-5Coffee 2-5 2-7 2-9 31 31 3-6
Chocolate confectionery (d) 12-9 13-7 14-3 14-3 140 131Sugar confectionery (d) 11-6 11-2 110 11-3 11-3 11-3
(per head per day)Energy value kcal 3,150 3,130 3,140 3,070 3,080 3,100Protein:
Animal .... 8 51 -8 50-8 51-3 52-0 52-2 51-9Vegetable g 35-2 35-5 351 330 32-6 33-4Total .... g 870 86-3 86-4 850 84-8 85-3
Fat g 143 142 144 143 144 145Carbohydrate g 403 402 401 385 386 389
Calcium .... mg 1,120 1,110 1,140 1,110 1,130 1,120Iron mg
i.u.15-5 15-0 14-9 14-6 14-7 14-9
Vitamin A. 4,600 4,580 4,680 4,760 4,720 4,440Vitamin A, retinol equivalent (f)ug — — — — — 1,330Thiamin («)... mg 1-83 1 -91 1-89 1 -85 1-84 1-86Riboflavin mg 1-93 1-96 1-97 1 -97 1-97 1-87Nicotinic acid (g) mg 16-8 16-8 16-8 18-0 18-5 19-9Nicotinic acid equivalent (h) mg — — — — — 34-8Vitamin C (e) . mg 105 108 104 103 103 97Vitamin D i.u. 138 130 130 133 132 122Vitamin D (/) . — — — — — 3 05
N.B. More detailed estimates for the years 1967-1970 were published in Trade and Industry(Board of Trade Journal) Vol. 4, No 2, pages 90-92, 15 July 1971.
(a) Includes some quantities of fats also shown under other headings.
(b) Includes sugar in imported manufactured foods but excludes sugar used in the manufacture of alcoholic drinks.
(c) Tomatoes and tomato products have been classified as fruit (in terms of fresh equivalent)to conform with National Food Survey practice.
(d) Ingredients of chocolate and sugar confectionery are also included elsewhere.
(e) As these estimates relate to the nutrient equivalent of foods moving into consumption,no allowance is made for possible cooking losses.
(/) From 1969, vitamin A (retinol) and vitamin D values are expressed in units of weightrather than international units. Retinol activity and carotene are added together to get thetotal vitamin A or retinol equivalent.
Total nicotinic acid.Available nicotinic acid plus the contribution from tryptophan (new series from 1969).
Glossary of Terms used in the Survey
General Note. The Survey records household food purchases and food obtainedwithout payment during one week. It does not include the following: foodeaten outside the home (except packed meals prepared at home); chocolateand sugar confectionery; mineral waters, squashes and alcoholic drinks; vitaminpreparations; food obtained specifically for consumption by domestic animals.
Adolescent. A person of 15 to 20 years of age inclusive.
Adult. A person of 21 years of age or over.
Average Consumption. The aggregate amount of food obtained for consumption(q.v.) by the households in the sample divided by the total number of persons inthe sample.
Average Expenditure. The aggregate amount spent by the households in the
sample divided by the total number of persons in the sample.
Average Price. Sometimes referred to as "average unit value". The aggregate
expenditure on an item in the Survey classification of foods divided by the
aggregate quantity of that item purchased by those households.
Child. A person under 15 years of age.
Consumption. See "Food Obtained for Consumption".
Conurbation. See "Type of Area".
Convenience Foods. Those processed foods for which the degree of preparationhas been carried to an advanced stage by the manufacturer and which may be
used as labour-saving alternatives to less highly processed products. The convenience foods distinguished by the Survey are cooked and canned meats, meat
products, cooked and canned fish, fish products, canned vegetables, vegetable
products, canned fruit, fruit juices, cakes and pastries, biscuits, breakfastcereals, puddings (including canned milk puddings), cereal products, instantcoffee and coffee essences, baby foods, canned soups, dehydrated soups, ice
cream bought to serve with a meal, and all "cabinet trade" quick-frozen foodsbut not uncooked poultry or uncooked white fish.
Deflated Price. See "Real Price".
Elasticity of Demand. A measure for evaluating the influence of variations inprices (or in incomes) on demand. With some approximation it can be said thatthe elasticity indicates by how much in percentage terms the amount bought (inquantity or value as appropriate) will change if the price (or income) increases
by one per cent; a minus sign attached to the elasticity coefficient indicates thatdemand will decrease if the price (or income) rises. The elasticity of demand fora commodity with respect to changes in its own price is usually called the priceelasticity of demand, but may be described as the own-price elasticity where it is
necessary to avoid confusion with cross-elasticities of demand or cross-priceelasticities which are the terms used to describe the elasticity of the demand for
192
Glossary 193
one commodity with respect to changes in the prices of other commodities. The
elasticity of demand for a commodity with respect to changes in real income iscalled the income elasticity of demand; if the change in demand for the commodity is measured in terms of the percentage change in the amount of the commodity, the elasticity may be referred to as an income elasticity ofquantity, but if the
change in demand is measured in terms of the percentage change in expenditure,the elasticity is referred to as an income elasticity of expenditure. More formally,if the relationship between the demand (Q) for a commodity and the level ofincome (Y), the price of the commodity (P) and the prices of other commodities
Pi, Pa, . . . Pj, . . . Pn is known, then the own-price elasticity is given by^
•
^»
the cross-price elasticities by and the income elasticity of quantity by
When determining a set of own-price and cross-price elasticities of
demand for a group of commodities constraints are imposed to ensure thateach pair of cross-elasticities comply with the theoretical relationships whichshould exist between them (e.g. the elasticity for beef with respect to the price ofpork should be in the same ratio to the coefficient for pork with respect to the
price of beef as expenditure on pork is to expenditure on beef).
Expenditure Index. The average expenditure at one period in time expressed as a
percentage of the corresponding average at another period.
Family Households. Households containing one adult of each sex and childrenor adolescents.
Foods, Survey classification of. See Appendix A, Table 11, which lists the 145
food codes used in the Survey to classify food purchases.
Food Obtained for Consumption. Food purchases plus garden and allotmentproduce, etc. (q.v.). The average consumption quantities may differ slightlyfrom the sum of the components, owing to rounding.
Garden and Allotment Produce, etc. Food which enters the household withoutpayment, for consumption during the week of participation in the Survey; itincludes supplies obtained from a garden, allotment or farm, or from an em
ployer, but not gifts of food from one household in Great Britain to another ifsuch food has been purchased by the donating household. {See also "Value ofgarden and allotment produce, etc. ")
Household. For Survey purposes, this is denned as a group of persons living inthe same dwelling and sharing common catering arrangements.
Income Group. Households are grouped into seven income groups (Al, A2, B,C, Dl, D2 and OAP) according to the ascertained or estimated gross income ofthe head of the household, or of the principal earner in the household if the
weekly income of the head is less than the amount defining the upper limit toincome group D. Agricultural workers are placed in income group C (eventhough their minimum weekly wage has sometimes been slightly less than the
194 Household Food Consumption and Expenditure: 1969
lower limit for that group), so as to keep the occupational composition ofincome groups C and Dl as closely as possible the same as that in previousyears. This definition is synonymous with that of "social class" in previousannual reports.
Index of Real Value of Food Purchased. The expenditure index (q.v.) divided bythe food price index (q.v.); it is thus, in effect, an index of the value of food purchases at constant prices.
Larger Towns. See "Type of Area".
Net Balance. The net balance of an individual (a member of the household or a
visitor) is a measure of the number of meals eaten in the home by that individualduring the Survey week, each meal being given a weight in proportion to itsimportance. The net balance is used when relating nutrient intake to need. (Seeparagraph 20 of Appendix A.)
Nutrients. In addition to the energy value of food expressed in terms of kilo-calories and megajoules (4 184 megajoules= 1,000 kilocalories), the food is
evaluated in terms of the following nutrients:
Protein (animal and total), fat, carbohydrate, calcium, iron, vitamin A(retinol, (3-carotene, retinol equivalent), thiamin, riboflavin, nicotinic acid(total, tryptophan, nicotinic acid equivalent), vitamins C and D.
Separate figures for animal and total protein are included : as a generalization,proteins of animal origin are of greater value than those of vegetable origin, andare often associated with sources of B vitamins, so that the proportion of animalprotein is to some extent an indication of the nutritive value of the diet.
Nutrient Conversion Factors. Quantities of nutrients available per unit weight ofeach of the categories into which foods are classified for Survey purposes. (Seeparagraph 16 of Appendix A.)
Old Age Pensioner Households (OAP). Households in which the head of the
household is in receipt of a state retirement pension (contributory), or non-contributory old age pension (or pension of a widow over 60 years of age), andsuch pensions form the sole or the main source of the household income.
Older Couple. A man and a woman, one or both aged at least 55 years.
Person. An individual of any age who during the week of the Survey has at least
half of his meals in the household (" at home ") ; for this purpose meals taken at
different times of the day are weighted according to their relative importance.
(See paragraph 20 of Appendix A.)
Price. See "Average Price", also "Real Price".
Price Flexibility. A measure of the extent to which the price of a commodity is
affected by a change in the level of supply, other things remaining equal. Insimplified terms and with some degree of approximation, it may be regarded as
the percentage change in price associated with a 1 per cent change in the level of
Glossary 195
supply. If only a single commodity is under consideration, the price flexibilitymay be regarded as the reciprocal of the price elasticity. (See "Elasticity of Demand ".) If, however, the relationship between demand and prices of a number ofrelated commodities is being considered, the matrix of price flexibilities and cross-
price flexibilities is the inverse of the corresponding matrix of own-price andcross-price elasticities, and will, in general, not be identical with the reciprocalsof the individual elasticities.
Price Index. Two kinds of price index are used in the tables of Survey results.
When comparing food prices over a period of time a price index of Fisher"Ideal "
type is used ; this index is the geometric mean of two indices with weightsappropriate to the earlier and later periods respectively. When comparing the
level of prices paid by one group of households with that paid by another at a
point in time, a price index is used which compares the cost of the national aver
age basket of food with its cost at the prices paid by each group.
Provincial Conurbations. See "Type of Area".
Real Price. The price of an item of food in relation to the price of all goods andservices. The term is used when referring to changes in the price of an item overa period of time. It is measured by dividing the average price (q.v.) paid at a
point in time by the General Index of Retail Prices (all items) at that time.
Recommended Intakes of Nutrients (Table 9 ofAppendix A). Estimates consistentwith and based on recommendations of the Department of Health and SocialSecurity given in Recommended Intakes of Nutrients for the United Kingdom;Reports on Public Health and Medical Subjects, No. 120, HMSO 1969. Averagesof nutrient intakes are compared with these recommendations for each group ofhouseholds identified in the Survey. (See paragraph 19 of Appendix A.)
Regions. The standard regions for statistical purposes (as revised in mid-1965)except that East Anglia is combined with the South East Region : see Table 1 ofAppendix A.
Rural Areas. See "Type of Area".
Seasonal Foods. Those foods which regularly exhibit a marked seasonal variationin price or in consumption ; these are (for the purposes of the Survey) liquidmilk (full price), cream, eggs, fresh and processed fish, shell fish, potatoes, freshvegetables and fresh fruit; in the interests of continuity, liquid milk (full price)has been retained in this group, although its price has not varied seasonally in all
years.
Semi-rural Areas. See "Type of Area".
Smaller Towns. See "Type of Area".
Type of Area. The following are distinguished:
Conurbations. As defined by the Registrars-General. These are the largest
contiguous urban areas in the country, which are, to a greater or lesser extent,
196 Household Food Consumption and Expenditure: 1969
focal points of economic and social activity. The London conurbation is the
area administered by the Greater London Council.
Provincial conurbations. The largest areas of continuous urban developmentoutside London, centred in Birmingham, Manchester, Liverpool, Leeds,
Newcastle-upon-Tyne and Glasgow.
Larger towns. Other boroughs and urban districts with a population of100,000 or more, urban areas adjoining such boroughs and urban districts
(or a conurbation), and other contiguous urban areas with an aggregate
population of 100,000 or more.
Smaller towns. All other urban areas.
Semi-rural areas. Rural districts which are either contiguous to urban areas
with a population of 25,000 or more, or which themselves have a populationdensity exceeding one person per four acres.
Rural areas. All other rural districts.
Value of Garden and Allotment Produce, etc. The value imputed to such supplies
received by a group of households is derived from the average prices currentlypaid by the group for corresponding purchases. This appears to be the onlypracticable method of valuing these supplies, though if the households concernedhad not had access to them, they would probably not have replaced them fullyby purchases at retail prices, and would therefore have spent less than the esti
mated value of their consumption. School milk is not valued, and cheap welfaremilk and welfare orange juice are recorded at the prices paid for them.
Younger Couple. A man and a woman, both under 55 years of age.
Symbols and Conventions used
Symbols. The following are used throughout:
-=nil... = less than half the final digit shown
n.a. = not available or not applicable
Rounding offigures. In tables where figures have been rounded to the nearest
final digit, there may be an apparent slight discrepancy between the sum of the
constituent items and the total shown.
Index(Numbers refer to paragraphs; App —Appendix)
Age of housewife, classification 68Age of housewife, group differences 6, 68-
73, 102, 103Apples 37, 114
Baby foods 43Bacon 26, 110
Bananas 37, 114
Beans 34Beef and veal 20, 22-25, 110
Beverages 3, 14, 42, 106 (see also individualfoods)
Biscuits 40, USBread 11, 14, 39, 106, 115Breakfast cereals 41, 115
British Medical Association—Committee onNutrition, Recommended energy andnutrient allowances 84
Brussels sprouts 33, 113
Buns, scones, teacakes 40Butter 3, 14,29, 112
Cabbage 33, 113
Cakes and pastries 40, 115
Calcium 94, 97Calories (see Energy Value)Canned foods (see individual foods)Carbohydrates 89, 95-98, 102, 103, 117,
App. ACarrots 36Cauliflower 33, 113
Cereal foods 3, 11, 14, 15, 39-41, 106
Cheese 3, 14, 18, 109
Citrus fruit 37Cocoa 42Coffee 42, 116
Consumers' expenditure 1Consumption patterns —
age of housewife within broad socioeconomic groups 72
family types within income groups 64household type 59, 81
income group 55, 80national average 16-43, 109-116regions 47, 52, 76-79type of area 48, 52, 53, 76-79
Convenience foods 3, 12, 13, 55 (see alsoindividual foods)
Co-operative shops 75-82Cream 17
Cucumbers 36
i 3, 11, 14, 28, 111
Energy value —age of housewife within broad socio
economic groups 8, 102-103family type within income groups 8, 100-
101
household type 8, 98-99income group 8, 96-97national average 8, 9, 88, 117
national food supplies App. Cregions 8, 94-95type of area 8, 94-95
Expenditure on foodage of housewife within broad socio
economic groups 6, 71family type within income groups 6, 64household type 6, 59income group 5, 55, 57
national average 3, 9, 11, 13, 15, 17-21,26, 27, 29, 31, 35-37, 39, 105-107
regions 4, 47-49type of area 4, 47-49
Family composition differences within income groups 6, 63-67, 100, 101
Fat (content of the diet) 89, 95, 97, 98, 103,117, App. A
Fats 3, 14, 29, 106, 112 (see also individualfoods)
Fish 27, 106, 111
Flour 39, 106, 115
Food consumption levels App. CFruit 3, 11, 14, 15, 37-38, 78, 80-82, 114
Garden, allotment supplies 11, 32, 34, 36,37, 55
Geographical differences 4, 45-53, 76-79,93-95
Groceries 79-82 (see also individual foods)
Health and Social Security, Departmentof—recommended intakes 8, 84-86, 91,97, 99, 102, App. A
Honey (see Preserves)Household composition differences 6, 58-
73, 81, 98-103
Ice-cream 43Income—
elasticities 10, App. Bfamily 66, App. Bgroup differences 54-57, 80, 96-97, App.
Ahead of household 54, App. Apersonal disposable 1
principle earner App. AIndependent shops 75-82Iron 90, 94, 97, 100, 102, 117
Jam (see Preserves)
Lamb (see Mutton and Lamb)Lard 29, 112
Leafy salads 35
Margarine 3, 14, 29, 112
Marmalade (see Preserves)Meals taken outside the home App. AMeat including products 11, 14, 15, 19-26,
76-77, 80-32, 106, 110
Methodology App. AMilk 11, 17, 109
Multiples shops 75-82Mushrooms 36Mutton and Lamb 20, 22-25, 1 10
197
198
Nicotinic acid 90, 94, 97, 117, App. ANutrient content of the diet (see also indivi
dual nutrients) —age of housewife within broad socio
economic groups 102-103family type within income groups 100-
101
household type 98-99income group differences 96-97national averages 88-92, 117
national food supplies App. Cregions 93-95type of area 93-95
Nutritional analysis of survey results App.A
Onions 36Oranges 37, 113
Pears 37, 113
Peas 34Pensioner households 54, 80, 96, 97Pickles and sauces 43, 116
Pork 20, 22-25, 110Potatoes, including products 3, 11, 14, 32,
106, 113Poultry 3, 14, 21-25, 110
Preserves 3, 14, 30, 112
Price elasticities 10, 22-25, App. BPrice of energy indices 51, 56, 61, 67
Prices of foodage of housewife within broad socio
economic groups 73
household type 6, 60income groups 5, 55
national averages 3, 12-14, 22-25, 32, 33,
35, 39regions 4, 50type of area 4, 50type of shop 82
Protein 89, 94, 95, 97, 98, 100, 102, 103, 117,App. A
Puddings, canned 41, 115
Quick-frozen foods (see individual foods)
Reconciliation of nutritional results App. AReliability of Survey results App. AResponse rate App. ARetinol equivalents (see Vitamin A)Rhubarb 114
Riboflavin 94, 97
Sample 11, App. ASauces 43, 116
Scotland 4, 47, 49, 50, 52, 76, 78, 95, App. ASeasonal foods 12, 13, 55 (see also indivi
dual foods)Shops, type of, used by housewives 7, 74-82Soups 43, 116
Standard errors App. ASugar 3, 14, 30, 112
Supplies moving into consumption App. CSyrup (see Preserves)
Tea 42, 116
Thiamin 90, 97, 100, 102, 117, App. ATomatoes 37, 114
Tryptophan (see Nicotinic Acid)
Veal (see Beef and veal)Vegetables 3, 11, 14, 15, 31-36, 78, 80, 81,
106, 113
Vegetable and salad oils 29, 112
Visitors App. AVitamin A 90, App. AVitamin C 94, 97, 103
Vitamin D 8, 91, 95, 97, 98, 99, 100, 102,
117, App. A
Wales 4, 47, 50, 51, 52, 76, 78, 95, App. AWastage 83, App. A
Printed in England for Her Majesty's Stationery Office, byMcCorquodale Printers Ltd., London.
HM 5057 Dd. 502603 K17 11/71 McC 3309