Embed Size (px)
Citation preview
HOUSEHOLD BEHAVIOR ON SOLID WASTE MANAGEMENT: A
CASE OF KATHMANDU METROPOLITAN CITY
Abstract
This paper tries to show the household behavior of Kathmandu residents towards solid waste
management. The paper is the outcome of a primary survey of 432 households covering different
parts of the city of Kathmandu. The daily per capita waste generation in Kathmandu is 0.29 kg
and is lower in the core zone than in the outer and middle zones. This indicates that as there is
more open space to throw the waste people usually generate more waste. Household size and
income are the major determining factors for the total quantity of wastes generated in all the zones.
About 80% of the households are willing to pay for better management of waste. This comes to
about Rs. 72 per household per month. The willingness to pay is highest in the outer zone and
lower in the core zone. The main factor determining the “Willingness to Pay” is income.
1. INTRODUCTION
Prior to 1950, there was hardly any problem of solid waste management in Nepal. The solid waste
was locally managed in all the urban areas of Nepal including Kathmandu Valley. Almost all the
wastes was organic in nature and was used as manure (Tuladhar 1996). Traditionally, only a special
caste (i.e. Pode or Chyame) was involved in waste management activities. In the past, these people
collected the waste from settlements using primitive tools such as buffalo ribs to lift the waste and
shoulder baskets (Kharpan) to carry the wastes (Tuladhar 1996). The wastes collected were
dumped on nearby river banks or in open fields. In those days, the flow of water in nearby rivers
was capable in degrading the dumped organic wastes which were small in quantity. But these
traditional practices could not continue due to the increasing population densities in urban areas.
Increase in population density has lead to the increase in the volume of waste. This has created a
massive threat to public health due to the lack of proper solid waste management.
1
Thus after the mid-1960s initiation started in the diagnosis of the problem and some short-term as
well as long term suggestions were given by different studies (Flinthoff1, 1970; Tabasaran, 1976
and 1981; Croll 1978). These studies were basically meant for the smooth functioning of the Solid
Waste Management Project and quick collection and disposal of the waste. Some other studies were
on the possibility of pricing for garbage services (Agrawal et al. 1982; Flinthoff, 1970; GTZ 1996;
SWMB GTZ 1985).
1.2 Rational
Even with all these research and studies, the problem of solid waste management in Kathmandu has
been increasing over the years. Presently, the task of solid waste management comes under the
auspices of concerned municipalities. The service is provided almost free of charge using funds
available at the disposal of the municipalities. Nearly 20-25% of the total budget of the Metropolis
goes for solid waste management (KMC, Department of Solid Waste Management, 1998).
One of the studies conducted by the Central Bureau of Statistics shows that unmanaged waste
disposal was considered the main cause of environmental problems in Kathmandu followed by
unmanaged sewage (CBS 1996, in CBS 1998 a). Thus solid waste management is a growing issue
in the context of urban environmental degradation of Kathmandu. The rate of growth of population
of the Kathmandu Valley is more than 6%, which is the highest among the cities of Nepal. Due to
the rapid increase in population and increase in the consumption of packed goods, the amount as
well as the quantum of non-biodegradable waste is increasing over time. Among the total waste
generated in Nepal, 80% is generated only from Kathmandu and only 30% of the total urban refuse
is being collected in containers and transferred to the landfill site (Thapa et al. 1999).
1.2. Studies on the Economics of Solid Waste Management
Solid waste management is also a non-excludable good as it is difficult to be protected by the
general market forces. One way of managing non-excludable goods or services is either by the
internalization of costs (by levying charges for the use of the services) or by following a command
and control policy or a combination of both. Government intervention is necessary for this. The
rationality of the government’s intervention can be judged when the costs of producing the good or
service decline as more of the good or service is produced and when production or use of the good
or service results in "externalities" such as environmental pollution (Macauley and Walls, 1995;
1 Mr. F. Flinthoff was from WHO Regional Office for South East Asia and stayed as a short-term consultant in Kathmandu about the end of 1970 for a period of two months. He gave a report named Assignment Report in the Solid Waste Management in Kathmandu Who-Project Searo. 0150, 1970.
2

Jenkins, 1993). Thus, the major problem for solid waste management is the internalization of costs
of waste disposal.
In the early days economists discussed about the socio-economic factors influencing waste
generation by the households. Wertz (1976) discussed about the economic aspects of household's
decisions to produce more or less refuse. He mainly analyzed the theoretical concept about
household behavior on waste generation due to the changes in income, price of refuse service,
frequency of service, site of refuse collection and packaging. He also discussed on resource
implications of the local government policy, which refrains from the pricing of public refuse
service to households.
Economists also compared the composition and quantity of waste in terms of income level,
household size and age structure of the household. The household size, household income and
population were important factors affecting the quantity and composition of solid waste. The study
shows that grass, yard wastes and newspaper were positively correlated to the level of income
(Richardson et al. 1978). The present paper attempts to apply these models in the context of
developing country like Nepal with some modification.
1.3 Objectives:
The objectives of this paper are to discuss household behavior regarding waste generation and
management of waste; the relationship of the waste component in different zones within the city;
and the “willingness to pay” for changes in the provision of waste management services.
1.4 Methodology:
The study was conducted using primary information. Information from households was collected
using a structured questionnaire. The Kathmandu Metropolis is divided into 35 wards. Wards are
not homogenous but heterogeneous in terms of population density and land use patterns.
1.4.1 Selection of Areas and size of the Sample:
All the wards can be categorized into three main groups i.e. Core, Middle and Outer depending on
population density, settlement and land use pattern. 5 wards (15%) out of the 35 were selected for
field study. To make the sample more representative, wards were selected in such a way that they
covered all the zones i.e. Core, Middle and Outer. Thus, 3 wards from the core, 1 from the outer
3

and 1 from the middle zone were selected. Table 1 shows the detail regarding the selected wards
and size of the sample.
Table 1 Sample HouseholdsWard Total
households (Nos.)
Sample households (Nos.)
Total Households (%)
Area Covered by sample (Sq. km.)
Total Population
Population Density per sq. Km
14 3460 173 05 3.03 18425 6080.9
18 775 41 05 0.19 8081 42531.6
19 1122 57 05 0.16 7588 47425.0
28 385 31 08 0.07 5077 72528.6
35 2486 130 05 3.95 12000 3038.0
Total 8228 432 05.25 7.4 51171 6915
Total population data is as per the census of 1991.
About 5% of the households were selected from among the households of the selected wards. Thus
in total 432 households were selected from the selected 5 wards. The households were selected
randomly with the help of the voters’ list. Attempts were made to cover the entire locality within
the ward.
1.4.2 Justification of the Sample Size:
To depict the reliability of the overall situation of the population, the selected sample should
contain a sufficient number of households. Therefore, to reduce costs, simplify management and
control of the quality of the interviews, the sample size was kept within reasonable limits. In order
to ensure representative views, each household was provided an equal opportunity to be selected in
the sample.
Sampling Error (SE): SE is the error inherent in making inferences for the whole population from
observing only some of its members. It is considered as a guideline as to what the sample size
should be, in order to guarantee a maximum given error when estimating a proportion from the
sample.
For a pure random sample drawn from an infinite population, the following formula has been taken
as the basis for computing the sample size;
n = k2 p (1-p)/e2
4

Where, p is the value of the proportion in the population, e is the acceptable error and k is a
coefficient dependent on the confidence level for = 0.95 ( i.e. " 95 % confidence level”) k =
1.96. The term p(1-p) is maximum for p = 0.5. Then the formula becomes:
n = 0.9604/e2
Thus, to achieve a maximum error of 0.05 (5%) in the estimation of proportion, n = 0.9604/05 2 =
384. Therefore, a minimum sample size of 384 households is required.
1.4.3 Data Collection Method:
The name and number of the household head was collected from the final voters’ list of 2000 for
the 5 selected wards. After preparing the list of the household head sample households were
selected randomly using the random Table. The information from the household was collected with
the help of a structured questionnaire. The questionnaire was finalized after a pre-test. The pre-test
was made in ward no. 14 with 5% (25) of the sample households. The result of the pre-test was
presented in a closed door meeting with the team of University Professors. The questionnaire was
finalized incorporating all the suggestions provided by the Professors. The questions were on
demographic characteristics of the households, information on waste generation by types, waste
disposal practices (e.g. throwing in street, river, burning etc.), door-to-door collection systems,
monthly fee, and willingness to pay for the better management of waste and causes for not willing
to pay. Family income, sources of income, education level, and possession of domestic amenities
were also among the questions asked.
The questions were filled by visiting the selected households from August to November 2001. The
households were visited twice to complete the questionnaire. On the first day socio-economic
information were collected and households requested to deposit the wastes in different plastic bags.
On the next day the wastes were weighted. Three research assistants (one from each zone) were
employed for the work.
1.4.4 Analytical Method:
The data were entered in the computer and analyzed using different statistical tools. Data were
grouped for the Core, Middle and Outer zones. Some of the information was analyzed using simple
statistical tools and others analyzed econometrically. The econometric models used for the analysis
of household behavior and Willingness to Pay is given in the relevant sections.
5
2. MAJOR FINDINGS OF THE STUDY
2.1 Waste Generation in the Households:
The table 2 shows that average waste generation by the households is 0.29kg per capita per day
(0.26kg in the core zone, 0.32kg in the outer zone and 0.29kg in the middle zone). Waste
generation is higher in the outer zone and lower in the core zone. This may be due to the sufficient
open spaces available in the surroundings of the outer zone. In the core zone people have no space
and so they may be generating less waste.
Table: 2 Per Capita Waste Generation by the households
Zone Waste generation (Kg./ HH /day )
Std. Dev. Min Max Total waste ( Kg.)
Per capita waste generation in a day (Kg.)
All zone 1.91 1.27 0.33 9.15 824.14 0.29
Core Zone 1.98 1.26 0.53 9.15 255.63 0.26
Middle
Zone
1.85 1.28 0.33 6.99 320.43 0.29
Outer
Zone
1.91 1.28 0.51 7.63 248.1 0.32
The percentage of people following the separation practice is also very high in the core zone as
compared to other zones (Table 4). This may also be responsible for the low waste generation in the
core zone.
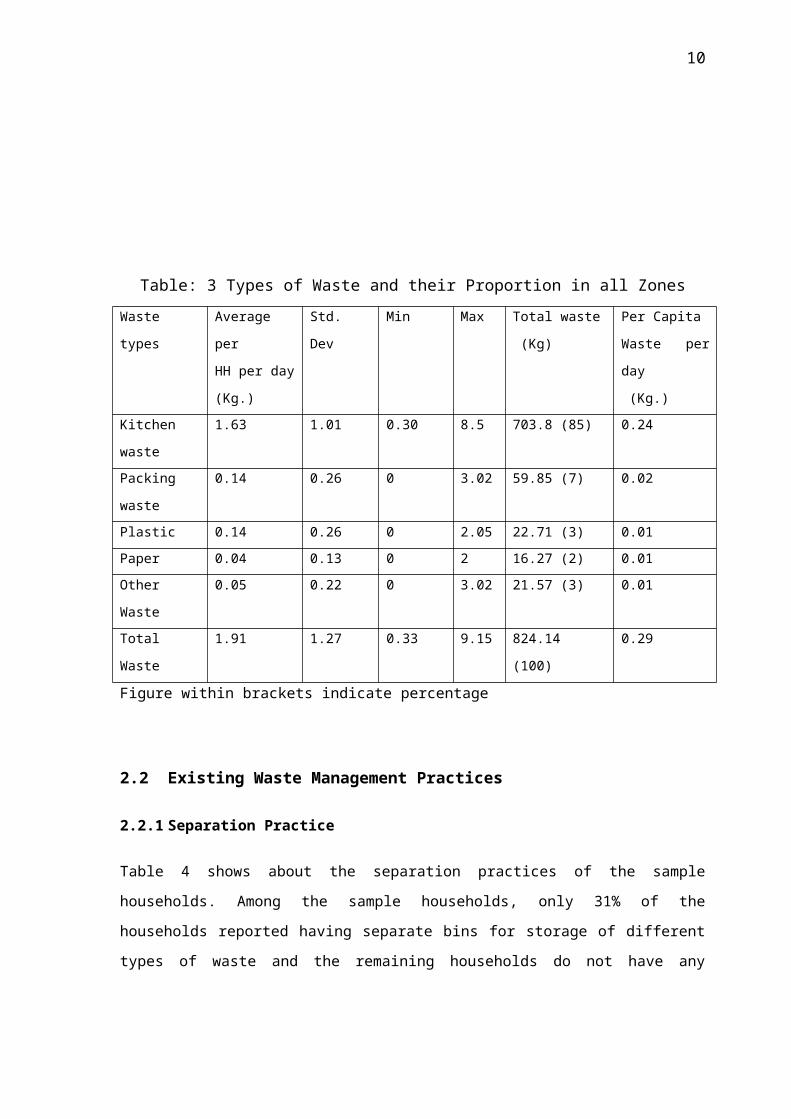
Table 3 shows about the types and proportion of solid waste. Kitchen waste is the major waste in
terms of volume and quantity of the selected households. It accounts for nearly 85% of the total
waste. Packing waste (7%) is next to kitchen waste. Plastic content is 3% whereas paper waste is 2
% only. The remaining 2% are other wastes, which include battery, dust etc.
6

Table: 3 Types of Waste and their Proportion in all ZonesWaste types Average per
HH per day
(Kg.)
Std. Dev Min Max Total waste
(Kg)
Per Capita
Waste per day
(Kg.)
Kitchen waste 1.63 1.01 0.30 8.5 703.8 (85) 0.24
Packing waste 0.14 0.26 0 3.02 59.85 (7) 0.02
Plastic 0.14 0.26 0 2.05 22.71 (3) 0.01
Paper 0.04 0.13 0 2 16.27 (2) 0.01
Other Waste 0.05 0.22 0 3.02 21.57 (3) 0.01
Total Waste 1.91 1.27 0.33 9.15 824.14 (100) 0.29
Figure within brackets indicate percentage
2.2 Existing Waste Management Practices
2.2.1 Separation Practice
Table 4 shows about the separation practices of the sample households. Among the sample
households, only 31% of the households reported having separate bins for storage of different types
of waste and the remaining households do not have any separate bins. Thus the majority of the
households leave their mixed wastes at one place or in plastic bags. Though only 31% households
have separate bins, about 65% separate the reusable and recyclable wastes. Among the zones the
households having separate bins is the highest (49%) in the middle zone, lowest (7%) in the outer
zone and moderate (32%) in core zone. The separation practice is the highest (81%) in the core
zone, lowest (52%) in outer zone and moderate (62%) in middle zone.
Table 4: Separation Practices of the HouseholdsZones Separate bin Separation practice
Yes No Yes No
All zones 135 (31) 297 (69) 280 (65) 152 (35)
Core 41(32) 88 (68) 105 (81) 24 (19)
Middle 85 (49) 88 (51) 107 (62) 66 (38)
7

Outer 9 (7) 121 (93) 68 (52) 62 (48)
Figures within brackets indicate percentage and absolute number indicate the number of households
2.2.2 Door-to-Door Collection:
About 57% of the households are served by the door-to-door collection system. The majority of
them receive the service by paying the fee and few are receiving the service not because of the fee
but because of the location of their house along the road. Municipal collectors provide the service
without receiving any bonus since they are the employees of the municipality.
Table 5: Door-to-Door Collection and Disposal of WasteZones Satisfied with the present collection system Environmentally safe disposal of the collected
waste
Total No. of HH
with Door to Door
Collection
Satisfied Not
Satisfied
Yes No Don't know
All zones 245 (100) 207 (84) 38 (16) 18 (7) 46 (19) 181 (74)
Core 87 (100) 77 (88) 10 (12) 13 (15) 7 (8) 67 (77)
Middle 116 (100) 103 (89) 13 (11) 4 (3.4) 26 (22.4) 86 (74.2)
Outer 42 (100) 27 (64) 15 (36) 1 (2) 13 (31) 28 (67)
Absolute number indicate the number of households and Figure within bracket indicate percentages
The perception of the households towards the present collection system was also captured through
the questionnaire. Table 5 shows that most households (86%) were satisfied with the present door-
to-door collection system. Only 14% were not satisfied. However, very few households (25%)
know where the collected waste is disposed. Only 7% feel that the disposal of such collected waste
is environmentally safe, 19% feel that the disposal of such collected waste is not environmentally
safe and the remaining 74% could not explain whether it is environmentally safe or not (Table 5).
Table 5 also shows the zone-wise details regarding the knowledge on the disposal of the collected
waste. The percentage of unsatisfied households is higher in the outer zone relative to the core and
middle zones.
2.2.3 Waste Collection and Collectors
About 56 % households are served by the door-to-door collection system. Among them 35 % use
the municipal collection system and the remaining uses the private collectors including community-
8

based organizations. Table 6 shows the detail regarding the waste collection and collectors in the
sample households. Among the zones, municipal collectors are collecting wastes in the core area
whereas NGOs plays dominant roles in the middle zone and a private firm is working in the outer
zone. The majority of the private collectors collect the waste 3 times a week and municipal
collectors collect the waste every day.
Table 6: Waste Collectors and Collection Frequency Zones Collectors Collection Frequency in a week
Municipal
collectors
Wage
Workers
NGO CDC Pvt 0 2 3 4 6 7
All
zone
87 (35) 4 (2) 91
(37)
17 (7) 46
(19)
187
(43)
4 (2) 142 (58) 4
(2)
10
(4)
85
(34)
Core 79 (91) 4 (4.5) 0 0 4
(4.5)
42
(33)
3 (3) 2 (2) 0 9
(11)
73
(84)
Middle 8 (7) 0 91
(78)
17
(15)
0 57
(33)
0 99 (85) 2
(2)
1(1) 14
(12)
Outer 0 0 0 0 42
(100)
88
(68)
0 42 (100) 0 0 0
Where, CDC=Community Development Committee and Pvt.= Private, NGO= Non-Government Organization
Absolute number indicate the number of households and Figure within brackets indicate percentages
2.2.4 Management of Waste where no door to door collection
Among the households surveyed about 43 % do not have door-to-door collection system. Table 7
shows the detail regarding management practices of sample households. Households that are not
practicing door-to-door collection are managing their waste in different ways (e.g. burying in their
own land, composting and burning).
Table 7: Waste Management in households, which have no Door-to-Door Collection System
Management Practices Total Number of
HH
Core Middle Outer
Total No of HH with No door
collection system
187 42 57 88
9
Throwing in the Container 18 (4) 4 (8) 7 (5) 7 (3)
Throwing in the road 69 (16) 25 (50) 22 (14) 22 (10)
Throwing in open field 55 (13) 8 (16) 23 (15) 24 (11)
Burying in own land 92 (22) 4 (8) 36 (24) 52 (24)
Prepare the compost from waste 45 (11) 3 (6) 22 (14) 20 (9)
Cattle feeding 8 (2) 0 5 (3) 3 (1)
Burn 109 (25) 4 (8) 35 (23) 70 (32)
Throw in the river 28 (7) 2 (4) 3 (2) 23 (10)
Total no of HH with different
practices
424 (100) 50 (100) 153 (100) 221 (100)
Absolute number indicate the number of households and Figure within brackets indicate percentage
2.3. Waste Generation and its Relationship with Socio-Economic Variables
This section, mainly discusses the empirical analysis of the relationships of quantity and
composition of household solid waste to selected social and economic variables. The analysis is
based on data for components of household wastes, by type of material judged having recycling
potential.
2.3.1 Model, Hypothesis and Data
Normally waste is a function of consumption. The relationship between waste and consumption
activities may be expressed as (Richardson et al. 1978):
W=C
Where,
W = vector of components of solid waste
= Vector of technical waste transformation coefficients relating the types and quantities of solid
waste to each consumption activity
C = is a vector of consumption activities selected by the household.
Any particular waste may be generated by the consumption of more than one commodity. Here no
attempt is made to identify the technical waste transformation coefficients associated with the
10

individual products. It mainly tries to compare the relationship between different types of waste
generation and socio-economic variables affecting the quantity of waste.
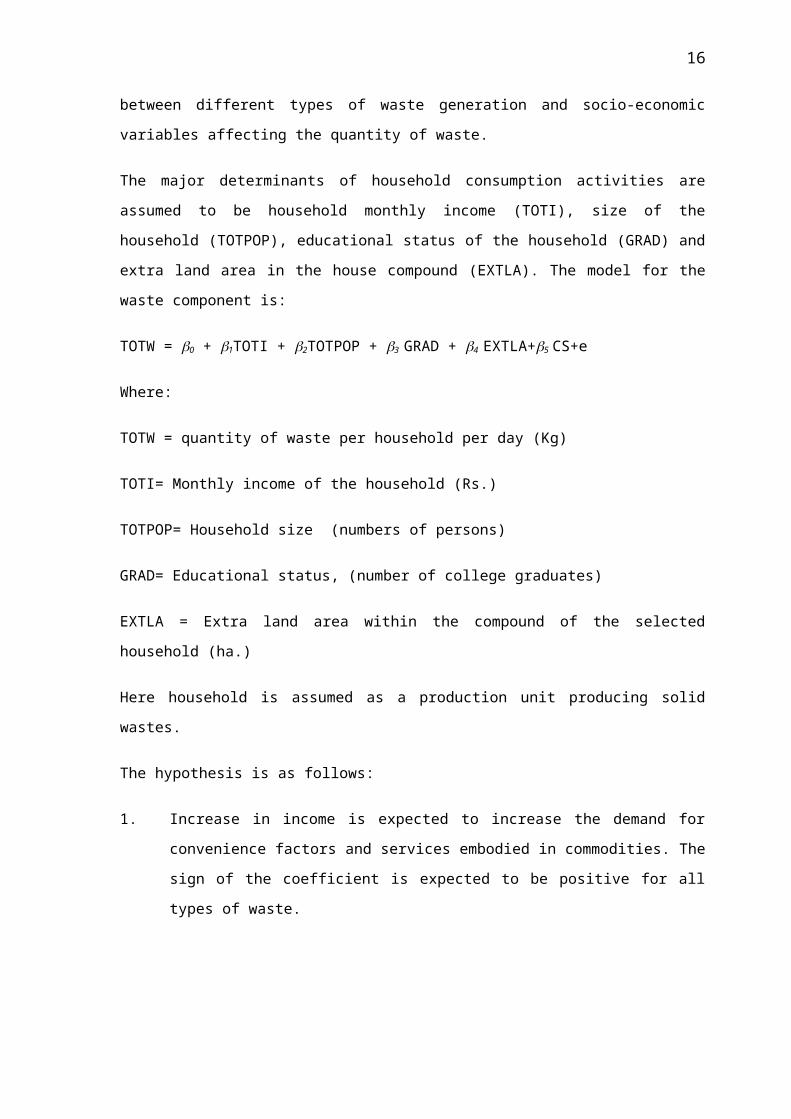
The major determinants of household consumption activities are assumed to be household monthly
income (TOTI), size of the household (TOTPOP), educational status of the household (GRAD) and
extra land area in the house compound (EXTLA). The model for the waste component is:
TOTW = 0 + 1TOTI + 2TOTPOP + 3 GRAD + 4 EXTLA+5 CS+e
Where:
TOTW = quantity of waste per household per day (Kg)
TOTI= Monthly income of the household (Rs.)
TOTPOP= Household size (numbers of persons)
GRAD= Educational status, (number of college graduates)
EXTLA = Extra land area within the compound of the selected household (ha.)
Here household is assumed as a production unit producing solid wastes.
The hypothesis is as follows:
1. Increase in income is expected to increase the demand for convenience factors and services
embodied in commodities. The sign of the coefficient is expected to be positive for all
types of waste.
2. A larger household size is expected to generate higher quantity of waste since more
households are included in the unit; thus, the sign is also expected to be positive.
3. Educated household members work in the office and stay outside of the house for a long
time. So the waste generation will be low. However, the generation of packing waste may
be higher in case of a fully employed family as they have less time to prepare food. As
such, they consume more packed food.
4. It is assumed that higher the extra land area within the compound (EXTLA) less the waste
generated by the household. It is also assumed that the household with extra land area may
dispose some of the waste in their land, which may not be counted in the total volume of
11

waste generated. Thus extra land area and the total quantity of waste are inversely related
and the sign of the coefficient of extra land area will be negative.
Data for the analysis were collected from the 432 households in 2001. Attempt has been made to
cover all the area within the city i.e. the data will represent the core, middle and outer settlements.
To calculate the quantity of waste sample households were given plastic bags and requested for the
collection of waste in these bags and the waste was weighed the next day.
2.3.2 Equation Results:
The estimated coefficients, coefficients of determination (R2), adjusted for degrees of freedom
(R¯2) and t and F values are shown in Table 8.
Table 8: Relationship of Waste and Socio-Economic Variables by Zones
Waste
Component
Intercept Household
Income
(TOTI)
HH size
(TOTPOP)
Extra
land
(EXTLA)
Education
(GRAD)
DW R¯2 F
TOTW (all
zones)
-2.70
(7.6)
0.26 (6.24) 0.49 (8.5) 0.08
(1.58)
-0.14(2.7) 1.8 0.25 38
TOTW
(Core)
-2.19
(-3.8)
0.19 (2.79) 0.52 (5.8) -0.84
(-1.9)
-0.03
(-0.37)
2.0 0.38 18
TOTW
(Middle)
-2.7
(-3.6)
0.26 (3.04) 0.50 (5.5) 0.04
(0.47)
-0.32
(-3.72)
1.7 0.27 16
TOTW
(Outer)
-3.87
(-6.2)
0.41 (6.08) 0.38 (2.79) 0.09
(1.04)
0.05
(0.58)
2.0 0.27 13
Figure within bracket indicate 't' value
Table 8 shows that generation of waste is related to the total income and total population of the
household. The elasticity of the household size is higher relative to the elasticity of the total income
in all the zones except outer zone. However, the elasticity of income is higher than the elasticity of
12

the household size in the outer zone. Extra land area has positive but insignificant effect in all the
zones except the core zone. In the core zone as there are very few households with extra land area,
the result will not be useful in the analysis.
2.4 Economics of Solid Waste Management
2.4.1 Willingness to Pay
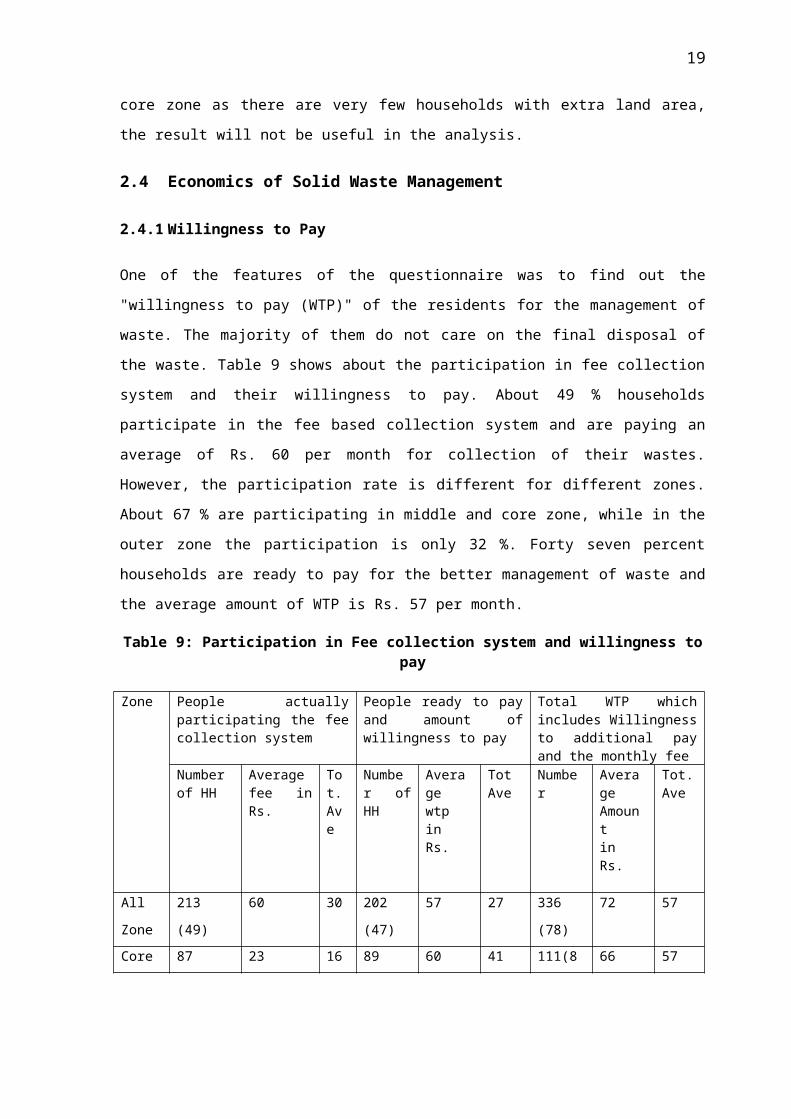
One of the features of the questionnaire was to find out the "willingness to pay (WTP)" of the
residents for the management of waste. The majority of them do not care on the final disposal of the
waste. Table 9 shows about the participation in fee collection system and their willingness to pay.
About 49 % households participate in the fee based collection system and are paying an average of
Rs. 60 per month for collection of their wastes. However, the participation rate is different for
different zones. About 67 % are participating in middle and core zone, while in the outer zone the
participation is only 32 %. Forty seven percent households are ready to pay for the better
management of waste and the average amount of WTP is Rs. 57 per month.
Table 9: Participation in Fee collection system and willingness to pay
Zone People actually participating the fee collection system
People ready to pay and amount of willingness to pay
Total WTP which includes Willingness to additional pay and the monthly fee
Number of HH
Average fee in Rs.
Tot. Ave
Number of HH
Average wtp in Rs.
Tot Ave
Number Average Amountin Rs.
Tot. Ave
All
Zone
213 (49) 60 30 202 (47) 57 27 336 (78) 72 57
Core 87 (67) 23 16 89 (69) 60 41 111(86) 66 57
Middle 116 (67) 67 45 47 (27) 51 14 136 (79) 74 58
Outer 42 (32) 74 24 66 (51) 57 29 89 (68) 77 53
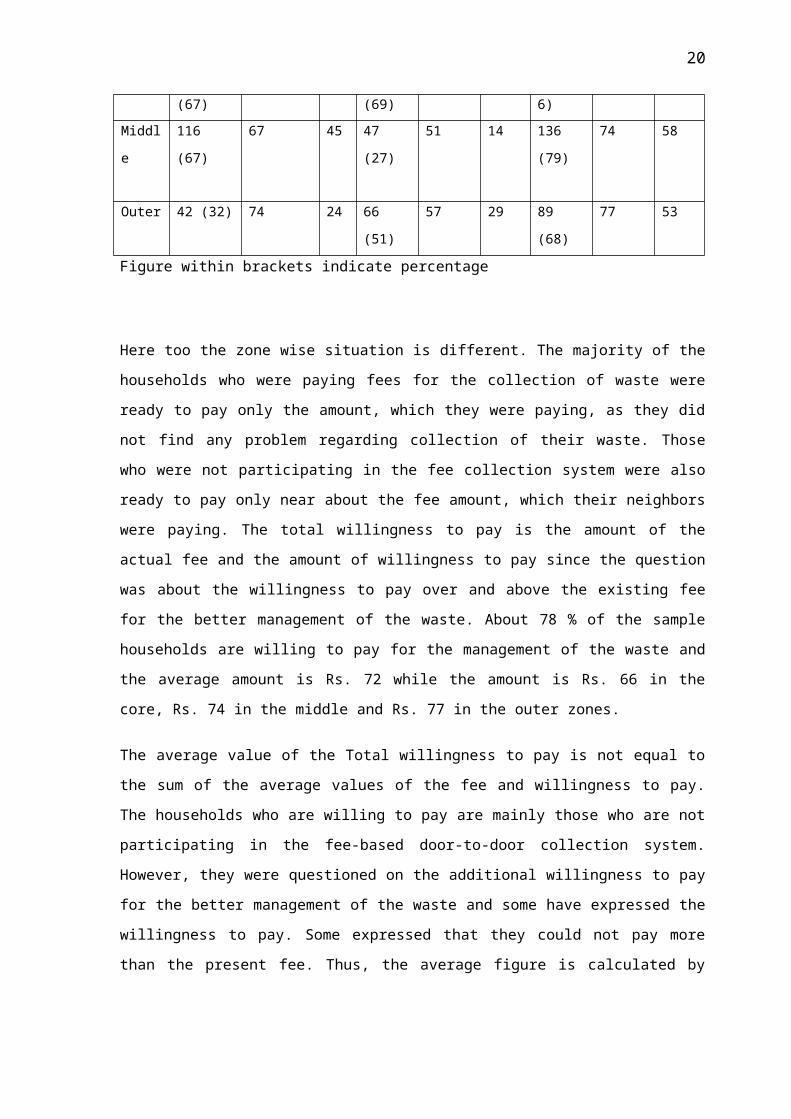
Figure within brackets indicate percentage
Here too the zone wise situation is different. The majority of the households who were paying fees
for the collection of waste were ready to pay only the amount, which they were paying, as they did
not find any problem regarding collection of their waste. Those who were not participating in the
fee collection system were also ready to pay only near about the fee amount, which their neighbors
were paying. The total willingness to pay is the amount of the actual fee and the amount of
willingness to pay since the question was about the willingness to pay over and above the existing
13

fee for the better management of the waste. About 78 % of the sample households are willing to
pay for the management of the waste and the average amount is Rs. 72 while the amount is Rs. 66
in the core, Rs. 74 in the middle and Rs. 77 in the outer zones.
The average value of the Total willingness to pay is not equal to the sum of the average values of
the fee and willingness to pay. The households who are willing to pay are mainly those who are not
participating in the fee-based door-to-door collection system. However, they were questioned on
the additional willingness to pay for the better management of the waste and some have expressed
the willingness to pay. Some expressed that they could not pay more than the present fee. Thus, the
average figure is calculated by dividing the applicable number of households and not all the
households. Table 10 shows the total average. The average total willingness to pay is only Rs. 57.
The average total fee is Rs. 30 and the average amount of willingness to pay is only Rs. 27.
While asking the question, the WTP amount was started from Rs.50 but some of the households
gave very low figures as their WTP for the waste management. In the core city area the municipal
collection system is regular but still the households are willing to pay only a small amount for the
collection of their waste. Normally, the municipal employee themselves collect the waste and get
nominal amount as tips from the house owners.
In the fee structure, households who are paying fees below Rs. 25 are mainly the residences of the
core city area. They pay a very small amount of fee for the collection of the waste to the municipal
employee. The municipal employees are also happy as they get an extra bonus.
The number of the households having door-to-door collection system is slightly higher than the
number of households participating in the fee-based door-to-door collection system. It is because
the core city households have reported that they have door-to-door collection system but are not
paying any fee as they live very close to the collection point.
2.4.2 Willingness to Pay and its Relationship with Other Variables:
A regression analysis was made with the help of the SPSS window program. "Willingness to Pay"
was regressed with the Total Income of the household (TOTI), time required to reach the municipal
collection center (TTR), extra land area around the house (EXTLA), and the collage graduate
people (GRAD). Consciousness Training (COTR) was taken as a dummy variable. Certain
hypothesis was made regarding the coefficient of the independent variable.
The hypothesises are:
14

1 TOTI will positively affect the Willingness to Pay (TWTP) i.e. higher the income higher
will be WTP for better management of the waste
2. TTR will also positively affect to WTP i.e. more the time needed for the disposal of waste
at the free collection center, higher the WTP for the collection and safe disposal of the
waste
3. COTR will also positively affect to WTP i.e. as people are more conscious regarding the
bad effects of haphazard disposal they are ready to pay more for waste management.
4. EXTLA will be negatively related to WTP, i.e. higher the land area around the house,
lower will be the Willingness to Pay for waste disposal since people may use their waste as
a soil conditioner in the kitchen garden.
5. GRAD will also positively affect to the Willingness to Pay, i.e. educated people will be
cautious about the negative effects of haphazard waste disposal and are ready to pay for
better management of the waste.
6. The total quantity of the waste (TOTW) also has a positive relationship with WTP i.e.
higher the quantity of waste; higher will be the Willingness to pay for the collection and
management of the waste.
2.4.3 Willingness to Pay and its Relationship with Socio-Economic Variables
The regression results are presented in Table 10. The result of Equation 1 shows that Willingness
to Pay is positively related to the total income. The coefficient of income is positive (0.28), which
means that for a 100 % increase in income the WTP will increase by 28 % or to put it in another
way, the elasticity of WTP with respect to income is 0.28. The time needed to throw the waste in
the public collection point has also a positive and significant relationship with the Willingness to
Pay. Greater the time required for throwing the waste, greater the amount that people are willing to
pay for better management of the waste. The coefficient of time is .09, which shows that a 100 %
increase in time will cause 9 % increase in the Willingness to pay for better management of the
waste. Graduate (GRAD) shows a positive relationship with WTP though it is very insignificant.
Households having extra land areas have positive but insignificant effects. During the survey, it
was found that the majority of the rich households have extra land area and they mainly want to
throw the waste even if the organic content is high (see Eq. No 1 in Table 10). Similarly, COTR is
negative, which is also contradictory to the assumption (hypothesis). It may be because of the low
quality of the training. In the survey it was considered that those who have attended any program,
15
which simply discussed about the waste management or environmental issues, was considered as
consciousness training. The training was mainly by NGO or clubs, which were mainly motivated to
make the households participate in the fee-based collection system. Thus the quality of the training
may not be as desired and as such, it may not be able to have a positive effect. The total explained
portion of the adjusted R2 is 0.31 and F value is above 8 and is highly significant. The Durbin-
Watson Test is 1.69.
Table 10 Willingness to Pay and its Relationship with other VariablesEq.No Dep.
VariableIndependent Variables R 2 F dw
Const Toti Grad Ttr Extla Cotr Totw1 TWTP 1.86 0.28 0.03 0.09 0.01 -0.17 - 0.31 8 1.
62't' value 4.95* 0.4 2.46* 0.38 -2.35**
2 TWTP 1.59 0.28 0.02 0.07 -0.001 - - 0.27 8 1.45
't' value 4.75* 0.256 1.96** -.036 - -3 TWTP 1.62 0.35 - 0.06 0.05 - -0.11 0.14 7 1.
54't' value 5.31* - 1.31 1.33 - -1.91**
4 TWTP 1.45 0.25 0.39 0.11 -0.04 - - 0.32 4 1.55
't' value 2.44* 1.32 2.16** -0.96 - -* Significant at 99 % level of significance** Significance at 95% level of significance
If one variable is dropped i.e. variable COTR, the regression result is shown in Equation 2, Table
10. The total income and time needed to reach the municipal collection center are significant and
land area other than house and education has an insignificant effect on the Willingness to Pay.
An attempt was made to see the relationship of total waste and total willingness to pay. If we look
at the regression result after adding total waste (TOTW) as an independent variable, it shows a
negative relation with Willingness to Pay. This shows that the volume and quantity of waste have a
very low effect on the Willingness to Pay. It seems to be true in this context since the ability to pay
is very important for the Willingness to Pay. The rich people may be generating low volume of
waste and the poor may be generating high volume of waste since waste volume/quantity is highly
related with the size of the population (Equation 3, Table 10).
An attempt was made to see the relationship between wealth and the Total Willingness To Pay
(TWTP). The possession of different assets was taken as the proxy for wealth. The possession of
only a TV is considered as a poor household and the possession of a car, computer, motorcycle,
16

refrigerator etc. by households were considered rich and households between these are considered
as middle-income groups.
Thus, regression was made with the households who possess only a TV. The Equation No. 4 (table
10) shows the relationship of TWTP and the independent variables in case of those households,
who possess only a TV.
The regression result shows that Total Income (TOTI) and Time required to dispose the waste at
the public collection center (TTR) have positive relations with TWTP as hypothesized and are
highly significant. Here extra land area has a negative coefficient, which indicates that poor people
use their waste in the kitchen garden as a soil conditioner and are not willing to pay for waste
management. The total explained portion of the regression (i.e. adjusted R2) is 0.32. The value of F
is around 4 and highly significant (Equation 4, Table 10).
2.4.3 Relationship of WTP with Other Variables in Different Zones
The zone wise relationship of WTP with the variables is presented in table 11. The regression
results show that in the outer zone the extra land area has a negative effect on TWTP. It shows that
greater the extra land area, more the waste is used as compost and low willingness to pay for waste
management. Total income, time to dispose the waste and the number of graduate members in the
house have significant positive relations with the willingness to pay which are as hypothesized.
However, extra land area has a positive relation with the willingness to pay in the core and middle
areas. In the core area the households with extra land area are very low in number (about 12 %). In
the core area, extra land area does not mean the availability of a kitchen garden. The land is for the
car parking or for the chouk2.
Table 11 Willingness to Pay and its Relation with other Variables by Zones
Zone Dep. Var Adj.R2 DW F Const Coefficient of Independent VariableLEXTRA LTTR LTOTI LGRAD
Total LTWTP 0.27 1.45 8.6 1.59 -001 0.07** 0.28* 0.02
Outer LTWTP 0.57 0.99 25 -0.12 -0.05 0.10 0.47* 0.03
Core LTWTP 0.62 5 2.94 1.29* 0.34** 0.52* -0.73*
Middle LTWTP 0.25 1.95 2.85 2.77 0.01 0.03 0.16** 0.19**
* Significant at 99 % level of significance
2 Chouk is an open space between few houses in the core city area.
17

** significance at 95 % level of significance
Thus, the waste will not be used in the extra land area and may not be true for our assumption. In
the middle area also, the coefficient of the variable extra land area possesses the positive sign
against the hypothesis. It may be because the area is very small and used for other than kitchen
garden purposes. As such the waste may not be used in the extra land as compost, but rather prefer
to through the waste out. The coefficient of the graduate people has a positive sign in all cases
except for one case of the core area. Though the value is insignificant, it indicates that though
people are college graduate they do not take the case of waste management seriously. It also may
be because the respondent may not be a college graduate even if the house members are graduates.
Thus, though many household members are college graduates, they do not care about waste
management. One of the reasons of unwillingness to pay may be because they feel the waste
management problem is not their problem. They may feel that it is the duty of the municipality,
since the municipality has managing it for a long time without any fee charged to the generator.
2.4.4 Causes of Not Willing to Pay
Questions were asked regarding the unwillingness of the households to pay. Households have given
more than one reason for not willing to pay for the management of the waste. Table 12 shows that
the majority of the households (53%) were not willing to pay as their waste was collected and they
do not have any problems from the waste. Some (21%) of them do not feel the problem from the
waste since they have sufficient space to throw the waste either within their compound or outside.
Few households were not ready to pay, as their income was very low. They account for only 12 %
among the unwilling households (8 % of the total surveyed households). They feel that their
priority is hand to mouth survival and not the waste. Very few households feel that it is the duty of
the municipality and the government and so they are not willing to pay.
Table: 12 Causes of not willing to payCauses Total Number of
HHCore Middle Outer
It is the duty of the Municipality 14 (5) 1 (2) 6 (4) 7 (8)
It is the duty of the government 2 (1) 0 2 (1) 0
Income is very low and could not afford 35 (12) 6 (12) 7 (4) 22 (25)
My house's waste had not made any
problem to me
62 (21) 8 (17) 28 (17) 26 (30)
Waste collection is continue in one or
other way and no other problem
158 (53) 31 (65) 103 (64) 24 (28)
Volume and quantity is very low 7 (2) 2 (4) 1 (1) 4 (4.5)
18
Majority of waste is reusable and
applicable to own self
19 (6) 0 15 (9) 4 (4.5)
Absolute number indicate number of households and Figure within bracket indicate percentage
3. SUMMARY AND CONCLUSION
The per capita waste generation is 0.29 kg./person/day in all the zones of the city. It seems to be
slightly lower than that of the earlier studies (0.46-0.5 kg./person/day) (Rai, 1990; RESTUC, 2000)
and higher than the recent study of the Municipality. Recent study by Kathmandu Metropolitan
City also shows the low rate of waste generation (0.225 kg./person/day) (KMC/KVMP 2001). The
low per capita waste generation may be due to the increase in household sorting of paper and
bottles at the point of generation since they are easily sellable. The per capita waste generation is
found to be the lowest in the core zone and highest in the outer zone. It was also found that
segregation practices are the highest in the core zone relative to other zones. Thus, the low per
capita waste generation in the core zone may be due to the household sorting of waste more
intensively in the core zone than in other zones. This may also be true because the core zone people
have been facing the waste problem since a long time whereas the outer and middle zone people
have open space and have no problem of waste disposal. Thus, as there is more open space people
usually generate more and vice versa.
About 57 % households are participating in the door-to-door collection by paying certain fee.
However, people are not much aware of the environmental problems and safe disposal of the waste.
It still shows that the households of Kathamndu have the feeling of NIMBAY (i.e. not in my
backyard). About 75 % of the city people do not know where the collected waste is disposed. In
terms of zones, people living in the core zone seem to be less aware than in other zones. This shows
that people are conscious regarding the waste problem within their compound but they do not care
where and how the waste is disposed. Few people know about the disposal place of the collected
waste. However, those who know the disposal site do not know whether the disposal practice is
environmentally safe or not.
More than 90 % of waste collectors are municipal workers in the core zone where as their
proportion in other zone is negligible. In the middle zone it is a NGO (SILT Environment), which
covers 78 % of the households practicing door -to-door collection, and a private firm is collecting
waste from the outer zone.
19
In the core zone households, which are not participating in the door-to-door collection system, are
managing their wastes mostly by throwing it on the streets. Whereas in the middle and outer zones
the majority households are managing their wastes either by burying or burning on their land. They
also prepare compost within the compound.
The waste component relationship shows that size of the household and income are the major factor
determining the total quantity of the waste in all the zones. It was also found that education has a
negative effect on waste generation.
About 80 % of the households are willing to pay for the better management of waste. The average
amount of only households who are Willingness to Pay is Rs. 72 per month. However, it we take
the average of all the households WTP is Rs. 57 per household. The willingness to pay is highest in
the outer zone and lowest in the core zone. It may be due to the free3 collection by the municipality
that the core people are not willing to pay. However, in the middle and outer zones the municipality
rarely collects the waste. Thus the willingness to pay is higher in outer and middle zones and lower
in the core zone. Again the environmental awareness of the households seems to be very low and
due to this they are willing to pay for environmentally safe land filling. However, they simply want
the waste to be out from their house. They are ready to pay only for this. Thus, the average
willingness to pay seems to be lower than that of the cost required for the management of the waste.
The Willingness to pay is also positively related to the household income and household size.
Most households feel that the lack of stiff penalty and non-execution of law is the basic problem for
the effective management of waste. Thus, provision of strong penalties and effective execution of
the law will be the major tool to reduce the problem of solid waste management in Kathmandu. It is
found that environmental awareness is very low among the residents of Kathmandu. Thus, stringent
regulations with environmental awareness programs for household sorting and composting can
reduce the volume and quantity of waste for land filling. It could be suggested that a fee be charged
as per the electricity or water bill to the households to cover the costs, since the willingness to pay
is positively related to the level of income. At the initial stage only regular direct cost should be
covered by the charge and fixed cost as well as environmental costs should be subsidized. Other
wise there will be the possibility of illegal dumping. After the successful implementation of this
scheme then only full cost pricing of the solid waste generation should be initiated and this will be
the only sustainable way for the better management of waste of Kathmandu Metropolis.
3 In the core zone the area coverage by the ward is very small and the municipality with some subsidy collects the waste by its tractors along the road and majority of the households are covered. Where as in middle and outer zone the area coverage by the ward is high and municipality rarely collects the waste from the door of the households.
20

21

References
Agrawal, G. N. et al. ( September, 1982) "Report on Proposal for Solid Waste Disposal Fee for
Kathmandu/Lalitpur Town Panchayats" Report Submitted to Nepal Solid Waste Management
Project, His Majesty's Government/Nepal, Ministry of Works and Transport, Department of
Housing, Building and Physical Planning and Federal Republic of Germany, German Agency for
Technical Cooperation (GTZ) LTD.
Beede, D. N.; D. E. Bloom (1995), "The Economics of Municipal Waste" The World Bank research
Observer , Vol. 10, No. 2, pp 113-150
Betts, Mitchel et al (1982) Report of an Evaluation of the Project " Solid Waste Management in the
Kathmandu Valley" GTX Project No. 76. 2051.1
Beukering, Piter Van et.al., ( 1999) Analysing Urban Solid Waste in Developing Countries: a
Perspective on Banglore, India, Working Paper No. 24, Collaborative Research in the Economics
of Environment and Development (CREED), London.
Enayetullah, Iftekhar and A. H. Maqsood Sinha (2000) 'Community Based Decentralized
Composting: Experience of Waste Concern in Dhaka' in Sinha A. H.Maqsood et al. (Eds.)
Community Based Solid Waste Management: The Asian Experience, Waste Concern, Dhaka,
Bangladesh
Flinthoff, F. (1970) Assignment Report in the Solid Waste Management in Kathmandu Who-
Project Searo. 0150,
GTZ (1996) 'Report on Fact Finding Mission for the Solid Waste Management in Nepal' Prepared
on behalf of GTZ.
KMC/KVMP (2002) Special Cleaning Program for SAARC Summit, Kathmandu Metropolitan
City/ Kathmandu Valley Mapping Project, Kathmandu
Lal, Mewa (2000) 'Profits from Waste: NGO Led Initiative for Solid Waste Management in
Lucknow' in Sinha A. H.Maqsood et al. (Eds.) Community Based Solid Waste Management: The
Asian Experience, Waste Concern, Dhaka, Bangladesh
Macauley, Molly K.; Margaret A. Walls (1995) Solid Waste Reduction and resource Conservation:
Assessment Policy, Resource for the Future Discussion Paper 95-32
22

Murtaza, Md. Gulam and Mohammad Abdur Rahman (2000) 'Solid Waste Management in Khulana
City and a Case Study of a CBO: Amader Paribartan' in Sinha A. H.Maqsood et al. (Eds.)
Community Based Solid Waste Management: The Asian Experience, Waste Concern, Dhaka,
Bangladesh
Nirmal, M.B. (2000) 'Community Based Solid Waste Management:: Experience of Exnora' in
Sinha A. H.Maqsood et al. (Eds.) Community Based Solid Waste Management: The Asian
Experience, Waste Concern, Dhaka, Bangladesh
Qureshi, Arjum Parvez (2000) 'Waste Busters: An Experience of Pakistan' in Sinha A. H.Maqsood
et al. (Eds.) Community Based Solid Waste Management: The Asian Experience, Waste Concern,
Dhaka, Bangladesh
Rai, Y.(1990) Statement on the Prospect of Further Vitalizing the Waste-Recycling concept for
Nepal, Report on the Workshop "Recycling of Waste in Nepal", SWMRMC, Kathmandu.
RESTUC (2000) A Study of solid Waste and its Management in Kathmandu, Research and Study
Center (RESTUC); Kathmandu Nepal
Richardson, Robert A. (1978) Economic Analysis of the Composition of Household Solid Wastes
Journal of Environmental Economics and Mangement 5, 103-111, 1978
Sinha, A.H. Maqsood et al (eds.) (2000) Community Based Solid Waste Management: The Asian
Experience, Waste Concern, Dhaka , Bangladesh
Solid Waste Management Board (SWMB) and (GTZ) Gmbh (1984) Solid Waste Collection Fee, SWMB and
GTZ
SWMB and GTZ (1985) Report on Service Fee Collection, SWMB and GTZ.
Tabasaran, O (1976) Experts Report on the Reorganization of Solid Waste Disposal in the
Kathmandu - Valley especially in the Cities of Kathmandu, Patan and Bhaktapur; Report submitted
to German Agency for Technical Cooperation (GTZ) and His Majesty's Government of Nepal.
Tabasaran, O. et al. (1981) Report Regarding the Possibility of Composting of Municipal Refuse in
Kathmandu Valley Especially in Kathmandu, Patan and Bhaktapur, Report submitted to the His Majesty's
Government of Nepal and GTZ.
Thapa, Gopal B. and Surendra Raj Devkota (1999) " Managing Solid Waste in Metro Kathmandu"
Bangkok: Asian Institute of Technology
23

Timilsina B. P. (2000) 'Reuse and Recycling: Options for Waste Diversion from Landfilling- A
Case Analysis in Kathmandu Valley' A Journal of Environment, Ministry of Population and
Environment, Nepal
Tuladhar, Bhusan (1996) ' Kathmandu's garbage simple solution going to waste', Studies in Nepali
History and Society Vol.1, No. 2, A Mandala Book Point Journal
Wertz L. Kenneth; 1976 Economic Factors Influencing Household’s Production of Refuse’ JEEM
2, 263-272 (1976)
24