Embed Size (px)
Citation preview

Hotspot Analysis For Examining The Association Between Spatial Air Pollutants And Asthma In New York State USA
Using Kernel Density Estimation (KDE)
Francis Tuluri1 Amit Kr Gorai2 Aaron James1
1Department of Technology Jackson State University Jackson MS 39217 USA
Email francistulurijsumsedu Phone 601 979 82522Department of Civil and Environmental Engineering Birla Institute of Technology
Mesra Ranchi -835215 India
Email amit_goraiyahoocouk
Abstract
bull Air pollutants play a predominant role in effecting human health
bull Identifying hot spots of air pollutants in a location will facilitate in taking measures to improve human health and hence protecting the local people from health disorders
bull The present study examines the use of spatial analysis of air pollutants in New York State USA Based on the availability of data in the study region three air pollutants (PM25 SO2 and O3) were considered for the hot spot analysis to identify zones with higher pollutant concentration levels for the period of 2005 to 2007
bull The corresponding asthma discharge rates were then determined for understanding the effect of exposure of high air pollutants to asthma discharge rate In the present investigation kernel density estimation (KDE) technique was used for hotspot analysis of air pollution from annual average air pollutants concentrations
bull Using KDE technique air pollution hotspots and polluted sampling densities are clearly defined based on point data of air pollutants In the study area multiple hotspots were observed for these three air pollutants and they are significantly correlated to the locations of asthma discharge rate
bull The spatial patterns of hazard probability reveal hotspots of PM25 are situated in the counties of Rockland Westchester Bronx Queen Brooklyn and Nassau
bull The hotspots of O3 coincide with that of PM25 and SO2 but many other hotspots areas were observed for O3
bull The major hotspots for asthma discharge rate are observed in the same counties as that of PM25 SO2 and O3 KDE technique enables capturing hot spots without requiring exhaustive sampling to identify risk prone areas
bull Keywords kernel density estimation (KDE) air pollution asthma
Motivation
bull The available literature on asthma studies shows a large geographic variation from localcommunity level all the way to country level
bull The studies on asthma and other epidemics have raised some important questions as what factors contribute to the emergence of asthma outbreak
bull Many epidemiologic studies demonstrated positive associations between air pollution and mortality
bull Hotspot mapping has become a valuable technique for visualizing the geographic incidence of air pollution and asthma
bull One of the most widely used techniques for generating hotspot maps as smooth continuous surfaces is kernel density estimation (KDE)
bull Hotspot mapping can be used for identifying the locations where hazardous level of air pollution exists KDE has been widely used for hotspot analysis and detection
bull KDE is one of the methods for analyzing the first order properties of a point event distribution in part because it is easy to understand and implement
bull Schnabel and Tietje applied the KDE method to spatially distributed heavy metal soil data and compared it with ordinary kriging
bull KDE can be used to produce a smooth density surface of point events over space by computing event intensity as density estimation
bull
Objective
bull The primary objective of the present work was to investigate the association between geographical incidence of air pollutants and asthma cases
bull For this study an alternative approaches was proposed in searching the hotspots locations of air pollutants and asthma incidences
bull To use KDE for identifying the hotspots of air pollution and asthma incidence based on the monitoredsurvey data
bull
Method
bull Kernel density estimation (KDE) is used to identify the location spatial extent and intensity of air pollution and asthma cases hotspots
bull Moreover the spatial patterns of hazardous probability for three air pollutants (PM25 SO2 and O3) and asthma incidence are estimated for examining the association between these two
bull The KDE method is used for visualization of hotspots of air pollutions and asthma incidence in the case study
Study Area
bull In the present work New York State is selected as the area of study for the analysis and estimation ndash Based on data availability urban population air quality influence
ndash Data sets Air quality data Asthma Discharge Rate
bull New York is a state in the Northeastern region of the United States
bull The longitude and latitude of the state are 71deg 47 25 W to 79deg 45 54 W and 40deg 29 40 N to 45deg 0 42 N respectively
bull It is the third most populous (19378102) and the seventh most densely populated (4153 inhabitants per square mile) state of the 50 United States
bull New York covers 54556 square miles and ranks as the 27th largest state by size
bull In general New York has a humid continental climate
Air Pollution Data
bull Air quality data collected by US EPArsquos Air Quality System (AQS)
bull at the various monitoring stations located in different counties of New York State
bull for the three years from 2005 to 2007 were used for the study
bull The daily data for each monitoring station were used for determination of annual average concentrations
bull The air pollution data from the United States Environmental Protection Agency (US EPA) air quality system data mart
bull (Source httpwwwepagovairdataad_rep_monhtml) [14]
bull Three criteria air pollutant parameters (SO2 PM25 and O3) were collected from twenty two twenty five and twenty five monitoring stations respectively
bull The characteristics of the these three pollutants retrieved from the website are
bull daily average (24 hrs) concentrations of PM25 daily maximum 8 hours average concentrations of O3 and daily maximum 1 hour average concentrations of SO2
Asthma data
bull County- wise asthma hospital discharge data for the period 2005 through 2007 were obtained from Department of Health New York Statersquos Asthma Surveillance Summary Report 2009
bull (Sourcehttpswwwhealthnygovstatisticsny_asthmapdf2009_asthma_surveillance_ summary_reportpdf) [15] The International Classification of Disease Ninth Revision Clinical Modification (ICD-9-CM) diagnosis code 493 was used to identify asthma hospitalization discharge diagnosis [16]
bull
Asthma hospital discharge rate (ADR)
bull ADR indicates the number of asthma-related hospital discharges per 10000 populations for a specified period of time
bull ADR for 2005 2006 and 2007 were calculated by dividing the number of asthma hospital discharges by the estimated population for that time period in a particular zone and then multiplying by 10000
bull The estimated rates represent crude rate on the basis of estimated population of the county
bull The county wise population estimates for the year 2005 2006 and 2007 were obtained from the United Statesrsquo Census Bureau
bull (Source httpwwwcensusgovpopestdata intercensalcountytablesCO-EST00INT-01CO-EST00INT-01ndash36csv45) [1718]
Kernel Density Estimation (KDE)
KDE contd
Results
bull In United State of America the pollution control standards (maximum allowable concentrations) for the investigated pollutants are as
ndash PM25-12 microgm3 (annual average) and 35 microgm3 (24 hours average)
ndash SO2- 75 ppb (maximum 1 hr average) and
ndash O3- 75 ppb (maximum 8 hrs average)
bull Moreover the high variability of the pollutant concentrations at various air pollutants requires a detailed evaluation and interpretation
bull The application of KDE method is an efficient tool in achieving better understanding of the hazardous level of the air pollution and asthma incidence
Table 1 summarizes the descriptive statistics of pollutants and asthma
Table 1 Descriptive statistics of data
Minimum Maximum Mean Standard
Deviation
2005
Asthma Rate 3777 9405 5304 839
Ozone 2956 4448 4021 117
PM25 715 1615 1139 115
SO2 258 1865 846 288
2006
Asthma Rate 3734 9830 5246 977
Ozone 3049 4192 3742 121
PM25 568 1330 873 105
SO2 214 1869 691 231
2007
Asthma Rate 3656 9487 5096 1043
Ozone 3175 4269 3908 176
PM25 573 1591 949 108
SO2 281 1379 718 238
bull The minimum annual average concentrations of PM25 for 2005 2006 and 2007 were
ndash 67 μgm3 55 μgm3 and 56 μgm3 respectively
bull The maximum average concentrations of PM25 for 2005 2006 and 2007 were
ndash 17 μgm3 144 μgm3 and 161 μgm3 respectively
bull The maximum values of annual average of maximum 8 hours daily average concentration of O3 in 2005 2006 and 2007 were
ndash 4638 ppb 4503 ppb and 4793 ppb respectively
bull The minimum values of annual average of maximum 8 hours daily average concentrations of O3 in 2005 2006 and 2007 were found to be
ndash 684 ppb 2641 ppb and 1678 ppb respectively
Hotspot Patterns
bull The hotspot patterns of PM25 SO2 O3 and ADR on the kernel density map are shown in Figure 1 Figure 2 Figure 3 and Figure 4 respectively
bull KDE transforms a dot pattern into a continuous surface providing a more useful representation of pollution and asthma cases distributions allowing for easier detection of possible pollution hotspots and its association with asthma cases
bull Results show that the asthma cases hotspots associated with the three air pollutants in the study area
bull
Figure 1 Hotspots maps of PM25 concentrations Figure 2 Hotspots maps of SO2 concentrations
Figure 3 Hotspots maps of O3 concentrations Figure 4 Hotspots maps of asthma discharge rate
Observations
bull The maximum values of annual average of maximum 1 hour daily average concentration of SO2 in 2005 2006 and 2007 were found to be 2299 ppb 1986 ppb and 2316 ppb respectively
bull The minimum values of annual average of maximum 1 hr daily average concentrations of SO2 in 2005 2006 and 2007 was found to be 19 ppb 179 ppb and 193 ppb respectively
Discussion
bull The results demonstrate that the hotspots of hazard probability for PM25
and SO2 are similar ndash The spatial patterns of hazard probability also reveal hotspots of PM25 are situated in
the counties of Rockland Westchester Bronx Queen Brooklyn and Nassau
bull All these counties are situated in the coastal part of south-east side of the state
bull Two other counties (Erie and Nagara) also show hotspots
bull The same trend is observed in each of the three years (2005 to 2007)
bull Similar spatial trends are observed for SO2 in each of the three year
bull The hotspots of O3 are revealing those spatial trends are similar in each year (2005 to 2007)
bull The hotspots of O3 coincide with that of PM25 and SO2 but many other hotspots areas were observed for O3
bull
Discussion Contd
bull The hotspots for ADR are represented in Fig 4 clearly indicates that the major hotspots for ADR are observed in the same counties as that of PM25 SO2 and O3
bull But the distribution patterns are more similar to O3
episode Furthermore the hotspots are observed in the same counties in three years (2005 to 2007)
bull Hotspot analyses clearly indicate that there are multiple hotspots of hazard probability and these are identified in same location in each year
Conclusions
bull An important component of human health protection due to poor air quality is identification hotspots in respect to poor air quality in the area ndash Three air pollutants (PM25 SO2 and O3) and asthma discharge rate (ADR) were
considered for the hot spot analyses to examine the association of air pollution and asthma in New York State USA
ndash Higher concentrations zone were identified and the ADR in those areas were determined for understanding the effect of exposure of high air pollutants to asthma discharge rate (ADR)
bull Kernel density estimation (KDE) technique was used for hotspot analyses
bull Results show that there are multiple hotspots for these three air pollutants and they are significantly correlated to the locations of ADR in the study area ndash Air pollution hotspots are clearly defined using the KDE approach based on point data of
air pollutants
ndash Furthermore the risk prone areas are explored by this technique (KDE) and the hotspot areas are captured without requiring exhaustive sampling
More work
bull Modeling validation
bull Daily correlation
bull Other regions
Acknowledgements
bull This research work was carried out in part of the corresponding authorrsquos Raman Postdoctoral Fellowship- 2013 awarded by UGC New Delhi India
bull Authors are also thankful to US EPA for making air pollution data available on the website for public use The support from the DST New Delhi Grant No SRFTPES-172012 is also acknowledged
bull The authors are thankful to Dr Paul Tchounwou Associate Dean and Professor of College of Science and Technology Jackson State University for his interest and encouragement in
the work
Questions and Answers
THANK YOU
References bull Analitis A Katsouyanni K Dimakopoulou K Samoli E Nikoloulopoulos AK Petasakis Y Touloumi G
Schwartz J Anderson HR Cambra K et al Short-term effects of ambient particles on cardiovascular andrespiratory mortality Epidemiology 2006 17 230ndash233
bull Belleudi V Faustini A Stafoggia M Cattani G Marconi A Perucci CA Forastiere F Impact of fine andultrafine particles on emergency hospital admissions for cardiac and respiratory disease Epidemiology 2010 21414ndash423
bull Brunekreef B Dockery DW Krzyzanowski M Epidemiologic studies on short-term effects of low levels ofmajor ambient air pollution components Environ Health Perspect 1995 103 3ndash13
bull Chan T Chen M Lin I Lee C Chiang P Wang D Chuang J Spatiotemporal analysis of air pollution andasthma patient visits in Taipei Taiwan Int J Health Geogr 2009 8 doi1011861476ndash072X-8ndash26
bull Chang C-C Tsai S-S Ho S-C Yang C-Y Air pollution and hospital admissions for cardiovascular disease inTaipei Taiwan Environ Res 2005 98 114ndash119
bull Chen Y Yang Q Krewski D Shi Y Burnett RT McGrail K Influence of relatively low level of particulateair pollution on hospitalization for COPD in elderly people Inhal Toxicol 2004 16 21ndash25
bull Chiu H-F Cheng M-H Yang C-Y Air pollution and hospital admissions for pneumonia in a subtropical cityTaipei Taiwan Inhal Toxicol 2009 21 32ndash37
bull Cohen AJ Anderson HR Ostra B Dev Pandey K Krzyzanowski M Kunzli N Guschmidt K Pope ARomieu I Samet JM Smith K The Global Burden of Disease due to Outdoor Air Pollution J Toxicol EnvironHealth A 2005 68 1-7
bull Croner CM Sperling J Broome F R Geographic information systems (GIS) new perspectives in understandinghuman health and environmental relationships Stat Med 1996 15(17-18) 1961-77
bull Dales RE Cakmak S Burnett RT et al Influence of ambient fungal spores on emergency visits for asthma to aregional childrenrsquos hospital Am J Respir Crit Care Med 2000 162 2087ndash2090
PM concentration HotSpot Maps New York 2007
Ozone concentration HotSpot Maps New York 2007
Astham Discharge concentration HotSpot Maps New York 2007

PM concentration HotSpot Maps New York 2007
Ozone concentration HotSpot Maps New York 2007
Astham Discharge concentration HotSpot Maps New York 2007
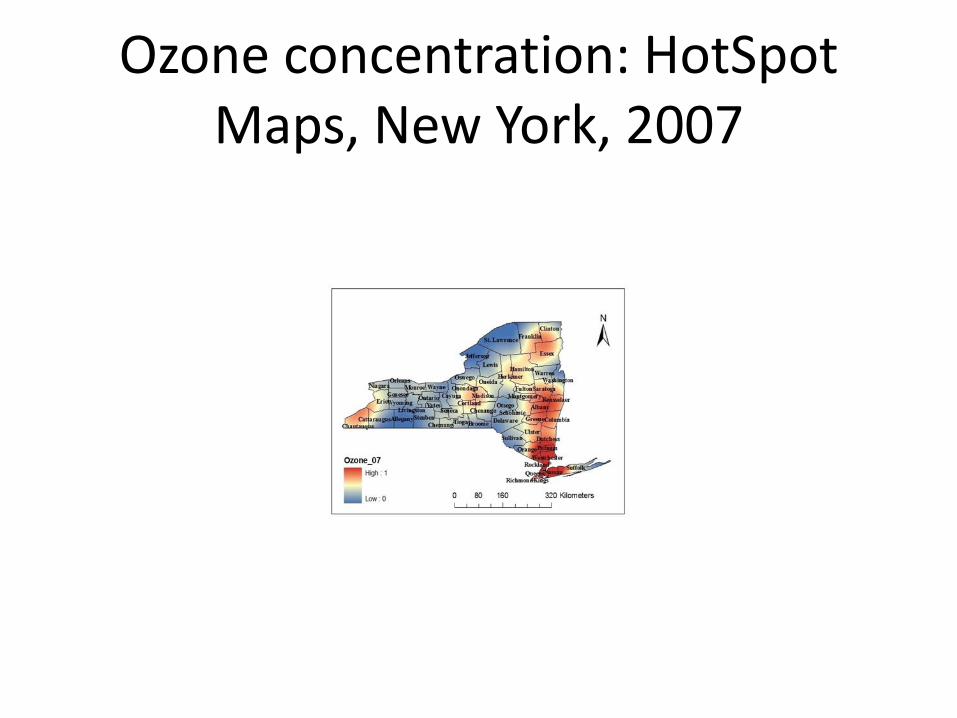
Ozone concentration HotSpot Maps New York 2007
Astham Discharge concentration HotSpot Maps New York 2007

Astham Discharge concentration HotSpot Maps New York 2007