Embed Size (px)
Citation preview

September 2012
Hospital-Acquired Conditions–Present on Admission: Examination of Spillover
Effects and Unintended Consequences
Final Report
Prepared for
Susannah Cafardi Rapid Cycle Evaluation Group
Division of Research on Traditional Medicare Centers for Medicare & Medicaid Services
Mail Stop WB-06-05 7500 Security Boulevard
Baltimore, MD 21244-1850
Prepared by
Deborah Healy, PhD Jerry Cromwell, PhD
RTI International 3040 Cornwallis Road
Research Triangle Park, NC 27709
RTI Project Number 0209853.231.002.124

Hospital-Acquired Conditions–Present on Admission: Examination of Spillover Effects and Unintended Consequences
by Deborah Healy and Jerry Cromwell
Federal Project Officer: Susannah Cafardi
RTI International
CMS Contract No. HHSM-500-2005-00029I
September 2012
This project was funded by the Centers for Medicare & Medicaid Services under contract no. HHSM-500-2005-00029I. The statements contained in this report are solely those of the authors and do not necessarily reflect the views or policies of the Centers for Medicare & Medicaid Services. RTI assumes responsibility for the accuracy and completeness of the information contained in this report.
_________________________________ RTI International is a trade name of Research Triangle Institute.

iii
CONTENTS
Executive Summary .........................................................................................................................1
Section 1 Introduction, Study Questions, and Organization of Report............................................5 1.1 Introduction ....................................................................................................................5 1.2 Study Questions .............................................................................................................9 1.3 Organization of Report ..................................................................................................9
Section 2 Data and Methods ..........................................................................................................11 2.1 Potential Issue: Problems Coding the POA Variable Within a Hospital ....................14
Section 3 Spillover Effects of the HAC-POA Program to Other Payers .......................................15 3.1 Introduction ..................................................................................................................15 3.2 Descriptive Analysis: Rates of Hospital-Acquired Conditions Across Payers
and Over Time .............................................................................................................16 3.3 Logistic Analysis of Rates of Hospital-Acquired Conditions......................................29 3.4 Summary ......................................................................................................................33
Section 4 All-Payer Analysis: Unintended Consequences of Hospital Coding Practices ............35 4.1 Introduction ..................................................................................................................35 4.2 Descriptive Analysis ....................................................................................................36 4.3 Conclusions and Discussion ........................................................................................46
Section 5 Summary and Conclusions ............................................................................................49 5.1 Findings From the Spillover Analysis .........................................................................49 5.2 Findings From the Analysis of Unintended Consequences of Hospital Coding
Practices .......................................................................................................................50
References ......................................................................................................................................53
Appendix A: Tables of the Number of Discharges With Hospital-Acquired Diagnosis ...............55
List of Figures
5.1 Effect of claims with nine or more secondary diagnoses on percentage of HACs missed using only eight secondary diagnosis fields ........................................................... 51
iv
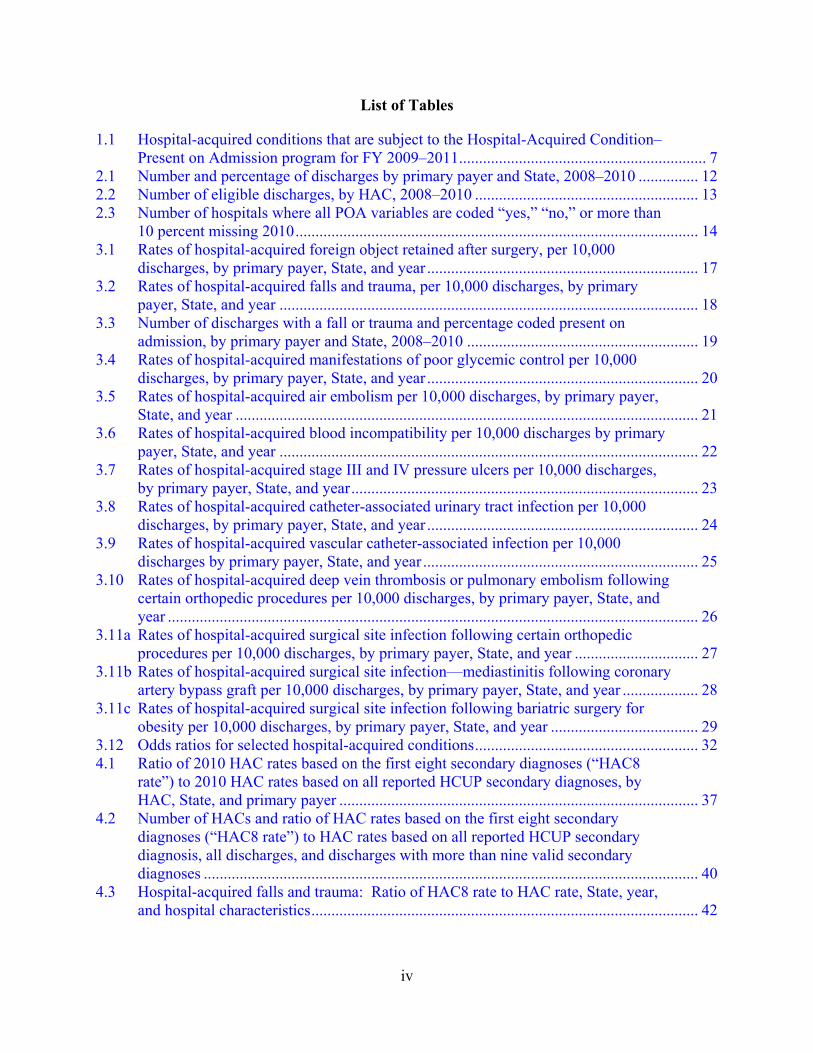
List of Tables
1.1 Hospital-acquired conditions that are subject to the Hospital-Acquired Condition–Present on Admission program for FY 2009–2011 .............................................................. 7
2.1 Number and percentage of discharges by primary payer and State, 2008–2010 ............... 12 2.2 Number of eligible discharges, by HAC, 2008–2010 ........................................................ 13 2.3 Number of hospitals where all POA variables are coded “yes,” “no,” or more than
10 percent missing 2010 ..................................................................................................... 14 3.1 Rates of hospital-acquired foreign object retained after surgery, per 10,000
discharges, by primary payer, State, and year .................................................................... 17 3.2 Rates of hospital-acquired falls and trauma, per 10,000 discharges, by primary
payer, State, and year ......................................................................................................... 18 3.3 Number of discharges with a fall or trauma and percentage coded present on
admission, by primary payer and State, 2008–2010 .......................................................... 19 3.4 Rates of hospital-acquired manifestations of poor glycemic control per 10,000
discharges, by primary payer, State, and year .................................................................... 20 3.5 Rates of hospital-acquired air embolism per 10,000 discharges, by primary payer,
State, and year .................................................................................................................... 21 3.6 Rates of hospital-acquired blood incompatibility per 10,000 discharges by primary
payer, State, and year ......................................................................................................... 22 3.7 Rates of hospital-acquired stage III and IV pressure ulcers per 10,000 discharges,
by primary payer, State, and year ....................................................................................... 23 3.8 Rates of hospital-acquired catheter-associated urinary tract infection per 10,000
discharges, by primary payer, State, and year .................................................................... 24 3.9 Rates of hospital-acquired vascular catheter-associated infection per 10,000
discharges by primary payer, State, and year ..................................................................... 25 3.10 Rates of hospital-acquired deep vein thrombosis or pulmonary embolism following
certain orthopedic procedures per 10,000 discharges, by primary payer, State, and year ..................................................................................................................................... 26
3.11a Rates of hospital-acquired surgical site infection following certain orthopedic procedures per 10,000 discharges, by primary payer, State, and year ............................... 27
3.11b Rates of hospital-acquired surgical site infection—mediastinitis following coronary artery bypass graft per 10,000 discharges, by primary payer, State, and year ................... 28
3.11c Rates of hospital-acquired surgical site infection following bariatric surgery for obesity per 10,000 discharges, by primary payer, State, and year ..................................... 29
3.12 Odds ratios for selected hospital-acquired conditions ........................................................ 32 4.1 Ratio of 2010 HAC rates based on the first eight secondary diagnoses (“HAC8
rate”) to 2010 HAC rates based on all reported HCUP secondary diagnoses, by HAC, State, and primary payer .......................................................................................... 37
4.2 Number of HACs and ratio of HAC rates based on the first eight secondary diagnoses (“HAC8 rate”) to HAC rates based on all reported HCUP secondary diagnosis, all discharges, and discharges with more than nine valid secondary diagnoses ............................................................................................................................ 40
4.3 Hospital-acquired falls and trauma: Ratio of HAC8 rate to HAC rate, State, year, and hospital characteristics ................................................................................................. 42

v
4.4 Hospital-acquired stage III or IV pressure ulcers: Ratio of HAC8 rate to HAC rate, State, year, and hospital characteristics .............................................................................. 43
4.5 Hospital-acquired CAUTIs: Ratio of HAC8 rate to HAC rate, State, year, and hospital characteristics ....................................................................................................... 44
4.6 Hospital-acquired vascular catheter-associated infections: Ratio of HAC8 rate to HAC rate, by State, year, and hospital characteristics ....................................................... 45
4.7 Hospital-acquired deep vein thrombosis or pulmonary embolism following certain orthopedic procedures: Ratio of HAC8 rate to HAC rate, by State, year, and hospital characteristics ....................................................................................................... 46

vi
This page intentionally left blank.

1
EXECUTIVE SUMMARY
The Hospital-Acquired Conditions–Present on Admission (HAC-POA) program was mandated by the Deficit Reduction Act (DRA) of 2005. The DRA required the Secretary of the U.S. Department of Health and Human Services to identify high-cost and high-volume preventable conditions that result in higher payments for Medicare. The conditions had to be high cost, high volume, or both; result in the assignment of a case to a Medicare severity diagnosis-related group (MS-DRG) that has a higher payment when present as a secondary diagnosis; and be reasonably preventable through the application of evidence-based guidelines. The Centers for Medicare & Medicaid Services (CMS) identified eight conditions for which it would no longer pay a higher DRG rate if the conditions occurred in the inpatient setting and were not present on admission. Two additional conditions were added in fiscal year (FY) 2009, and one of the original categories was expanded. The DRA mandated that for discharges occurring on or after October 1, 2008, the acquisition of one or more of these preventable conditions during a hospital stay could not assign the patient’s stay to a higher-paying MS-DRG.
The first eight conditions included serious reportable events (sometimes called “never events”),1 such as foreign object accidentally retained after surgery, air embolism, and transfusing the wrong blood type (ABO incompatibility). They also included five harmful conditions that occur more often yet are believed to be reasonably preventable if accepted standards of care are followed: stage III and IV pressure ulcer; falls and trauma leading to fractures, dislocations, head injuries, burns, or other trauma; catheter-associated urinary tract infection (CAUTI); vascular catheter-associated infection; and a surgical site infection (SSI) (mediastinitis) following coronary artery bypass graft.
The HAC for SSIs was expanded in the FY 2009 rules to include those following specific orthopedic procedures to the spine, neck, shoulder, and elbow and infections following bariatric procedures. A ninth and tenth HAC were also identified: one for serious complications of diabetes acquired during a stay (manifestations of poor glycemic control) and one for deep vein thrombosis (DVT) or pulmonary embolism (PE) following certain orthopedic procedures.
The HAC-POA program may result in many spillover effects and unintended consequences. We expect that these effects will differ across payers. Medicaid programs that share in the cost of care for Medicare/Medicaid dual enrollees will be directly affected by the HAC-POA program, whereas private commercial payers, the Department of Veterans Affairs, and self-pay payers may be more indirectly affected. Patient-level spillover effects from the mandatory POA coding are also likely. We expect increased provider awareness of the incidence and costs of HACs to lead to improved hospital protocols and reductions in the number of reasonably preventable events across all patients. These are the hoped-for spillovers, occurring as hospitals adapt their behavior and create new procedures in response to the payment incentives or the new documentation requirements. Each of the new policy responses by other payers or State governments increases the likelihood of desirable spillover effects to the non-Medicare population. 1 The National Quality Forum defines serious reportable events as preventable, serious, and unambiguous events
that should never occur.

2
As part of its evaluation of the Medicare HAC-POA program, RTI International was asked to investigate several of these suggested possible spillover effects and unintended negative consequences using appropriate qualitative or quantitative research approaches. This report summarizes findings from investigations of some of these effects, using quantitative analysis of claims and other secondary data.
E.1 Study Questions and Data
In this report, we address the following research questions:
1. How much variation in the reporting of HACs is there across all payers?
2. Has the HAC-POA program reduced the overall reporting of HACs for all payers; in other words, is there a positive spillover to all payers?
3. Have hospitals failed to identify HACs by not recording the relevant conditions in the first eight secondary diagnosis codes?
4. How does the coding of secondary diagnosis codes and location of HACs among the secondary diagnosis codes vary by hospital characteristics such as for-profit status, teaching status, and location?
The primary data for the all-payer analysis are the Agency for Healthcare Research and Quality (AHRQ) Healthcare Cost and Utilization Project (HCUP) State inpatient databases (SIDs) for Arizona, California, Florida, and New Jersey. California has a long history of coding the POA variable. A POA variable has been on the California claim since 1997. Florida, however, did not begin including the POA variable on its inpatient claims until 2007. Arizona and New Jersey did not begin until FY 2008.
E.2 Findings From the Analysis of Spillovers
• We did not find any consistent pattern in the reporting of the rates of HACs across 3 years or by type of payer or by State. Medicare had the highest rates of hospital-acquired falls and trauma, stage III and IV pressure ulcer, CAUTI, and vascular catheter-associated infection. Medicaid had the highest rates of hospital-acquired mediastinitis following coronary artery bypass graft surgery and SSI following certain orthopedic procedures. It is not possible to draw any conclusions for air embolism, blood incompatibility, or SSI following bariatric surgery because they occurred too infrequently.
• Comparing rates of HACs from 2008 through 2010, we observe a general decline in the rate for several HACs: falls and trauma, catheter-associated UTI, DVT/PE following certain orthopedic procedures, and SSI following certain orthopedic procedures. However, in most cases, the rate actually increased in 2009 compared to 2008 before declining again in 2010. We found two different trends when we analyzed stage III and IV pressure ulcers. Between 2009 and 2010, rates fell in Arizona and California, but increased in Florida and New Jersey. One explanation is

3
that some hospitals were still “learning” how to recognize and code the stages of pressure ulcers, a new requirement under the Medicare HAC-POA program.
• The multivariate analysis of the all-payer data for three of the HACs provides some limited evidence of positive spillover effects on other payers, primarily in the first year of the Medicare HAC-POA program, for two of the three conditions. But we can also interpret the results as showing no impact of the Medicare HAC-POA program on the three studied HACs. There was no observed decline in the rate of CAUTI, and the observed decline in the rates of falls and trauma and DVT/PE following certain orthopedic procedures across all payers could be a naturally occurring secular trend, as the benefit appeared to be greatest in hospitals with initially highest rates.
E.3 Findings From the Analysis of Unintended Consequences
• Across public and private payers, counting all secondary diagnosis codes had the greatest positive effect in raising HAC rates for Medicare and Medicaid beneficiaries. One possible explanation for this finding is that Medicare and Medicaid patients are more likely to have multiple comorbidities or complications due to greater severity of illness, which increases the likelihood that more than eight secondary diagnosis fields are needed to code them all. Reporting more than eight diagnoses, in turn, provides more opportunity, intended or otherwise, to put HAC codes in the ninth or later fields.
• We examined the extent to which hospitals with the ability to code strategically are coding strategically by limiting our analysis to just those discharges with nine or more secondary diagnosis codes. We did not find any consistent pattern in coding across hospital characteristics across the HACs.
Beginning in January 2011, CMS began processing data for up to 25 diagnosis fields for all hospitals when submitted in the version 5010 format. This change may increase reported rates for some HACs and will improve accuracy. For example, the reported rate for hospital-acquired stage III or IV pressure ulcer could more than double and the rate for hospital-acquired falls and trauma could increase by 20 percent. The actual change may be more or less depending on hospital changes in quality in the interim. However, some HACs may still be missed to the extent that HACs do not manifest in the hospital or are coded POA on another admission, not coded at all, or coded in the 26th–30th secondary diagnosis fields.

4
This page intentionally left blank.

5
SECTION 1 INTRODUCTION, STUDY QUESTIONS, AND ORGANIZATION OF REPORT
1.1 Introduction
The purpose of this study is to look at spillovers and unintended consequences of the Medicare Hospital-Acquired Conditions–Present on Admission (HAC-POA) Program. The Deficit Reduction Act of 2005 (DRA) required the Secretary of the U.S. Department of Health and Human Services to identify high-cost and high-volume preventable conditions that result in higher payments for Medicare. As a result of this act, the Centers for Medicare & Medicaid Services (CMS) was required to identify by October 1, 2007, at least two preventable complications of care that could cause patients to be assigned to a higher-severity diagnosis-related group (DRG).2 The conditions had to be high cost, high volume, or both; result in the assignment of a case to a DRG that has a higher payment when present as a secondary diagnosis; and be reasonably preventable through the application of evidence-based guidelines. The DRA mandated that for discharges occurring on or after October 1, 2008, the acquisition of one or more of these preventable conditions during a hospital stay could not lead to the patient’s being assigned to a higher-paying DRG. To accomplish this, CMS required providers paid under the inpatient prospective payment system (IPPS) to code POA indicators on all International Classification of Diseases, Ninth Revision, Clinical Modification (ICD-9-CM) diagnoses for all claims submitted, beginning October 1, 2007. After considerable public comment in the published rules for IPPS and other inpatient settings during fiscal years (FY) 2007 and 2008, CMS identified eight conditions for which it would no longer pay a higher DRG rate if the conditions occurred in the inpatient setting and were not present on admission. Two additional conditions were added in FY 2009, and one of the original categories was expanded.
The first eight conditions included serious reportable events such as foreign object accidentally retained after surgery, air embolism, and transfusing the wrong blood type (ABO incompatibility). They also included five harmful conditions that occur more often yet are believed to be reasonably preventable if accepted standards of care are followed: stage III and IV pressure ulcer; falls and trauma leading to fractures, dislocations, head injuries, burns, or other trauma; catheter-associated urinary tract infection (CAUTI); vascular catheter-associated infection; and a surgical site infection (SSI) (mediastinitis) following coronary artery bypass graft (CABG).
The HAC for SSIs was expanded in the FY 2009 rules to include those following specific orthopedic procedures to the spine, neck, shoulder, and elbow and infections following bariatric procedures. A ninth and tenth HAC were also identified: one for serious complications of diabetes acquired during a stay (manifestations of poor glycemic control) and one for deep vein thrombosis (DVT) or pulmonary embolism (PE) following certain orthopedic procedures.
2 By FY 2008, CMS had replaced DRGs with Medicare Severity DRGs (MS-DRGs), which are more sensitive to
the presence or absence of complicating conditions.
6
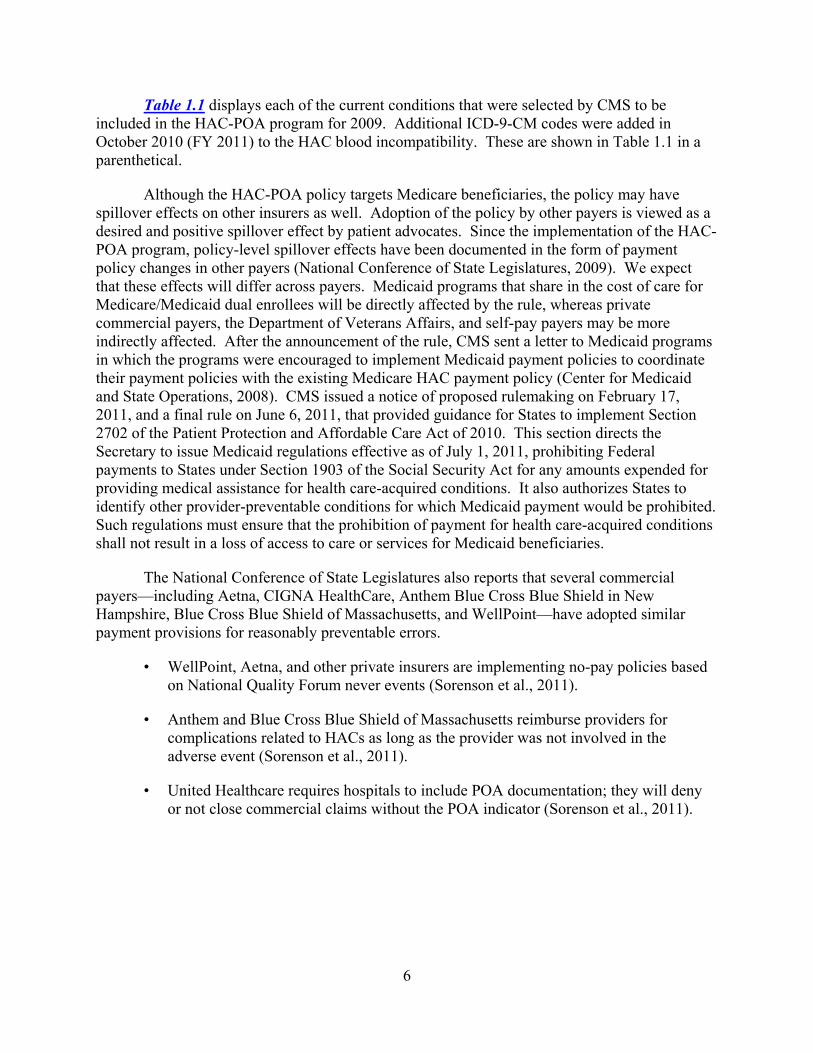
Table 1.1 displays each of the current conditions that were selected by CMS to be included in the HAC-POA program for 2009. Additional ICD-9-CM codes were added in October 2010 (FY 2011) to the HAC blood incompatibility. These are shown in Table 1.1 in a parenthetical.
Although the HAC-POA policy targets Medicare beneficiaries, the policy may have spillover effects on other insurers as well. Adoption of the policy by other payers is viewed as a desired and positive spillover effect by patient advocates. Since the implementation of the HAC-POA program, policy-level spillover effects have been documented in the form of payment policy changes in other payers (National Conference of State Legislatures, 2009). We expect that these effects will differ across payers. Medicaid programs that share in the cost of care for Medicare/Medicaid dual enrollees will be directly affected by the rule, whereas private commercial payers, the Department of Veterans Affairs, and self-pay payers may be more indirectly affected. After the announcement of the rule, CMS sent a letter to Medicaid programs in which the programs were encouraged to implement Medicaid payment policies to coordinate their payment policies with the existing Medicare HAC payment policy (Center for Medicaid and State Operations, 2008). CMS issued a notice of proposed rulemaking on February 17, 2011, and a final rule on June 6, 2011, that provided guidance for States to implement Section 2702 of the Patient Protection and Affordable Care Act of 2010. This section directs the Secretary to issue Medicaid regulations effective as of July 1, 2011, prohibiting Federal payments to States under Section 1903 of the Social Security Act for any amounts expended for providing medical assistance for health care-acquired conditions. It also authorizes States to identify other provider-preventable conditions for which Medicaid payment would be prohibited. Such regulations must ensure that the prohibition of payment for health care-acquired conditions shall not result in a loss of access to care or services for Medicaid beneficiaries.
The National Conference of State Legislatures also reports that several commercial payers—including Aetna, CIGNA HealthCare, Anthem Blue Cross Blue Shield in New Hampshire, Blue Cross Blue Shield of Massachusetts, and WellPoint—have adopted similar payment provisions for reasonably preventable errors.
• WellPoint, Aetna, and other private insurers are implementing no-pay policies based on National Quality Forum never events (Sorenson et al., 2011).
• Anthem and Blue Cross Blue Shield of Massachusetts reimburse providers for complications related to HACs as long as the provider was not involved in the adverse event (Sorenson et al., 2011).
• United Healthcare requires hospitals to include POA documentation; they will deny or not close commercial claims without the POA indicator (Sorenson et al., 2011).
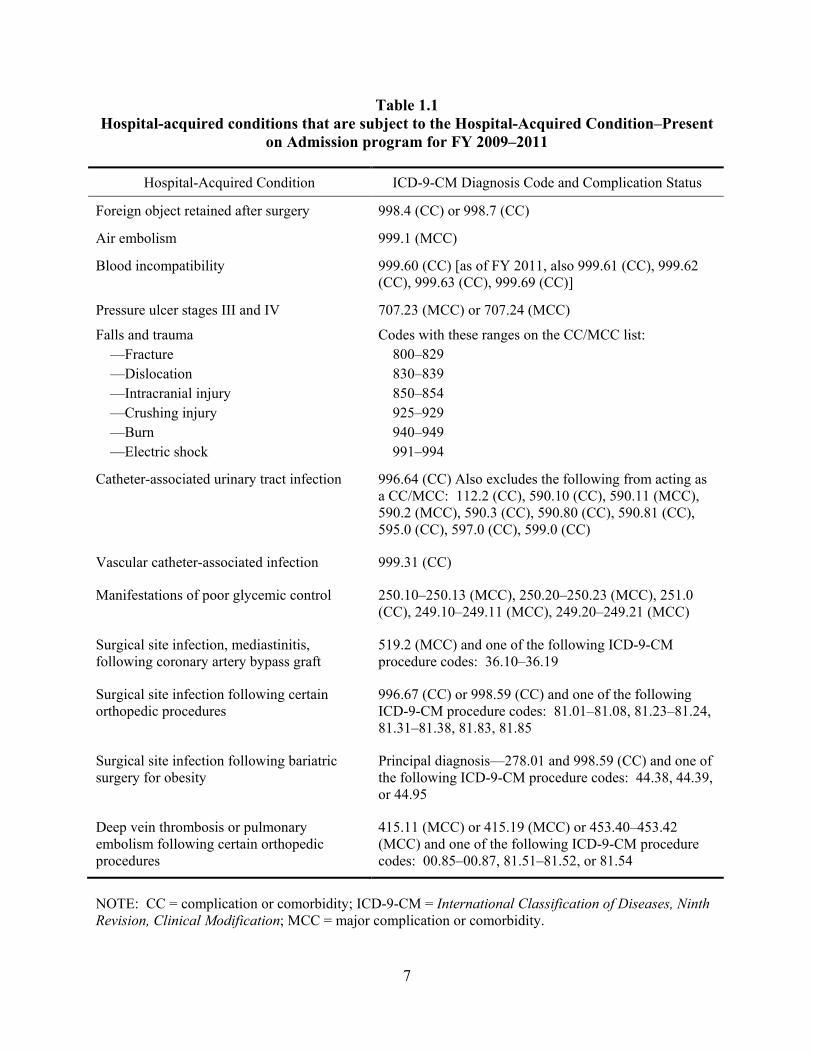
7
Table 1.1 Hospital-acquired conditions that are subject to the Hospital-Acquired Condition–Present
on Admission program for FY 2009–2011
Hospital-Acquired Condition ICD-9-CM Diagnosis Code and Complication Status
Foreign object retained after surgery 998.4 (CC) or 998.7 (CC)
Air embolism 999.1 (MCC)
Blood incompatibility 999.60 (CC) [as of FY 2011, also 999.61 (CC), 999.62 (CC), 999.63 (CC), 999.69 (CC)]
Pressure ulcer stages III and IV 707.23 (MCC) or 707.24 (MCC)
Falls and trauma —Fracture —Dislocation —Intracranial injury —Crushing injury —Burn —Electric shock
Codes with these ranges on the CC/MCC list: 800–829 830–839 850–854 925–929 940–949 991–994
Catheter-associated urinary tract infection 996.64 (CC) Also excludes the following from acting as a CC/MCC: 112.2 (CC), 590.10 (CC), 590.11 (MCC), 590.2 (MCC), 590.3 (CC), 590.80 (CC), 590.81 (CC), 595.0 (CC), 597.0 (CC), 599.0 (CC)
Vascular catheter-associated infection 999.31 (CC)
Manifestations of poor glycemic control 250.10–250.13 (MCC), 250.20–250.23 (MCC), 251.0 (CC), 249.10–249.11 (MCC), 249.20–249.21 (MCC)
Surgical site infection, mediastinitis, following coronary artery bypass graft
519.2 (MCC) and one of the following ICD-9-CM procedure codes: 36.10–36.19
Surgical site infection following certain orthopedic procedures
996.67 (CC) or 998.59 (CC) and one of the following ICD-9-CM procedure codes: 81.01–81.08, 81.23–81.24, 81.31–81.38, 81.83, 81.85
Surgical site infection following bariatric surgery for obesity
Principal diagnosis—278.01 and 998.59 (CC) and one of the following ICD-9-CM procedure codes: 44.38, 44.39, or 44.95
Deep vein thrombosis or pulmonary embolism following certain orthopedic procedures
415.11 (MCC) or 415.19 (MCC) or 453.40–453.42 (MCC) and one of the following ICD-9-CM procedure codes: 00.85–00.87, 81.51–81.52, or 81.54
NOTE: CC = complication or comorbidity; ICD-9-CM = International Classification of Diseases, Ninth Revision, Clinical Modification; MCC = major complication or comorbidity.

8
Finally, the National Conference of State Legislatures reports that some States have negotiated or are in the process of negotiating with state hospital associations and larger hospital systems to refrain from sending any bills (regardless of payer) when certain never events3 occur. As of February 2011, 27 States and the District of Columbia had enacted legislation to establish adverse event reporting systems for adverse events or HACs, while 31 States and the District of Columbia are tracking at least one Medicare HAC (West, Eng, and Lyda-McDonald, 2011).
Patient-level spillover effects from the mandatory POA coding are also likely. We expect increased provider awareness of the incidence and costs of HACs to lead to improved hospital protocols and reductions in the number of reasonably preventable events across all patients. These are the hoped-for spillovers, occurring as hospitals adapt their behavior and create new procedures in response to the payment incentives or the new documentation requirements. Each of the new policy responses by other payers or State governments increases the likelihood of desirable spillover effects to the non-Medicare population.
Understanding the hospital contribution to variation in the incidence of HACs is key to evaluating the program’s effects on quality and patient safety. Hospitals face different market conditions, competitive pressures, and budget constraints. They also vary in the effectiveness of their management and their levels of commitment to safety and quality. A strong culture of safety will not necessarily correlate with low adverse event rates and could be associated with higher baseline adverse event rates if the culture of safety has resulted in more honest and accurate reporting. Such a culture should, however, be associated with an ability to respond to policy incentives such as those offered by the HAC-POA program that is greater than that found in poor cultures of safety.
It is also possible that hospitals will change behaviors in undesirable ways, resulting in unintended negative consequences for the HAC-POA program. Examples that have been suggested to CMS in public comments to the rules include altering admission patterns to avoid patients at higher risk for complications; ordering more laboratory tests to help identify asymptomatic POA conditions; overusing antibiotics to prevent infections; or simply not recording HACs in the medical record.
As part of its evaluation of the Medicare HAC-POA program, RTI International was asked to investigate several of these suggested possible spillover effects and unintended negative consequences using appropriate qualitative or quantitative research approaches. This report summarizes findings from investigations of some of these effects, using quantitative analysis of claims and other secondary data.
3 The National Quality Foundation has defined 28 never events. Initially, never events were defined as medical
errors that should never occur. Today, the term includes any adverse events that should never occur (AHRQ, n.d.).

9
1.2 Study Questions
We address the following research questions:
1. How much variation in the reporting of HACs is there across all payers?
2. Has the HAC-POA program reduced the overall reporting of HACs for all payers; in other words, is there a positive spillover to all payers?
3. Have hospitals failed to identify HACs by not recording the relevant conditions in the first eight secondary diagnosis codes?
4. How does the coding of secondary diagnosis codes and location of HACs among the secondary diagnosis codes vary by hospital characteristics such as for-profit status, teaching status, and location?
1.3 Organization of Report
Section 2 of this report describes the data and methods. The primary data for this report are the Agency for Healthcare Research and Quality (AHRQ) Healthcare Cost and Utilization Project (HCUP) State inpatient databases (SIDs) for Arizona, California, Florida, and New Jersey for 2008–2010. The SID is an all-payer database, and each of the four States included in the analysis has been coding conditions present on admission since at least 2008.
Section 3 of this report answers the first two research questions. The SID data are used to look at HAC rates across primary payers and over time. We compared the levels and variation in HACs across six types of payers before and after the implementation of the HAC-POA program by calculating 10 different HAC rates by payer and State from 2008 to 2010, and we prepared descriptive tables showing the trend in rates from 2008 to 2010. We then used logistic regression to estimate the log-likelihood of the occurrence of three HACs in a particular hospitalization as a function of patient, hospital, and geographic characteristics with policy-relevant payer status, year, and State variables to examine the degree of spillover effect on other payers. We restricted the multivariate analysis to those conditions that had a sufficiently high incidence of occurrence to produce reliable estimates.
Section 4 of this report focuses on the last two research questions. The SID data are used to identify HACs that are coded in the ninth or beyond secondary diagnosis code. This is relevant because before FY 2011 CMS captured only the first eight secondary diagnosis codes. Section 4 also examines whether hospital characteristics can help explain the pattern of coding for different HACs and the trend in coding over time.
Section 5 provides an overall summary of the findings.

10
This page intentionally left blank.

11
SECTION 2 DATA AND METHODS
The primary dataset for this analysis is the all-payer data from AHRQ HCUP SIDs for 2008–2010. We purchased data for Arizona, California, Florida, and New Jersey, four States for which SID documentation indicated that the POA variable was populated in 2008 and for which the 2010 SID data were available by April 2012. California’s history of coding POA on hospital claims goes back to 1997. Consequently, there has been sufficient time for researchers to study the POA coding for California hospitals (Coffey, Milenkovic, and Andrews, 2006). Florida began coding the POA variable in 2007, whereas Arizona and New Jersey began coding the POA variable in 2008.
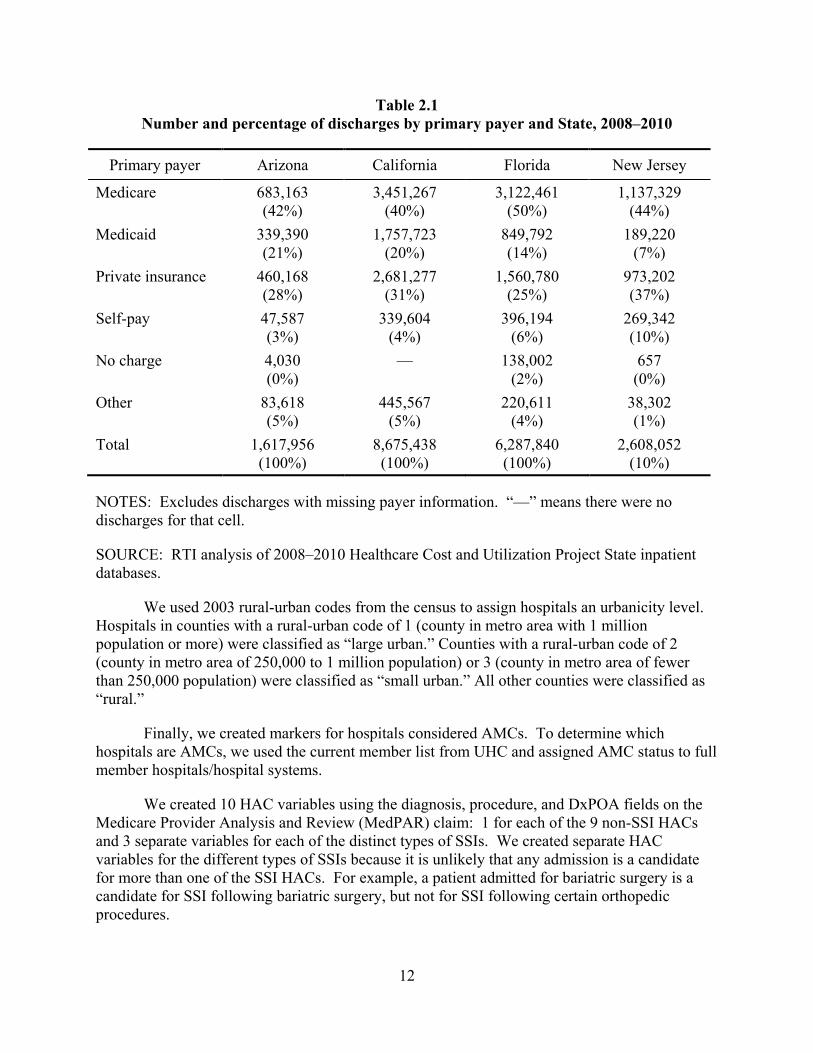
We kept only discharges from acute care hospitals, identified by their Medicare provider IDs. We excluded critical access hospitals, children’s hospitals, and other facility types because they are not paid under the IPPS and are therefore not subject to the HAC-POA rule. Using the information in the annual American Hospital Association Guide Issue, we merged Medicare provider IDs to the SID discharges. We further limited our sample to discharges for individuals over age 18 because not all HACs are relevant for children and, for those HACs that are applicable to children, hospital protocols and best practices may not apply (Bernard et al., 2011). By dropping individuals under age 18, we disproportionately dropped Medicaid and private insurer discharges: 37 percent of the Medicaid discharges and 25 percent of the private insurance discharges were for individuals 18 or under, compared with less than 0.5 percent of Medicare discharges. Finally, we dropped discharges in which the primary payer variable was coded as missing or invalid. Table 2.1 shows the number of discharges in our final dataset by primary payer and State for 2008–2010.
We supplemented the SID data with hospital characteristic variables from the 2010 Provider of Services File (POS), rural-urban codes from http://www.census.gov, and information on academic medical centers (AMCs) from the University HealthSystem Consortium (UHC). The data from the POS file were merged with the SID data by Medicare provider ID. Using the POS file, we assigned each hospital an ownership type based on the control type (PROV2885). Hospitals whose control type equaled 1, 2, or 3 were coded as “nonprofit.” Hospitals with a control type of 4 were classified as “for-profit,” whereas hospitals with a control type of 6 or 7 were classified as “State or local” and hospitals with control type of 5 or 8 were classified as “other government.” No other control types are associated with acute care hospitals.
12
Table 2.1 Number and percentage of discharges by primary payer and State, 2008–2010
Primary payer Arizona California Florida New Jersey
Medicare 683,163 (42%)
3,451,267 (40%)
3,122,461 (50%)
1,137,329 (44%)
Medicaid 339,390 (21%)
1,757,723 (20%)
849,792 (14%)
189,220 (7%)
Private insurance 460,168 (28%)
2,681,277 (31%)
1,560,780 (25%)
973,202 (37%)
Self-pay 47,587 (3%)
339,604 (4%)
396,194 (6%)
269,342 (10%)
No charge 4,030 (0%)
— 138,002 (2%)
657 (0%)
Other 83,618 (5%)
445,567 (5%)
220,611 (4%)
38,302 (1%)
Total 1,617,956 (100%)
8,675,438 (100%)
6,287,840 (100%)
2,608,052 (10%)
NOTES: Excludes discharges with missing payer information. “—” means there were no discharges for that cell.
SOURCE: RTI analysis of 2008–2010 Healthcare Cost and Utilization Project State inpatient databases.
We used 2003 rural-urban codes from the census to assign hospitals an urbanicity level. Hospitals in counties with a rural-urban code of 1 (county in metro area with 1 million population or more) were classified as “large urban.” Counties with a rural-urban code of 2 (county in metro area of 250,000 to 1 million population) or 3 (county in metro area of fewer than 250,000 population) were classified as “small urban.” All other counties were classified as “rural.”
Finally, we created markers for hospitals considered AMCs. To determine which hospitals are AMCs, we used the current member list from UHC and assigned AMC status to full member hospitals/hospital systems.
We created 10 HAC variables using the diagnosis, procedure, and DxPOA fields on the Medicare Provider Analysis and Review (MedPAR) claim: 1 for each of the 9 non-SSI HACs and 3 separate variables for each of the distinct types of SSIs. We created separate HAC variables for the different types of SSIs because it is unlikely that any admission is a candidate for more than one of the SSI HACs. For example, a patient admitted for bariatric surgery is a candidate for SSI following bariatric surgery, but not for SSI following certain orthopedic procedures.

13
An admission was considered to have 1 of the 10 HACs if any HAC-related diagnosis codes were not present on admission (i.e., DxPOA was not equal to Y or W) and that corresponding diagnosis code met criteria for the HAC. For the 3 SSI HACs as well as DVT/PE following certain orthopedic procedures, beneficiaries also needed to meet the procedure requirements to have the HAC. The criteria for assigning a HAC are based on the ICD-9-CM diagnosis and procedure codes in Table 1.1.
After assigning each beneficiary any study HACs, we next calculated HAC rates based on the number of beneficiaries with a particular HAC for every 10,000 discharges eligible for that HAC. All discharges were eligible for all HACs except the three SSI HACs and DVT/PE following certain orthopedic procedures. Table 2.2 shows the number of eligible discharges for each HAC for 2008–2010.
Table 2.2 Number of eligible discharges, by HAC, 2008–2010
Hospital-acquired condition Number of eligible discharges
Foreign object retained after surgery 19,190,202 Falls and trauma 19,190,202 Manifestations of poor glycemic control 19,190,202 Air embolism 19,190,202 Blood incompatibility 19,190,202 Stage III or IV pressure ulcer 19,190,202 Catheter-associated urinary tract infection 19,190,202 Vascular catheter-associated infection 19,190,202 Deep vein thrombosis /pulmonary embolism following certain orthopedic procedures
535,057
SSI—mediastinitis following coronary artery bypass graft surgery
136,177
SSI following certain orthopedic procedures 229,204 SSI following bariatric surgery 73,746
NOTE: Eligible discharges include discharges with missing primary payer.
SOURCE: RTI analysis of 2008–2010 Healthcare Cost and Utilization Project State inpatient databases.
14
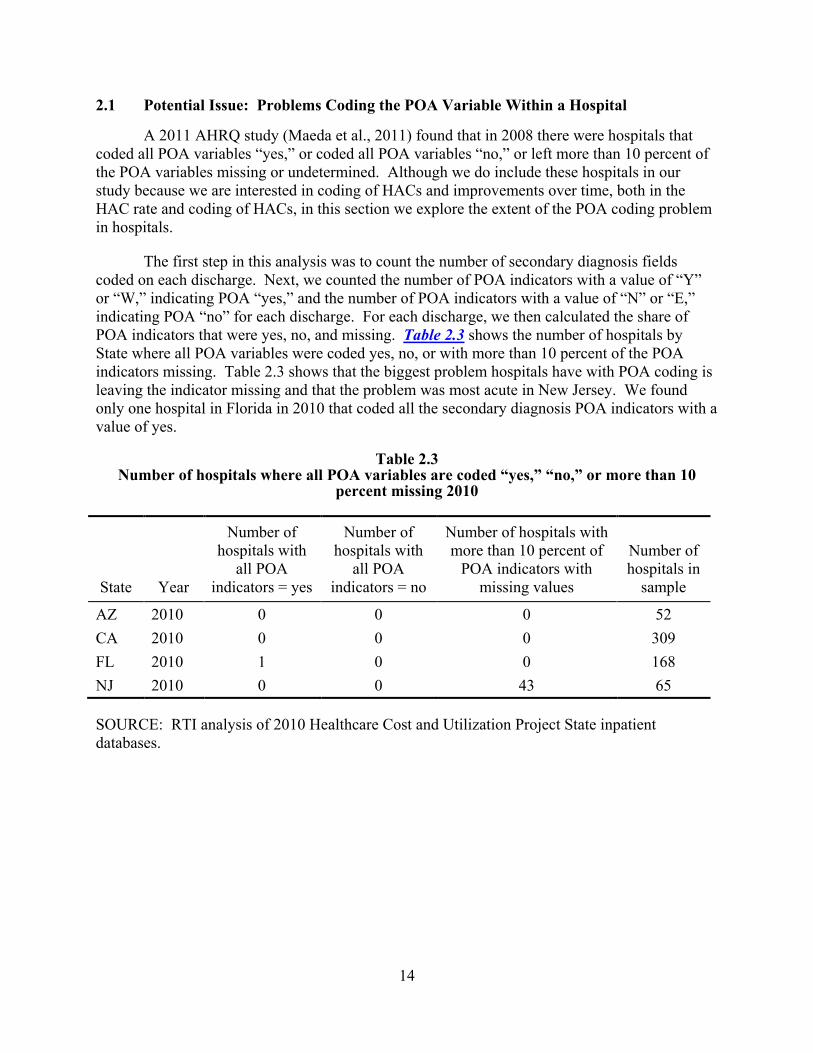
2.1 Potential Issue: Problems Coding the POA Variable Within a Hospital
A 2011 AHRQ study (Maeda et al., 2011) found that in 2008 there were hospitals that coded all POA variables “yes,” or coded all POA variables “no,” or left more than 10 percent of the POA variables missing or undetermined. Although we do include these hospitals in our study because we are interested in coding of HACs and improvements over time, both in the HAC rate and coding of HACs, in this section we explore the extent of the POA coding problem in hospitals.
The first step in this analysis was to count the number of secondary diagnosis fields coded on each discharge. Next, we counted the number of POA indicators with a value of “Y” or “W,” indicating POA “yes,” and the number of POA indicators with a value of “N” or “E,” indicating POA “no” for each discharge. For each discharge, we then calculated the share of POA indicators that were yes, no, and missing. Table 2.3 shows the number of hospitals by State where all POA variables were coded yes, no, or with more than 10 percent of the POA indicators missing. Table 2.3 shows that the biggest problem hospitals have with POA coding is leaving the indicator missing and that the problem was most acute in New Jersey. We found only one hospital in Florida in 2010 that coded all the secondary diagnosis POA indicators with a value of yes.
Table 2.3 Number of hospitals where all POA variables are coded “yes,” “no,” or more than 10
percent missing 2010
State Year
Number of hospitals with
all POA indicators = yes
Number of hospitals with
all POA indicators = no
Number of hospitals with more than 10 percent of
POA indicators with missing values
Number of hospitals in
sample
AZ 2010 0 0 0 52 CA 2010 0 0 0 309 FL 2010 1 0 0 168 NJ 2010 0 0 43 65
SOURCE: RTI analysis of 2010 Healthcare Cost and Utilization Project State inpatient databases.

15
SECTION 3 SPILLOVER EFFECTS OF THE HAC-POA PROGRAM TO OTHER PAYERS
3.1 Introduction
We expect that, if the HAC-POA program resulted in any changes in the incidence of HACs, these changes will be observed across all patients within a hospital, independent of payer. Quality and safety improvements, such as new protocols for avoiding SSIs, will generate hospital-wide changes that should affect all patients, regardless of payer. However, not all hospitals may have the same incentives to modify their behavior.
Many factors could influence a hospital’s behavior in response to the implementation of the HAC-POA program. Initial RTI estimates in support of rulemaking found that in 2010, the HAC-POA program had a direct financial impact on only 3,572 discharges, saving Medicare only $21,450,095.4 Although initial RTI estimates show minimal direct financial impact, the program may indirectly lead to lower expected revenues and profits for hospitals if the cost of care exceeds payments. Economic theory predicts a tipping point where expected losses in revenue are high enough to overcome the financial and organizational costs and trigger a change in hospital behavior. Factors that may lead indirectly to expected lower revenue include (1) the adoption of similar rules by private payers, Medicaid, or both and (2) potential loss of reputation if lack of adherence to quality protocols is publicly reported. It is also possible that hospitals choose to modify their behavior in anticipation of future increases in the penalties for poor-quality performance, as proposed in the Affordable Care Act of 2010.
In conducting this spillover analysis using secondary data sources, we do not observe the actual incidence of HACs but only the reporting of HACs. A second issue is that many HACs, including those for SSIs, do not manifest until after a patient is discharged from the hospital. To be consistent with the Medicare HAC-POA program, which requires clinical manifestation during the hospitalization, we use only inpatient data for this analysis. If a “true” HAC rate includes conditions that begin during the initial hospitalization but are not manifest until after discharge, our rates will be understated.
In this section, we address the following two questions:
• How much variation in the reporting of HACs is there across all payers?
• Has the HAC-POA program reduced the overall reporting of HACs for all payers; in other words, is there a positive spillover to all payers?
To answer these questions, we first compared the levels and variation in HACs across six types of payers before and after the implementation of the HAC-POA program by calculating 10 different HAC rates by payer and State from 2008 to 2010 and prepared descriptive tables showing the trend in rates from 2008 to 2010. We then used logistic regression to estimate the
4 RTI analysis of MedPAR IPPS claims, October 2009 through September 2010, found in Table F of 2010
Charts_all_DRGs_072611.doc
16
log-likelihood of the occurrence of three HACs in a particular hospitalization as a function of patient, hospital, and geographic characteristics with policy-relevant payer status, year, and State variables to examine the degree of spillover effect on other payers. We restricted the multivariate analysis to those conditions that had a sufficiently high incidence of occurrence to produce reliable estimates. The remainder of this section presents the descriptive analyses (Section 3.2) and the multivariate analyses (Section 3.3). The section concludes with a discussion (Section 3.4) that summarizes the findings.
3.2 Descriptive Analysis: Rates of Hospital-Acquired Conditions Across Payers and Over Time
We begin with a descriptive analysis of variation in the reported HACs across payers and the changes in reporting from 2008 and 2010. All of the secondary diagnoses on the HCUP record are used to calculate HAC rates. Overall, the tables show that the reported rate of HACs varies across payers and States. Because of the differences across HACs, we discuss each separately. No statistical tests of differences are reported. Instead, testing is done later (see Section 3.3) using logistic regression to control for differences in patient mix. Also, rates for self-pay, no charge, and the “other payer” category are based on too few observations to be considered meaningful.
Table 3.1 displays rates of hospital-acquired foreign object retained after surgery per 10,000 discharges by primary payer, State, and year. Across payers, less than 1 in 10,000 discharges results in a hospital-acquired foreign object retained after surgery. Although there are differences in the rate across payers, there is no pattern either across time or across States.

17
Table 3.1 Rates of hospital-acquired foreign object retained after surgery, per 10,000 discharges, by
primary payer, State, and year
State Year
Medicare rate per 10,000
Medicaid rate per 10,000
Private insurance rate per 10,000
Self-pay rate per 10,000
No charge rate per 10,000
Other rate per 10,000
Arizona 2008 0.54 0.29 0.82 0.62 0.00 0.37 Arizona 2009 0.40 0.86 0.54 1.95 0.00 0.34 Arizona 2010 0.26 0.92 0.86 0.63 0.00 1.12 California 2008 0.48 0.56 0.74 0.27 — 0.86 California 2009 0.44 0.22 0.56 0.35 — 0.33 California 2010 0.38 0.39 0.51 0.17 — 0.49 Florida 2008 0.36 0.46 0.57 0.23 0.00 0.66 Florida 2009 0.31 0.41 0.36 0.38 0.38 0.27 Florida 2010 0.33 0.20 0.24 0.23 0.26 0.69 New Jersey 2008 0.28 0.17 0.39 0.34 0.00 0.78 New Jersey 2009 0.19 0.32 0.36 0.45 0.00 0.00 New Jersey 2010 0.27 0.00 0.48 0.11 0.00 0.00
NOTE: “—” means there were no discharges for that cell. The number of instances in which the hospital-acquired condition occurred can be found in Table A.1.
SOURCE: RTI analysis of 2008–2010 Healthcare Cost and Utilization Project State inpatient databases.
Table 3.2 displays the rates of hospital-acquired falls and trauma per 10,000 discharges by primary payer, State, and year. Compared with Medicaid, privately insured, and self-pay discharges, the HAC rate for Medicare discharges is at least 50 percent higher across all States and years, which is not surprising given the greater likelihood of a fall among the elderly. In Arizona in 2008, the rate was 11.37/10,000 Medicare discharges, compared with 3.30/10,000 Medicaid discharges, 5.09/10,000 privately insured discharges, and 3.70/10,000 self-pay discharges. Similarly, in New Jersey in 2010, the rate for Medicare discharges was 8.42/10,000 Medicare discharges, compared with 3.48/10,000 Medicaid discharges, 2.87/10,000 privately insured discharges, and 2.77/10,000 self-pay discharges.
Table 3.2 also shows a strong downward trend in the HAC rates for falls and trauma across all payers from 2008 to 2010. The decline is most precipitous in all four States from 2008 to 2009, with a smaller decline from 2009 to 2010. One possible explanation for this downward trend is improved or enforced hospital protocols to reduce falls and trauma.

18
Table 3.2 Rates of hospital-acquired falls and trauma, per 10,000 discharges, by primary payer,
State, and year
State Year
Medicare rate per 10,000
Medicaid rate per 10,000
Private insurance rate per 10,000
Self-pay rate per 10,000
Other rate per 10,000
No charge rate per 10,000
Arizona 2008 11.37 3.30 5.09 3.70 0.00 9.55 Arizona 2009 10.13 3.17 3.90 1.95 0.00 2.71 Arizona 2010 9.25 3.18 3.92 1.25 15.82 3.36 California 2008 11.92 4.87 5.43 4.94 — 8.42 California 2009 8.41 3.50 3.20 2.96 — 3.26 California 2010 7.40 2.54 2.89 2.77 — 3.00 Florida 2008 10.73 4.69 3.75 2.67 4.26 4.63 Florida 2009 9.98 3.45 3.82 2.43 4.21 3.85 Florida 2010 8.45 3.30 3.60 3.60 2.32 4.72 New Jersey 2008 12.58 5.47 8.63 8.96 0.00 22.68 New Jersey 2009 8.07 2.87 3.06 2.34 0.00 3.10 New Jersey 2010 8.42 3.48 2.87 2.77 0.00 6.35
NOTE: “—” means there were no discharges for that cell. The number of instances in which the hospital-acquired condition occurred can be found in Table A.2.
SOURCE: RTI analysis of 2008–2010 Healthcare Cost and Utilization Project State inpatient databases.
A necessary, but not sufficient, condition for POA reporting to be a contributing factor to the decline in the rate of hospital-acquired falls and trauma is for the percentage of discharges with a fall or trauma coded as POA to increase while the numbers of discharges with a fall or trauma remain constant or increase. Table 3.3 shows the number of discharges with a fall or trauma (independent of POA status), and the percentage coded POA, by primary payer, State, and year. The number of discharges for falls and trauma was fairly constant from 2008 to 2010, but the percentage of discharges for falls and trauma coded POA increased from 2008 to 2010. It is therefore likely that the reductions in fall and trauma HAC rates in Table 3.3 are at least partially explained by an increase in POA reporting.

19
Table 3.3 Number of discharges with a fall or trauma and percentage coded present on admission, by
primary payer and State, 2008–2010
State Year Medicare
N (%) Medicaid
N (%)
Private insurance
N (%) Self-pay N (%)
No charge N (%)
Other N (%)
Arizona 2008 5,693 (95.6)
2,405 (98.6)
3,429 (97.5)
1,046 (99.4)
12 (100.0)
1,370 (98.1)
Arizona 2009 5,766 (96.0)
2,731 (98.6)
3,083 (98.1)
940 (99.7)
37 (100.0)
1,169 (99.3)
Arizona 2010 6,070 (96.4)
2,896 (98.7)
2,886 (98.1)
840 (99.8)
41 (95.1)
1,159 (99.2)
California 2008 24,525 (94.2)
7,090 (96.0)
15,767 (96.7)
4,504 (98.8)
— 7,581 (98.3)
California 2009 24,926 (96.0)
7,154 (97.1)
15,427 (98.1)
4,767 (99.3)
— 7,014 (99.3)
California 2010 23,544 (96.6)
6,913 (97.9)
13,913 (98.3)
5,038 (99.4)
— 6,554 (99.3)
Florida 2008 20,963 (94.7)
2,388 (94.9)
12,340 (98.3)
3,633 (99.0)
1,597 (98.7)
3,151 (98.9)
Florida 2009 21,721 (95.1)
2,827 (96.4)
11,556 (98.2)
3,504 (99.1)
1,435 (98.5)
2,782 (99.0)
Florida 2010 21,022 (95.9)
2,975 (96.7)
10,682 (98.4)
3,623 (98.7)
943 (99.0)
2,828 (98.8)
New Jersey 2008 7,197 (93.2)
419 (92.1)
5,042 (94.3)
2,041 (96.1)
1 (100.0)
756 (96.2)
New Jersey 2009 7,322 (95.8)
450 (96.)
5,212 (98.1)
1,921 (98.9)
— 624 (99.4)
New Jersey 2010 7,329 (95.7)
495 (95.4)
5,202 (98.3)
2,062 (98.8)
3 (100.0)
674 (98.8)
NOTE: “—” means there were no discharges for that cell.
SOURCE: RTI analysis of 2008–2010 Healthcare Cost and Utilization Project State inpatient databases.

20
Table 3.4 displays rates of hospital-acquired manifestations of poor glycemic control per 10,000 discharges, by primary payer, State, and year. In Arizona and California, with the exception of self-pay and “other” insured patients, who have relatively few discharges, the highest HAC rates for poor glycemic control are found for Medicaid patients. In Florida and New Jersey, there is less difference in hospital-acquired poor glycemic control rates across payers. In 2008 in Florida, the highest rate of hospital-acquired poor glycemic control is among Medicaid patients, but by 2010, the highest rate is among privately insured patients. Conversely, in New Jersey, the highest rate of hospital-acquired poor glycemic control is for privately insured patients in 2008, but the rate is highest among Medicaid patients in 2010. Table 3.4 also shows steadily declining rates in Arizona, California, and Florida from 2008 to 2010. The observed declines could have resulted from hospital improvements to monitor and control blood sugar or from improved diagnosis of poor glycemic control at admission. It is unclear why rates of hospital-acquired poor glycemic control would have fallen in New Jersey from 2008 to 2009 across the three major primary payers, only to increase again in 2010.
Table 3.4 Rates of hospital-acquired manifestations of poor glycemic control per 10,000 discharges,
by primary payer, State, and year
State Year
Medicare rate per 10,000
Medicaid rate per 10,000
Private insurance rate per 10,000
Self-pay rate per 10,000
Other rate per 10,000
No charge rate per 10,000
Arizona 2008 0.77 1.26 0.29 0.00 0.00 0.73 Arizona 2009 0.22 0.60 0.20 0.00 0.00 1.02 Arizona 2010 0.30 0.58 0.29 0.00 0.00 0.00 California 2008 0.91 1.27 0.93 2.11 — 1.51 California 2009 0.46 0.68 0.44 0.26 — 0.53 California 2010 0.40 0.42 0.38 0.61 — 0.42 Florida 2008 0.76 0.81 0.60 0.69 0.64 0.40 Florida 2009 0.55 0.48 0.49 0.38 0.00 0.41 Florida 2010 0.43 0.40 0.60 0.30 0.26 0.69 New Jersey 2008 0.85 0.50 0.90 0.90 0.00 1.56 New Jersey 2009 0.53 0.48 0.33 0.67 0.00 0.00 New Jersey 2010 0.48 1.21 0.55 0.22 0.00 0.79
NOTE: “—” means there were no discharges for that cell. The number of instances in which the hospital-acquired condition occurred can be found in Table A.3.
SOURCE: RTI analysis of 2008–2010 Healthcare Cost and Utilization Project State inpatient databases.

21
Table 3.5 displays the rates of hospital-acquired air embolism per 10,000 discharges by primary payer, State, and year. Rates of hospital-acquired air embolism are very low, occurring, on average, less than 1 time in every 100,000 discharges. There is no clear pattern in HAC rates across payers. There is also no trend in the rate of air embolism for any of the primary payers or States.
Table 3.5 Rates of hospital-acquired air embolism per 10,000 discharges, by primary payer, State,
and year
State Year
Medicare rate per 10,000
Medicaid rate per 10,000
Private insurance rate per 10,000
Self-pay rate per 10,000
Other rate per 10,000
No charge rate per 10,000
Arizona 2008 0.05 0.00 0.00 0.00 0.00 0.00 Arizona 2009 0.09 0.17 0.13 0.00 0.00 0.00 Arizona 2010 0.04 0.00 0.00 0.00 0.00 0.00 California 2008 0.07 0.03 0.06 0.00 — 0.07 California 2009 0.08 0.02 0.05 0.00 — 0.20 California 2010 0.07 0.02 0.05 0.00 — 0.07 Florida 2008 0.04 0.04 0.04 0.08 0.00 0.00 Florida 2009 0.02 0.03 0.02 0.00 0.19 0.00 Florida 2010 0.01 0.03 0.02 0.00 0.00 0.00 New Jersey 2008 0.00 0.00 0.00 0.11 0.00 0.00 New Jersey 2009 0.03 0.00 0.00 0.00 0.00 0.00 New Jersey 2010 0.03 0.00 0.00 0.00 0.00 0.00
NOTE: “—” means there were no discharges for that cell. The number of instances in which the hospital-acquired condition occurred can be found in Table A.4.
SOURCE: RTI analysis of 2008–2010 Healthcare Cost and Utilization Project State inpatient databases.
Hospital-acquired blood incompatibility is also very rare. Table 3.6 displays the rates of hospital-acquired blood incompatibility per 10,000 discharges by primary payer, State, and year. On average, less than 1 patient in 250,000 received the wrong blood type. It is therefore difficult to compare HAC rates across payers or over time.

22
Table 3.6 Rates of hospital-acquired blood incompatibility per 10,000 discharges by primary payer,
State, and year
State Year
Medicare rate per 10,000
Medicaid rate per 10,000
Private insurance rate per 10,000
Self-pay rate per 10,000
Other rate per 10,000
No charge rate per 10,000
Arizona 2008 0.00 0.00 0.00 0.00 0.00 0.00 Arizona 2009 0.00 0.00 0.00 0.00 0.00 0.00 Arizona 2010 0.00 0.08 0.07 0.00 0.00 0.00 California 2008 0.02 0.03 0.00 0.00 — 0.00 California 2009 0.01 0.00 0.01 0.00 — 0.00 California 2010 0.01 0.00 0.00 0.00 — 0.00 Florida 2008 0.02 0.12 0.04 0.00 0.00 0.00 Florida 2009 0.01 0.10 0.04 0.08 0.00 0.00 Florida 2010 0.00 0.13 0.04 0.00 0.00 0.00 New Jersey 2008 0.05 0.00 0.03 0.00 0.00 0.00 New Jersey 2009 0.00 0.00 0.00 0.00 0.00 0.00 New Jersey 2010 0.03 0.00 0.03 0.00 0.00 0.00
NOTE: “—” means there were no discharges for that cell. The number of instances in which the hospital-acquired condition occurred can be found in Table A.5.
SOURCE: RTI analysis of 2008–2010 Healthcare Cost and Utilization Project State inpatient databases.
Table 3.7 displays the 2009 and 2010 rates of hospital-acquired stage III and IV pressure ulcer per 10,000 discharges by primary payer and State. It was not possible to calculate rates for earlier years because the ICD-9-CM diagnosis codes used to identify the different pressure ulcer stages were not implemented until October 2008. Across all four States, rates of hospital-acquired stage III and IV pressure ulcer were highest among Medicare discharges, followed by Medicaid discharges, with rates for Medicare discharges more than twice the rate for privately insured discharges. From 2009 to 2010, rates fell in Arizona and California but increased in Florida and New Jersey. In fact, the rate more than doubled across all payers in Florida.

23
Table 3.7 Rates of hospital-acquired stage III and IV pressure ulcers per 10,000 discharges,
by primary payer, State, and year
State Year
Medicare rate per 10,000
Medicaid rate per 10,000
Private insurance rate per 10,000
Self-pay rate per 10,000
Other rate per 10,000
No charge rate per 10,000
Arizona 2009 1.54 0.94 0.60 0.65 6.40 3.38 Arizona 2010 1.41 0.42 0.64 0.00 0.00 1.86 California 2009 2.94 2.67 0.82 0.44 — 0.87 California 2010 2.01 1.76 0.77 0.78 — 0.70 Florida 2009 0.85 0.54 0.14 0.30 0.43 0.53 Florida 2010 2.79 2.39 1.25 1.14 1.34 1.10 New Jersey 2009 3.52 2.71 1.03 0.33 0.00 0.77 New Jersey 2010 3.66 2.88 1.06 1.55 0.00 2.38
NOTE: “—” means there were no discharges for that cell. The number of instances in which the hospital-acquired condition occurred can be found in Table A.6.
SOURCE: RTI analysis of 2009–2010 Healthcare Cost and Utilization Project State inpatient databases.
Table 3.8 displays the rates of hospital-acquired CAUTIs per 10,000 discharges by primary payer, State, and year. Medicare patients were more than twice as likely as all other patients to acquire a CAUTI in an acute care hospital, which likely reflects greater usage of indwelling urinary catheters. Unfortunately, insertion of indwelling catheters is seldom reported on the MedPAR record; therefore, we cannot restrict our analyses to patients with an indwelling urinary catheter. Rates for Medicare discharges ranged from a low of 3.98/10,000 discharges in New Jersey in 2008 to 6.15/10,000 discharges in California in 2010. In comparison, in all four States, the rate for Medicaid and privately insured patients did not exceed 2.57/10,000 discharges. There is no consistent pattern in rates across States and over time. From 2008 to 2010, the rate of hospital-acquired CAUTI fell slightly for Medicare and Medicaid discharges in Arizona. In California, the rate increased for Medicare and Medicaid patients from 2008 to 2009 before falling slightly for Medicaid patients in 2010. However, in Florida, rates increased for all payers from 2008 to 2009, but then fell for Medicare and privately insured discharges from 2009 to 2010, while the rate for Medicaid discharges continued to increase.

24
Table 3.8 Rates of hospital-acquired catheter-associated urinary tract infection per 10,000
discharges, by primary payer, State, and year
State Year
Medicare rate per 10,000
Medicaid rate per 10,000
Private insurance rate per 10,000
Self-pay rate per 10,000
Other rate per 10,000
No charge rate per 10,000
Arizona 2008 6.14 1.94 2.40 1.23 8.31 1.47 Arizona 2009 5.42 1.89 1.75 0.65 12.80 3.38 Arizona 2010 5.88 1.34 2.57 1.88 7.91 2.61 California 2008 5.64 1.88 2.07 0.92 — 2.11 California 2009 6.10 2.13 2.03 2.01 — 1.86 California 2010 6.15 1.78 1.88 1.38 — 1.19 Florida 2008 4.68 1.11 1.49 1.07 1.70 2.11 Florida 2009 5.12 1.64 1.89 0.91 0.38 1.24 Florida 2010 4.44 2.33 1.49 0.90 1.55 1.80 New Jersey 2008 3.98 1.16 1.35 0.67 0.00 1.56 New Jersey 2009 4.34 0.95 1.06 0.89 0.00 2.32 New Jersey 2010 4.14 0.61 1.45 1.11 0.00 0.79
NOTE: “—” means there were no discharges for that cell. The number of instances in which the hospital-acquired condition occurred can be found in Table A.7.
SOURCE: RTI analysis of 2008–2010 Healthcare Cost and Utilization Project State inpatient databases.
Table 3.9 displays rates of hospital-acquired vascular catheter-associated infection per 10,000 discharges by primary payer, State, and year. Rates for Medicare discharges were higher than for all other payers. Of more significance, the Medicare HAC rate was only slightly higher than for Medicaid discharges. Rates of hospital-acquired vascular catheter-associated infection fell steadily for Medicare, Medicaid, and privately insured discharges from 2008 to 2010 in all States except New Jersey.

25
Table 3.9 Rates of hospital-acquired vascular catheter-associated infection per 10,000 discharges by
primary payer, State, and year
State Year
Medicare rate per 10,000
Medicaid rate per 10,000
Private insurance rate per 10,000
Self-pay rate per 10,000
Other rate per 10,000
No charge rate per 10,000
Arizona 2008 12.68 9.60 8.71 4.32 8.31 11.01 Arizona 2009 9.69 7.81 9.00 4.54 19.21 5.08 Arizona 2010 8.02 7.44 6.91 3.13 15.82 8.95 California 2008 12.31 10.27 7.78 6.68 — 8.75 California 2009 10.81 9.83 6.90 6.28 — 7.79 California 2010 7.90 6.39 5.10 3.03 — 4.95 Florida 2008 15.16 14.65 11.07 8.00 14.47 12.55 Florida 2009 13.53 14.67 10.01 6.90 8.42 7.14 Florida 2010 8.93 11.23 7.09 4.96 6.19 7.63 New Jersey 2008 11.54 10.27 6.73 5.82 0.00 7.04 New Jersey 2009 12.46 10.82 7.70 4.24 0.00 5.42 New Jersey 2010 12.85 10.45 7.92 5.86 0.00 4.77
NOTE: “—” means there were no discharges for that cell. The number of instances in which the hospital-acquired condition occurred can be found in Table A.8.
SOURCE: RTI analysis of 2008–2010 Healthcare Cost and Utilization Project State inpatient databases.
Table 3.10 displays the rate of hospital-acquired DVT/PE following certain orthopedic procedures per 10,000 discharges, by primary payer, State, and year. The rate of hospital- acquired DVT/PE following certain orthopedic procedures is high, occurring more than 20 times per 10,000 discharges regardless of payer and more than 54 times per 10,000 Medicare discharges. Although there was no consistent pattern in rates across payers, the rate was more than 40 percent higher in New Jersey than in the other three States and did decline by approximately one-third from 2008 to 2010.
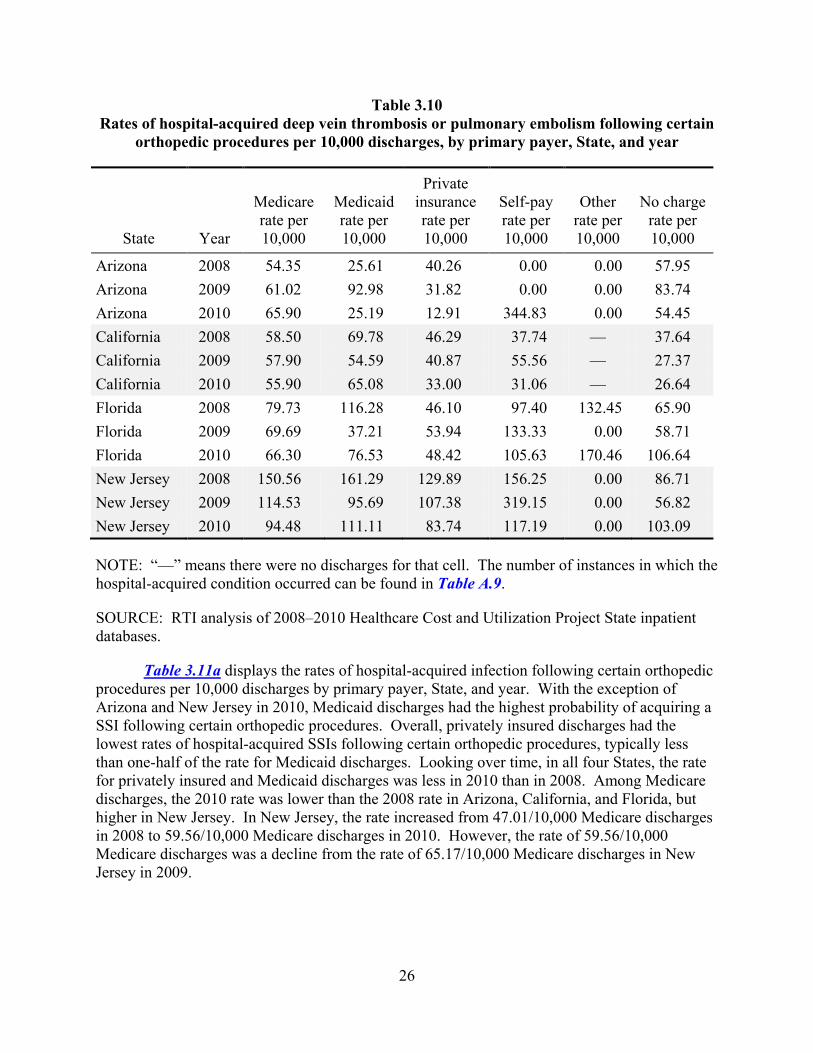
26
Table 3.10 Rates of hospital-acquired deep vein thrombosis or pulmonary embolism following certain
orthopedic procedures per 10,000 discharges, by primary payer, State, and year
State Year
Medicare rate per 10,000
Medicaid rate per 10,000
Private insurance rate per 10,000
Self-pay rate per 10,000
Other rate per 10,000
No charge rate per 10,000
Arizona 2008 54.35 25.61 40.26 0.00 0.00 57.95 Arizona 2009 61.02 92.98 31.82 0.00 0.00 83.74 Arizona 2010 65.90 25.19 12.91 344.83 0.00 54.45 California 2008 58.50 69.78 46.29 37.74 — 37.64 California 2009 57.90 54.59 40.87 55.56 — 27.37 California 2010 55.90 65.08 33.00 31.06 — 26.64 Florida 2008 79.73 116.28 46.10 97.40 132.45 65.90 Florida 2009 69.69 37.21 53.94 133.33 0.00 58.71 Florida 2010 66.30 76.53 48.42 105.63 170.46 106.64 New Jersey 2008 150.56 161.29 129.89 156.25 0.00 86.71 New Jersey 2009 114.53 95.69 107.38 319.15 0.00 56.82 New Jersey 2010 94.48 111.11 83.74 117.19 0.00 103.09
NOTE: “—” means there were no discharges for that cell. The number of instances in which the hospital-acquired condition occurred can be found in Table A.9.
SOURCE: RTI analysis of 2008–2010 Healthcare Cost and Utilization Project State inpatient databases.
Table 3.11a displays the rates of hospital-acquired infection following certain orthopedic procedures per 10,000 discharges by primary payer, State, and year. With the exception of Arizona and New Jersey in 2010, Medicaid discharges had the highest probability of acquiring a SSI following certain orthopedic procedures. Overall, privately insured discharges had the lowest rates of hospital-acquired SSIs following certain orthopedic procedures, typically less than one-half of the rate for Medicaid discharges. Looking over time, in all four States, the rate for privately insured and Medicaid discharges was less in 2010 than in 2008. Among Medicare discharges, the 2010 rate was lower than the 2008 rate in Arizona, California, and Florida, but higher in New Jersey. In New Jersey, the rate increased from 47.01/10,000 Medicare discharges in 2008 to 59.56/10,000 Medicare discharges in 2010. However, the rate of 59.56/10,000 Medicare discharges was a decline from the rate of 65.17/10,000 Medicare discharges in New Jersey in 2009.

27
Table 3.11a Rates of hospital-acquired surgical site infection following certain orthopedic procedures
per 10,000 discharges, by primary payer, State, and year
State Year
Medicare rate per 10,000
Medicaid rate per 10,000
Private insurance rate per 10,000
Self-pay rate per 10,000
Other rate per 10,000
No charge rate per 10,000
Arizona 2008 44.64 109.69 27.56 0.00 0.00 49.69 Arizona 2009 15.09 83.83 13.59 0.00 0.00 11.89 Arizona 2010 39.45 21.01 30.14 0.00 0.00 0.00 California 2008 66.85 152.38 25.88 104.17 — 60.77 California 2009 67.17 93.84 29.52 127.80 — 47.91 California 2010 40.04 117.58 24.77 31.85 — 27.14 Florida 2008 31.70 102.56 19.54 94.70 112.36 44.93 Florida 2009 35.65 60.30 15.22 0.00 0.00 31.61 Florida 2010 21.61 42.55 13.62 0.00 0.00 16.84 New Jersey 2008 47.02 105.26 44.09 208.33 0.00 20.53 New Jersey 2009 65.17 95.24 37.32 66.67 0.00 19.88 New Jersey 2010 59.56 0.00 37.95 139.86 0.00 19.86
NOTE: “—” means there were no discharges for that cell. The number of instances in which the hospital-acquired condition occurred can be found in Table A.11.
SOURCE: RTI analysis of 2008–2010 Healthcare Cost and Utilization Project State inpatient databases.
Table 3.11b displays the rates of hospital-acquired mediastinitis following CABG per 10,000 discharges by primary payer, State, and year. Because of the relatively few CABG discharges (see Table 2.2), particularly for non-Medicare payers, the HAC rates are more volatile and difficult to compare across payers and years. Table 3.11b shows a wide variation in HAC rates across payers, years, and States, ranging from a low of 0 in several instances to a high of 42/10,000 Medicaid discharges in Florida in 2008.

28
Table 3.11b Rates of hospital-acquired surgical site infection—mediastinitis following coronary artery
bypass graft per 10,000 discharges, by primary payer, State, and year
State Year
Medicare rate per 10,000
Medicaid rate per 10,000
Private insurance rate per 10,000
Self-pay rate per 10,000
Other rate per 10,000
No charge rate per 10,000
Arizona 2008 6.22 0.00 0.00 0.00 0.00 0.00 Arizona 2009 0.00 0.00 7.48 0.00 0.00 0.00 Arizona 2010 7.08 0.00 0.00 0.00 0.00 0.00 California 2008 13.68 22.62 12.03 0.00 — 0.00 California 2009 8.61 22.17 1.93 30.40 — 0.00 California 2010 9.08 7.43 4.19 0.00 — 31.40 Florida 2008 6.35 42.02 2.00 0.00 32.79 19.01 Florida 2009 2.85 11.86 4.54 0.00 0.00 0.00 Florida 2010 5.86 21.93 7.79 41.90 0.00 18.87 New Jersey 2008 8.70 0.00 4.50 29.94 — 0.00 New Jersey 2009 11.78 0.00 4.75 0.00 — 0.00 New Jersey 2010 18.47 0.00 0.00 0.00 — 0.00
NOTE: “—” means there were no discharges for that cell. The number of instances in which the hospital-acquired condition occurred can be found in Table A.10.
SOURCE: RTI analysis of 2008–2010 Healthcare Cost and Utilization Project State inpatient databases.
Table 3.11c shows the rates of hospital-acquired infection following bariatric surgery per 10,000 discharges by primary payer, State, and year. The rate is zero, with only one exception. In 2009, California Medicare discharges had a rate of 5.3/10,000 bariatric surgery discharges. The reasons that the rate for the remaining payer-year-State combinations’ being zero are likely that (1) there are so few bariatric procedures (see Table 2.2) and (2) the probability of a HAC is relatively low in the population, so that the sample size was too small for the adverse event (the HAC) to occur.

29
Table 3.11c Rates of hospital-acquired surgical site infection following bariatric surgery for obesity per
10,000 discharges, by primary payer, State, and year
State Year
Medicare rate per 10,000
Medicaid rate per 10,000
Private insurance rate per 10,000
Self-pay rate per 10,000
Other rate per 10,000
No charge rate per 10,000
Arizona 2008 0.00 0.00 0.00 0.00 0.00 — Arizona 2009 0.00 0.00 0.00 0.00 0.00 0.00 Arizona 2010 0.00 0.00 0.00 0.00 0.00 0.00 California 2008 0.00 0.00 0.00 0.00 0.00 — California 2009 5.33 0.00 0.00 0.00 0.00 — California 2010 0.00 0.00 0.00 0.00 0.00 — Florida 2008 0.00 0.00 0.00 0.00 0.00 0.00 Florida 2009 0.00 0.00 0.00 0.00 0.00 0.00 Florida 2010 0.00 0.00 0.00 0.00 0.00 0.00 New Jersey 2008 0.00 0.00 0.00 0.00 0.00 0.00 New Jersey 2009 0.00 0.00 0.00 0.00 0.00 0.00 New Jersey 2010 0.00 0.00 0.00 0.00 0.00 0.00
NOTE: “—” means there were no discharges for that cell. The number of instances in which the hospital-acquired condition occurred can be found in Table A.12.
SOURCE: RTI analysis of 2008–2010 Healthcare Cost and Utilization Project State inpatient databases.
3.3 Logistic Analysis of Rates of Hospital-Acquired Conditions
We examined econometrically whether the HAC-POA program reduced the overall reporting of HACs for all payers, controlling for patient, hospital, and geographic characteristics that may affect the probability of acquiring a HAC. For example, large hospitals and AMCs invariably perform more orthopedic surgeries on sicker patients. Experience with the surgery, particularly among nursing staff, may result in fewer patients’ developing a DVT or PE. However, large hospitals may also have better reporting systems in place than smaller hospitals and therefore have higher reported rates of HACs. It is also possible that hospitals with larger Medicare populations, with potentially more at stake, would react more to the HAC-POA program, resulting in a larger spillover onto other payers. To control for this, we created a variable to capture the share of a hospital’s discharges in which the primary payer was Medicare. Finally, we created a variable, DRG average length of stay (ALOS), which is the arithmetic mean length of stay associated with the DRG to which that case would have been assigned under version 24 of the 3M grouper (which was in effect before the implementation of MS-DRGs in October 2007). The V24 DRG assignment is a variable available in the HCUP files. We use the

30
V24 DRG ALOS to instrument for length of stay in the hospital. We cannot use the actual length of stay because of the endogeneity of length of stay with a HAC—that is, not only does a longer length of stay theoretically increase the likelihood of a HAC, but also patients with a HAC will need to stay in the hospital longer. Similarly, we decided on V24 DRGs rather than MS-DRGs because the presence of the HAC often causes a patient to be assigned to a higher severity level of the DRG family (one with “CCs” or “MCCs”) that will have a longer expected length of stay; thus the HAC would be both a cause and an effect of longer MS-DRG ALOS.
We performed logistic regressions on hospital discharges from 2008 through 2010. We focused our analysis on three HACs: falls and trauma, CAUTI, and DVT/PE following certain orthopedic procedures. We selected these HACs because they occur with high enough frequency across all payers to estimate a maximum likelihood model. In contrast, HACs such as blood incompatibility or bariatric surgery, which almost never occur, cannot be estimated using the logistic model.5 Furthermore, we limited the analysis of spillovers to Medicare, Medicaid, and private insurance given small HAC rates and numbers of discharges for other payers.
We estimated separate logistic regressions for each of the three HACs for which the dependent variable was 1 if the admission had that particular HAC and 0 otherwise. For each of the regression models, variables used to control for patient, hospital, and geographic characteristics are as follows (with the reference group indicated by “ref”).
Patient Characteristics
• Age groups (AGEGROUP): 4 categories: 19–44, 45–64, 65–79 (ref), and 80+. Source: SID.
• RACE: 6 categories: White (ref), Black, Hispanic, Asian or Pacific Islander, Native American, and Other. Source: SID.
• FEMALE: 1 if female; 0 if male (ref). Source: SID.
• DRG ALOS: the version 24 DRG arithmetic mean ALOS was used to “instrument” for the patient’s own LOS. An instrument was needed because a HAC may lead to a longer LOS, and a longer LOS can lead to a HAC. The 2008–2010 SIDs include a V24 DRG, which is calculated based on the claim diagnoses and procedures. Note: V24 DRGs are not MS-DRGs. Sources: SID and CMS.
Hospital Characteristics
• AMC: 0 if the hospital is not an AMC (ref), 1 if an AMC. Source: UHC.
• BEDS: The number of certified beds in the hospital. Source: Medicare POS.
5 When too few positive instances of the event occur, the maximum likelihood does not converge in the logistic
model.

31
• Ownership status (OWNERSHIP): HAC rates may be affected by whether a hospital is for-profit, private nonprofit (ref), other government, or State/local government. Source: POS.
• Medicare_Q: Hospitals were divided into four quartiles on the basis of their share of discharges for which Medicare was the primary payer. Hospitals with the lowest share were in the first quartile and hospitals with the highest share in the fourth quartile. This value was recalculated for each year, so hospitals could switch quartiles from year to year if their Medicare populations changed. Quartile 1 (ref). Source: SID.
Geographic Characteristics
• Urbanicity (URBAN): 3 categories: rural, small urban (ref), and large urban. Source: Census.
The model specification of the logistic is as follows:
1. Pb[HACpt] = eL/(1 + eL)
2. L = a + ΣbuURBANptu + ΣboOWNERSHIPptod + ΣbyYEARpty + ΣbjPAY1ptj + ΣΣbyjYEAR*PAY1ptyj + ΣbaAGEGRPpta + ΣbrRACEptr + bfFEMALEptf + blALOSptl + bmAMCptm + bbBEDSptb + ΣbsSTATEpts + ΣΣbsySTATE*YEARptsy + ΣbmMEDICARE_Qptb+ ept,
where pb[HACpt] = the probability (0,1) of a patient admitted in the t th period incurring a HAC, and L = the logit function. For presentation, the vector of logit coefficients is converted into odds ratios relative to the reference group. For very rare events, odds ratios can be interpreted as relative risks. For instance, an odds ratio of 1.2 for one of the primary payer variables would be interpreted as a 20 percent increase in the likelihood of the HAC for the payer relative to Medicare. Odds ratios less than 1 would mean a lower probability of the HAC relative to Medicare.
In the regression models, PAY1 is the vector of primary payers in the data. Medicare is the reference category, so that the vector of PAY1 odds ratios (ORs) will capture the magnitude and direction of the incremental differences by primary payer relative to Medicare. The vector of odds ratios on the YEAR indicator captures the changes in HAC rates over time relative to 2008, the reference year, and controls for changes in the mix of patient and hospital characteristics. The odds ratios on the PAY1*YEAR interaction terms capture the incremental difference in the year-to-year changes in HAC rates for other payers relative to Medicare. STATE is the vector of States Arizona (AZ), California (CA), and Florida (FL), with New Jersey as the reference. The STATE variables’ odds ratios have an interpretation similar to that of the odds ratios for the PAY1 variables and STATE*YEAR interactions’ odds ratios as PAY1*Year interactions’ odds ratios.
Table 3.12 shows the odds ratios and p–value for falls and trauma, CAUTI, and DVT/PE following certain orthopedic procedures. Although care should be taken in generalizing from the

32
experience of just four States, Arizona, California, Florida, and New Jersey provide some geographic dispersion and relatively different baseline HAC rates. Holding many beneficiary, hospital, and geographic characteristics constant, we find that Medicaid and private insurance patients had a lower likelihood than Medicare patients of experiencing a fall or trauma (ORs=0.852, 0.829, respectively) or developing a CAUTI (ORs=0.842, 0.789, respectively) in the year before implementation of the HAC-POA program (2008 is the reference year). Non-Medicare payers’ patients had no difference in the likelihood of developing a DVT/PE following certain orthopedic procedures in 2008.
Table 3.12 Odds ratios for selected hospital-acquired conditions
Parameter
Falls and trauma
odds ratio
Falls and trauma p-value
CAUTI odds ratio
CAUTI p-value
DVT/PE odds ratio
DVT/PE p-value
Payer Medicaid 0.852 0.004 0.842 0.0571 1.289 0.1662 Private insurance 0.829 <.0001 0.789 0.0003 1.022 0.792
Year 2009 0.537 <.0001 1.053 0.6025 0.794 0.0191 2010 0.541 <.0001 1.043 0.6737 0.664 <.0001
Payer/Year Interaction Medicaid*2009 0.916 0.2511 1.079 0.5027 0.837 0.4939 Medicaid*2010 0.874 0.0951 1.067 0.5732 0.906 0.6978 Private insurance*2009 0.809 0.0002 0.920 0.3228 1.017 0.8617 Private insurance*2010 0.831 0.002 0.916 0.3132 0.860 0.1408
State Arizona 0.698 <.0001 1.761 <.0001 0.382 <.0001 California 0.752 <.0001 1.447 <.0001 0.376 <.0001 Florida 0.656 <.0001 1.170 0.0603 0.545 <.0001
State/Year Interaction AZ*2009 1.650 <.0001 0.830 0.1882 1.409 0.046 AZ*2009 1.551 <.0001 0.925 0.5776 1.523 0.0174 CA*2009 1.336 <.0001 1.021 0.8438 1.202 0.1174 CA*2010 1.174 0.0192 1.052 0.6377 1.376 0.0091 FL*2009 1.866 <.0001 1.068 0.5555 1.140 0.2657 FL*20010 1.684 <.0001 1.011 0.9229 1.368 0.0102
N 18,596,830 N/A 18,596,830 N/A 517,936 N/A Likelihood ratio 8054 N/A 7083 N/A 728 N/A Max–rescaled r–square 0.0402 N/A 0.0641 N/A 0.0189 N/A
NOTE: CAUTI = catheter-associated urinary tract infection, DVT/PE = deep vein thrombosis or pulmonary embolism following certain orthopedic procedures, N/A = not applicable.
Program: Final_core_ahal_db28_regr.xls

33
We observe for all payers a decline in 2009 in the likelihood of experiencing a fall or trauma in 2009 (OR=0.537), with an incrementally greater decline for privately insured patients (OR=0.809), but no further decline in 2010 for any payer. We also observe a decline in 2009 in the likelihood of developing a DVT/PE following certain orthopedic procedures in 2009 (OR=0.794), with an incrementally greater decline in 2010 (OR=0.664), but no incremental difference across payers. In 2009 and 2010, there was no change in the likelihood of developing a CAUTI for any payer; the odds ratios for 2009 and 2010 and the odds ratios for the interactions of YEAR and PAYER show no trend either up or down.
New Jersey exhibited high rates of falls and trauma and DVT/PE following certain orthopedic procedures and low rates for CAUTI in the baseline 2008 year relative to Arizona, California, and Florida. Rates of falls and trauma and DVT/PE for hospitalized New Jersey Medicare beneficiaries fell by nearly 50 percent and 20 percent, respectively, in 2009, the first year of the HAC-POA program. Rates for these two conditions also fell in the other three States but by a smaller percentage amount. Thus, patients in Arizona, California, and Florida hospitals did not benefit as much in the first year of the HAC-POA program as patients in New Jersey.
3.4 Summary
In this section, we studied two questions related to the potential spillover of the Medicare HAC–POA program on other payers. The first question was whether the reported rate for the 10 Medicare HACs varied across payers. The second question considered whether the Medicare HAC–POA program had a spillover effect on the reported incidence of HACs for other payers.
We began our analysis by analyzing the reported rates of HACs by primary payer, year, and State using descriptive tables. We did not find any consistent pattern in the reporting of the rates of HACs across time or payer. Comparing across payers, we found that Medicare had the highest rates of hospital-acquired falls and trauma, stage III and IV pressure ulcer, CAUTI, and vascular catheter-associated infections, whereas Medicaid had the highest rates of hospital-acquired mediastinitis following CABG surgery and SSI following certain orthopedic procedures. It is not possible to draw any conclusions for air embolism, blood incompatibility, or for SSI following bariatric surgery because they occurred too infrequently. One possible explanation for these findings may be that each of the payers serves a very different population.
Comparing rates of HACs from 2008 through 2010, we observe a general decline in the rate for several HACs: falls and trauma, CAUTI, DVT/PE following certain orthopedic procedures, and SSI following certain orthopedic procedures. However, in most cases, the rate actually increased in 2009 compared with 2008 before declining again in 2010. We found two different trends when we analyzed stage III and IV pressure ulcer. Between 2009 and 2010, rates fell in Arizona and California but increased in Florida and New Jersey. One explanation is that some hospitals were still “learning” how to recognize and code the stages of pressure ulcers, a new requirement under the Medicare HAC-POA program.
The second part of our analysis consisted of estimating logistic regression models of the likelihood of developing one of three HACs: falls and trauma, CAUTI, and DVT/PE following certain orthopedic procedures. We estimated separate logistic regressions for each HAC, modeling whether the condition was reported during the inpatient stay or not after controlling for

34
patient, hospital, and geographic characteristics with policy-relevant variables of payer type, year, and State. We found no evidence that the HAC-POA program had any effect on the rate of CAUTI for the three payers: Medicare, Medicaid, and private insurance. We observed a decline in 2009 in the likelihood of experiencing a fall or trauma in 2009 for all three of these payers, with an incrementally greater decline for privately insured patients, but no further decline in 2010 for any payer. This indicates a positive spillover effect to private insurance patients. We also observe a decline in 2009 in the likelihood of developing a DVT/PE following certain orthopedic procedures in 2009, with an incrementally greater decline in 2010, but no incremental difference across payers. Two interpretations are possible. One interpretation is that there was an overall secular trend in DVT/PE rates independent of the HAC-POA program. A second interpretation is that the HAC–POA program has had a positive spillover effect on other payers (i.e., a “rising tide lifts all boats” phenomenon).
Combined, these results provide some limited evidence of positive spillover effects on other payers, primarily in the first year of the Medicare HAC-POA program, for two of the three conditions. But, we can also interpret the results to mean that there was no impact of the Medicare HAC-POA program on the three studied HACs. There was no decline in the rate of CAUTI, and the observed decline in the rates of falls and trauma and DVT/PE following certain orthopedic procedures across all payers could be a naturally occurring secular trend as the benefit appeared to be greatest in hospitals with initially highest rates.
There are two caveats to RTI’s all-payer analyses. First, we can analyze only the reported rate of the HACs and not their actual incidence. The actual incidence of HACs may be higher than the reported rate for three reasons: the condition may not manifest while the patient is in the hospital, as can happen with SSIs; hospitals may not code the condition if it does not affect their payment; and the HAC may not be reported if the patient has more secondary diagnoses than are captured on the claim. In the next section, we explore the relationship between the number of secondary diagnoses on the claim, the number captured by Medicare, and the impact on reported rates of HACs. Second, we could not measure any changes in individual hospital quality over time with changes in the rates of the studied HACs.

35
SECTION 4 ALL-PAYER ANALYSIS: UNINTENDED CONSEQUENCES OF HOSPITAL CODING
PRACTICES
4.1 Introduction
As with any new policy, there may be unintended consequences of the HAC-POA program. Examples that have been suggested to CMS in public comments include altering admission patterns to avoid patients at higher risk of complications, ordering more laboratory tests to help identify asymptomatic POA conditions, discharging patients early to avoid the manifestation of the HAC, or simply not recording HACs in the observable medical record.
HACs must be identified through the secondary diagnosis codes on the universal billing form, which in its current format can accommodate up to 30 ICD-9-CM diagnosis codes. Unfortunately, not all administrative compilations of claims data retain that much information. When working with HACs as reported in the Medicare claims files, before January 2011 hospitals could submit up to 25 diagnosis codes; however, CMS’s data system limitations allowed for the processing of only the first 9 diagnosis codes. Beginning in January 2011, CMS began processing data for up to 25 diagnosis fields for all hospitals when submitted in the version 5010 format.
Health care providers are instructed to code any secondary diagnosis that can affect treatment decisions or costs, but no rules govern the order in which the codes appear. It is therefore quite possible that the same medical chart could be coded differently at two hospitals, with one hospital reporting a HAC in the first eight secondary diagnosis fields and the other reporting the HAC in the ninth or subsequent diagnosis fields. Which secondary diagnoses are coded in the first eight fields can tell us about hospital behavior and whether hospitals are coding strategically.
We predict that “strategic coding” is possible for HACs. Under Medicare’s HAC-POA program, there is no direct financial incentive for hospitals to move the reporting of the HAC earlier on the claim because the MS-DRG payment can never be any lower than what it would have been if the HAC were not documented at all. At least one article raised concerns that coders may not list codes that will result in nonpayment (Saint et al., 2009). There are potential disincentives to coding a HAC earlier on the claim. A HAC could replace a secondary diagnosis that would lead to a different MS-DRG and higher payment. Coding the HAC earlier will also increase the hospital’s HAC rates in published sources such as the Hospital Compare Web site. Consequently, hospitals may have both financial and reputational incentives to use code sequencing to their advantage.
In this section, we explore hospital changes in coding and billing strategies in response to the HAC-POA program to answer the following questions:
1. Have hospitals failed to identify HACs by not recording the relevant conditions in the first eight secondary diagnosis codes?

36
2. How does the coding of secondary diagnosis codes and location of HACs among the secondary diagnosis codes vary by hospital characteristics such as for-profit status, teaching status, and location?
To answer these questions, we compared HAC rates for hospitals using the first eight secondary diagnosis codes and using all available codes on the claim. The descriptive analyses and tables are presented in Section 4.2. Section 4.3 concludes the section with a summary of the results and discussion.
4.2 Descriptive Analysis
State inpatient datasets vary in the number of secondary diagnosis codes that they choose to retain. Of the four States in this study, California and Arizona report up to 24 secondary diagnosis codes per claim, whereas Florida reports up to 30. New Jersey reported up to 23 secondary diagnosis codes in 2008 and up to 24 in 2009 and 2010. We calculated a second set of “HAC8” rates for each State for 2010, based on only the information in the first eight HCUP secondary diagnosis fields. This allowed us to compare rates computed using every available secondary diagnosis with rates computed using a subset equivalent to what CMS would use. In Table 4.1, we show the ratios of HAC rates computed from the first eight secondary diagnoses alone to rates computed using all secondary diagnoses appearing on the State’s HCUP file. Because the table shows ratios, they can be interpreted as percentages; for example, 0.83 means 83 percent of HACs were actually reported in the first eight secondary diagnosis fields.
We begin with a descriptive analysis of the difference in reported HAC rates using only the first eight secondary diagnoses (“HAC8”) rate and the reported HAC rate using all available secondary diagnosis codes on the claim. For these analyses, we used HCUP SID for Arizona, California, Florida, and New Jersey for the years 2008–2010. A lower ratio means that more HACs are reported past the 8th secondary diagnosis and thus likely omitted in the MedPAR dataset. The table shows that a nontrivial number of HACs are coded in the 9th and subsequent secondary diagnosis code fields. Take, for example, vascular catheter-associated infections among Medicare beneficiaries. In California, with 24 secondary diagnosis code fields on the claim, only 48 percent of the HACs were captured in the first 8 secondary diagnosis code fields, whereas in Florida the first 8 codes capture only 38 percent of hospital-acquired vascular catheter-associated infections. The data demonstrate that Medicare HACs as computed from MedPAR are understated by more than a factor of two. An earlier study found that increasing the number of secondary diagnosis codes from 14 to 24 for analysis did increase the HAC rate (Healy, Cromwell, and Spain, 2011). However, Table 4.1 shows no pattern in ratios among the four States, suggesting that there are few advantages to coding more than 24 secondary diagnosis codes. If more than 24 diagnosis codes did make a difference, then we would expect that Florida would have significantly lower ratios than the other three States in our study.

37
Table 4.1 Ratio of 2010 HAC rates based on the first eight secondary diagnoses (“HAC8 rate”) to 2010 HAC rates based on all reported HCUP secondary diagnoses, by HAC, State, and
primary payer
HAC State Medicare Medicaid Private
insurance Self-pay Other Foreign object retained after surgery
AZ 0.83 0.82 0.83 1.00 1.00
Foreign object retained after surgery
CA 0.68 0.82 0.90 1.00 0.71
Foreign object retained after surgery
FL 0.97 1.00 0.91 1.00 1.00
Foreign object retained after surgery
NJ 0.90 — 0.93 1.00 —
Falls and trauma AZ 0.79 0.71 0.80 0.50 0.89 Falls and trauma CA 0.64 0.65 0.73 0.69 0.81 Falls and trauma FL 0.75 0.60 0.74 0.75 0.76 Falls and trauma NJ 0.76 0.78 0.79 0.84 0.75 Manifestations of poor glycemic control
AZ 0.86 0.86 0.75 — —
Manifestations of poor glycemic control
CA 0.51 0.50 0.58 1.00 —
Manifestations of poor glycemic control
FL 0.84 0.75 0.89 1.00 0.00
Manifestations of poor glycemic control
NJ 0.83 0.75 0.94 1.00 —
Stage III or IV pressure ulcer
AZ 0.64 0.20 0.67 — —
Stage III or IV pressure ulcer
CA 0.46 0.48 0.44 0.33 —
Stage III or IV pressure ulcer
FL 0.51 0.23 0.20 0.00 0.00
Stage III or IV pressure ulcer
NJ 0.65 0.68 0.45 0.71 —
CAUTI AZ 0.72 0.62 0.58 0.67 0.00 CAUTI CA 0.54 0.57 0.55 0.69 — CAUTI FL 0.73 0.48 0.75 0.67 1.00 CAUTI NJ 0.75 0.50 0.56 0.60 —
(continued)

38
Table 4.1 (continued) Ratio of 2010 HAC rates based on the first eight secondary diagnoses (“HAC8 rate”) to 2010 HAC rates based on all reported HCUP secondary diagnoses, by HAC, State, and
primary payer
HAC State Medicare Medicaid Private
insurance Self-pay Other Vascular catheter associated infections
AZ 0.32 0.45 0.43 0.40 0.00
Vascular catheter -associated infection
CA 0.48 0.55 0.51 0.63 —
Vascular catheter- associated infection
FL 0.38 0.42 0.46 0.53 0.46
Vascular catheter- associated infection
NJ 0.47 0.80 0.53 0.68 —
DVT/PE following orthopedic procedures
AZ 0.95 1.00 1.00 1.00 —
DVT/PE following orthopedic procedures
CA 0.62 0.65 0.65 0.00 —
DVT/PE following orthopedic procedures
FL 0.93 1.00 0.97 1.00 1.00
DVT/PE following orthopedic procedures
NJ 0.96 1.00 0.97 1.00 —
SSI—mediastinitis following CABG surgery
AZ 0.50 — — — —
SSI—mediastinitis following CABG surgery
CA 0.50 0.00 0.00 — —
SSI—mediastinitis following CABG surgery
FL 0.17 1.00 0.33 0.67 —
SSI—mediastinitis following CABG surgery
NJ 0.33 — — — —
(continued)

39
Table 4.1 (continued) Ratio of 2010 HAC rates based on the first eight secondary diagnoses (“HAC8 rate”) to 2010 HAC rates based on all reported HCUP secondary diagnoses, by HAC, State, and
primary payer
HAC State Medicare Medicaid Private
insurance Self-pay Other SSI following certain orthopedic procedures
AZ 0.73 0.50 0.78 — —
SSI following certain orthopedic procedures
CA 0.52 0.48 0.58 0.00 —
SSI following certain orthopedic procedures
FL 0.57 0.60 0.53 — —
SSI following certain orthopedic procedures
NJ 0.78 — 0.79 1.00 —
NOTES: “—” means either there were no discharges or that the HAC rate was zero so that division was not possible. Ratios for air embolism, blood incompatibility, and SSI following bariatric surgery are not shown because occurrences were so rare across all payers and States that most ratios were either zero or undefined. AZ = Arizona; CA = California; FL = Florida; NJ = New Jersey. CABG = coronary artery bypass graft; CAUTI = catheter-associated urinary tract infection; DVT/PE = deep vein thrombosis/pulmonary embolism; HAC = hospital-acquired condition; HCUP = Healthcare Cost and Utilization Project; SSI = surgical site infection.
SOURCE: RTI analysis of 2008–2010 HCUP state inpatient databases.
Next, we determined the overall number of times each HAC was coded in the ninth and subsequent secondary diagnosis code fields. We concentrate on this subset of discharges because, by definition, the HAC8-to-HAC ratio for claims with eight or fewer secondary diagnosis codes is 1. Because a hospital’s ability to code strategically is limited if fewer than nine secondary diagnoses are reported, we also calculated the ratio of the HAC8 rate to the overall HAC rate using only those discharges with nine or more valid secondary diagnosis codes. Table 4.2 shows the number of discharges for each HAC, the number of instances in which the HAC was coded in the first eight secondary diagnosis code fields, and the ratio of the HAC8 to HAC rate, both overall and for claims with nine or more secondary diagnosis codes. The numbers in the table aggregate all four States (Arizona, California, Florida, and New Jersey). The fourth column of the table shows the simple ratio of the HAC rate using all secondary diagnosis fields to the rate using just the first eight fields (e.g., 62 percent across all HACs). The last column of the table shows the HAC8-to-HAC ratios for just those claims with nine or more secondary diagnosis codes (e.g., 52 percent across all HACs).
Among claims with nine or more secondary diagnosis codes, the HAC8-to-HAC ratios range from a low of 0.41 for mediastinitis following CABG surgery to a high of 0.73 for DVT/PE following certain orthopedic procedures. The simple ratio in column 4 shows the amount that HACs are underreported in MedPAR and other claims that capture only the first eight secondary diagnosis codes. For example, the all-discharge HAC8-to-HAC ratio for falls and trauma is 0.73, implying that the HAC is underreported by 27 percent. However, this

40
understates the true coding sequence problem by 23.7 percent (0.73/0.59). This translates into a 52 percent higher missed HAC rate for hospital-acquired falls and trauma (1 - 0.73/0.59). In contrast, for hospital-acquired mediastinitis following CABG, the ratios using all discharges are similar to the ratio among discharges with nine or more secondary diagnosis codes (0.41/0.44). These are sicker patients with many serious secondary diagnoses. Consequently, these discharges are likely to have more than nine secondary diagnoses (only five of the discharges with hospital-acquired mediastinitis had eight or fewer secondary diagnosis codes). As a result, the ratios using all discharges and just those with more than nine secondary diagnosis codes are similar.
Table 4.2 Number of HACs and ratio of HAC rates based on the first eight secondary diagnoses
(“HAC8 rate”) to HAC rates based on all reported HCUP secondary diagnosis, all discharges, and discharges with more than nine valid secondary diagnoses
HAC
All discharges: number of
HACs
All discharges: number of “HAC8s”
All discharges: HAC8-to-HAC ratio
Discharges with 9 or
more secondary diagnosis
codes: number of
HACs
Discharges with 9 or
more secondary diagnosis
codes: number of “HAC8s”
Discharges with 9 or
more secondary diagnosis
codes: HAC8-to-HAC ratio
All HACs 46,105 28,453 0.62 37,028 19,376 0.52 Foreign object retained after surgery
692 561 0.81 382 251 0.66
Falls and trauma 12,328 8,946 0.73 8,200 4,818 0.59 Poor glycemic control 1,160 795 0.69 874 509 0.58 Air embolism 75 52 0.69 49 26 0.53 Blood incompatibility 34 24 0.71 26 16 0.62 Stage III or IV pressure ulcer
2,722 1,292 0.47 2,534 1,104 0.44
CAUTI 6,268 3,889 0.62 5,637 3,258 0.58 Vascular catheter- associated infection
18,523 9,383 0.51 16,887 7,747 0.46
DVT/PE following certain orthopedic procedures
3,371 2,916 0.87 1,712 1,257 0.73
SSI—mediastinitis following CABG surgery
104 46 0.44 99 41 0.41
SSI following certain orthopedic procedures
827 549 0.66 627 349 0.56
SSI following bariatric surgery
1 0 0.00 1 0 0
NOTES: CABG = coronary artery bypass graft; CAUTI = catheter-associated urinary tract infection; DVT/PE = deep vein thrombosis/pulmonary embolism; HAC = hospital-acquired condition; HCUP = Healthcare Cost and Utilization Project; SSI = surgical site infection. SOURCE: RTI analysis of 2008–2010 Healthcare Cost and Utilization Project State inpatient databases

41
Different types of hospitals may have different incentives for coding HACs in the ninth or subsequent secondary diagnosis code fields. We would predict that for-profit hospitals, who want to maximize profits, would have more of an incentive than nonprofit hospitals to code revenue-enhancing diagnoses in the first eight secondary diagnosis code fields, relegating HACs to the ninth or subsequent fields. If true, then we would expect lower HAC8-to-HAC ratios at for-profit hospitals that at nonprofit hospitals. Furthermore, we expect that if for-profit hospitals are coding strategically, then their HAC8-to-HAC ratios should decline in 2009 and 2010 after implementation of the HAC-POA program. AMCs, on average, see sicker patients than non-AMCs and have a higher severity case. Patients at AMCs often have more serious complications than at non-AMCs, and these complications may even be more serious than some of the HACs, such as falls and trauma or pressure ulcers. We would then hypothesize that at an AMC with a very sick patient, the more serious complications would be placed in the first eight secondary diagnosis fields, pushing the HAC to the ninth or subsequent secondary diagnosis code fields. This would result in lower HAC8-to-HAC ratios at AMCs than at non-AMCs. This type of coding behavior should not be affected by the HAC-POA program; therefore, we would not expect any changes in the HAC8-to-HAC ratio at AMCs in 2009 and 2010 after implementation of the HAC-POA program.
In the next set of tables, we determine whether the share of HACs reported in the first eight secondary diagnosis code fields have declined over time and whether they vary with hospital characteristics. Because we are interested in the extent to which hospitals are coding strategically when they have the opportunity, we limit this analysis to just those discharges with nine or more secondary diagnosis codes. We further exclude from our remaining analyses the following HACs, for which the numbers are too small to draw any conclusions: foreign object retained after surgery, manifestations of poor glycemic control, air embolism, blood incompatibility, mediastinitis following CABG surgery, SSI following certain orthopedic procedures, and SSI following bariatric surgery. We also exclude State, local, and other government hospitals from the tables because of their small numbers.
Tables 4.3 to 4.7 display the ratio of the HAC8 rate to HAC rate for different HACs by State, year, and hospital characteristic. The last three rows of the table show the weighted mean of the ratios across the four States. In the tables, a ratio of 0.00 means that no HACs were coded in the first eight secondary diagnosis code fields. A ratio of “—” means that there were no HACs in any of the secondary diagnosis code fields, making the calculation of a ratio impossible. This could occur for two reasons: either no HACs were coded or there are no eligible discharges, as is the case for rural New Jersey hospitals. There are no rural hospitals in New Jersey and consequently no eligible discharges in this category.
Table 4.3 displays the ratio of the HAC8 rate to the HAC rate for hospital-acquired falls and trauma by State, year, and hospital characteristic. With the exception of California, the ratio of the HAC8 to HAC for AMCs is lower than for non-AMCs. In Arizona, the ratio at AMCs ranges from 0.56 to 0.60 and for non-AMCs from 0.60 to 0.76. In contrast, in California, the ratio ranges from 0.53 to 0.60 at AMCs, but from only 0.42 to 0.55 at non-AMCs. When hospitals are aggregated across States, the differences between AMCs and non-AMCs disappear. The aggregated numbers also show no difference in the HAC8-to-HAC ratios between hospitals

42
located in large urban areas compared with hospitals located in small urban or rural areas or between for profit and nonprofit hospitals.
Table 4.3 Hospital-acquired falls and trauma: Ratio of HAC8 rate to HAC rate, State, year, and
hospital characteristics
State Year
Academic medical center
Not an academic medical center
For profit hospital
Nonprofit hospital
Hospital in large urban
area
Hospital in a small
urban area Hospital in a rural area
Arizona 2008 0.56 0.76 0.67 0.78 0.74 0.79 0.76 Arizona 2009 0.57 0.60 0.56 0.62 0.59 0.57 0.76 Arizona 2010 0.60 0.73 0.69 0.74 0.72 0.68 0.89 California 2008 0.53 0.42 0.44 0.41 0.42 0.43 0.50 California 2009 0.58 0.54 0.51 0.55 0.53 0.60 0.51 California 2010 0.60 0.55 0.58 0.54 0.55 0.56 0.42 Florida 2008 0.53 0.71 0.68 0.70 0.70 0.71 0.67 Florida 2009 0.49 0.61 0.60 0.59 0.59 0.65 0.55 Florida 2010 0.51 0.68 0.70 0.65 0.65 0.71 0.66 New Jersey 2008 0.71 0.75 0.00 0.75 0.75 0.74 N/A New Jersey 2009 0.55 0.68 — 0.67 0.66 0.76 N/A New Jersey 2010 0.81 0.66 0.00 0.67 0.70 0.53 N/A Combined 2008 0.68 0.72 0.71 0.72 0.71 0.72 0.76 Combined 2009 0.66 0.69 0.67 0.69 0.67 0.73 0.67 Combined 2010 0.69 0.72 0.74 0.71 0.71 0.74 0.75
NOTES: “—” means that either there were no discharges or the HAC rate was zero so that division was not possible. New Jersey has no rural counties. HAC = hospital-acquired condition.
SOURCE: RTI analysis of 2008–2010 Healthcare Cost and Utilization Project State inpatient databases.
Table 4.4 displays the ratio of the HAC8 rate to the HAC rate for hospital-acquired stage III or IV pressure ulcer by State, year, and hospital characteristic. Table 4.4 does not show ratios for 2008 because the ICD-9-CM codes for staging pressure ulcers did not exist until FY 2009. Aggregating ratios across all States in the “combined” rows, AMCs have a lower ratio than non-AMCs. The HAC8 ratio for AMCs ranged from 0.35 to 0.40, whereas the ratio for non-AMCs ranged from 0.44 to 0.50. The combined rows also show a difference between for-profit and nonprofit hospitals. For-profit hospitals had lower ratios than nonprofit hospitals. In 2009, the ratio at for-profit hospitals was 0.39, but it was 0.46 at nonprofit hospitals. In 2010, the ratios at for-profit and nonprofit hospitals were 0.41 and 0.52, respectively. Table 4.4 also shows that, with the exception of AMCs, the ratio increased between 2009 and 2010 across all States and hospital characteristics. At AMCs, the ratio fell from 0.40 in 2009 to 0.35 in 2010.

43
Table 4.4 Hospital-acquired stage III or IV pressure ulcers: Ratio of HAC8 rate to HAC rate, State,
year, and hospital characteristics
State Year
Academic medical center
Not an academic medical center
For profit hospital
Nonprofit hospital
Hospital in large urban
area
Hospital in a small
urban area Hospital in a rural area
Arizona 2009 0.00 0.34 0.20 0.39 0.27 0.41 0.67 Arizona 2010 0.33 0.61 0.55 0.69 0.48 0.81 0.00 California 2009 0.47 0.44 0.43 0.44 0.43 0.50 0.00 California 2010 0.46 0.45 0.30 0.48 0.44 0.48 0.33 Florida 2009 0.25 0.36 0.33 0.35 0.27 0.48 0.32 Florida 2010 0.29 0.40 0.41 0.38 0.29 0.53 0.42 New Jersey 2009 0.67 0.58 0.75 0.58 0.58 0.73 N/A New Jersey 2010 0.20 0.65 1.00 0.63 0.61 0.65 N/A Combined 2009 0.40 0.44 0.39 0.46 0.44 0.50 0.33 Combined 2010 0.35 0.50 0.41 0.52 0.47 0.55 0.42
NOTES: “—” means that either there were no discharges or the HAC rate was zero so that division was not possible. New Jersey has no rural counties.
SOURCE: RTI analysis of 2008–2010 Healthcare Cost and Utilization Project State inpatient databases.
Table 4.5 displays the ratio of the HAC8 rate to the HAC rate for hospital-acquired CAUTI by State, year, and hospital characteristic. There is no observable pattern in the ratio of HAC8 to HAC rate for hospital-acquired CAUTI between AMCs and non-AMCs, for-profit and nonprofit hospitals, or hospitals in large urban areas compared with those in small urban or rural areas. However, comparing the HAC8-to-HAC ratios for 2008 and 2010, in aggregate, the ratios for CAUTI fell dramatically for all hospitals from 2008 to 2009 before increasing again (with the exception of AMCs) in 2010. The HAC8-to-HAC ratios in for-profit hospitals (and non-profit hospitals) fell from 2008 to 2009 from 0.72 to 0.48 (0.63 to 0.55), then increased from 2009 to 2010 from 0.48 to 0.69 (0.55 to 0.63).

44
Table 4.5 Hospital-acquired CAUTIs: Ratio of HAC8 rate to HAC rate, State, year, and hospital
characteristics
State Year
Academic medical center
Not an academic medical center
For profit hospital
Nonprofit hospital
Hospital in large urban
area
Hospital in a small
urban area Hospital in a rural area
Arizona 2008 0.80 0.76 0.79 0.75 0.74 0.80 0.75 Arizona 2009 0.40 0.54 0.50 0.55 0.47 0.66 0.67 Arizona 2010 1.00 0.66 0.65 0.66 0.54 0.93 0.70 California 2008 0.62 0.50 0.54 0.50 0.51 0.53 0.43 California 2009 0.58 0.51 0.38 0.53 0.52 0.49 0.69 California 2010 0.52 0.52 0.49 0.54 0.53 0.50 0.56 Florida 2008 0.72 0.73 0.77 0.72 0.71 0.75 0.72 Florida 2009 0.29 0.54 0.47 0.45 0.46 0.59 0.51 Florida 2010 0.36 0.71 0.78 0.67 0.66 0.69 0.80 New Jersey 2008 0.90 0.73 — 0.74 0.75 0.70 N/A New Jersey 2009 0.60 0.60 1.00 0.59 0.59 0.68 N/A New Jersey 2010 0.22 0.67 — 0.66 0.65 0.65 N/A Combined 2008 0.73 0.64 0.72 0.63 0.63 0.70 0.71 Combined 2009 0.51 0.56 0.48 0.55 0.54 0.59 0.58 Combined 2010 0.49 0.63 0.69 0.63 0.60 0.67 0.76
NOTES: “—” means that either there were no discharges or that the HAC rate was zero so that division was not possible. New Jersey has no rural counties. CAUTI = catheter-associated urinary tract infection; HAC = hospital-acquired condition.
SOURCE: RTI analysis of 2008–2010 Healthcare Cost and Utilization Project State inpatient databases.
Table 4.6 displays the ratio of the HAC8 rate to the HAC rate for vascular catheter-associated infection by State, year, and hospital characteristic. The HAC8-to-HAC ratios were quite similar across hospital characteristics in 2008. There is a general decline across all States and hospital characteristics, with a large decline from 2008 to 2009. Rates of decline in using the first eight fields were greater for AMCs and for-profit hospitals.

45
Table 4.6 Hospital-acquired vascular catheter-associated infections: Ratio of HAC8 rate to HAC
rate, by State, year, and hospital characteristics
State Year
Academic medical center
Not an academic medical center
For profit hospital
Nonprofit hospital
Hospital in large urban
area
Hospital in a small
urban area Hospital in a rural area
Arizona 2008 0.50 0.60 0.55 0.62 0.58 0.67 0.58 Arizona 2009 0.33 0.37 0.41 0.36 0.34 0.43 0.44 Arizona 2010 0.30 0.39 0.34 0.40 0.35 0.48 0.50 California 2008 0.55 0.51 0.53 0.51 0.52 0.50 0.54 California 2009 0.47 0.46 0.45 0.46 0.46 0.43 0.60 California 2010 0.50 0.49 0.42 0.48 0.50 0.46 0.43 Florida 2008 0.60 0.57 0.55 0.60 0.59 0.59 0.53 Florida 2009 0.20 0.31 0.27 0.31 0.29 0.33 0.24 Florida 2010 0.33 0.41 0.40 0.41 0.38 0.44 0.40 New Jersey 2008 0.63 0.64 1.00 0.64 0.63 0.68 N/A New Jersey 2009 0.22 0.50 0.83 0.45 0.44 0.57 N/A New Jersey 2010 0.30 0.52 0.31 0.49 0.48 0.47 N/A Combined 2008 0.61 0.58 0.56 0.59 0.58 0.59 0.56 Combined 2009 0.35 0.42 0.37 0.44 0.42 0.41 0.29 Combined 2010 0.42 0.48 0.41 0.48 0.47 0.48 0.41
NOTES: “—” means that either there were no discharges or the HAC rate was zero so that division was not possible. New Jersey has no rural counties.
SOURCE: RTI analysis of 2008–2010 Healthcare Cost and Utilization Project State inpatient databases.
Table 4.7 displays the ratio of the HAC8 rate to the HAC rate for hospital-acquired DVT/PE following certain orthopedic procedures by State, year, and hospital characteristic. There is no observable pattern in the ratio of the HAC8-to-HAC rate following certain orthopedic procedures in 2008 between AMCs and non-AMCs or for-profit and nonprofit hospitals. There is also no observable change in the ratio from 2008 to 2010.

46
Table 4.7 Hospital-acquired deep vein thrombosis or pulmonary embolism following certain
orthopedic procedures: Ratio of HAC8 rate to HAC rate, by State, year, and hospital characteristics
State Year
Academic medical center
Not an academic medical center
For profit hospital
Nonprofit hospital
Hospital in large urban
area
Hospital in a small
urban area Hospital in a rural area
Arizona 2008 1.00 0.95 1.00 0.96 0.98 1.00 0.60 Arizona 2009 1.00 0.87 0.88 0.86 0.80 1.00 0.83 Arizona 2010 — 0.95 0.94 0.95 0.94 0.95 1.00 California 2008 0.57 0.39 0.28 0.41 0.43 0.24 0.33 California 2009 0.27 0.46 0.37 0.44 0.44 0.33 0.75 California 2010 0.54 0.43 0.47 0.44 0.47 0.36 0.00 Florida 2008 1.00 0.95 0.97 0.94 0.94 0.95 0.94 Florida 2009 0.94 0.84 0.85 0.83 0.83 0.87 0.79 Florida 2010 0.93 0.91 0.93 0.88 0.91 0.92 0.88 New Jersey 2008 0.87 0.89 — 0.89 0.86 1.00 N/A New Jersey 2009 0.80 0.89 — 0.88 0.86 1.00 N/A New Jersey 2010 0.85 0.95 — 0.95 0.93 0.96 N/A Combined 2008 0.85 0.86 0.87 0.85 0.84 0.90 0.86 Combined 2009 0.72 0.84 0.85 0.82 0.81 0.89 0.87 Combined 2010 0.81 0.83 0.88 0.82 0.82 0.86 0.86
NOTES: “—” means that either there were no discharges or the HAC rate was zero so that division was not possible. New Jersey has no rural counties. HAC = hospital-acquired condition.
SOURCE: RTI analysis of 2008–2010 Healthcare Cost and Utilization Project State inpatient databases.
4.3 Conclusions and Discussion
We began our analysis of the unintended consequences of hospital coding practices by determining the correlation between the numbers of secondary diagnosis codes reported on the claim and reported HAC rates. We compared the HAC rates using all secondary diagnosis codes on the claim with the HAC rates calculated using just the first eight secondary diagnosis codes. We found that HACs are indeed coded past the eighth secondary diagnosis code field, suggesting that historical MedPAR rates understate the true incidence of HACs.
To ascertain the degree to which HAC rates may be understated, we then compared the HAC8-to-HAC ratio for all discharges with the ratio for discharges with nine or more secondary diagnosis codes on the claim. We found a higher percentage of missed HACs among discharges with more than eight secondary diagnoses; however, the degree varied by HAC. The share of missed HACs was similar for all discharges and discharges with nine or more diagnosis codes for stage III or IV pressure ulcer, vascular catheter-associated infection, and mediastinitis following CABG surgery, but there were large differences for other HACs, including falls and

47
trauma and DVT/PE following certain orthopedic procedures. This variation is being driven in part by the percentage of HACs recorded on discharges with fewer than nine secondary diagnosis codes that have a ratio of 1, so ceteris paribus, the larger their share of discharges reporting fewer than nine secondary codes, the larger the difference in the ratios will be.
We hypothesized that for-profit hospitals, to maximize revenues, may place HACs in the ninth or subsequent secondary diagnosis fields, lowering their ratios relative to nonprofit hospitals. Furthermore, we hypothesized that if for-profit hospitals are coding strategically, then their HAC8-to-HAC ratio should decline in 2009 and 2010 after implementation of the HAC-POA program. We also hypothesized that at an AMC with a very sick patient case mix, the more serious complications would be placed in the first eight secondary diagnosis fields, pushing the HAC to the ninth or subsequent fields. This would result in lower HAC8-to-HAC ratios at AMCs than at non-AMCs. This type of coding behavior should not be affected by the HAC-POA program; therefore, we hypothesized no changes in the HAC8-to-HAC ratio at AMCs in 2009 and 2010 after implementation of the HAC-POA program. Limiting our analysis to just those discharges with nine or more secondary diagnosis codes, we did not find any consistent pattern in coding across HACs. However, we did find large decreases across all hospitals in the ratios from 2008 to 2009 for hospital-acquired stage III or IV pressure ulcer, CAUTI, and vascular catheter-associated infection.
Beginning in January 2011, CMS began processing data for up to 25 diagnosis fields for all hospitals when submitted in the version 5010 format, which may increase reported rates for some HACs and will improve accuracy. For example, the reported rate for hospital-acquired stage III or IV pressure ulcer could more than double, and the rate for hospital-acquired falls and trauma could increase by 20 percent. The actual change may be more or less depending on hospital changes in quality in the interim. However, some HACs may still be missed to the extent that HACs do not manifest in the hospital or are coded POA on the admission, not coded at all, or coded in the 26th–30th secondary diagnosis fields.

48
This page intentionally left blank.
49
SECTION 5 SUMMARY AND CONCLUSIONS
This report explored the following research questions:
1. How much variation in the reporting of HACs is there across all payers?
2. Has the HAC-POA program reduced the overall reporting of HACs for all payers; in other words, is there a positive spillover to all payers?
3. Have hospitals failed to identify HACs by not recording the relevant conditions in the first eight secondary diagnosis codes?
4. How does the coding of secondary diagnosis codes and location of HACs among the secondary diagnosis codes vary by hospital characteristics such as for-profit status, teaching status, and location?
The first two questions ask whether any changes in hospital coding of HACs or reported quality changes have a spillover onto other payers. The last two questions quantify the downward bias of limiting HAC counts to the first eight secondary diagnosis code fields.
5.1 Findings From the Spillover Analysis
We did not find any consistent pattern in the reporting of the rates of HACs across 3 years or type of payer. Medicare had the highest rates of hospital-acquired falls and trauma, stage III and IV pressure ulcer, CAUTI, and vascular catheter-associated infection. Medicaid had the highest rates of hospital-acquired mediastinitis following CABG surgery and SSI following certain orthopedic procedures. It is not possible to draw any conclusions for air embolism, blood incompatibility, or SSI following bariatric surgery because they occurred too infrequently.
We saw a general decline in the HAC rate from 2008 through 2010 for several HACs: falls and trauma, vascular catheter-associated infection, DVT/PE following certain orthopedic procedures, and SSI following certain orthopedic procedures. However, in most cases, the rate actually increased in 2009 compared with 2008 before declining again in 2010. We found two different trends by State for stage III and IV pressure ulcer. From 2009 to 2010, rates fell in Arizona and California but increased in Florida and New Jersey. One explanation is that some hospitals were still learning how to code the stages of pressure ulcers.
We found no evidence that the HAC-POA program had any effect on the rate of CAUTI for the three payers: Medicare, Medicaid, and private insurance. We observed a decline in 2009 in the likelihood of experiencing a fall or trauma for all three payers, with an incrementally greater decline for privately insured patients, but no further decline in 2010 for any payer. This indicates a positive spillover effect to private insurance patients. We also observed a decline in 2009 in the likelihood of developing a DVT/PE following certain orthopedic procedures, with an incrementally greater decline in 2010, but no incremental difference across payers. Two interpretations are possible. One interpretation is that there was an overall secular trend in DVT/PE rates independent of the HAC-POA program. A second interpretation is that the HAC–

50
POA program has had a positive spillover effect on other payers (i.e., a “rising tide lifts all boats” phenomenon).
Combined, these results provide some limited evidence of positive spillover effects on other payers, primarily in the first year of the Medicare HAC-POA program, for two of the these three conditions. But we can also interpret the results to mean that the Medicare HAC-POA program had no impact on the three studied HACs. There was no decline in the rate of CAUTI, and the observed decline in the rates of falls and trauma and DVT/PE following certain orthopedic procedures across all payers could be a naturally occurring secular trend, as the benefit appeared to be greatest in hospitals with initially highest rates.
RTI’s all-payer analyses have two caveats. First, we can analyze only the reported rate of the HACs and not the actual incidence of HACs. The actual incidence of HACs may be higher than the reported rate for three reasons: the condition may not manifest while the patient is in the hospital, as can happen with SSIs; hospitals may not code the condition if it does not affect their payment; and the HAC may not be reported if the patient has more secondary diagnoses than are captured on the claim. In the next section, we explore the relationship between the number of secondary diagnoses on the claim, the number captured by Medicare, and the impact on reported rates of HACs. Second, we could not measure any changes in individual hospital quality over time with changes in the rates of the studied HACs.
5.2 Findings From the Analysis of Unintended Consequences of Hospital Coding Practices
We began our analysis of the unintended consequences of hospital coding practices by determining the correlation between the numbers of secondary diagnosis codes reported on the claim and reported HAC rates. Using State HCUP claims, we compared the HAC rates using all secondary diagnosis fields on the claim with HAC rates using just the first eight secondary diagnosis fields. For the 46,105 HACs reported in four States from 2008 to 2010 using all available diagnosis fields, only 62 percent were captured in the first eight fields; 38 percent of HACs were coded in the ninth or greater fields.
Across public and private payers, counting all secondary diagnosis codes had the greatest positive effect in raising HAC rates for Medicare and Medicaid beneficiaries. One possible explanation for this finding is that Medicare and Medicaid patients are more likely to have multiple comorbidities or complications due to greater severity of illness, which increases the likelihood that more than eight secondary diagnosis code fields are needed to code them all. Reporting more than eight diagnoses, in turn, provides more opportunity, intended or otherwise, to put HAC codes in the ninth or later fields. This observation prompted a more detailed study of the share of claims with more than eight secondary diagnoses by individual HAC.
To ascertain the degree to which HAC rates may be understated, we first calculated the share of all HACs appearing in the first eight secondary diagnosis code fields on the claim. In Figure 5.1, the type of HAC appears along the horizontal axis (all HACs = 1, foreign body retained after surgery = 2, falls and trauma = 3, etc.). Missed HACs using just eight codes

51
Figure 5.1 Effect of claims with nine or more secondary diagnoses on percentage of HACs missed
using only eight secondary diagnosis fields
0%
20%
40%
60%
80%
100%
120%
1 2 3 4 5 6 7 8 9 10 11 12 13
Hospital Acquired Conditions (see numeric crosswalk key)
% HACs on >9 fieldclaims
% HACs missed usingjust 8 fields
Numeric Crosswalk Key
HAC # Hospital-Acquired Condition (HAC)
1 All HACs 2 Foreign object retained after surgery 3 Falls and trauma 4 Manifestations of poor glycemic control 5 Air embolism 6 Blood incompatibility 7 Stage III and IV pressure ulcer 8 Catheter-associated urinary tract infection 9 Vascular catheter-associated infection 10 Deep vein thrombosis/pulmonary embolism following certain
orthopedic procedures 11 Surgical site infection (SSI)—Mediastinitis 12 SSI following certain orthopedic procedures 13 SSI following bariatric surgery
52
ranged from 13 percent for DVT/PE following certain orthopedic procedures (HAC #10) to 53 and 56 percent for Stage III and IV pressure ulcer (HAC #7) and mediastinitis following CABG (HAC #11), respectively. (HAC #13, SSI following bariatric surgery, is based on only one instance in 2009.) We found a consistent pattern for HACs in the first eight secondary diagnosis code fields and patients having nine or more secondary diagnosis code fields reported. The upper blue line reports the percentage of HACs that appear in any secondary diagnosis code field on claims with nine or more reported secondary diagnoses. The lower red line gives the percentage of HACs missed using just eight fields on any claim. When a HAC is reported, higher proportions of discharges with nine or more secondary diagnoses are positively associated with higher percentages of HACs missed using just eight fields. DVT/PE with certain orthopedic procedures (HAC #10) shows a strong negative spike. The fact that only 51 percent of HACs are reported on claims with nine or more secondary diagnoses produces a missed HAC rate of 13 percent using just eight codes. Conversely, HACs #7 and 11, Stage III and IV pressure ulcer and mediastinitis following CABG surgery, respectively, which have very high shares of claims with nine or more secondary codes, also have the highest percentage of HACs missed using the first eight diagnosis fields. Therefore, limiting HAC identification to just a few secondary diagnosis code fields can produce systematic downward bias in reported HACs, depending upon the extent of comorbidity associated with the HAC.
We next stratified HAC8 to total HAC ratios by hospital characteristics and over years. Because we were interested in the extent to which hospitals with the ability to code strategically are coding strategically, we limited our analysis to just those discharges with nine or more secondary diagnosis codes. We did not find any consistent pattern in coding across HACs. However, we did find large decreases across all hospitals in the ratios from 2008 to 2009 for hospital-acquired stage III or IV pressure ulcer, CAUTI, and vascular catheter-associated infection.
Beginning in January 2011, CMS began processing data for up to 25 diagnosis fields for all hospitals when submitted in the version 5010 format. This may increase reported rates for some HACs and will improve accuracy. For example, the reported rate for hospital-acquired stage III or IV pressure ulcer could more than double and the rate for hospital-acquired falls and trauma could increase by 20 percent. The actual change may be more or less depending on hospital changes in quality in the interim. However, some HACs may still be missed to the extent that HACs do not manifest in the hospital or are coded POA on another admission, not coded at all, or coded in the 26th–30th secondary diagnosis fields.

53
REFERENCES
Agency for Healthcare Research and Quality: Patient safety primers: Never events. Retrieved from http://www.psnet.ahrq.gov/primer.aspx?primerID=3, Sept. 7, 2010. Rockville, MD: AHRQ, n.d.
Bernard, S., Dalton, K., Sorenson, A., et al.: Interim Study to Support a CMS Report to Congress: Assess Feasibility of Extending the Healthcare-Acquired Conditions–Present on Admission IPPS Payment Policy to non-IPPS Payment Environments. CMS Contract No. HHSM-500-T00007. Research Triangle Park, NC: RTI International, draft April 2011.
Center for Medicaid and State Operations: Letter to state Medicaid directors (SMDL #08-004) [Medicaid-Medicare coordination of provider payment policies; hospital-acquired conditions (HAC’s); “never events.” Baltimore, MD: Centers for Medicare & Medicaid Services, July 31, 2008.
Centers for Medicare & Medicaid Services: Notice of proposed rulemaking. Medicaid Program: Payment adjustment for provider-preventable conditions including health care-acquired conditions. Federal Register 76(33):9283-9295, February 17, 2011.
Centers for Medicare & Medicaid Services: Final rule. Medicaid Program: Payment adjustment for provider-preventable conditions including health care-acquired conditions. Federal Register 76(108):32816-32838, June 6, 2011.
Coffey, R., Milenkovic, M., and Andrews, R. M.: The case for the present-on-admission (POA) indicator. HCUP Methods Series. No. 2006-01. Agency for Healthcare Research and Quality. Rockville, MD. June 26, 2006. Available from http://www.hcup-us.ahrq.gov/reports/methods.jsp
Healy, D., Cromwell, J., and Spain, P.: Examination of Spillover Effects and Unintended Consequences. CMS Contract No. HHSM-500-2005-00029I. Research Triangle Park, NC: RTI International, 2011.
Maeda, J. L., Parlato, J., Levit, K., et al.: Hospital-acquired conditions in selected community hospitals from 15 States, 2008. Healthcare Cost and Utilization Project. Statistical Brief No. 118. Agency for Healthcare Research and Quality, Rockville, MD. June 2011.
McNair, P. D., Luft, H. S., and Bindman, A. B.: Medicare’s policy not to pay for treating hospital-acquired conditions: The impact. Health Aff. (Millwood) 28(5):1485-1493, Sept./Oct. 2009.
National Conference of State Legislatures: Medicare nonpayment for medical errors. Available from http://www.ncsl.org/default.aspx?tabid=14747. Washington, DC: NCSL, updated August 3, 2009.
Saint, S., Meddings, J., Calfee, D., et al.: Catheter-associated urinary tract infection and the Medicare rule changes. Ann. Intern. Med. 150(12):877-884, 2009.

54
Sorenson, A., Tant, E., Lenfestey, N., et al.: Hospital Acquired Conditions–Present on Admission (HAC-POA) program environmental scan. CMS Contract No. HHSM-500-2005-00029I. Research Triangle Park, NC: RTI International, Sept. 2011.
University HealthSystem Consortium. Membership list. Retrieved from https://www.uhc.edu/docs/003675405_UHCMembershipList.pdf. Chicago, IL: UHC, June 2012.
West, N. D., Eng, T., Lyda-McDonald, B., et al.: Update on State government tracking of health care-acquired conditions. CMS Contract No. HHSM-500-2005-00029I. Research Triangle Park, NC: RTI International, June 2011.

55
APPENDIX A: TABLES OF THE NUMBER OF DISCHARGES WITH HOSPITAL-ACQUIRED
DIAGNOSIS
LIST OF TABLES IN APPENDIX A
Table A.1 Number of discharges with hospital-acquired foreign object retained after surgery, by primary payer, State, and year ............................................................. 56
Table A.2 Number of discharges with a hospital-acquired fall or trauma, by primary payer, State, and year ............................................................................................. 57
Table A.3 Number of discharges with hospital-acquired manifestations of poor glycemic control, by primary payer, State, and year .............................................. 58
Table A.4 Number of discharges with hospital-acquired air embolism following certain orthopedic procedures, by primary payer, State, and year ..................................... 59
Table A.5 Number of discharges with hospital-acquired blood incompatibility, by primary payer, State, and year ................................................................................ 60
Table A.6 Number of discharges with hospital-acquired stage III and IV pressure ulcers, by primary payer, State, and year ............................................................... 61
Table A.7 Number of discharges with a hospital-acquired catheter-associated urinary tract infection, by primary payer, State, and year .................................................. 62
Table A.8 Number of discharges with a hospital-acquired vascular catheter infection, by primary payer, State, and year ........................................................................... 63
Table A.9 Number of discharges with a hospital-acquired deep vein thrombosis/pulmonary embolism following certain orthopedic procedures, by primary payer, State, and year ........................................................................... 64
Table A.10 Number of discharges with a hospital-acquired mediastinitis following coronary artery bypass graft surgery, by primary payer, State, and year ............... 65
Table A.11 Number of discharges with a hospital-acquired surgical site infection following certain orthopedic procedures, by primary payer, State, and year ......... 66
Table A.12 Number of discharges with a hospital-acquired surgical site infection following bariatric surgery, by primary payer, State, and year .............................. 67

56
Table A.1 Number of discharges with hospital-acquired foreign object retained after surgery,
by primary payer, State, and year
State Year Medicare Medicaid Private
insurance Self-pay No
charge Other Arizona 2008 11 3 12 1 0 0 Arizona 2009 9 9 8 2 0 1 Arizona 2010 6 8 12 1 0 3 California 2008 42 26 56 2 — 11 California 2009 46 9 42 4 — 5 California 2010 39 21 40 2 — 7 Florida 2008 32 11 26 1 0 5 Florida 2009 25 10 16 3 1 2 Florida 2010 31 4 9 2 1 5 New Jersey 2008 9 1 12 2 0 1 New Jersey 2009 7 2 10 3 0 0 New Jersey 2010 8 0 14 1 0 0
SOURCE: RTI analysis of 2008–2010 Healthcare Cost and Utilization Project State inpatient databases.

57
Table A.2 Number of discharges with a hospital-acquired fall or trauma, by primary payer, State,
and year
State Year Medicare Medicaid Private
insurance Self-pay No
charge Other Arizona 2008 252 34 87 6 0 26 Arizona 2009 230 37 58 3 0 8 Arizona 2010 217 38 55 2 2 9 California 2008 1,413 287 513 54 — 128 California 2009 1,003 210 294 34 — 49 California 2010 795 144 236 32 — 43 Florida 2008 1,118 122 211 35 20 35 Florida 2009 1,065 101 204 32 22 28 Florida 2010 856 98 167 48 9 34 New Jersey 2008 487 33 287 80 0 29 New Jersey 2009 305 18 101 21 0 4 New Jersey 2010 313 23 89 25 0 8
SOURCE: RTI analysis of 2008–2010 Healthcare Cost and Utilization Project State inpatient databases.

58
Table A.3 Number of discharges with hospital-acquired manifestations of poor glycemic control, by
primary payer, State, and year
State Year Medicare Medicaid Private
insurance Self-pay No
charge Other Arizona 2008 17 13 5 0 0 2 Arizona 2009 5 7 3 0 0 3 Arizona 2010 7 7 4 0 0 0 California 2008 108 75 88 23 — 23 California 2009 55 41 40 3 — 8 California 2010 43 24 31 7 — 6 Florida 2008 79 21 34 9 3 3 Florida 2009 59 14 26 5 0 3 Florida 2010 44 12 28 4 1 5 New Jersey 2008 33 3 30 8 0 2 New Jersey 2009 20 3 11 6 0 0 New Jersey 2010 18 8 17 2 0 1
SOURCE: RTI analysis of 2008–2010 Healthcare Cost and Utilization Project State inpatient databases.

59
Table A.4 Number of discharges with hospital-acquired air embolism following certain orthopedic
procedures, by primary payer, State, and year
State Year Medicare Medicaid Private
insurance Self-pay No
charge Other Arizona 2008 1 0 0 0 0 0 Arizona 2009 2 2 2 0 0 0 Arizona 2010 1 0 0 0 0 0 California 2008 8 2 6 0 — 1 California 2009 9 1 5 0 — 3 California 2010 7 1 4 0 — 1 Florida 2008 4 1 2 1 0 0 Florida 2009 2 1 1 0 1 0 Florida 2010 1 1 1 0 0 0 New Jersey 2008 0 0 0 1 0 0 New Jersey 2009 1 0 0 0 0 0 New Jersey 2010 1 0 0 0 0 0
SOURCE: RTI analysis of 2008–2010 Healthcare Cost and Utilization Project State inpatient databases.

60
Table A.5 Number of discharges with hospital-acquired blood incompatibility, by primary payer,
State, and year
State Year Medicare Medicaid Private
insurance Self-pay No
charge Other Arizona 2008 0 0 0 0 0 0 Arizona 2009 0 0 0 0 0 0 Arizona 2010 0 1 1 0 0 0 California 2008 2 2 0 0 — 0 California 2009 1 0 1 0 — 0 California 2010 1 0 0 0 — 0 Florida 2008 2 3 2 0 0 0 Florida 2009 1 3 2 1 0 0 Florida 2010 0 4 2 0 0 0 New Jersey 2008 2 0 1 0 0 0 New Jersey 2009 0 0 0 0 0 0 New Jersey 2010 1 0 1 0 0 0
SOURCE: RTI analysis of 2008–2010 Healthcare Cost and Utilization Project State inpatient databases.

61
Table A.6 Number of discharges with hospital-acquired stage III and IV pressure ulcers, by primary
payer, State, and year
State Year Medicare Medicaid Private
insurance Self-pay No
charge Other Arizona 2008 6 1 2 0 0 2 Arizona 2009 35 11 9 1 1 10 Arizona 2010 33 5 9 0 0 5 California 2008 101 46 26 5 — 5 California 2009 351 160 75 5 — 13 California 2010 216 100 63 9 — 10 Florida 2008 89 14 8 4 2 4 Florida 2009 298 70 67 15 7 8 Florida 2010 190 75 45 3 1 10 New Jersey 2008 64 11 19 10 0 0 New Jersey 2009 133 17 34 3 0 1 New Jersey 2010 136 19 33 14 0 3
SOURCE: RTI analysis of 2008–2010 Healthcare Cost and Utilization Project State inpatient databases.

62
Table A.7 Number of discharges with a hospital-acquired catheter-associated urinary tract infection,
by primary payer, State, and year
State Year Medicare Medicaid Private
insurance Self-pay No
charge Other Arizona 2008 136 20 41 2 1 4 Arizona 2009 123 22 26 1 2 10 Arizona 2010 138 16 36 3 1 7 California 2008 668 111 196 10 — 32 California 2009 727 128 186 23 — 28 California 2010 661 101 154 16 — 17 Florida 2008 488 29 84 14 8 16 Florida 2009 547 48 101 12 2 9 Florida 2010 450 69 69 12 6 13 New Jersey 2008 154 7 45 6 0 2 New Jersey 2009 164 6 35 8 0 3 New Jersey 2010 154 4 45 10 0 1
SOURCE: RTI analysis of 2008–2010 Healthcare Cost and Utilization Project State inpatient databases.

63
Table A.8 Number of discharges with a hospital-acquired vascular catheter infection, by primary
payer, State, and year
State Year Medicare Medicaid Private
insurance Self-pay No
charge Other Arizona 2008 281 99 149 7 1 30 Arizona 2009 220 91 134 7 3 15 Arizona 2010 188 89 97 5 2 24 California 2008 1459 605 735 73 — 133 California 2009 1288 590 633 72 — 117 California 2010 848 363 417 35 — 71 Florida 2008 1579 381 622 105 68 95 Florida 2009 1444 430 535 91 44 52 Florida 2010 905 333 329 66 24 55 New Jersey 2008 447 62 224 52 0 9 New Jersey 2009 471 68 254 38 0 7 New Jersey 2010 478 69 246 53 0 6
SOURCE: RTI analysis of 2008–2010 Healthcare Cost and Utilization Project State inpatient databases.

64
Table A.9 Number of discharges with a hospital-acquired deep vein thrombosis/pulmonary embolism
following certain orthopedic procedures, by primary payer, State, and year
State Year Medicare Medicaid Private
insurance Self-pay No
charge Other Arizona 2008 59 2 22 0 0 7 Arizona 2009 71 9 17 0 0 12 Arizona 2010 82 3 7 2 0 6 California 2008 267 19 118 1 — 12 California 2009 275 15 107 2 — 9 California 2010 273 17 89 1 — 9 Florida 2008 316 10 71 3 2 12 Florida 2009 287 4 85 5 0 9 Florida 2010 280 9 76 3 3 18 New Jersey 2008 169 3 89 3 0 3 New Jersey 2009 128 2 77 6 0 2 New Jersey 2010 108 3 65 3 0 4
SOURCE: RTI analysis of 2008–2010 Healthcare Cost and Utilization Project State inpatient databases.
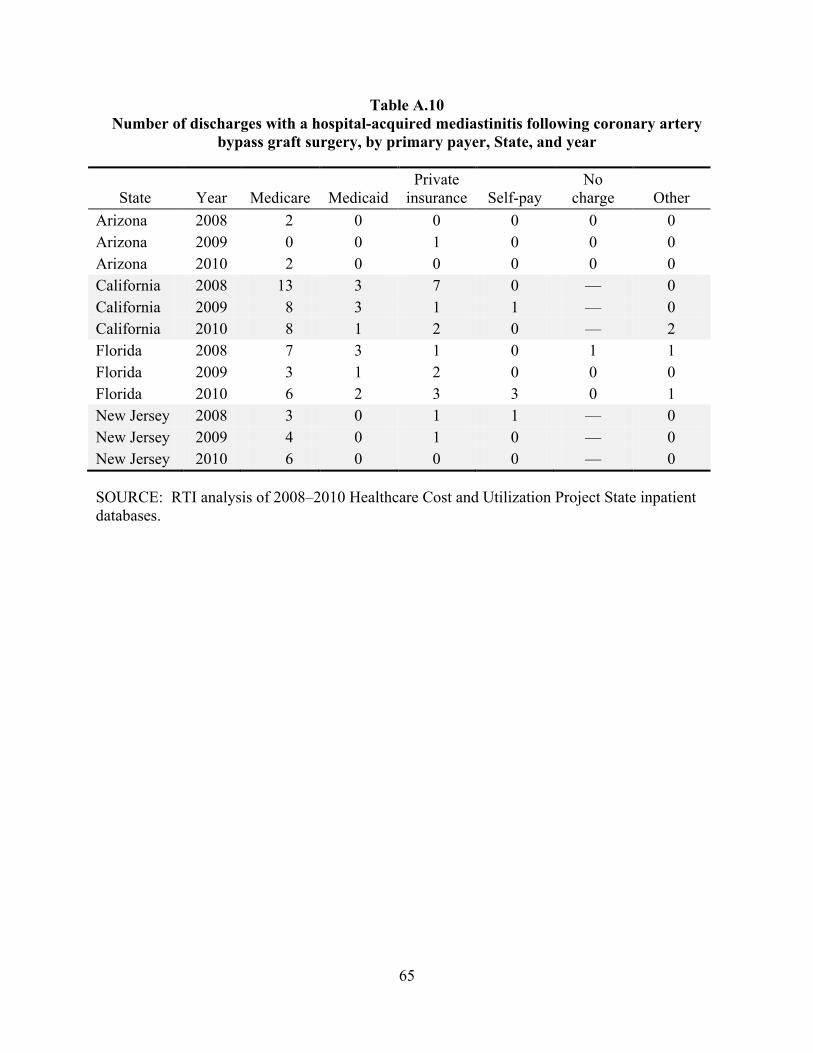
65
Table A.10 Number of discharges with a hospital-acquired mediastinitis following coronary artery
bypass graft surgery, by primary payer, State, and year
State Year Medicare Medicaid Private
insurance Self-pay No
charge Other Arizona 2008 2 0 0 0 0 0 Arizona 2009 0 0 1 0 0 0 Arizona 2010 2 0 0 0 0 0 California 2008 13 3 7 0 — 0 California 2009 8 3 1 1 — 0 California 2010 8 1 2 0 — 2 Florida 2008 7 3 1 0 1 1 Florida 2009 3 1 2 0 0 0 Florida 2010 6 2 3 3 0 1 New Jersey 2008 3 0 1 1 — 0 New Jersey 2009 4 0 1 0 — 0 New Jersey 2010 6 0 0 0 — 0
SOURCE: RTI analysis of 2008–2010 Healthcare Cost and Utilization Project State inpatient databases.

66
Table A.11 Number of discharges with a hospital-acquired surgical site infection following certain
orthopedic procedures, by primary payer, State, and year
State Year Medicare Medicaid Private
insurance Self-pay No
charge Other Arizona 2008 10 6 8 0 0 4 Arizona 2009 4 7 4 0 0 1 Arizona 2010 11 2 9 0 0 0 California 2008 70 24 37 3 — 36 California 2009 79 16 44 4 — 27 California 2010 48 21 36 1 — 16 Florida 2008 35 8 25 5 2 12 Florida 2009 43 6 20 0 0 9 Florida 2010 28 5 17 0 0 5 New Jersey 2008 6 1 14 3 0 2 New Jersey 2009 9 1 13 1 0 2 New Jersey 2010 9 0 14 2 0 2
SOURCE: RTI analysis of 2008–2010 Healthcare Cost and Utilization Project State inpatient databases.

67
Table A.12 Number of discharges with a hospital-acquired surgical site infection following bariatric
surgery, by primary payer, State, and year
State Year Medicare Medicaid Private
insurance Self-pay No
charge Other Arizona 2008 0 0 0 0 0 0 Arizona 2009 0 0 0 0 0 0 Arizona 2010 0 0 0 0 0 0 California 2008 0 0 0 0 0 0 California 2009 1 0 0 0 0 1 California 2010 0 0 0 0 0 0 Florida 2008 0 0 0 0 0 0 Florida 2009 0 0 0 0 0 0 Florida 2010 0 0 0 0 0 0 New Jersey 2008 0 0 0 0 0 0 New Jersey 2009 0 0 0 0 0 0 New Jersey 2010 0 0 0 0 0 0
SOURCE: RTI analysis of 2008–2010 Healthcare Cost and Utilization Project State inpatient databases.
![Hospital Acquired Infections, Sources, Route of …...hospital acquired infections worldwide is Enterococci [17]. Three to seven percent of hospital-acquired bacterial infections are](https://img.dokumen.tips/doc/110x75/5e8d2da3c3edfd174827a4ae/hospital-acquired-infections-sources-route-of-hospital-acquired-infections.jpg)