Embed Size (px)
Citation preview
Horticulture Risk Survey
Dr Andrew Hewitt
The University of Queensland
Project Number: AH11033
AH11033
This report is published by Horticulture Australia Ltd to pass on information concerning horticultural research and development undertaken for the accross industry projects.
The research contained in this report was funded by Horticulture Australia Ltd with the financial support of the accross industry projects.
All expressions of opinion are not to be regarded as expressing the opinion of Horticulture Australia Ltd or any authority of the Australian Government. The Company and the Australian Government accept no responsibility for any of the opinions or the accuracy of the information contained in this report and readers should rely upon their own enquiries in making decisions concerning their own interests.
ISBN 0 7341 3298 0 Published and distributed by: Horticulture Australia Ltd Level 7 179 Elizabeth Street Sydney NSW 2000 Telephone: (02) 8295 2300 Fax: (02) 8295 2399 © Copyright 2014

HAL Project AH11033 (11th October, 2012)
Horticulture Risk Survey
Final Report
Hewitt, Andrew et al.
The University of Queensland

HAL Project AH11033. 11 October 2012 Project Leader: Hewitt, Andrew: School of Agriculture and Food Sciences, The University of Queensland, Gatton, Qld, 4343, Australia. Email: [email protected] Key Personnel: O’ Donnell, Chris: School of Agriculture and Food Sciences, The University of Queensland, Gatton, Qld, 4343, Australia. Email: [email protected]
Furness, Geoffrey: Loxton, South Australia. Email: [email protected] Ledebuhr, Mark: Application Insight, Lansing, Michigan, USA. Email: [email protected]
The purpose of this study was to conduct an audit and assessment of current best practice in horticulture spray use management and a desktop risk assessment of chemical spray drift risks in horticulture through: 1) An assessment of the current and best practice in horticulture pesticide application and management across a representative range of horticultural crops and locations; and 2) A risk assessment of chemical spray drift risks in a similarly representative sample of horticulture. This project has been funded by HAL as part of the across industry program. The Australian Government provides matched funds for all HAL’s research and development activities. Any recommendations contained in this publication do not necessarily represent current HAL Limited Policy. No person should act on the basis of the contents of this publication, whether as to matters of fact or opinion or other content, without first obtaining specific, independent professional advice in respect of the matters set out in this publication.

1
CONTENTS
Media summary ..................................................................................................................... 2
Technical summary ................................................................................................................ 3
Introduction ............................................................................................................................ 6
Materials and methods ........................................................................................................... 7
Risk Assessment of Chemical Spray Drift Risks in Horticulture .............................. 7
Audit and assessment of current and best practice in horticulture spray use ............. 7
Results .................................................................................................................................. 11
Spray Drift Incident Reporting ................................................................................ 11
Federal, State and Territory Trends ......................................................................... 11
Surveys of Grower Groups, Registrants and Other Industry Representatives ......... 25
Tall Crops................................................................................................................. 25
Sensitive Areas......................................................................................................... 26
Drift Reduction Technologies .................................................................................. 27
Dose Adjustment for the Canopy and Distance Calibration .................................... 28
Stewardship and Quality Assurance Programs ........................................................ 28
Accreditation and Training ...................................................................................... 28
Internet/Telephone Survey ....................................................................................... 31
Discussion ............................................................................................................................ 55
Current and Best Practice in Horticulture in Australia ............................................ 55
Risk Assessment of Spray Drift ............................................................................... 56
Wind Speed Limits .................................................................................................. 56
Droplet Size and Adjuvants ..................................................................................... 56
Spray Direction ........................................................................................................ 56
Barrier Vegetation .................................................................................................... 57
Spray Release Height ............................................................................................... 57
Neighbour Notification Prior to Spraying................................................................ 58
Recommendations ................................................................................................................ 58
Acknowledgements .............................................................................................................. 60
Bibliography ........................................................................................................................ 60
Appendices ........................................................................................................................... 61
2
Media summary Horticulture Australia Ltd commissioned a project to ascertain the status in 2012 of spray drift issues as they relate to its diverse crops. This project involved Dr Hewitt and other staff from The University of Queensland surveying attitudes, training and incidents relating to real or perceived spray drift as well as associated training, risk assessment and drift management. The significance of this for the industry is that it helps set a baseline for spraying in 2012 against which future activities related to spray application technology and drift management can be compared. It also puts spray drift into perspective by different factors such as crop type, region, local conditions and spraying practices. It helps define issues that could improve training and helps assess whether risk assessment modeling is appropriate. The survey and audit involved several hundred participants from all major stakeholder groups from government and industry with the following main findings by stakeholder group. At the federal government level, only a dozen or less annual spray drift incidents in horticulture were documented and risk assessment involved a strong reliance on spray drift exposure modeling using overseas data and models which are not applicable to most current horticultural spraying in Australia. At the state level, up to 25 reported incidents per year per state were horticulture linked with approximately 25% being for complaints of human health and 25% for crop damage complaints (often damage to horticultural crops from herbicide applications to other crops), and 75% of those from ground application systems. However, very few were found to be substantive and the proportion of spray events generating spray drift damage was less than 0.01%. A key issue that needs to be addressed in many areas is land use planning because urban encroachment into rural areas can have impacts on spraying activities, even if only through perceived risk of chemical exposure and complaints of nuisance from noise and machinery. Spray drift can usually be managed through education/ training, technologies and appropriate regulations. Education and training courses can benefit from up-to-date information on spray application techniques and drift management strategies. Some new technologies and adjuvants may be suited to Australian applications if verified. The currently-used risk assessment tools comprising the AgDRIFT spray drift model and its deposition curves are not considered appropriate to Australian horticulture because the data underlying the model are from spraying systems used in the USA over two decades ago. The project also revealed inconsistencies in the reporting of spray drift. It is recommended that education, technology evaluation and modeling issues be addressed by a consortium of stakeholders because many groups are involved and affected by such activities. The National Working Party on Pesticide Application provides one possible framework for addressing these issues in the future. The survey involved numerous industry participants so a logical application of the project findings for industry is in helping inform them of the current practices and best practices for spraying in horticulture. This was largely their survey and we acknowledge their time and input to this process.
3
Technical summary An evaluation and audit of spray drift in horticulture was conducted for HAL. This included a survey across horticulture sectors, and a review of risk assessment and drift reduction technologies in the context of current and best management practices in the industry. The survey was conducted throughout Australia through face-to-face meetings with stakeholders such as grower groups, federal and state government regulators, peak industry bodies and phone and internet interviews with applicators and growers. Given the sensitive nature of the subject of spray drift and the need to protect confidentiality of those involved in this audit and risk assessment, names of participants are not given. It is difficult to assess whether spray drift concerns are “real” or perceived. The most useful information in this regard came from South Australia (SA) because drift complaints are fully investigated to determine the probable cause. This provided excellent information on a trend of a decrease in drift incidents following improvements to training and education. Of the investigated drift incidents, one third represented high risk to health or trade. At the national level, training was recognized as a key to avoiding spray drift incidents because it equips applicators with the information they need to make informed decisions on safe application techniques and timing. However, solid statistics showing correlations between training and drift incidents are not available at the national level. The results of the project showed the following trends. More than 92% of survey respondents use plant protection chemicals and these are applied multiple times per year. Flat fan nozzles are still the most common type of nozzle used on boom sprayers to apply herbicides though more recently there has been a shift to newer technology “air-inclusion” type nozzles. Driving speeds and application volume rates are generally within recommended limits. Nearly all respondents (owners and farm employees) had current accreditation with Chemcert or SMARTtrain. Most respondents managed their pesticide applications with awareness and therefore attention to avoiding spray drift. More respondents were aware of surface temperature inversions than the Delta-T concept. In the opinion of the authors of this report, this is a positive point because the impact of local surface temperature inversions on spray dispersion and therefore more highly concentrated drift potential is usually greater than the impact of evaporation (as affected by Delta-T) for ground sprays in horticulture because the water volume rates are usually high enough to reduce evaporation. About 17% of respondents said they had received complaints about drift damage but only two cases were investigated by authorities and no action was taken against any party. Just under half of the survey respondents said they notify their neighbours in advance of spray applications. Among discussions and meetings with grower groups, it was evident that tall tree crops were more challenging to spray than lower height crops and vineyards and therefore presented common concerns about spray drift exposure to sensitive areas. Proximity to sensitive areas was a major problem with urban encroachment into rural areas being of major concern for human complaints of spray drift exposure and noise from agriculture. The introduction of no-spray buffer zones from farmland was not an option that was economically viable in almost all cases. However, barrier vegetation such as hedges was of great benefit and interest for drift exposure reduction, especially where such barriers already had value in protecting the crop from exposure to damaging winds. Land use

4
planning is important in many areas and will undoubtedly become more important as populations grow. It is difficult to obtain complete information on drift for specific chemicals or their usage across Australia because there is no centralized location or consistent reporting of this information in all areas. While SA had extensive information at the state level, detailed information at the state and federal level in many other areas was lacking. We sought such information across Australia from government, industry, pesticide companies and applicators but did not obtain sufficient information except from the SA and VIC governments. At the federal government level, only a dozen or less annual spray drift incidents in horticulture were documented and risk assessment involved a strong reliance on spray drift exposure modeling using overseas data and models which are not applicable to most current horticultural spraying in Australia. At the state level, up to 25 reported incidents per year per state were linked with horticulture with approximately 25% being for complaints of human health and 25% for crop damage complaints, and 75% of them from ground application systems. However, very few were found to be substantive and the proportion of spray events generating spray drift damage was less than 0.01%. Training courses were not attended regularly by all applicators (and there was a trend of rapid decline in attendance with the end of some training subsidies, e.g. as reported in Western Australia) and did not include sufficiently up-to-date and comprehensive information on spray drift management in horticulture. Therefore, an investment in understanding how to improve training would be an excellent move for the industry because the management of spray drift at the time of application is the responsibility of the applicator. Without full resources, tools and accurate, current information, applicators cannot always make the best decisions on spraying pesticides. There is a need for more information on distance-based spraying calibration and point of first run off spray volumes based on canopy wall area compared to current expressions of application rates and spray volumes based on ground area. Spray volumes based on canopy volume have been used in a few areas, but current thinking is that this should also be phased out. This should be included in updated training courses. Best application practices in Australian horticulture are reasonably good but not optimal in many cases. Industry groups such as grower organizations and equipment/ chemical manufacturers offered excellent stewardship practices such as training materials, traceability, calibration programs and other unified benefits for their members. Many applicators are calibrating for the local environment and aware of important factors in their spray applications. However, there are large opportunities for important drift reduction technologies to be introduced in many crops such as electronic eyes and other sensors for helping reduce pesticide wastage and total environmental load of chemical when the foliage is absent or less dense. Targeted air sprayers, air towers, recapture/ recycle sprayers, optimized nozzle and adjuvant systems, shielded and hooded sprayers and other DRTs can offer large reductions in drift potential and chemical use rates for a wide variety of application scenarios and crops and should be tested independently to provide data for Australian uses. Data are already available for some of these such as electronic eyes and hooded sprayers but appropriate data and information for many others are lacking. There is a cost for growers to use new equipment. The cost needs to be justified by benefits. For chemical savings alone, the payback would occur within a few years for most applicators.

5
One of the main objectives of the audit was to understand what spray drift risks exist, where these risks are in horticulture, and what other risks related to chemical use might exist in horticulture. A summary response to this is as follows. The spray drift risks that exist in horticulture are exposure risks to nearby sensitive areas of crops (usually only for herbicide sprays), humans and water (usually insecticide and fungicide sprays) when fine sprays are used with great release heights (e.g. tall tree crops) under conditions of wind speed in excess of 20 km/h or local surface temperature inversions. Other risks from chemical use include operator exposure safety. Based on this project, it is proposed that drift risk management in horticulture be addressed through three avenues: 1) proposal of flexible, applicable and therefore better regulations, through new drift modeling, than the decades-old AgDRIFT model, 2) validation of technologies that improve spray targeting which has been and is largely being done under other projects and 3) updating training and extension to reflect 1) and 2). The above will address drift management. A third recommendation focuses on supporting risk reduction success analysis through the establishment and/or investigation of a coordinated national method of gathering chemical use and complaint information/incidents.

6
Introduction
In March, 2010, the Australian Pesticides and Veterinary Medicines Authority (APVMA) introduced new regulations on spray drift risk assessment and risk mitigation, resulting in minimum downwind buffer zone requirements being implemented for ground based and aerial spray applications to protect the public, sensitive terrestrial and aquatic areas, and trade. In response to the impact of this regulation the National Working Party for Pesticide Regulation (NWPPA) was formed, which includes members from horticulture, broad acre industries, and CropLife members. Horticulture is represented on the NWPPA by two industry members and one HAL representative.
The NWPPA commissioned Nicholas Woods from Plant Health Australia (PHA) to provide an independent report regarding the spray drift risk assessment of pesticides, and within the report key objectives and areas of strategic investment were identified. The NWPPA then organised an industry forum in April 2011 to update the agricultural sectors on the progress of the Working Party, and industry responded by tasking the NWPPA with:
1. Providing a forum to assist growers and other stakeholders understand current APVMA policy and working with the Regulators to provide realistic and practical risk management;
2. Seeking and facilitating investment from stakeholders and affected parties in support of a national coordinated program that supports the use of practical downwind buffers;
3. Facilitating targeted research that supports the use of practical downwind buffers;
4. Supporting and facilitating the development of a national training framework for pesticide application that would, for example, support the implementation of Drift Reduction Technologies (DRTs), lower no-spray buffer distances, best management practice and improved product efficacy.
In order to meet its objectives, the NWPPA has endorsed four areas of investment considered critical to gather data and scientific evidence to mount a case for the agricultural industries to respond to the APVMA spray drift policy and aim to reduce the need for large mandatory downwind buffer zones. The four projects are outlined below:
1. Develop a database (accommodating nozzles, formulations, adjuvants and air assistance technologies) that will support the use of Drift Reduction Technologies (DRTs) for the application of pesticides using boom sprayers. Develop wind tunnel deposition curves (measurement of vertical and horizontal flux) that can be used to establish spray quality boundaries and assess the effectiveness of DRTs.
2. Assess current international responses (both regulation and research) to the management of pesticide spray drift.
3. Conduct an audit and assessment of current best practice in horticulture spray use
management, and desktop risk assessment of chemical spray drift risks in horticulture
(the audit will be a precursor to a limited field trial program).
4. Conduct a strategic assessment of current and potential revised national training framework(s) for pesticide application that would support the implementation of DRTs (to lower buffer distances), best management practice and improved product efficacy.
This project aims to meet Objective 3 above.
7
Materials and Methods
Risk assessment of chemical spray drift risks in horticulture
A risk assessment was conducted in conjunction with the audit and the objective of this risk assessment was to gain a greater understanding of spray application issues in horticulture.
This audit was undertaken to understand what spray drift risks exist, where these risks are in horticulture, and what other risks related to chemical use might exist in horticulture. The audit aimed to quantify the risk reduction from the adoption of best practices, appropriate DRTs and other measures and the potential if applied as part of some coordinated program.
The audit was conducted through communication with national and state agencies to obtain data on all spray drift complaints and develop a matrix by complaint / industry / action to build a full and complete profile of the issues and scale in horticulture. Other sources of information that informed the matrix database included chemical resellers, crop damage assessors, EPA, and departments of Environment and Heritage. Information was sought for the last 1-3 years, along with 10 years from states to assess longer term trends in spray related complaints.
Key Objectives of the Risk Assessment were:
1. To assess the scientific or technical risk through a holistic assessment of the chemical type, the volume and frequency of use, the application practices, the level of drift and the level of exposure (population and/or sensitive area proximity).
2. To assess the level of formal complaint through APVMA, EPA and other appropriate regulators.
3. To determine the level of community concern or perception of risk, and define the major factors driving this.
4. To determine the actual and potential risk minimization to be achieved by moving from current to best practice and other DRTs.
Audit and assessment of current best practice in horticulture spray use
Horticulture and viticulture use a wide range of spray technologies. This project undertook a cross industry audit to document current practices and production systems. From this survey, current Best Management Practice (BMP) was identified together with the DRT’s used that can enable the reduction of downwind buffers.
Many horticulture industries have developed and implemented BMP which include the best practice for pesticide application. We studied information from industry manuals to determine where gaps in information lie across horticulture.
Key Objectives of the Audit were as follows:
1. What is being applied across a representative range of horticulture;
2. How is it being applied, for both common purpose (typical or average) and best practice; and
3. What information exists on the amount and extent of drift from common and best practices.
We worked with groups who have statistics on spray drift incidents from horticultural spraying in Australia over recent years, including federal and state regulatory agencies, the insurance industry, crop damage assessors and chemical distributors. We also searched for

8
documented cases of legal incidents. We assessed the current level of drift complaints (government records, neighbor complaint levels from state agency records), scientific support for claims of drift exposure, and context as to the complaint areas in terms of the urban-rural interface, farm type, crop and size and any regional trends. We examined the trends between crop type, sprayer type, chemical type and alleged damage cases from spray drift exposure. (Note that while all reasonable attempts were made to obtain data from government and industry sources, the legal implications of spray drift meant that many groups would not provide data and therefore the methodology was in good faith but we could not force anyone to answer surveys against their will). The second activity was a review of current manuals and best management practice resources as well as training certification program course content to accompany the survey and questionnaire resources for establishing the baseline document on spraying systems and drift reduction practices. The third activity was examination of the current range of practices for spray application across all horticultural sectors. We visited key horticulture industries, spray applicator (commercial and independent farmer) and production groups to determine the current range of practices (including pesticides and spray volumes used). The initial action was the development of a questionnaire for use as part of the activity. We documented application practice frequencies among sprayer and spraying technique types – axial fan air blast sprayer, tower sprayer, converging airstream designs, electrostatic and other specialist spraying systems, ground rig horizontal boom sprayer, aircraft, including nozzle type and use as well as the proportion of the total use that each type represented. We determined the training level for each application group (farmer, grower, commercial applicator) – by course name (e.g. CHEMCERT, Smart Train, etc), frequency of training updates, attendance at extension events, and other qualifications. The survey also looked at current use levels and understanding of the effects of adjuvants and DRTs on spray drift and spray performance. We asked about calibration and frequency of nozzle replacement. The methodology that was adopted in the conduct of this project followed that of the HAL format, as described in the tender:
“Task 1 – Provide scope and methodology of the project to HAL – Prior to the start of the audit and risk assessment the project team will provide HAL with the scope and methodology of the study. This will require sign off from HAL before the study proceeds.
Task 2 – Design and conduct the audit and risk assessment – the consultant(s) will be responsible for the generation of the audit and risk assessment to benchmark spray practices and spray drift risk on-farm. The audits will cover a sufficiently representative sample of horticulture to allow HAL and its members to make reasonable conclusions for all of horticulture.
Task 3 – Conduct audits across all appropriate organizations– these audits will require engagement with Peak Industry Bodies, HAL, regulators at federal, state and local
9
government and a range of organizations who service & support the horticulture industries and regulate agriculture.
Task 4 – Generation of audit results and analysis – Results of the audits must be collated into a dataset that information can be easily extracted from. These results must be presented in the most appropriate format.
Task 5 - Preparation of a project final report - the final report will need to be submitted to HAL. The final report should detail the method, activities, outputs, recommendations, and final reconciliation of the project”.
Dr Andrew Hewitt was joined by two other experts in Australian spray technologies with extensive industry contacts for helping with the audit component of this project: Dr Chris O’Donnell and Mr. Geoffrey Furness.
Assessment of Chemical Spray Drift Risks in Horticulture
This risk assessment was conducted in conjunction with the audit, in order to gain a greater understanding of the major issues for horticulture.
The current APVMA spray drift policy and regulation indicates that current spray application management in agriculture poses a risk to off target organisms, however the level of risk, in particular in horticulture, has not been quantified. This audit was undertaken to understand what spray drift risks exist, where these risks are in horticulture, and what other risks related to chemical use might exist in horticulture. It also aimed to assess the risk reduction from the adoption of best practices, appropriate DRTs and other measures and the potential if applied as part of some coordinated program.
We communicated with national and state agencies to obtain data on all spray drift complaints to develop a matrix by complaint / industry / action to build a full and complete profile of the issues and scale in horticulture. Information was sought for the last 1-3 years.
Audit and assessment of current, common and best practice in horticulture spray use
management
Horticulture and viticulture use a wide range of spray technologies; therefore this project undertook a cross industry audit to document current practices and production systems. From this survey, current Best Management Practice (BMP) was identified together with the drift reduction approaches used that will enable the reduction of the size of no-spray buffers.
Many horticulture industries have developed and implemented BMPs which include the best practice for pesticide application. We looked at information from industry manuals to see where gaps in information lie across horticulture. These were the 2012 manuals for the following courses:
ACDC. AHCCHM303A – Prepare and Apply Chemicals. www.greeningaustralia.org.au/our-services/education-and-training/education-and-training-in-queensland/agricultural-chemical-distributions-control-acdc-training
ACDC. AHCCHM304A – Transport, Handle & Store Chemicals
ACDC. AHCPMG301A – Control Weeds
AusChem. Using Chemicals Safely. See www.auschemwa.com.au/page.cfm?pageId=136

10
AusChem. Risk Management in Pesticide Use. See www.auschemwa.com.au/page.cfm?pageId=137
AusChem. Reaccreditation Course. See www.auschemwa.com.au/page.cfm?pageId=138
AusChem. Advanced Spray Application. See www.auschemvic.org.au/courses.cfm?courseId=8
AusChem. Chemical Risk Management. See www.auschemvic.org.au/courses.cfm?courseId=10
Nufarm. Spraywise Application Stewardship Course. See www.spraywisedecisions.com.au
Smart Train Chemical Application Course. See www.dpi.nsw.gov.au/agriculture/profarm/courses/smarttrain3
Smart Train Chemical Risk Management. See www.dpi.nsw.gov.au/agriculture/profarm/courses/smarttrain4.
We worked with groups who have statistics on spray drift incidents from horticultural spraying in Australia over recent years – i.e. Primary Industries Rural South Australia and a survey from Victoria on spray applications. This included assessing the current level of drift complaints, scientific support for claims of drift exposure, and context as to the complaint areas in terms of the urban-rural interface, farm type, crop and size and any regional trends.
We looked for trends between crop type, sprayer type, chemical type and alleged damage cases from spray drift exposure.
We examined current application practices across horticultural sectors. We visited key horticulture industries, spray applicator (commercial and independent farmer) and production groups to determine the range of practices (including pesticides and spray volumes used). Some examples of visits were to large groups of representatives of the Apple and Pear Association, Almond Board, several vineyards and many individual growers.
We contacted approximately 500 applicators, growers and farmers involved in spraying horticultural crops across all sectors covered by HAL and obtained sufficient responses from 248 of these for the audit completion. We documented application practice frequencies among sprayer and spraying technique types – e.g. axial fan air blast sprayer, tower sprayer, converging airstream designs, electrostatic and other specialist spraying systems, ground rig horizontal boom sprayer, aircraft, including nozzle type and use, and also what proportion of the total use each type represents both through the survey and through meetings with grower groups. The survey questionnaire asked specific questions on these factors and the face-to-face meetings asked the same questions in a two-way conversation, usually with a group of 10-20 representatives. We determined the training level for each application group (farmer, grower, commercial applicator) – by course name (e.g. CHEMCERT, SMART Train, etc), frequency of training updates, attendance at extension events, and other qualifications. As above, this was through the survey questionnaires and face-to-face meetings. We also looked at current use levels and understandings of the effects of adjuvants and DRTs on spray drift and spray performance. We asked about calibration and nozzle usage.
11
Results
The audit and risk assessment produced a large amount of information which is summarized in the following sections. Additional information is included in the spreadsheets of the surveys which are available upon request. Where information from the survey is expressed as a percentage, the reference is to the survey respondents for that topic. For example, if 200 out of 260 people responded to a question and 100 of them replied “yes” to the question then the report would state that 50% replied in the affirmative. Not all survey participants responded to all questions, usually because those questions were not relevant to their operations.
Spray Drift Incident Reporting
Federal, State and Territory Trends
Information relating to spray drift incidents at the federal level was difficult to obtain, despite several visits to government departments in Canberra. APVMA suggested that there were only approximately 12 horticultural drift complaints per year through their adverse experiences reporting website and did not provide more specific information on incidents as detailed incident data cannot be provided by APVMA for release.
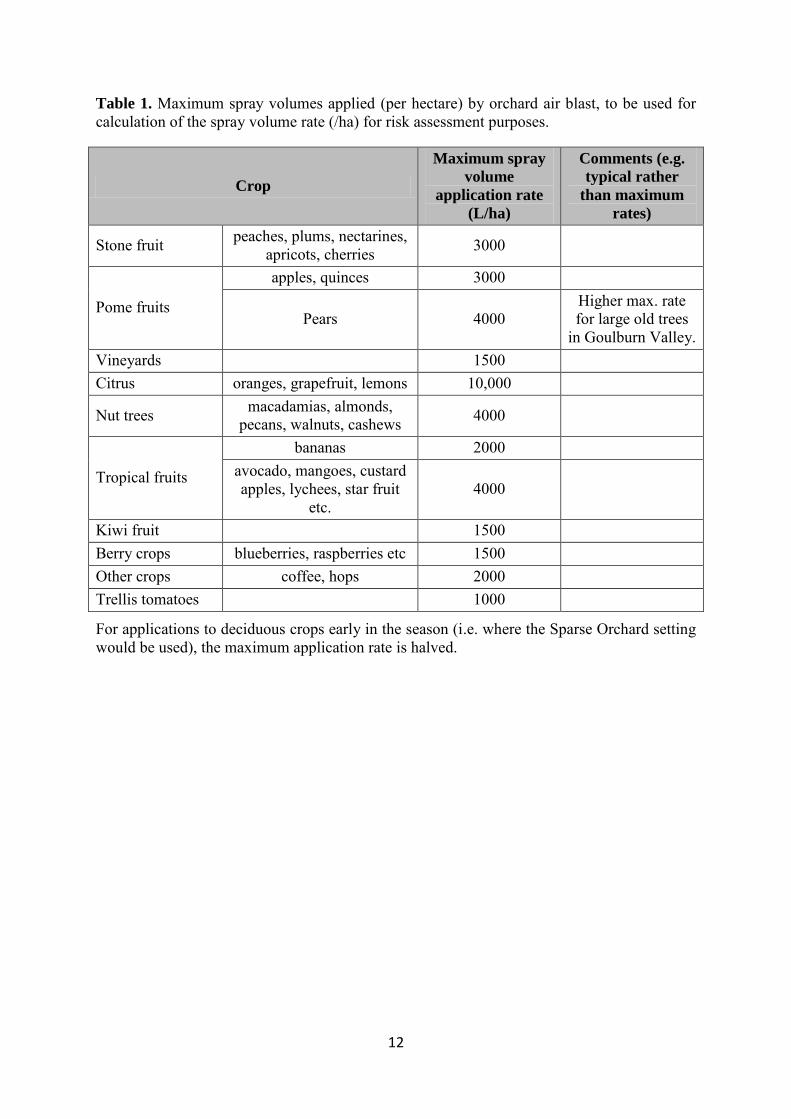
The Department of Sustainability, Environment, Water, Population and Communities provided its assumptions when assessing the drift exposure risk from horticultural applications using the AgDRIFT model (Table 1). APVMA’s plots of the drift deposition curves used for risk assessments in horticulture applications by ground sprayers are as on Figure 1. It should be noted that the “Normal” orchard grouping is no longer used by APVMA in its risk assessments
12
Table 1. Maximum spray volumes applied (per hectare) by orchard air blast, to be used for calculation of the spray volume rate (/ha) for risk assessment purposes.
Crop
Maximum spray
volume
application rate
(L/ha)
Comments (e.g.
typical rather
than maximum
rates)
Stone fruit peaches, plums, nectarines, apricots, cherries 3000
Pome fruits
apples, quinces 3000
Pears 4000 Higher max. rate for large old trees
in Goulburn Valley. Vineyards 1500 Citrus oranges, grapefruit, lemons 10,000
Nut trees macadamias, almonds, pecans, walnuts, cashews 4000
Tropical fruits
bananas 2000 avocado, mangoes, custard apples, lychees, star fruit
etc. 4000
Kiwi fruit 1500 Berry crops blueberries, raspberries etc 1500 Other crops coffee, hops 2000 Trellis tomatoes 1000
For applications to deciduous crops early in the season (i.e. where the Sparse Orchard setting would be used), the maximum application rate is halved.

13
Figure 1. Drift deposition ground application scenarios prepared by the Australian Pesticides and Veterinary Medicines Authority (APVMA) used for spray drift exposure risk assessments in horticulture applications. Note that the “Normal” orchard grouping is no longer used by APVMA in risk assessments.
Many drift incidents and issues are not addressed/ reported at the federal level but rather are handled at the state and territory level. Not all states and territories maintain databases or records of drift complaints. The most complete set of information is for SA and the reader is
encouraged to refer to the extensive detail in that section of this report for information which
was relevant to other parts of Australia where horticulture farming is near similar sensitive
areas such as non-target crops, water and places where people live, work and play.
Northern Territory (NT)
In the NT, many drift complaints are encouraged by an environmental action group called the Northern Territory Environment Centre. There was a feeling among regulators in the NT that moving to best practice won’t resolve drift issues because houses are sometimes too close to cropped areas, e.g. 20 m away from some orchards, rather than at a more reasonable setback distance of >100 m (or less is acceptable if vegetative barriers are present). Land separation was the key to solving these issues and it was noted that community concern over spray drift is increasing every year. Concern over noise when night spraying occurs was also increasing. A verbal agreement by applicators to not spray outside rows and spray from outside in has fixed most of the drift issues in the past. Five to ten years ago, mango blocks were usually relatively small in size (5 ha) whereas today they are usually >20 ha in size. This increase in size has produced fewer drift complaints as practices have improved and the relative edge area adjacent to sensitive areas has decreased. Many newer horticultural areas are 40 ha in
14
size without peri-urban area issues. The opinion of some government workers in the NT was that the APVMA adverse effects reporting system was not sufficient for national drift reporting and that a spray technology Cooperative Research Centre (CRC) would be very valuable. Such a centre could help provide a single location for people to source information on drift and not have separate BMPs for each region. Getting information and especially updates easily would be of huge value. The drift complaints in the NT amounted to a few per year, all of which related to peri-urban areas with perceived health issues from odour as well as zoning issues with compatible land. There were less than three formal complaints per year for drift issues from melon and mango crops. Other drift incidents were resolved by sitting down with neighbours and discussing the problem(s) rather than filing a formal complaint. Looking at the drift complaints by region, there were approximately 6-8 complaints per year at the top end from a range of crops. One complaint would tend to come from Katherine per year. A pollution hotline is the complaint line which then refers each complainant as needed to the appropriate experts. Environmental health, noise and odour issues are all handled in a linked way. No complaints have ever been passed to APVMA.
Queensland (QLD)
In QLD, drift issues occur mostly at the urban-rural interface, particularly with rapid growth of residential communities adjacent to land which has been traditionally farmed for sugar cane, avocado, pineapple, mango, banana, vegetable and other crops. Although guidelines exist for separation of urban and rural land with no-spray buffer zones usually being required from the property developer rather than the farmer, many property developers appeal such regulations in court and often win their appeals. One possible solution would be for formal land use planning guidelines to be agreed upon my multiple stakeholders through local, regional or even national consultation. Without progress on land use planning, spray drift issues are likely to increase as urban encroachment increases. Some high profile drift and pesticide contamination cases have occurred in QLD in the last 5 years. The state has encouraged best practice to protect the barrier reef from pesticides and agricultural chemicals and sugar cane growers for example practice quality assurance programs to avoid such chemical exposure. Another high profile case of alleged spray drift in QLD occurred near Noosa where a fish hatchery attracted national media attention with stories of fish deformities following alleged spray drift from an adjacent macadamia farm. Investigations by a government task force and APVMA were inconclusive but did not show that spray drift was the source of the alleged deformities. As with some other states/ territories, QLD did not have a central single reporting or investigation centre for drift issues. Rather, issues were directed to different groups for attention (Biosecurity QLD, Workplace health and Safety, local Department of Environment and Resource Management office, local government authority, Civil Aviation Safety Authority, APVMA, health officials etc) depending on the nature of the complaint. State-level statistics and information are therefore not available in QLD. It is therefore recommended that a single data source be established in QLD.

15
Tasmania (TAS)
In TAS, there has been an average of just over 14 drift complaints per year over the last 6 years from the public as summarized below. Year
Spray drift complaints Forestry related Agriculture (not forestry) 2007 12 1 11 2008 20 8 12 2009 21 5 16 2010 16 2 14 2011 8 0 8 2012 9 1 8 Whilst in many cases the investigations did prove that pesticides did in fact reach the neighbour or the water etc, there were no breaches of the codes of practice as the levels were below acceptable levels – i.e. there was no “adverse effect”. There were several other complaints but they were related to administrative type breaches and several warning letters were issued. Lack of notification in aerial spraying cases was the main offender. Western Australia (WA)
WA has no currently active central reporting for drift and many farmers settle with cash payments for alleged damage without any reporting according to state department of agriculture staff. However there is an AgLine portal for recording drift comments and in 2012 there were 19 recorded comments. It is estimated by state government staff that there are a total of 10-20 horticulture-related drift complaints each year through all sources. According to state department of agriculture staff, most complaints are now from aquaculture industries with several large cases of alleged insecticide spray drift impact on sensitive species such as marron crayfish, with allegations of millions of dollars of losses through death. Local government planning is important. Unlike SA, WA has no requirement of notification when someone plans to develop a new crop or aquaculture operation. Various sources from government and industry confirmed that spray applications in the state are made mainly (approximately 80%) by farmers /growers, 15% by private contractors and 5% by employees. There was a random unpublished residue study recently for strawberries (funded by the Strawberry Growers Association of Western Australia). One source out of 20 was over the limit for pesticide residues and some unregistered chemicals were used. Residues may or may not be from drift as they could have occurred by direct spraying over the crop. State government staff note that formal (usually by telephone or in writing) complaint levels to state officials run at 2-3 per year in broad acre (human health officers receive many of these complaints). Powdery mildew spraying generates 1-2 per year. Training officers receive 2-3 complaints per year from neighbors receiving drift. When they are asked if they have contacted the council, they tend to reply along the lines of “we are a small town, so don’t get any help from councils”. The Department of Environment and Conservation receives 1-2 complaints per year that are persuasive as being drift for tree damage or a few for fish deaths. Some of these could be uptake from roots rather than drift contact. The likely source is usually farmers spraying broad acre crops based on investigations conducted by this state department. It is possible that complainants contact both the department of agriculture and the department of environment with the same complaint. Several complaints each year are typically received from vegetable crops such as tomato growers receiving damage from herbicide drift; also one complaint was noted from banana spraying drifting into a caravan

16
park. There were also 2 metham sodium escapes which were outside label use. When drift complaints occur, they are referred to the most appropriate area – e.g. medical issues go to the doctor; the Health Department receives some complaints and a few years ago it banned aerial application of dimethoate in response to health complaints from spray drift. There have been no further aerial application complaints. Health officials also received health complaints from spray drift in areas where there are concentrations of vineyards. The Swan Valley has some issues with drift and most of these are urban-rural interface issues with apple crops. One government department in WA reported the following: “There was legislation brought in by DAFWA around 1995 called the Agricultural Practices Disputes Act which has since been repealed which really addressed the issue of spray drift and other related farm to farm activity where either dust or spray drift could be dealt via a disputes resolution process, rather than via litigation. DAFWA would appear to have repealed this legislation for their reasons. This legislation would appear to have the best chance at resolving spray drift matters at a farmer to farmer level”. Based on all of the above, it is estimated that there are less than 5 formal drift complaints per year from horticultural spraying in WA. It was noted that there are not enough specialists in WA to put on training courses in horticulture. The industry is rapidly losing people to mining and other higher paying sectors of the state economy. There are only 4 agronomists in WA who give advice in horticulture compared to ~100 for grains. Sales come before agronomy with all of them, so advice may be tainted towards particular sales interests. Many farmers are getting their information from advisors or local sales people – so reaching them is important. Innoveg was set up by HAL a few years ago to do horticultural extension. Broad, generic courses are of low value and get “dumbed down”, whereas focused training should be more useful. It was suggested to perhaps offer specialist information online through an authorized website that can build on the specific training courses. Another government department explained that the effects of spray drift are frequently observed on fence line vegetation, revegetation plantings and paddock trees; drift can be limited or wide scale in distribution and can cause problems to other businesses operating in the agricultural landscape such as seedling nurseries. The consequences range from minor damage, from which plants appear to recover, through to long term damage and entire death, e.g. of trees. They added that there is no information on the effects of insecticide or fungicide drift. Many of the examples presented were of herbicide damage to trees. Examples were given as follows (they noted that most of these are from grains industry spraying, not horticulture, given the areas in which they occurred):
Fence line vegetation damage from drift in Kukerin, 2006. This was a limited scale event consistent with herbicide damage.
Road verge (especially trees) and paddock vegetation damage in the Nangeenan-Merredin area in 2006. A large area of 3 km x 10 km was affected with long-term damage occurring. Several adjacent landholders probably all sprayed weeds around the same time.
Road verge and paddock vegetation damage from herbicides in Namulcatchem in 2011. This was a large area event with long-term damage.
5-10 reports of unusual growth patterns in seedling nurseries with prominent leaf curl attributed as being most likely from herbicide drift. Some seedlings have outgrown the damage but some growers have suffered economic losses.
Railway easement spraying with drift damage to trees in the Kellerberrin-Merredin area in 2012.

17
Victoria (VIC)
In VIC, information is not accessible on details of drift incidents because formal accessible records are not maintained. However, the following data trends have been supplied for the period 1st July, 2008 to 31st March, 2012 (Table 4). It is not known how many of these relate to any given crop or situation.
18
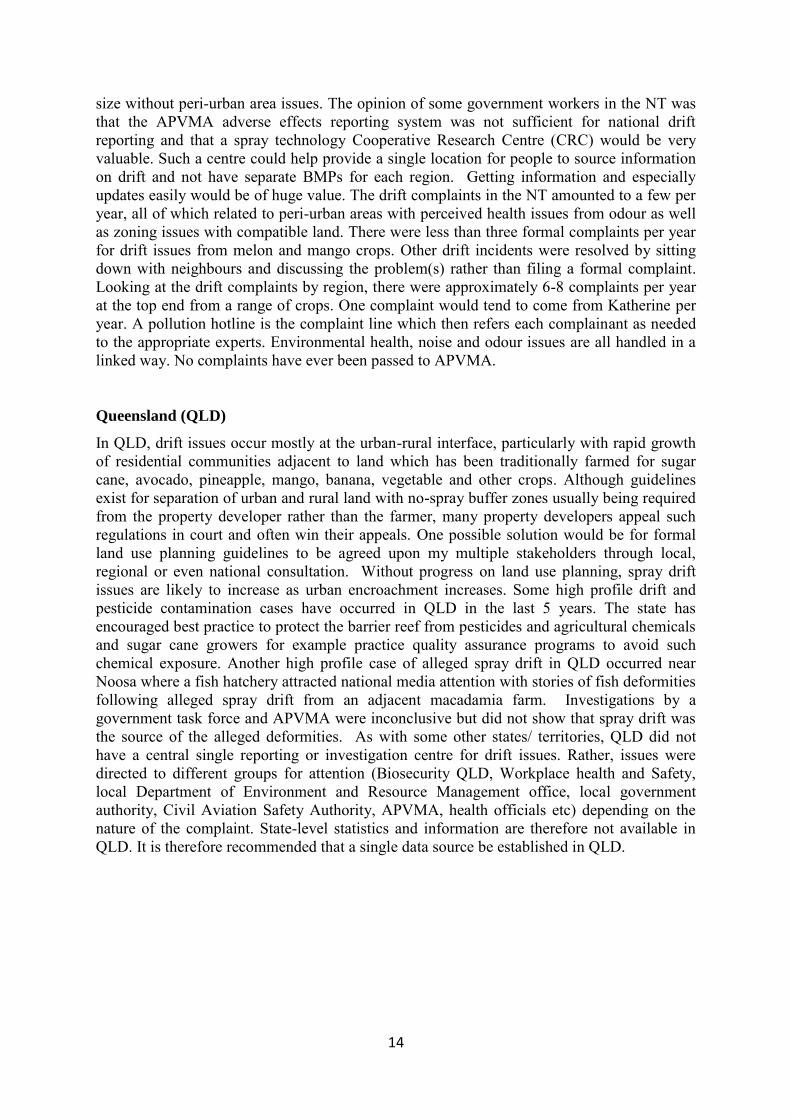
Table 4. State Records, status and outcomes of drift complaints in Victoria for the period 1st July, 2008 to 31st March, 2012.
Spray drift complaint status Number of separate spray drift
complaints
Investigation conducted 71 No further action 36 Redirected to another agency 18
TOTAL COMPLAINTS 127
Status of the 71 investigations Number of investigations
Open 14 Closed 57
Outcome of the 57 closed investigations Number of investigations
No offence detected 39 Counselling letter issued 14 Warning letter issued 2 Infringement Notice for record-keeping 1 Prosecution completed 2
Offences detected for the 18
investigations where an offence was
detected
Number of investigations
Spray drift damage (S40) 3 Use contrary to a label requirement 8 Off-label use of a restricted use product 1 Record keeping 12
This shows that in VIC, of 71 investigations in the 45 months through March, 2012, 55% have been closed with no offence detected, 20% remain open and the remainder resulted in actions with a 3% prosecution rate.
South Australia (SA)
Primary Industries and Regions South Australia (PIRSA) has some of the most comprehensive statistics on spray drift in Australia, spanning the last 4 years. Complaints are often related to the frequency or urgency of spraying (e.g. it is not as easy to wait for favourable weather conditions if pest pressures are urgent and the weather is inappropriate for spraying for a prolonged period of time). The period 2010-11 was characterized by a wet and humid spring-summer period which created high disease pressure. PIRSA received a high number of complaints from September through to January, not just from pesticide (fungicide) application in horticulture and viticulture, but also in field crops in that year. For the period 2011-12, complaint levels were very similar to the previous year. The main production concern for 2011-12 was damage to vineyards (including one organic) and another mixed horticultural property around Loxton from spray drift of Group I herbicides. The source is thought to be summer weed spraying on the dry land farms surrounding the irrigation areas but, in most cases, a particular offender has not been identified. In addition to the reports of
19
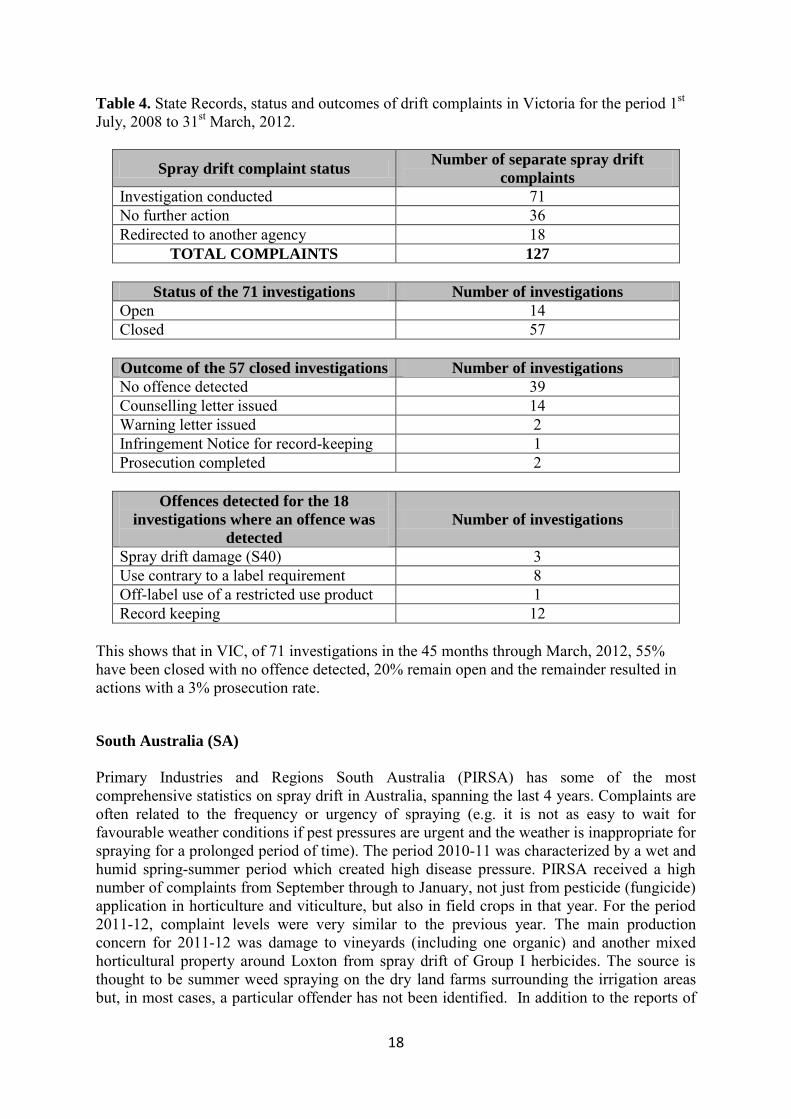
damage from summer weed spraying that were logged as investigations, PIRSA received more reports of damage (mainly to grapevines) from the Loxton region that were just noted. These do not appear in the statistics for that year so that alleged as well as actual damages are higher than the reported 42 value. For horticulture, there were 4 complaints about vineyard spraying and 3 about tree crop spraying (2 from the same complainant) but these were relatively minor and low-risk. They received most complaints from rural-living and township-living properties but usually these were also relatively minor and low-risk. 13 were considered not to be trespass and seven were not investigated after a preliminary appraisal of the report. A summary of complaints by SA council region (for the 2011-12 period) is shown below (Table 5; Figure 2).
Table 5. Summary of drifts complaints in each council region of South Australia for the 2011-12 period.
Council Reports
2011/12
Adelaide Hills 3 Alexandrina 2 Barossa 1 Berri-Barmera 1 Clare and Gilbert Valley 1 Coorong 2 Copper Coast 1 Goyder 4 Grant 2 Light 2 Loxton-Waikerie 7 Malalla 1 Mid Murray 1 Mount Ganbier 1 Naracoorte-Lucindale 2 Onkaparinga 2 Playford 4 Southern Mallee 1 Streaky Bay 1 Wattle Range 1 Yankalilla 1 Yorke Peninsula 1 Total 42
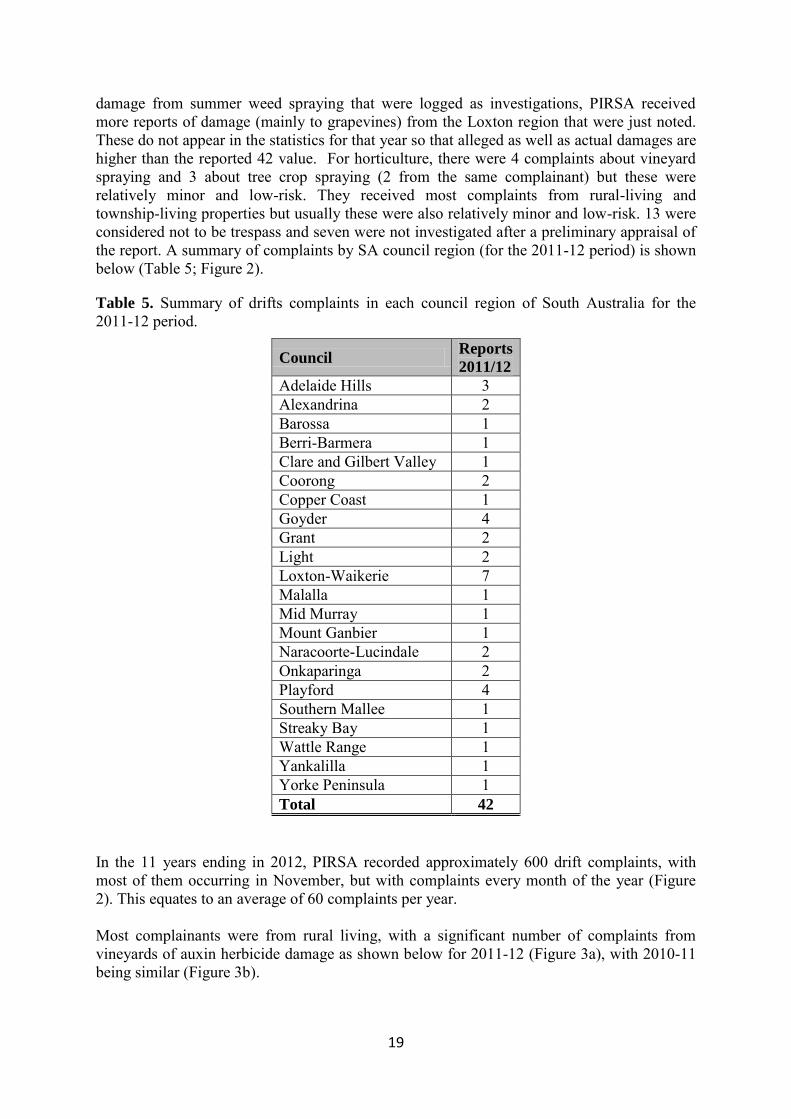
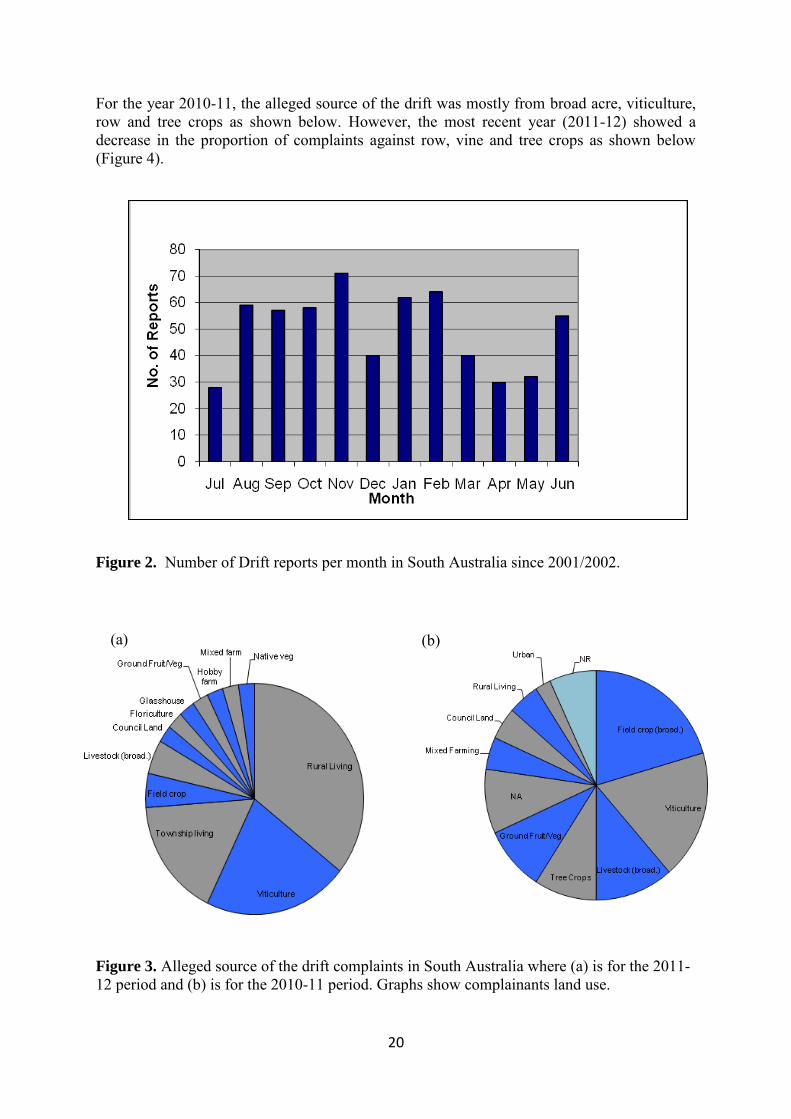
In the 11 years ending in 2012, PIRSA recorded approximately 600 drift complaints, with most of them occurring in November, but with complaints every month of the year (Figure 2). This equates to an average of 60 complaints per year. Most complainants were from rural living, with a significant number of complaints from vineyards of auxin herbicide damage as shown below for 2011-12 (Figure 3a), with 2010-11 being similar (Figure 3b).
20
(a) (b)
For the year 2010-11, the alleged source of the drift was mostly from broad acre, viticulture, row and tree crops as shown below. However, the most recent year (2011-12) showed a decrease in the proportion of complaints against row, vine and tree crops as shown below (Figure 4).
Figure 2. Number of Drift reports per month in South Australia since 2001/2002.
Figure 3. Alleged source of the drift complaints in South Australia where (a) is for the 2011-12 period and (b) is for the 2010-11 period. Graphs show complainants land use.
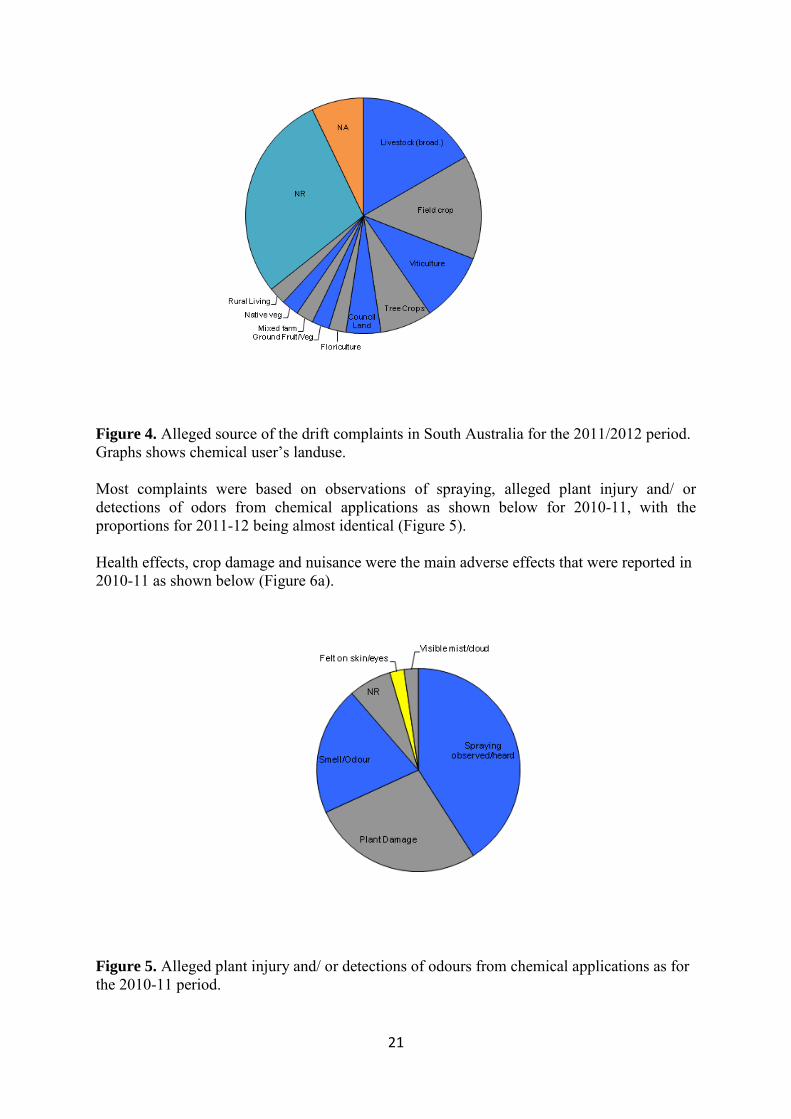
21
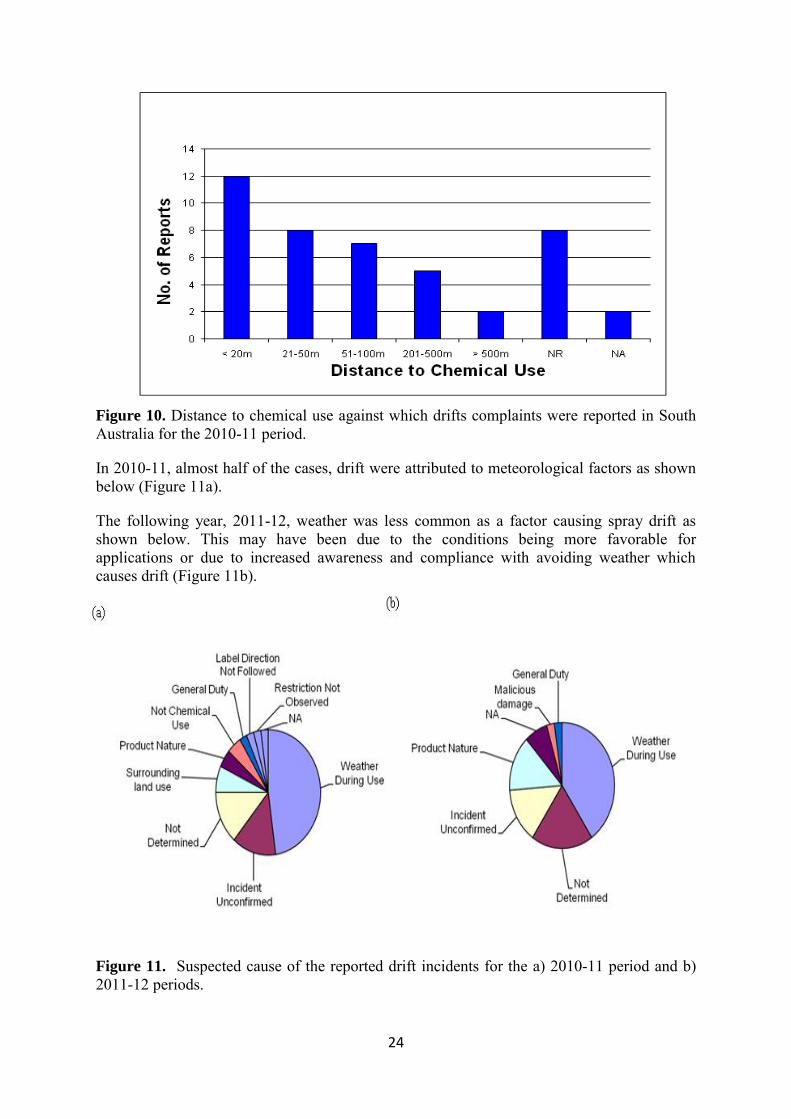
Figure 4. Alleged source of the drift complaints in South Australia for the 2011/2012 period. Graphs shows chemical user’s landuse. Most complaints were based on observations of spraying, alleged plant injury and/ or detections of odors from chemical applications as shown below for 2010-11, with the proportions for 2011-12 being almost identical (Figure 5). Health effects, crop damage and nuisance were the main adverse effects that were reported in 2010-11 as shown below (Figure 6a).
Figure 5. Alleged plant injury and/ or detections of odours from chemical applications as for the 2010-11 period.

22
(a) (b)
Figure 6. Adverse effects reported from drift complaints, where (a) refers to the 2010-11 period and (b) the 2011-12 period.
The ongoing increase in urban encroachment to rural areas is evident in the trend for the following year showing a much greater occurrence of reported damage to garden foliage, as shown in the 2011-12 figures below (Figure 6b).
Most of the sprays that caused complaints were applied with ground-based spraying equipment as shown below, with similar trends in 2010-11 to 2011-12 (Figure 7).
Almost 2/3 of the drift incidents were documented by PIRSA as being of low or no risk, with the remaining cases being of risk to health and trade as shown below for 2010-11 with similar proportions in 2011-12 (Figure 8).
Figure 7. Alleged application platform causing drift complaints in SA for 2010-11 period.

23
Figure 8. Alleged documented risk drift incidents from drift complaints in South Australia for the 2010-11 periods.
There was a higher frequency of complaints against properties sized between 11 and 50 ha as shown below (2010-11 Figure 9; with 2011-12 proportions being similar).
The number of reported drift incidents decreased with distance from the alleged source as shown below (2010-11 Figure 10, with 2011-12 statistics being similar).
Figure 9. Frequency of property size against drifts complaints in South Australia for the 2010-11 period.
24
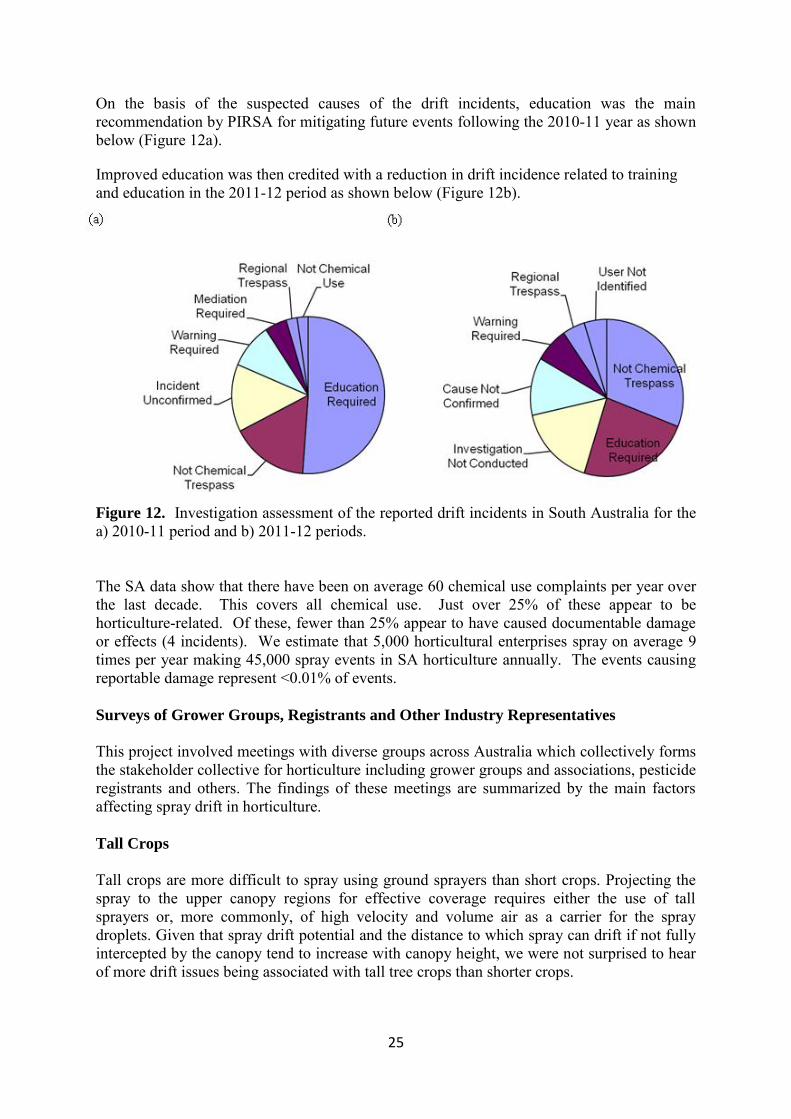
Figure 10. Distance to chemical use against which drifts complaints were reported in South Australia for the 2010-11 period.
In 2010-11, almost half of the cases, drift were attributed to meteorological factors as shown below (Figure 11a).
The following year, 2011-12, weather was less common as a factor causing spray drift as shown below. This may have been due to the conditions being more favorable for applications or due to increased awareness and compliance with avoiding weather which causes drift (Figure 11b).
Figure 11. Suspected cause of the reported drift incidents for the a) 2010-11 period and b) 2011-12 periods.
25
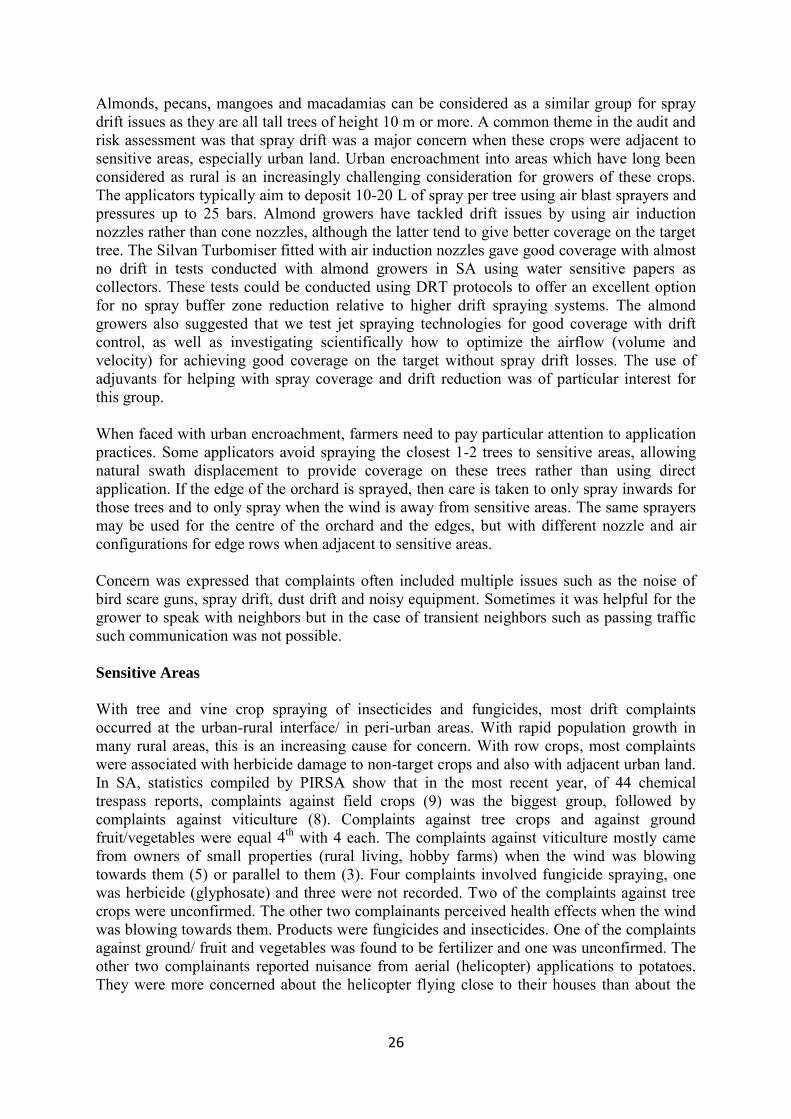
On the basis of the suspected causes of the drift incidents, education was the main recommendation by PIRSA for mitigating future events following the 2010-11 year as shown below (Figure 12a).
Improved education was then credited with a reduction in drift incidence related to training and education in the 2011-12 period as shown below (Figure 12b).
Figure 12. Investigation assessment of the reported drift incidents in South Australia for the a) 2010-11 period and b) 2011-12 periods. The SA data show that there have been on average 60 chemical use complaints per year over the last decade. This covers all chemical use. Just over 25% of these appear to be horticulture-related. Of these, fewer than 25% appear to have caused documentable damage or effects (4 incidents). We estimate that 5,000 horticultural enterprises spray on average 9 times per year making 45,000 spray events in SA horticulture annually. The events causing reportable damage represent <0.01% of events.
Surveys of Grower Groups, Registrants and Other Industry Representatives
This project involved meetings with diverse groups across Australia which collectively forms the stakeholder collective for horticulture including grower groups and associations, pesticide registrants and others. The findings of these meetings are summarized by the main factors affecting spray drift in horticulture. Tall Crops
Tall crops are more difficult to spray using ground sprayers than short crops. Projecting the spray to the upper canopy regions for effective coverage requires either the use of tall sprayers or, more commonly, of high velocity and volume air as a carrier for the spray droplets. Given that spray drift potential and the distance to which spray can drift if not fully intercepted by the canopy tend to increase with canopy height, we were not surprised to hear of more drift issues being associated with tall tree crops than shorter crops.
26
Almonds, pecans, mangoes and macadamias can be considered as a similar group for spray drift issues as they are all tall trees of height 10 m or more. A common theme in the audit and risk assessment was that spray drift was a major concern when these crops were adjacent to sensitive areas, especially urban land. Urban encroachment into areas which have long been considered as rural is an increasingly challenging consideration for growers of these crops. The applicators typically aim to deposit 10-20 L of spray per tree using air blast sprayers and pressures up to 25 bars. Almond growers have tackled drift issues by using air induction nozzles rather than cone nozzles, although the latter tend to give better coverage on the target tree. The Silvan Turbomiser fitted with air induction nozzles gave good coverage with almost no drift in tests conducted with almond growers in SA using water sensitive papers as collectors. These tests could be conducted using DRT protocols to offer an excellent option for no spray buffer zone reduction relative to higher drift spraying systems. The almond growers also suggested that we test jet spraying technologies for good coverage with drift control, as well as investigating scientifically how to optimize the airflow (volume and velocity) for achieving good coverage on the target without spray drift losses. The use of adjuvants for helping with spray coverage and drift reduction was of particular interest for this group. When faced with urban encroachment, farmers need to pay particular attention to application practices. Some applicators avoid spraying the closest 1-2 trees to sensitive areas, allowing natural swath displacement to provide coverage on these trees rather than using direct application. If the edge of the orchard is sprayed, then care is taken to only spray inwards for those trees and to only spray when the wind is away from sensitive areas. The same sprayers may be used for the centre of the orchard and the edges, but with different nozzle and air configurations for edge rows when adjacent to sensitive areas. Concern was expressed that complaints often included multiple issues such as the noise of bird scare guns, spray drift, dust drift and noisy equipment. Sometimes it was helpful for the grower to speak with neighbors but in the case of transient neighbors such as passing traffic such communication was not possible. Sensitive Areas
With tree and vine crop spraying of insecticides and fungicides, most drift complaints occurred at the urban-rural interface/ in peri-urban areas. With rapid population growth in many rural areas, this is an increasing cause for concern. With row crops, most complaints were associated with herbicide damage to non-target crops and also with adjacent urban land. In SA, statistics compiled by PIRSA show that in the most recent year, of 44 chemical trespass reports, complaints against field crops (9) was the biggest group, followed by complaints against viticulture (8). Complaints against tree crops and against ground fruit/vegetables were equal 4th with 4 each. The complaints against viticulture mostly came from owners of small properties (rural living, hobby farms) when the wind was blowing towards them (5) or parallel to them (3). Four complaints involved fungicide spraying, one was herbicide (glyphosate) and three were not recorded. Two of the complaints against tree crops were unconfirmed. The other two complainants perceived health effects when the wind was blowing towards them. Products were fungicides and insecticides. One of the complaints against ground/ fruit and vegetables was found to be fertilizer and one was unconfirmed. The other two complainants reported nuisance from aerial (helicopter) applications to potatoes. They were more concerned about the helicopter flying close to their houses than about the
27
possibility of spray drift, although Rural Chemicals believes that endosulfan drift was highly probable in one of these incidents. Drift Reduction Technologies
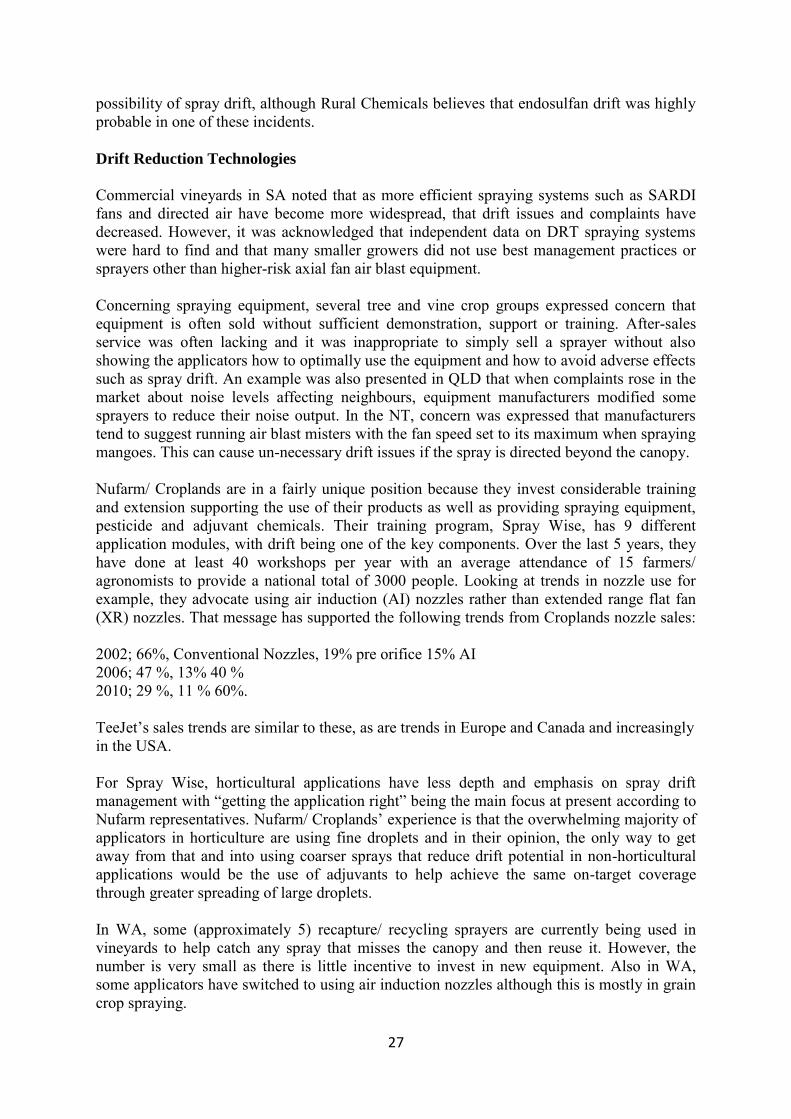
Commercial vineyards in SA noted that as more efficient spraying systems such as SARDI fans and directed air have become more widespread, that drift issues and complaints have decreased. However, it was acknowledged that independent data on DRT spraying systems were hard to find and that many smaller growers did not use best management practices or sprayers other than higher-risk axial fan air blast equipment. Concerning spraying equipment, several tree and vine crop groups expressed concern that equipment is often sold without sufficient demonstration, support or training. After-sales service was often lacking and it was inappropriate to simply sell a sprayer without also showing the applicators how to optimally use the equipment and how to avoid adverse effects such as spray drift. An example was also presented in QLD that when complaints rose in the market about noise levels affecting neighbours, equipment manufacturers modified some sprayers to reduce their noise output. In the NT, concern was expressed that manufacturers tend to suggest running air blast misters with the fan speed set to its maximum when spraying mangoes. This can cause un-necessary drift issues if the spray is directed beyond the canopy. Nufarm/ Croplands are in a fairly unique position because they invest considerable training and extension supporting the use of their products as well as providing spraying equipment, pesticide and adjuvant chemicals. Their training program, Spray Wise, has 9 different application modules, with drift being one of the key components. Over the last 5 years, they have done at least 40 workshops per year with an average attendance of 15 farmers/ agronomists to provide a national total of 3000 people. Looking at trends in nozzle use for example, they advocate using air induction (AI) nozzles rather than extended range flat fan (XR) nozzles. That message has supported the following trends from Croplands nozzle sales: 2002; 66%, Conventional Nozzles, 19% pre orifice 15% AI 2006; 47 %, 13% 40 % 2010; 29 %, 11 % 60%. TeeJet’s sales trends are similar to these, as are trends in Europe and Canada and increasingly in the USA. For Spray Wise, horticultural applications have less depth and emphasis on spray drift management with “getting the application right” being the main focus at present according to Nufarm representatives. Nufarm/ Croplands’ experience is that the overwhelming majority of applicators in horticulture are using fine droplets and in their opinion, the only way to get away from that and into using coarser sprays that reduce drift potential in non-horticultural applications would be the use of adjuvants to help achieve the same on-target coverage through greater spreading of large droplets. In WA, some (approximately 5) recapture/ recycling sprayers are currently being used in vineyards to help catch any spray that misses the canopy and then reuse it. However, the number is very small as there is little incentive to invest in new equipment. Also in WA, some applicators have switched to using air induction nozzles although this is mostly in grain crop spraying.

28
Dose Adjustment for the Canopy and Distance Calibration
Most in viticulture, particularly the large-scale vineyards believe that as spray volumes have reduced with more precise calibration of spray volumes to match the canopy. Indeed, the topic of labeling and application practice for delivering the correct dose of active ingredient to a 3-dimensional canopy is one which still requires full consensus in many crop sectors and inclusion in training courses and applicator guidance. Rather than expressing the amount of spray volume to apply on an area basis (e.g. x L/ha), it is more meaningful to describe the amount of spray volume based on distance, for example as L per 100 m of sprayed length per m of canopy height with an adjustment for canopy density. For concentrate spraying the concentration of chemical is increased in the same proportion as the spray volume is decreased below the point of first run-off spray volume. Concentrate spraying is an important practice in horticulture and can help reduce wastage of chemical through excessive application rates. However, concern was expressed in WA that adjuvant rates may not be correctly set in concentrate spraying as there was a lot of confusion in how to adjust adjuvant rates when changing the chemical concentration. Stewardship and Quality Assurance Programs
Viticulture practices several good stewardship programs such as “Grapelink” for spray diaries and strict Maximum Residue Limit (MRL) and Quality Assurance (QA) goals required by the market. A large audit was recently conducted of the spraying equipment in SA vineyards where 99% of the sprayers were checked and tested for safety and application optimization. The large mango and melon groups have SOPs to help with training and quality assurance. Accreditation and Training
Various options are available to applicators for pesticide safety and use training. In reviewing the main courses of ChemCert/ AusChem, Smart Train and ACDC listed in the Methods section, they had some information on drift. These areas are as follows:
Drift reduction technologies. There was usually little or no mention of recent DRTs such as towered sprayers, targeted air sprayers, electronic eyes and other sensors for the canopy; new nozzle and atomizer technologies; sprayer modification devices such as shrouds and shields and other ways of reducing total environmental load of pesticides in horticulture.
Adjuvants for sprays. Given that most applicators use adjuvants in their spray mixtures, there was a surprising lack of independent information on the performance of the many product types when used with active ingredients and nozzles of different types in horticultural spraying. Research at The University of Queensland and elsewhere has shown that many products bearing the name of “drift control adjuvants” actually increase spray drift with common spraying systems and pesticides. Although much of the data are in reports for specific projects, the following publications provide some data: Hewitt (2004, 2008), Hewitt et al (2001a, 2001b).
29
Up-to-date information on the wide range of sources of information on meteorological conditions such as on-board weather stations and many different websites with local rather than regional information.
Information on no-spray buffer zones – how and when they apply and how to observe them.
In the NT, 60% - 80% of applicators have undergone chemical training due to Freshcare requirements and requirements for schedule 7 chemicals (Chemcert or Smart Train level 3). There is a high population of Vietnamese and Cambodians who may not have all training materials covered in their language (Vietnamese courses have been borrowed from SA). In WA, TAFEs all cover training while there are no correspondence courses. Quality Assurance schemes such as Freshcare have helped encourage a lot of the training. In WA, there is no legislation requiring keeping your accreditation current. Application/spray contractors are usually well trained in WA because the WA Executive Director of Public Health has mandated 4 units of competency at certification level 3 and 2 at level 4. This was first introduced in 1995 as a 5-day residential course. Until about 6 years ago, the old course was mapped across to new competency levels and now the course is competency based. A private trainer delivers one and TAFEs deliver the rest – based on Smart Train information. Fieldwork is required as part of the course – e.g. calibration. Boom sprayers upwards use 6 units and other units can be added if needed. Meteorology has dropped out of some courses, a decision that requires a review. At the farmer level training is challenging. Funds are very tight for training course development. One of the largest course providers, AusChem struggles to get 8 people to attend a 2 or 1 day course. A lack of legislation in WA means that attendance is poor compared to SA, NSW and VIC. In face-to-face meetings, several large vineyard companies expressed the view that more consistency in education and training is needed because there are often conflicting messages. They suggested that grower associations need to re-form links and trust with the wine industry and get involved in education and training. A Ute guide to spraying should be developed and sent out to growers as a BMP type document. Grapelink is a successful program used in vineyard spraying. It flags any errors when an applicator sets up the application data (e.g. chemical rate errors). It could be extended to flag drift issues such as wind direction. Concerning the WA SMART Train course for contractors, according to one of the two lecturers who deliver the programme at Challenger TAFE, there is generally one course a year with about 20 attendees. Other TAFEs and one private provider do deliver their own courses for contractors that they have put together (not using any materials from SMART Train or AusChem Training WA) and they deliver to 20-30 a year in total. The trend in training is not positive in WA. This should be addressed because it impacts on competencies of applicators. AusChem provided the following statistics by year: 2008 - 1406 total - made up of 787 for Risk Management in Pesticide Use (the accreditation course over 2 days), 406 for Spray in Grain (1 day refresher for grain growers) and 213 Reaccreditation course (1 day refresher).
30
2009. 993 in total - made up of 690 accreditation, 138 Spray in Grain and 165 Reaccreditation. 2010 - 1031 total - made up of 616 accreditation, 196 for Spray in Grain and 219 for Reaccreditation course. 2011 - 838 total - made up of 370 accreditation, plus 54 Shire sprayers, DEC and other weed sprayers taking the Weed Manager's version of Risk Management in Pesticide Use course, 234 Spray in Grain and 180 Reaccreditation Course. 2012 to date - 439 in total - made up of 197 accreditation, 133 Spray in Grain and 109 Reaccreditation course. Because the Farm Ready Reimbursement Grant has now finished, which allowed growers to receive 65% off the cost of our courses, there is an expectation of a plunge in course attendances in the remainder of the year. AusChem hopes to make up numbers by further promotion of the Weed Manager's version of the accreditation course because they have never received the Farm Ready Grant, have training budgets and see training as important for risk reduction for their staff. Nufarm offers training through its Spray Wise course and has run 60-70 growers through the last round of training in most states. Manuals are $50-60 or free. A horticulture manual will be available in late 2012.
31
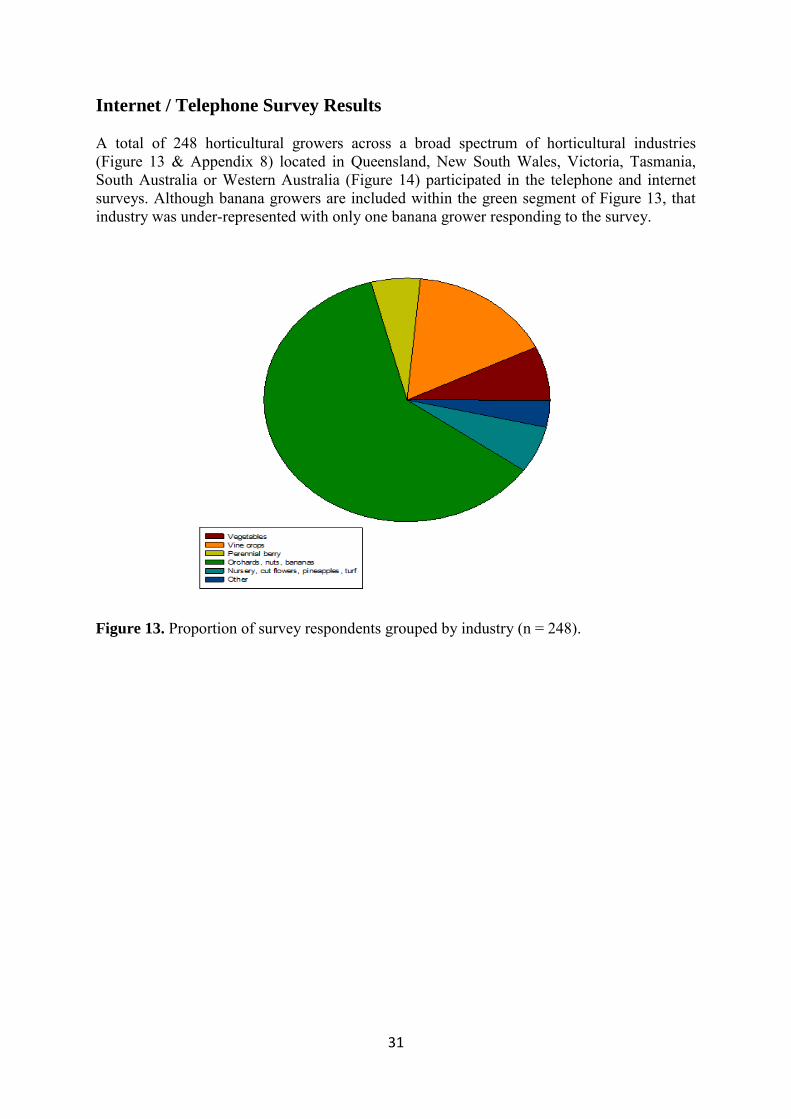
Internet / Telephone Survey Results A total of 248 horticultural growers across a broad spectrum of horticultural industries (Figure 13 & Appendix 8) located in Queensland, New South Wales, Victoria, Tasmania, South Australia or Western Australia (Figure 14) participated in the telephone and internet surveys. Although banana growers are included within the green segment of Figure 13, that industry was under-represented with only one banana grower responding to the survey.
Figure 13. Proportion of survey respondents grouped by industry (n = 248).
32
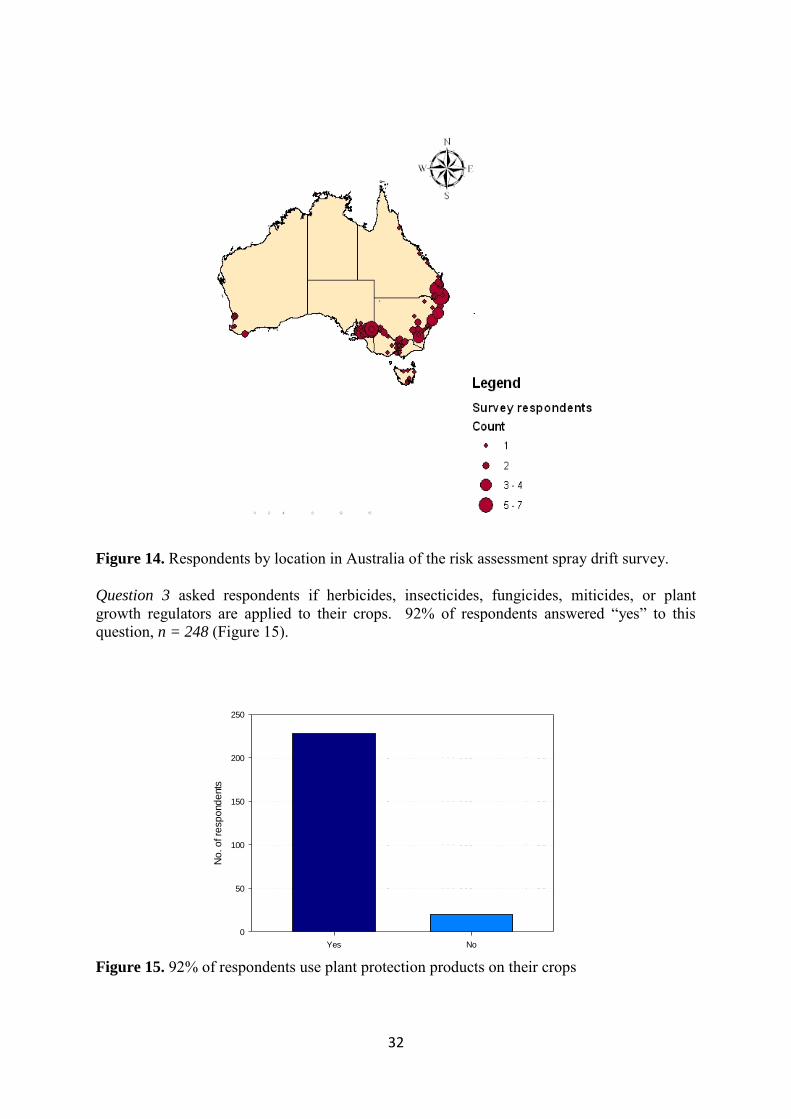
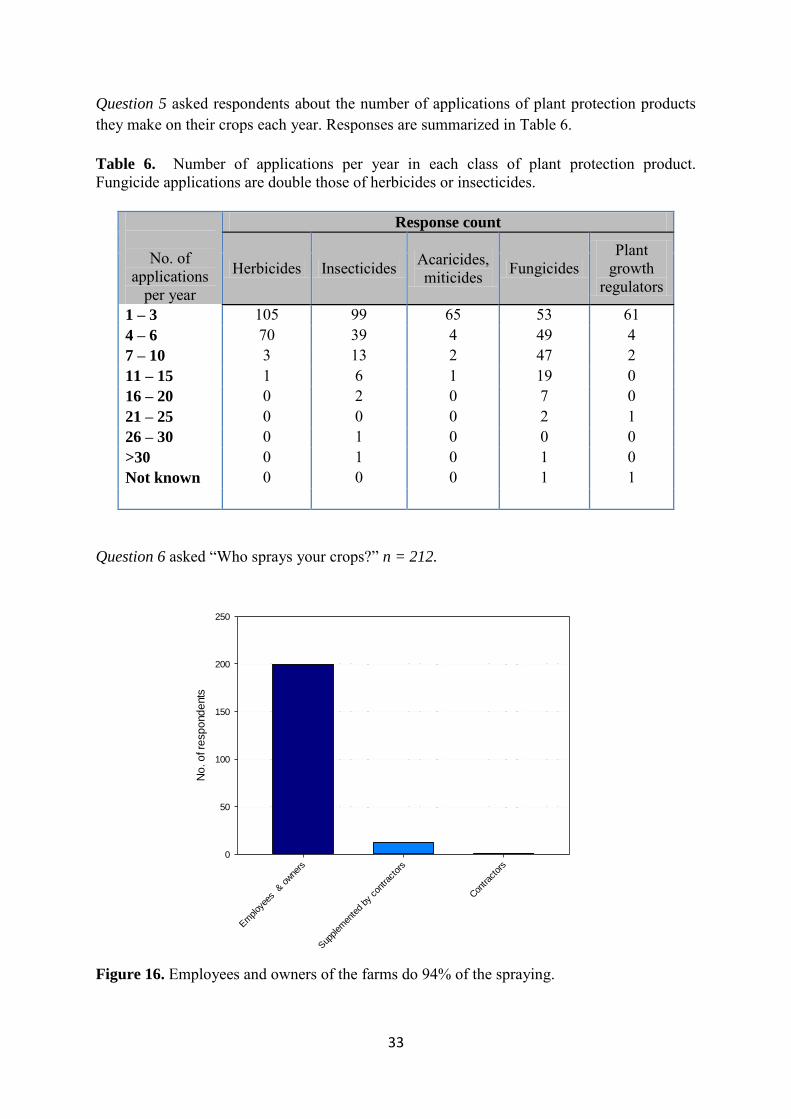
Figure 14. Respondents by location in Australia of the risk assessment spray drift survey. Question 3 asked respondents if herbicides, insecticides, fungicides, miticides, or plant growth regulators are applied to their crops. 92% of respondents answered “yes” to this question, n = 248 (Figure 15).
Yes No
No
. o
f re
sp
ond
ents
0
50
100
150
200
250
Figure 15. 92% of respondents use plant protection products on their crops
33
Question 5 asked respondents about the number of applications of plant protection products they make on their crops each year. Responses are summarized in Table 6.
Table 6. Number of applications per year in each class of plant protection product. Fungicide applications are double those of herbicides or insecticides.
No. of applications
per year
Response count
Herbicides Insecticides Acaricides, miticides Fungicides
Plant growth
regulators
1 – 3 105 99 65 53 61 4 – 6 70 39 4 49 4 7 – 10 3 13 2 47 2 11 – 15 1 6 1 19 0 16 – 20 0 2 0 7 0 21 – 25 0 0 0 2 1 26 – 30 0 1 0 0 0 >30 0 1 0 1 0 Not known 0 0 0 1 1
Question 6 asked “Who sprays your crops?” n = 212.
Em
ploy
ees
& o
wne
rs
Sup
plem
ente
d by
con
tract
ors
Con
tract
ors
No
. o
f re
sp
ond
ents
0
50
100
150
200
250
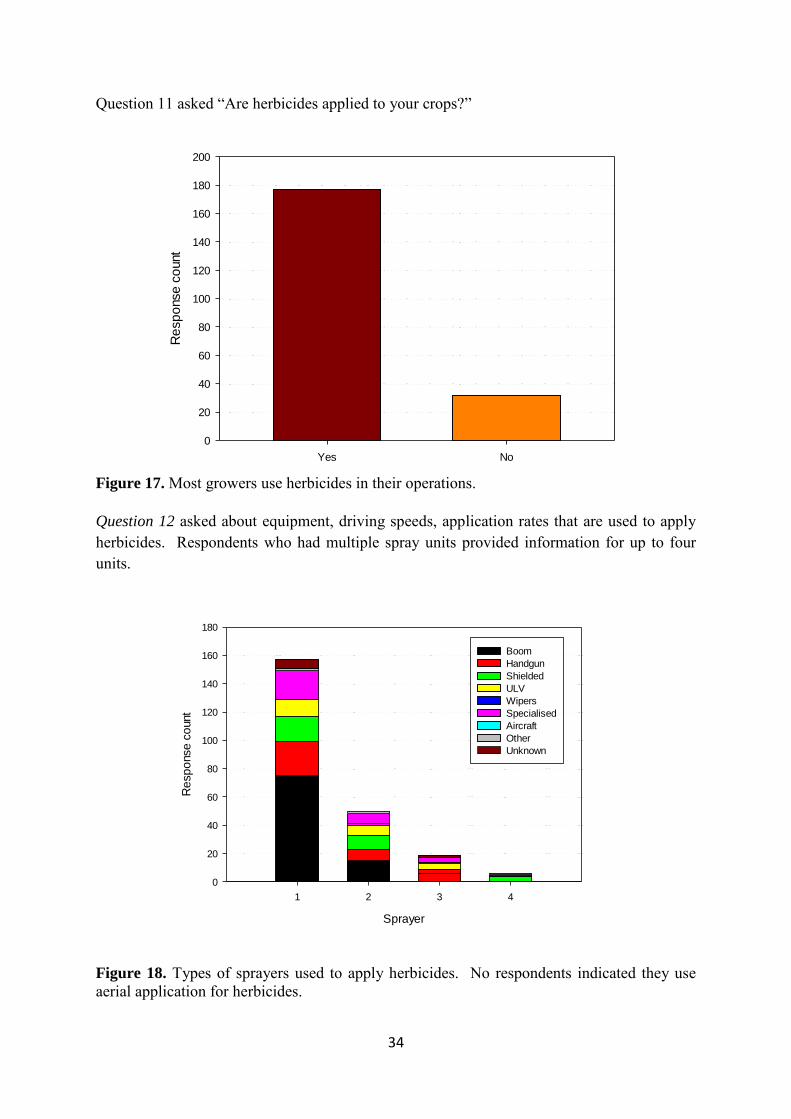
Figure 16. Employees and owners of the farms do 94% of the spraying.
34
Question 11 asked “Are herbicides applied to your crops?”
Yes No
Re
sp
onse
co
unt
0
20
40
60
80
100
120
140
160
180
200
Figure 17. Most growers use herbicides in their operations. Question 12 asked about equipment, driving speeds, application rates that are used to apply herbicides. Respondents who had multiple spray units provided information for up to four units.
Sprayer
1 2 3 4
Re
sp
onse
co
unt
0
20
40
60
80
100
120
140
160
180
Boom
Handgun
Shielded
ULV
Wipers
Specialised
Aircraft
Other
Unknown
Figure 18. Types of sprayers used to apply herbicides. No respondents indicated they use aerial application for herbicides.
35
Sprayer
Re
sp
onse
co
unt
0
20
40
60
80
100
120
140
160
180
Air inclusion
Flat fan
Floodjet
Boomless
Flat fan XR
Cone
Disc core
Rotary atomiser
Other
N/A
Unknown
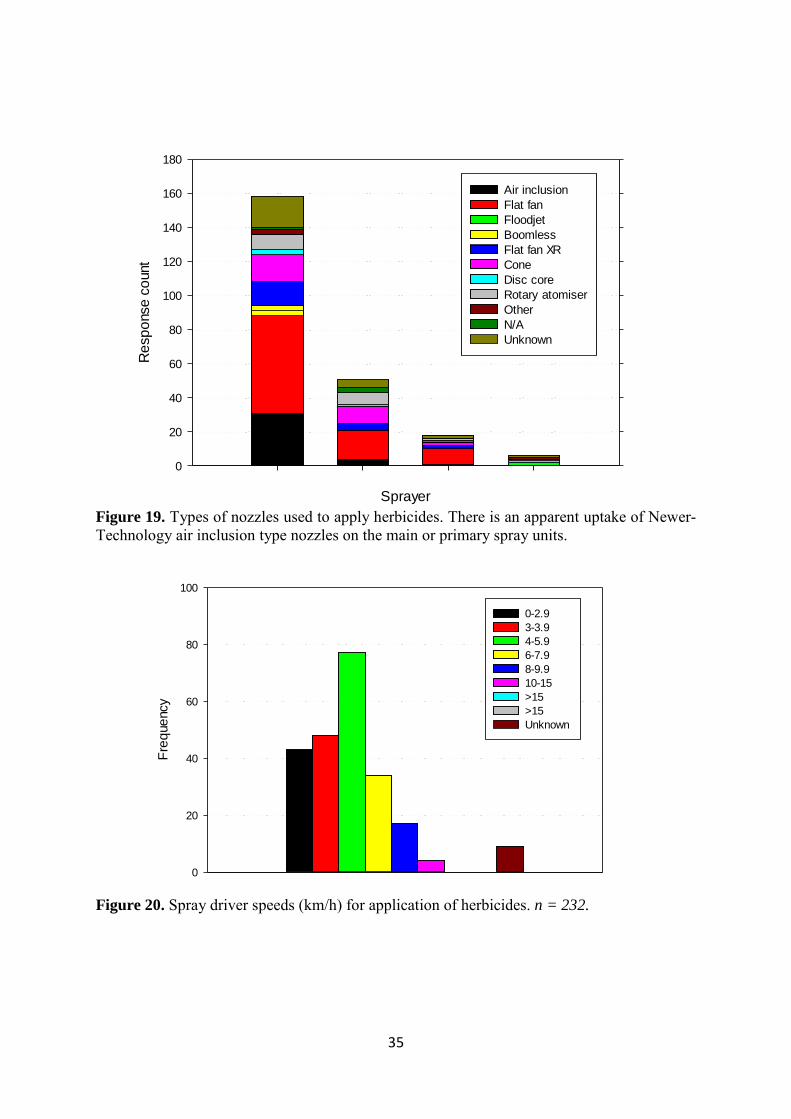
Figure 19. Types of nozzles used to apply herbicides. There is an apparent uptake of Newer-Technology air inclusion type nozzles on the main or primary spray units.
Fre
que
ncy
0
20
40
60
80
100
0-2.9
3-3.9
4-5.9
6-7.9
8-9.9
10-15
>15
>15
Unknown
Figure 20. Spray driver speeds (km/h) for application of herbicides. n = 232.
36
Fre
que
ncy
0
10
20
30
40
50
60
<20
20-50
51-100
101-250
251-500
>250
Unknown
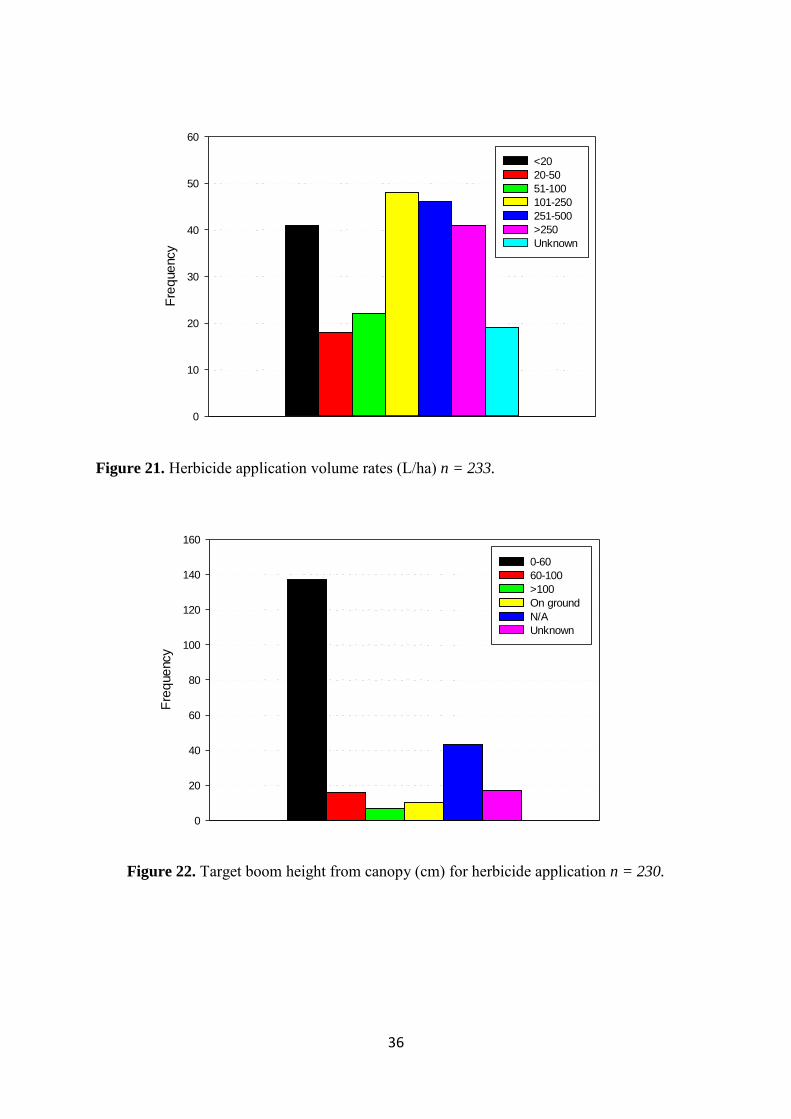
Figure 21. Herbicide application volume rates (L/ha) n = 233.
Fre
que
ncy
0
20
40
60
80
100
120
140
160
0-60
60-100
>100
On ground
N/A
Unknown
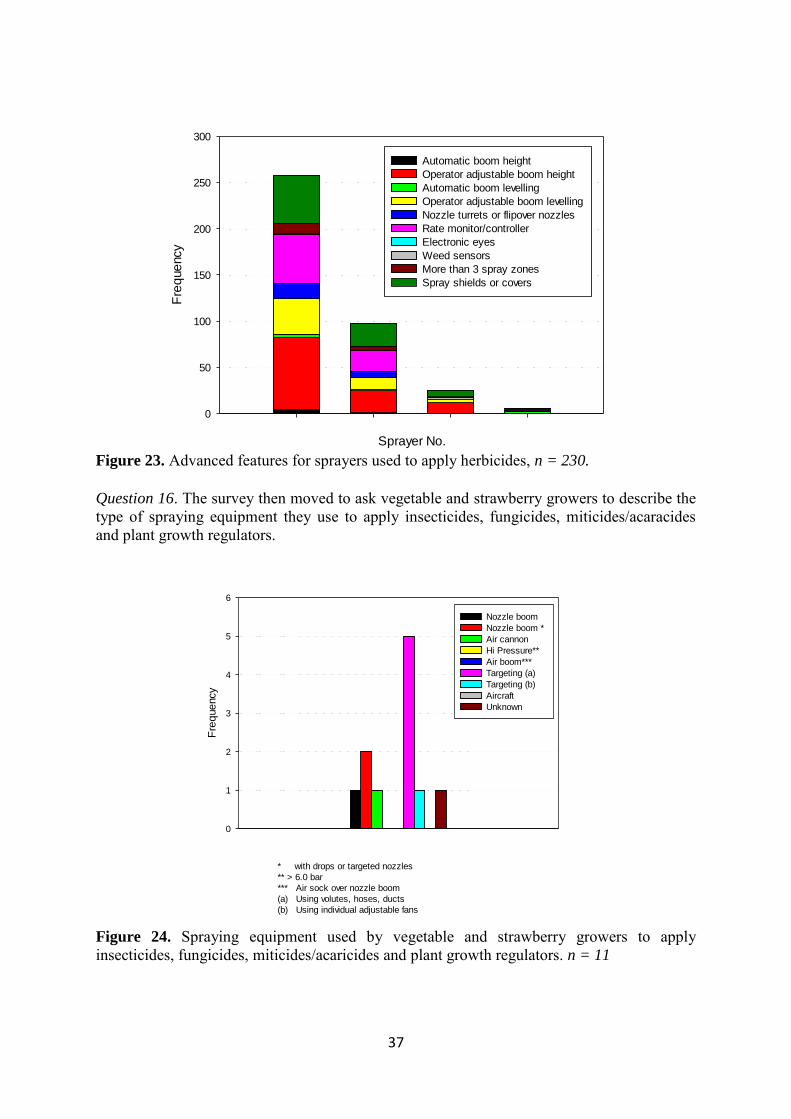
Figure 22. Target boom height from canopy (cm) for herbicide application n = 230.
37
Sprayer No.
Fre
que
ncy
0
50
100
150
200
250
300
Automatic boom height
Operator adjustable boom height
Automatic boom levelling
Operator adjustable boom levelling
Nozzle turrets or flipover nozzles
Rate monitor/controller
Electronic eyes
Weed sensors
More than 3 spray zones
Spray shields or covers
Figure 23. Advanced features for sprayers used to apply herbicides, n = 230.
Question 16. The survey then moved to ask vegetable and strawberry growers to describe the type of spraying equipment they use to apply insecticides, fungicides, miticides/acaracides and plant growth regulators.
Fre
que
ncy
0
1
2
3
4
5
6
Nozzle boom
Nozzle boom *
Air cannon
Hi Pressure**
Air boom***
Targeting (a)
Targeting (b)
Aircraft
Unknown
* with drops or targeted nozzles
** > 6.0 bar
*** Air sock over nozzle boom
(a) Using volutes, hoses, ducts
(b) Using individual adjustable fans
Figure 24. Spraying equipment used by vegetable and strawberry growers to apply insecticides, fungicides, miticides/acaricides and plant growth regulators. n = 11
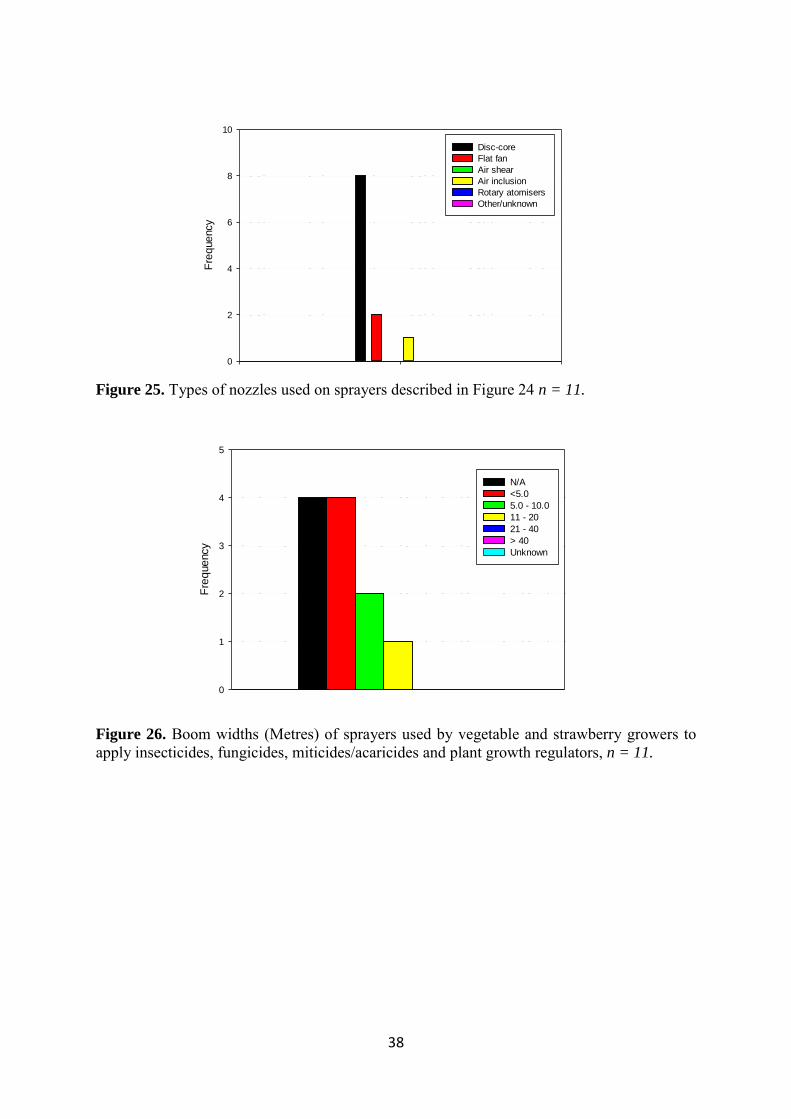
38
Fre
que
ncy
0
2
4
6
8
10
Disc-core
Flat fan
Air shear
Air inclusion
Rotary atomisers
Other/unknown
Figure 25. Types of nozzles used on sprayers described in Figure 24 n = 11.
Fre
que
ncy
0
1
2
3
4
5
N/A
<5.0
5.0 - 10.0
11 - 20
21 - 40
> 40
Unknown
Figure 26. Boom widths (Metres) of sprayers used by vegetable and strawberry growers to apply insecticides, fungicides, miticides/acaricides and plant growth regulators, n = 11.
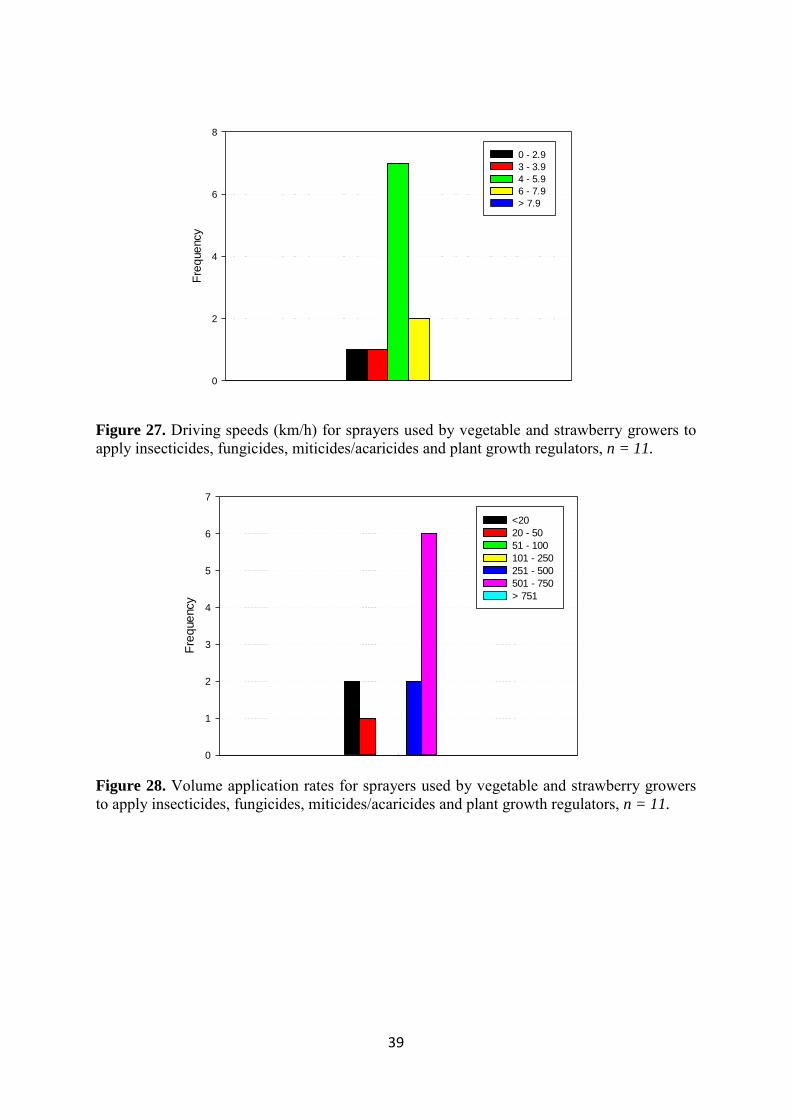
39
Fre
que
ncy
0
2
4
6
8
0 - 2.9
3 - 3.9
4 - 5.9
6 - 7.9
> 7.9
Figure 27. Driving speeds (km/h) for sprayers used by vegetable and strawberry growers to apply insecticides, fungicides, miticides/acaricides and plant growth regulators, n = 11.
Fre
que
ncy
0
1
2
3
4
5
6
7
<20
20 - 50
51 - 100
101 - 250
251 - 500
501 - 750
> 751
Figure 28. Volume application rates for sprayers used by vegetable and strawberry growers to apply insecticides, fungicides, miticides/acaricides and plant growth regulators, n = 11.
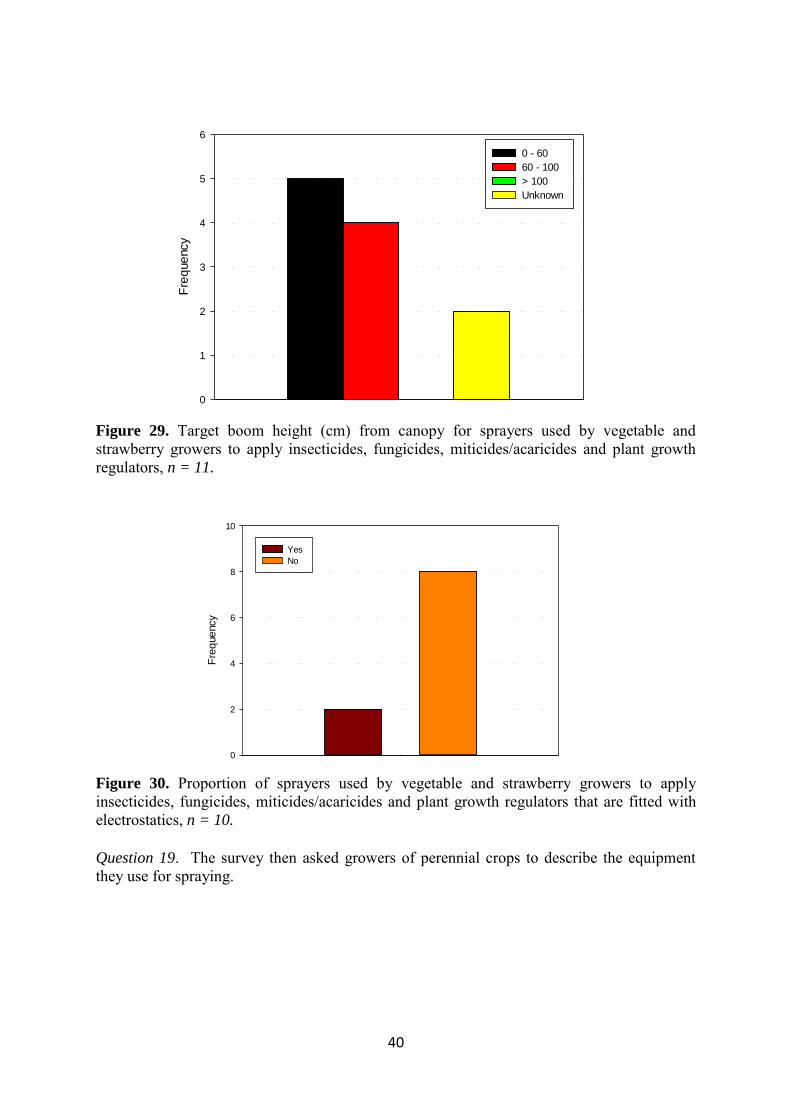
40
Fre
que
ncy
0
1
2
3
4
5
6
0 - 60
60 - 100
> 100
Unknown
Figure 29. Target boom height (cm) from canopy for sprayers used by vegetable and strawberry growers to apply insecticides, fungicides, miticides/acaricides and plant growth regulators, n = 11.
Fre
que
ncy
0
2
4
6
8
10
Yes
No
Figure 30. Proportion of sprayers used by vegetable and strawberry growers to apply insecticides, fungicides, miticides/acaricides and plant growth regulators that are fitted with electrostatics, n = 10.
Question 19. The survey then asked growers of perennial crops to describe the equipment they use for spraying.
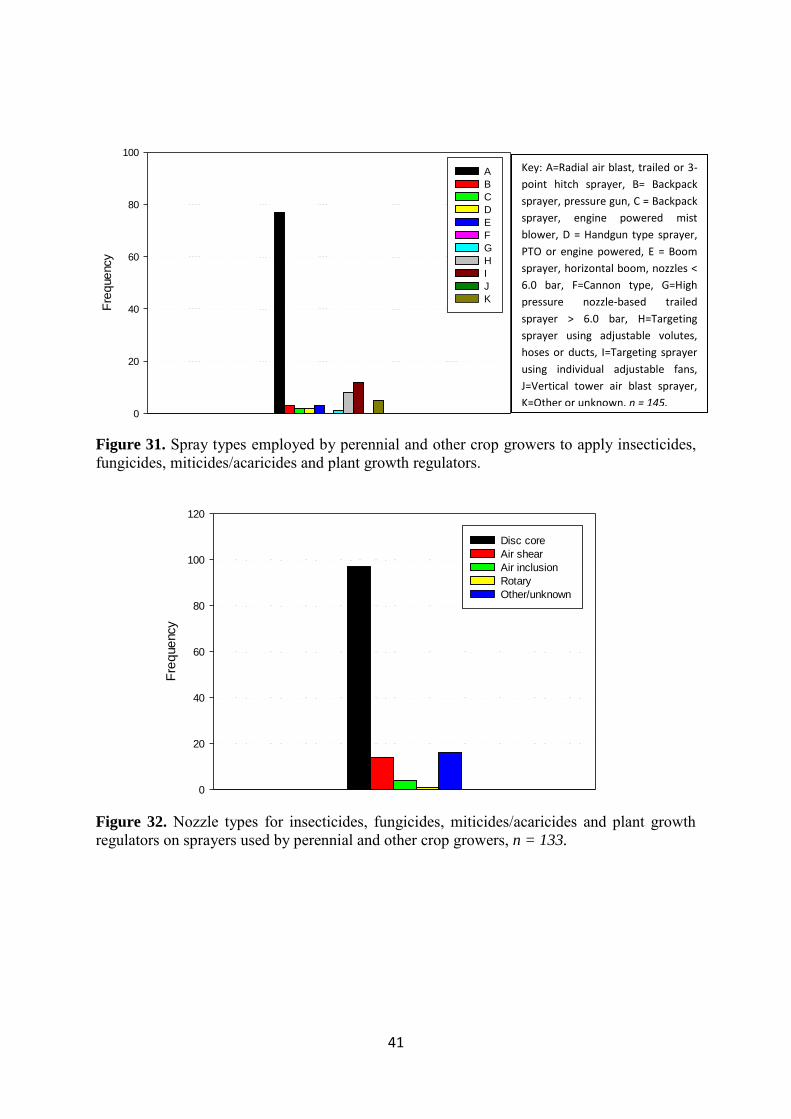
41
F
req
ue
ncy
0
20
40
60
80
100
A
B
C
D
E
F
G
H
I
J
K
Figure 31. Spray types employed by perennial and other crop growers to apply insecticides, fungicides, miticides/acaricides and plant growth regulators.
Fre
que
ncy
0
20
40
60
80
100
120
Disc core
Air shear
Air inclusion
Rotary
Other/unknown
Figure 32. Nozzle types for insecticides, fungicides, miticides/acaricides and plant growth regulators on sprayers used by perennial and other crop growers, n = 133.
Key: A=Radial air blast, trailed or 3-
point hitch sprayer, B= Backpack
sprayer, pressure gun, C = Backpack
sprayer, engine powered mist
blower, D = Handgun type sprayer,
PTO or engine powered, E = Boom
sprayer, horizontal boom, nozzles <
6.0 bar, F=Cannon type, G=High
pressure nozzle-based trailed
sprayer > 6.0 bar, H=Targeting
sprayer using adjustable volutes,
hoses or ducts, I=Targeting sprayer
using individual adjustable fans,
J=Vertical tower air blast sprayer,
K=Other or unknown. n = 145.
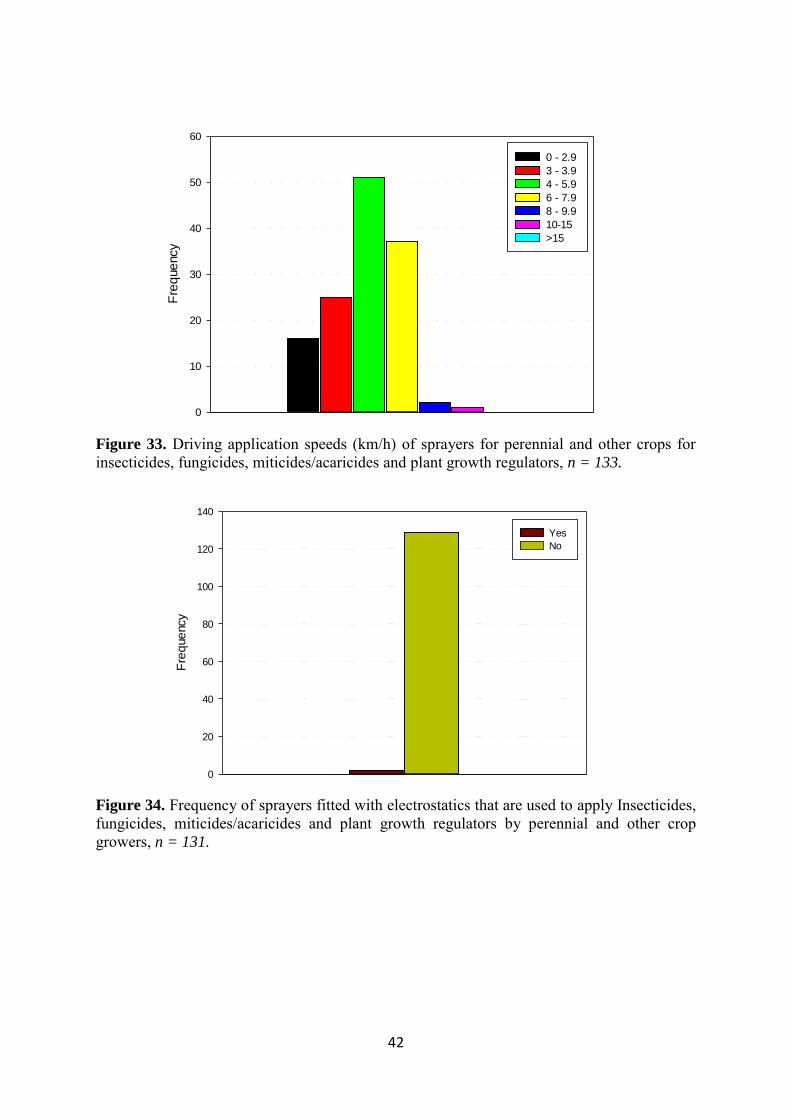
42
Fre
que
ncy
0
10
20
30
40
50
60
0 - 2.9
3 - 3.9
4 - 5.9
6 - 7.9
8 - 9.9
10-15
>15
Figure 33. Driving application speeds (km/h) of sprayers for perennial and other crops for insecticides, fungicides, miticides/acaricides and plant growth regulators, n = 133.
Fre
que
ncy
0
20
40
60
80
100
120
140
Yes
No
Figure 34. Frequency of sprayers fitted with electrostatics that are used to apply Insecticides, fungicides, miticides/acaricides and plant growth regulators by perennial and other crop growers, n = 131.
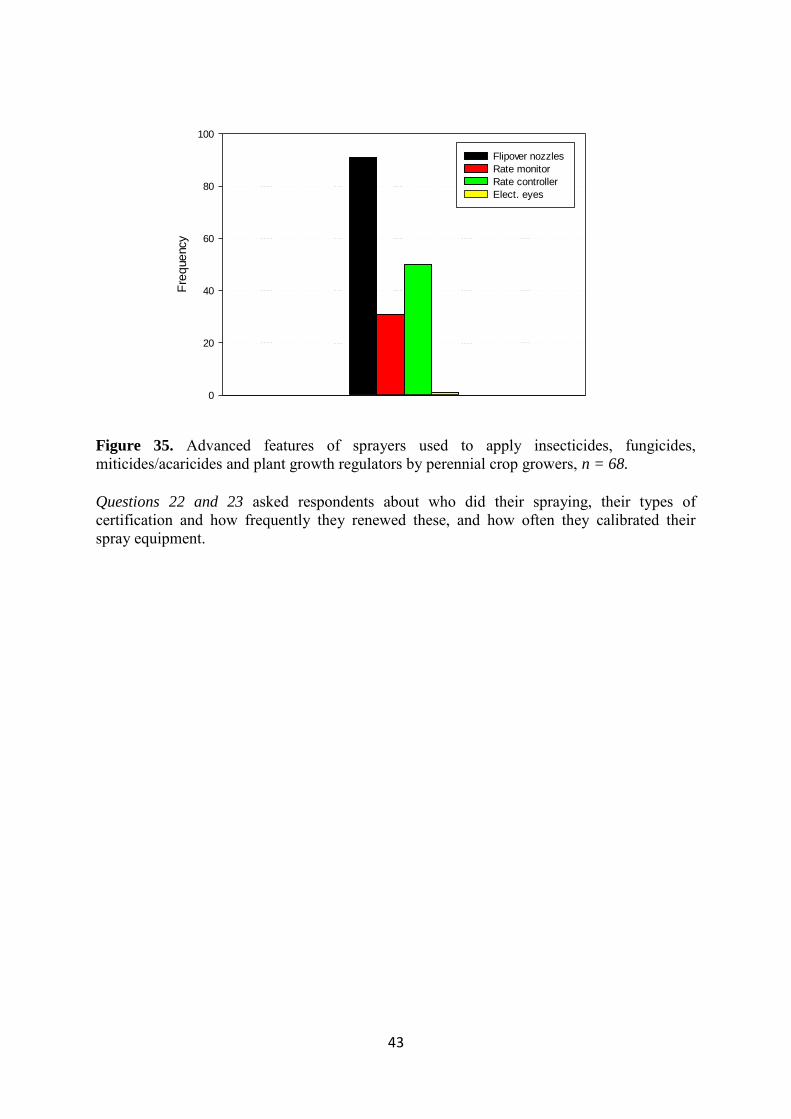
43
Fre
que
ncy
0
20
40
60
80
100
Flipover nozzles
Rate monitor
Rate controller
Elect. eyes
Figure 35. Advanced features of sprayers used to apply insecticides, fungicides, miticides/acaricides and plant growth regulators by perennial crop growers, n = 68.
Questions 22 and 23 asked respondents about who did their spraying, their types of certification and how frequently they renewed these, and how often they calibrated their spray equipment.

44
Owne
r, ce
rtifie
d ap
plicat
or
Owne
r, no
t cer
tified
applicat
or
Farm
em
ploy
ees,
cer
tified
applicat
ors
Farm
em
ploy
ees,
non
- cer
tified
applicat
ors,
skille
d
Farm
em
ploy
ees,
non
-cer
tified
applicat
ors,
uns
kille
d
Farm
em
ploy
ees
unde
r the
sup
ervis
ion
of a
cer
tified
applicat
or
Con
tract
or/c
usto
m a
pplic
ator
Oth
er0
20
40
60
80
100
120
140
Figure 36. Question 22 asked "Who applies the pesticides on your farm? Check all that apply. n = 180. A high number (82) of respondents skipped this question

45
CHEMCERT SMARTtrain ACDC None Other
0
20
40
60
80
100
120
140
160
Figure 37. Question 23 asked respondents to indicate what their "current" training and accreditation they collectively held, n = 191.
Nev
er
1 ye
ar
2 ye
ars
3 ye
ars
4 ye
ars
5 ye
ars
Mor
e th
an 5
yea
rs
Don
't kn
ow
Fre
que
ncy
0
20
40
60
80
100
120
Figure 38. Following on from Question 23 (Figure 38 above) respondents were asked how often they renew their certification, n = 180.
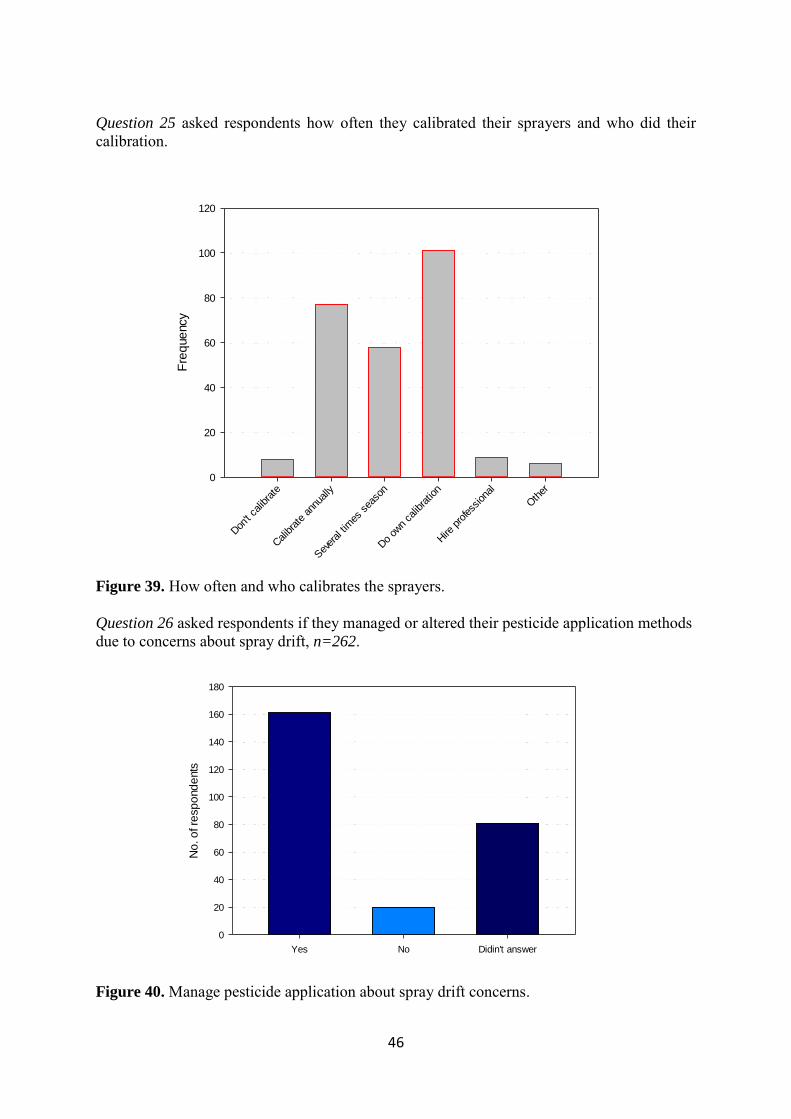
46
Question 25 asked respondents how often they calibrated their sprayers and who did their calibration.
Don
't ca
libra
te
Calibra
te a
nnua
lly
Sev
eral ti
mes
sea
son
Do
own
calib
ratio
n
Hire
pro
fess
iona
l
Oth
er
Fre
que
ncy
0
20
40
60
80
100
120
Figure 39. How often and who calibrates the sprayers. Question 26 asked respondents if they managed or altered their pesticide application methods due to concerns about spray drift, n=262.
Yes No Didin't answer
No
. o
f re
sp
ond
ents
0
20
40
60
80
100
120
140
160
180
Figure 40. Manage pesticide application about spray drift concerns.
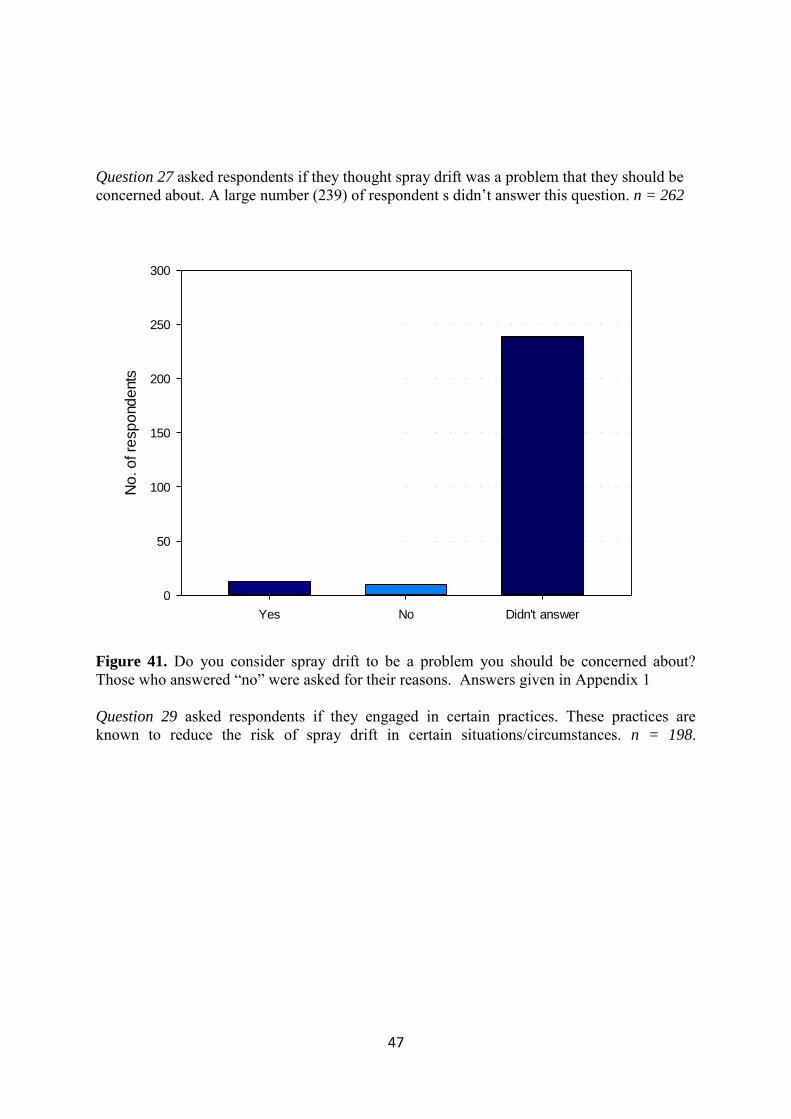
47
Question 27 asked respondents if they thought spray drift was a problem that they should be concerned about. A large number (239) of respondent s didn’t answer this question. n = 262
Yes No Didn't answer
No
. o
f re
sp
ond
ents
0
50
100
150
200
250
300
Figure 41. Do you consider spray drift to be a problem you should be concerned about? Those who answered “no” were asked for their reasons. Answers given in Appendix 1
Question 29 asked respondents if they engaged in certain practices. These practices are known to reduce the risk of spray drift in certain situations/circumstances. n = 198.
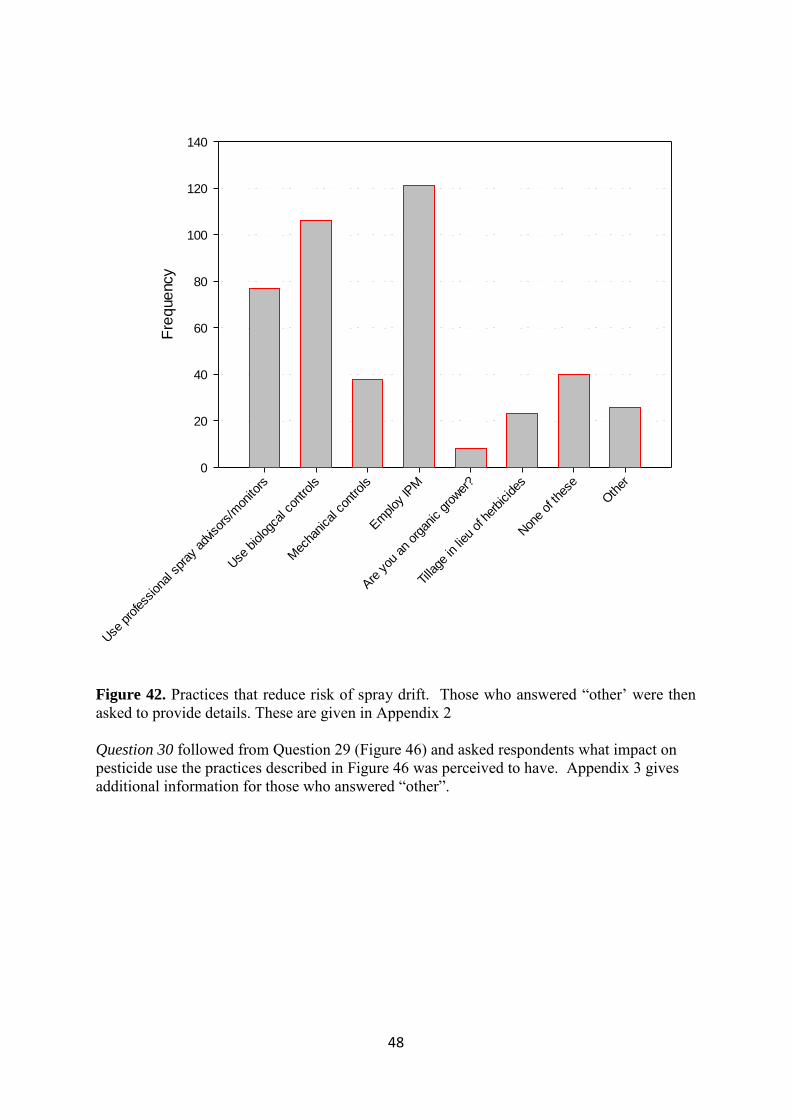
48
Use
pro
fess
iona
l spr
ay a
dvisor
s/m
onito
rs
Use
biologc
al c
ontro
ls
Mec
hanica
l con
trols
Em
ploy
IPM
Are
you
an
orga
nic
grow
er?
Tilla
ge in
lieu
of h
erbicide
s
Non
e of th
ese
Oth
er
Fre
que
ncy
0
20
40
60
80
100
120
140
Figure 42. Practices that reduce risk of spray drift. Those who answered “other’ were then asked to provide details. These are given in Appendix 2 Question 30 followed from Question 29 (Figure 46) and asked respondents what impact on pesticide use the practices described in Figure 46 was perceived to have. Appendix 3 gives additional information for those who answered “other”.
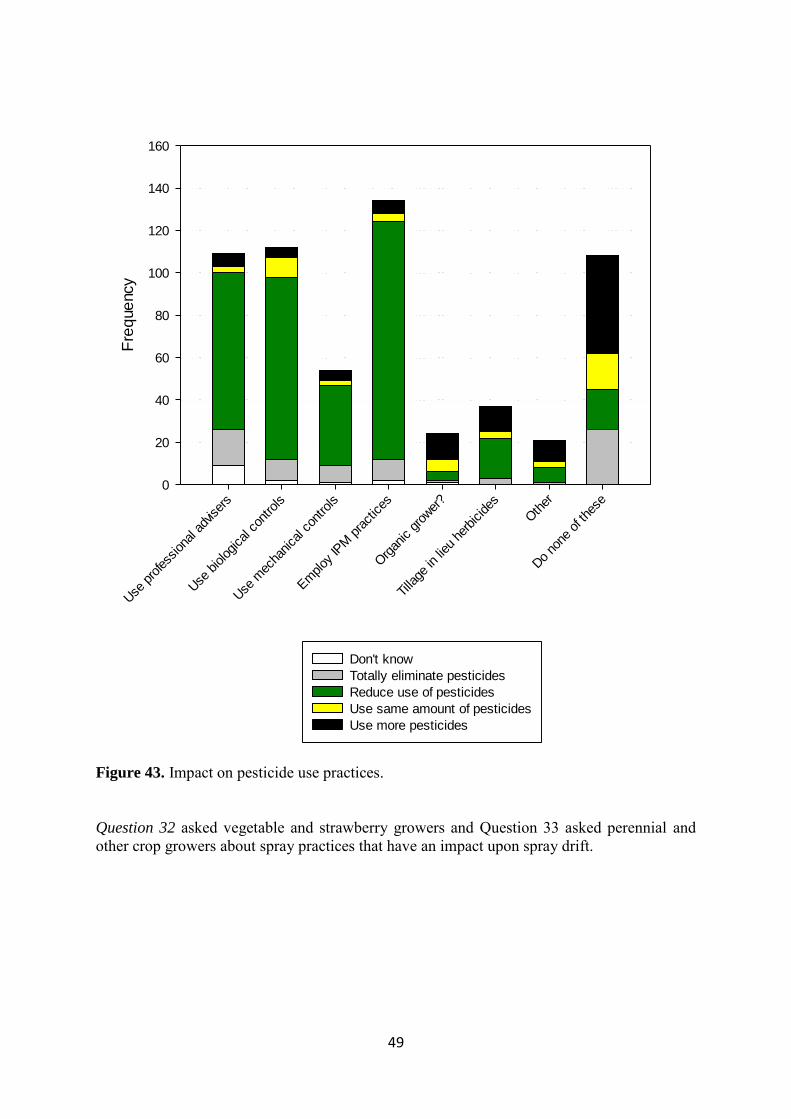
49
Use
pro
fess
iona
l adv
iser
s
Use
biologica
l con
trols
Use
mec
hanica
l con
trols
Em
ploy
IPM
pra
ctices
Org
anic g
rower
?
Tilla
ge in
lieu
her
bicide
s
Oth
er
Do
none
of t
hese
Fre
que
ncy
0
20
40
60
80
100
120
140
160
Don't know
Totally eliminate pesticides
Reduce use of pesticides
Use same amount of pesticides
Use more pesticides
Figure 43. Impact on pesticide use practices.
Question 32 asked vegetable and strawberry growers and Question 33 asked perennial and other crop growers about spray practices that have an impact upon spray drift.

50
Coa
rse
drop
lets
or l
arge
r
Avo
id w
inds
> 1
5 km
h
Avo
id w
inds
< 3
km
h
Low b
oom
hts
(< 6
0 cm
)
Use
shielde
d bo
oms
Use
she
lter b
elts
/hed
ges
Use
drift c
ontro
l adjuv
ants
Net
ting
or a
rtific
ial b
arrie
rs
Fre
que
ncy
0
2
4
6
8
10
12
14
16
Figure 44. Vegetable and strawberry growers were asked about spray practices that are known to impact spray drift.
Coa
rse
drop
lets
or l
arge
r
Avo
id w
inds
> 1
5 km
h
Avo
id w
inds
< 3
km
h
Tower
or t
arge
ting
spra
yers
Use
she
lter b
elts
/hed
ges
Dire
ct s
pray
inwar
ds
Use
tunn
el o
r rec
yclin
g sp
raye
rs
Use
elect
rost
atic c
harg
ing
Elect
ronic
eye
syst
ems
Drift c
ontro
l adjuv
ants
Net
ting
or a
rtific
ial b
arrie
rs
Oth
er
Fre
que
ncy
0
20
40
60
80
100
120
140
160
Figure 45. Perennial and other crop growers were asked about spray practices that are known to impact spray drift.
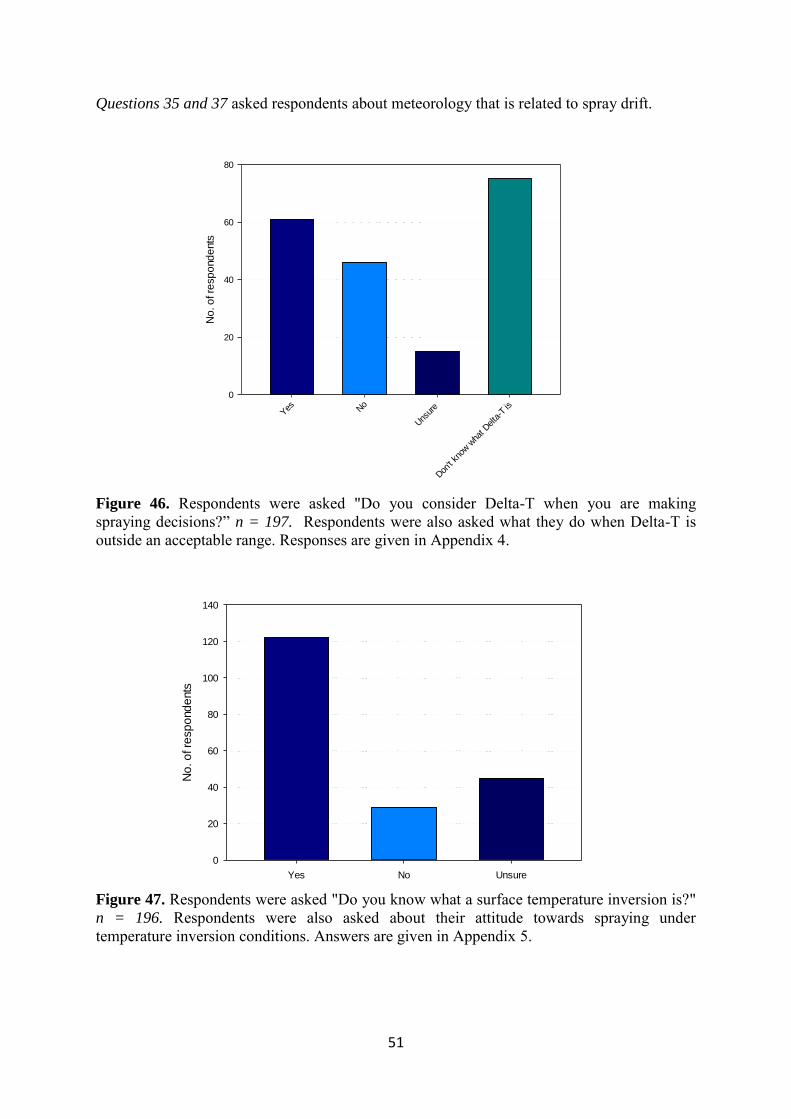
51
Questions 35 and 37 asked respondents about meteorology that is related to spray drift.
Yes N
o
Uns
ure
Don
't kn
ow w
hat D
elta
-T is
No
. o
f re
sp
ond
ents
0
20
40
60
80
Figure 46. Respondents were asked "Do you consider Delta-T when you are making spraying decisions?” n = 197. Respondents were also asked what they do when Delta-T is outside an acceptable range. Responses are given in Appendix 4.
Yes No Unsure
No
. o
f re
sp
ond
ents
0
20
40
60
80
100
120
140
Figure 47. Respondents were asked "Do you know what a surface temperature inversion is?" n = 196. Respondents were also asked about their attitude towards spraying under temperature inversion conditions. Answers are given in Appendix 5.

52
Not
awar
e of a
ny s
ensitiv
e ar
eas
Sen
sitiv
e cr
ops
Place
s whe
re p
eople
live,
wor
k or
play
Roa
ds
Ope
n W
ater
Wet
land
or r
ipar
ian
area
s
Aqu
acultu
re
Sen
sitiv
e sp
ecies
or e
nviro
nmen
tal fea
ture
s
Oth
er
Fre
que
ncy
0
20
40
60
80
100
120
140
Figure 48. Respondents were asked if there were any pesticide-sensitive areas near their crops, n = 185.
Yes No Unsure
No
. o
f re
sp
ond
ents
0
20
40
60
80
100
120
140
160
180
Figure 49. Respondents were asked if they had experienced any drift damage. n = 194. Those who answered “yes” were asked about the nature and extent of the damage and if it was reported and how it was resolved. Answers are given in Appendix 6.

53
Yes No Unsure
No
. o
f re
sp
ond
ents
0
20
40
60
80
100
120
140
160
180
200
Figure 50. Respondents were asked if they had received complaints about spray drift from their direct neighbours, n = 194.
Yes No
No
. o
f re
sp
ond
ents
0
50
100
150
200
Figure 51. Respondents were asked if they had received spray drift from parties other than their direct neighbours, n = 194.

54
No
Occ
asio
nally
Onl
y in
sen
sitiv
e/do
wnwin
d...
Regul
arly
Alway
s
N/A d
on't
spra
y
Oth
er
No
. of r
esp
ond
ent
s
0
20
40
60
80
100
120
Figure 52. Respondents were asked if they notify their neighbours in advance of their pesticide applications, n = 194.
Yes No Don't know
No
. of r
esp
ond
ent
s
0
20
40
60
80
100
120
140
160
180
Figure 53. Respondents were asked if local authorities had enacted any zoning that affects how they apply pesticides, n = 194.
Table 7. Statistics on farm size (actual area farmed last year). Units are hectares, n = 193.
Minimum Maximum Median 25th
percentile 50th
percentile 0.5 12000 18.0 7.75 50.0
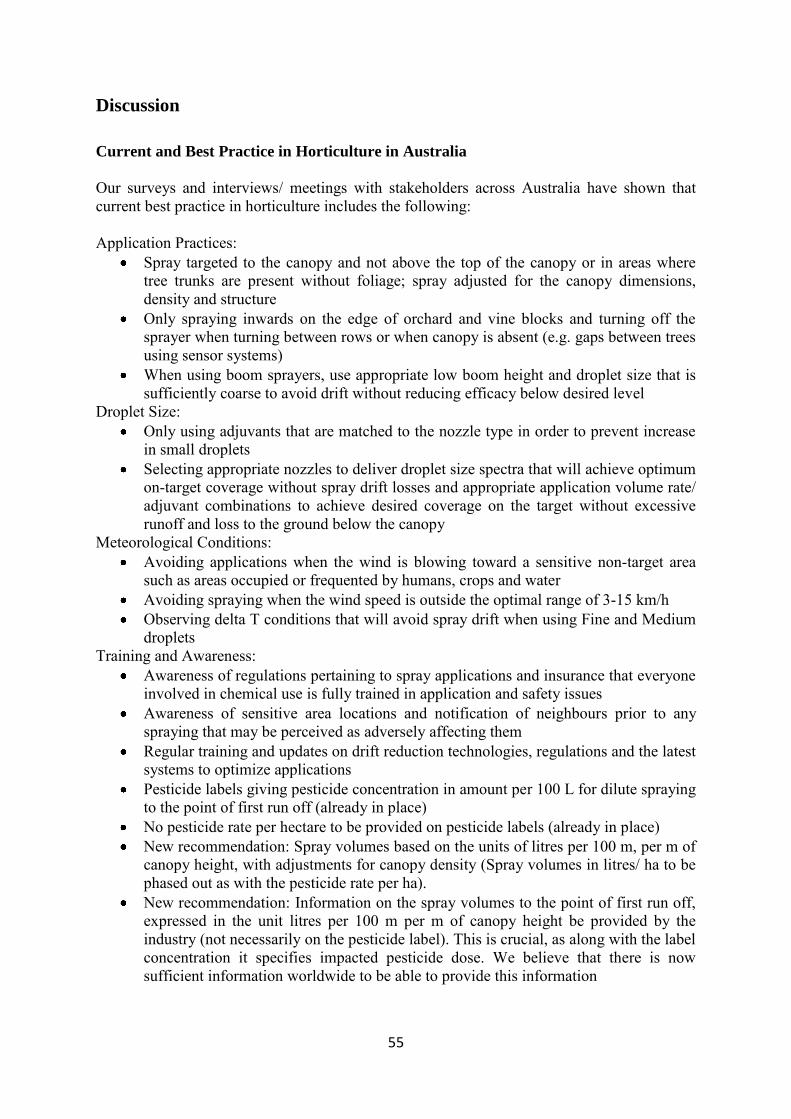
55
Discussion
Current and Best Practice in Horticulture in Australia
Our surveys and interviews/ meetings with stakeholders across Australia have shown that current best practice in horticulture includes the following: Application Practices:
Spray targeted to the canopy and not above the top of the canopy or in areas where tree trunks are present without foliage; spray adjusted for the canopy dimensions, density and structure
Only spraying inwards on the edge of orchard and vine blocks and turning off the sprayer when turning between rows or when canopy is absent (e.g. gaps between trees using sensor systems)
When using boom sprayers, use appropriate low boom height and droplet size that is sufficiently coarse to avoid drift without reducing efficacy below desired level
Droplet Size: Only using adjuvants that are matched to the nozzle type in order to prevent increase
in small droplets Selecting appropriate nozzles to deliver droplet size spectra that will achieve optimum
on-target coverage without spray drift losses and appropriate application volume rate/ adjuvant combinations to achieve desired coverage on the target without excessive runoff and loss to the ground below the canopy
Meteorological Conditions: Avoiding applications when the wind is blowing toward a sensitive non-target area
such as areas occupied or frequented by humans, crops and water Avoiding spraying when the wind speed is outside the optimal range of 3-15 km/h Observing delta T conditions that will avoid spray drift when using Fine and Medium
droplets Training and Awareness:
Awareness of regulations pertaining to spray applications and insurance that everyone involved in chemical use is fully trained in application and safety issues
Awareness of sensitive area locations and notification of neighbours prior to any spraying that may be perceived as adversely affecting them
Regular training and updates on drift reduction technologies, regulations and the latest systems to optimize applications
Pesticide labels giving pesticide concentration in amount per 100 L for dilute spraying to the point of first run off (already in place)
No pesticide rate per hectare to be provided on pesticide labels (already in place) New recommendation: Spray volumes based on the units of litres per 100 m, per m of
canopy height, with adjustments for canopy density (Spray volumes in litres/ ha to be phased out as with the pesticide rate per ha).
New recommendation: Information on the spray volumes to the point of first run off, expressed in the unit litres per 100 m per m of canopy height be provided by the industry (not necessarily on the pesticide label). This is crucial, as along with the label concentration it specifies impacted pesticide dose. We believe that there is now sufficient information worldwide to be able to provide this information
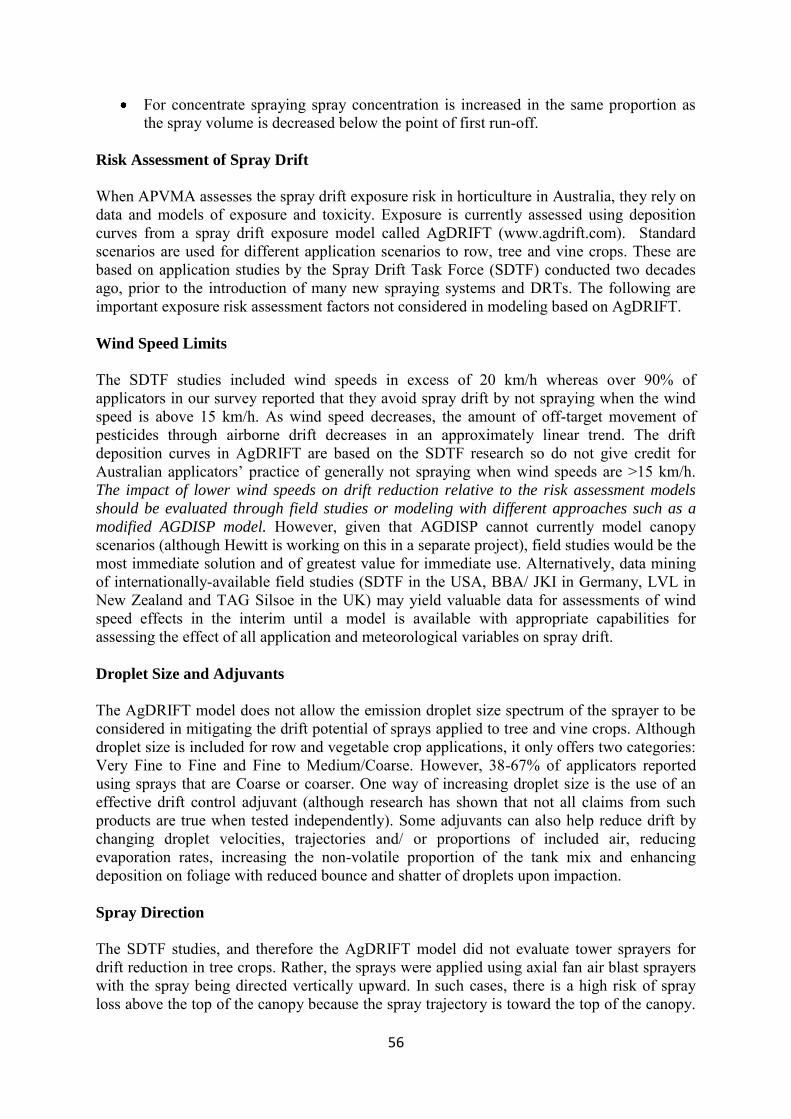
56
For concentrate spraying spray concentration is increased in the same proportion as the spray volume is decreased below the point of first run-off.
Risk Assessment of Spray Drift
When APVMA assesses the spray drift exposure risk in horticulture in Australia, they rely on data and models of exposure and toxicity. Exposure is currently assessed using deposition curves from a spray drift exposure model called AgDRIFT (www.agdrift.com). Standard scenarios are used for different application scenarios to row, tree and vine crops. These are based on application studies by the Spray Drift Task Force (SDTF) conducted two decades ago, prior to the introduction of many new spraying systems and DRTs. The following are important exposure risk assessment factors not considered in modeling based on AgDRIFT. Wind Speed Limits
The SDTF studies included wind speeds in excess of 20 km/h whereas over 90% of applicators in our survey reported that they avoid spray drift by not spraying when the wind speed is above 15 km/h. As wind speed decreases, the amount of off-target movement of pesticides through airborne drift decreases in an approximately linear trend. The drift deposition curves in AgDRIFT are based on the SDTF research so do not give credit for Australian applicators’ practice of generally not spraying when wind speeds are >15 km/h. The impact of lower wind speeds on drift reduction relative to the risk assessment models
should be evaluated through field studies or modeling with different approaches such as a
modified AGDISP model. However, given that AGDISP cannot currently model canopy scenarios (although Hewitt is working on this in a separate project), field studies would be the most immediate solution and of greatest value for immediate use. Alternatively, data mining of internationally-available field studies (SDTF in the USA, BBA/ JKI in Germany, LVL in New Zealand and TAG Silsoe in the UK) may yield valuable data for assessments of wind speed effects in the interim until a model is available with appropriate capabilities for assessing the effect of all application and meteorological variables on spray drift.
Droplet Size and Adjuvants
The AgDRIFT model does not allow the emission droplet size spectrum of the sprayer to be considered in mitigating the drift potential of sprays applied to tree and vine crops. Although droplet size is included for row and vegetable crop applications, it only offers two categories: Very Fine to Fine and Fine to Medium/Coarse. However, 38-67% of applicators reported using sprays that are Coarse or coarser. One way of increasing droplet size is the use of an effective drift control adjuvant (although research has shown that not all claims from such products are true when tested independently). Some adjuvants can also help reduce drift by changing droplet velocities, trajectories and/ or proportions of included air, reducing evaporation rates, increasing the non-volatile proportion of the tank mix and enhancing deposition on foliage with reduced bounce and shatter of droplets upon impaction. Spray Direction
The SDTF studies, and therefore the AgDRIFT model did not evaluate tower sprayers for drift reduction in tree crops. Rather, the sprays were applied using axial fan air blast sprayers with the spray being directed vertically upward. In such cases, there is a high risk of spray loss above the top of the canopy because the spray trajectory is toward the top of the canopy.

57
It is often safer to spray downwards and tower sprayers use such a direction. The SDTF did evaluate a wrap-around sprayer in vineyards where it was found to reduce drift exposure by approximately a factor of ten compared to conventional axial fan mistblowers. Barrier Vegetation
Vegetation surrounding a crop such as a shelterbelt serves as an important buffer to spray drift. 33-53% of survey respondents reported having such drift barriers around their sprayed crops. Studies have shown that drift reduction from such barriers is typically at least 90% (see “Drift Filtration by Natural and Artificial Collectors” by Hewitt at www.agdrift.com) and that although drift reductions decrease beyond a downwind distance of 8-10 x the height of the barrier, since most drift occurs at distances close to the edge of the sprayed area, the mitigation in spray drift exposure through interception and filtration of drift by barrier vegetation means that no-spray buffer zones can decrease. An excellent guide to the planting of such barriers in Queensland (Planning Guidelines: Separating Agricultural and Residential Land Uses) is available at www.nrm.qld.gov.au/land/planning/pdf/public/plan_guide.pdf. This describes the appropriate selection of tree and vegetation species for optimum porosity and barrier characteristics to maximize spray interception. Mixed species are preferable to reduce gaps in the barrier while providing various type of surface for optimization of droplet capture (especially from small and/ or hairy leaves). The height should be 1.5 times the spray release height. The University of Queensland provided data used to develop these dimensions and the data behind most spray drift management strategies in Australia, based on extensive drift studies and modeling over many years. Recent studies conducted by CPAS for PIRSA have shown that while foliated hedges can reduce spray drift exposure in South Australian vineyards by similar levels to previous studies, even artificial netting can offer significant drift reduction. The Queensland guidelines show that where a vegetative barrier is included in a buffer zone, the effective buffer zone width can be reduced by a factor of 7.5 times compared to a similar area without vegetation. In the UK, buffer zones for applications to tree crops can be reduced by various approaches such as reductions in dose rates, the use of low drift sprayers, and the use of vegetation barriers. For example, the Local Environmental Assessment for Pesticides scheme at www.pesticides.gov.uk explains how an 18 m buffer adjacent to tree crops can be reduced to 5-12 m by implementation of a barrier vegetation strip with or without other drift mitigation measures. The U.S. EPA Re-registration Eligibility Decision for Endosulfan recommended that a reasonable worst-case buffer width would be 30m, or a 9m vegetative barrier strip when using Endosulfan. Additional examples of barrier vegetation reducing the no-spray buffer zone requirements in spraying tree crops can be found at www.aenews.wsu.edu/July03AENews/July03AENews.htm. Many types of council in Australia have policies on buffers, such as the Adelaide Hills Council policy SER-01 “Buffers – An Essential Part of Rural Planning”. Spray Release Height
When spraying row crops, the height of the spray boom is important in affecting spray drift potential. Current AgDRIFT modeling does not offer a comprehensive range of boom height and droplet size combinations so should be replaced with a model covering the range applicable in Australia, i.e. 50 – 120 cm above the crop. Such an interim model was
developed by GRDC and UQ CPAS in 2011 and additional data for its extension are
available from Hewitt from field studies he conducted with Dr Tom Wolf in Canada in 2011.
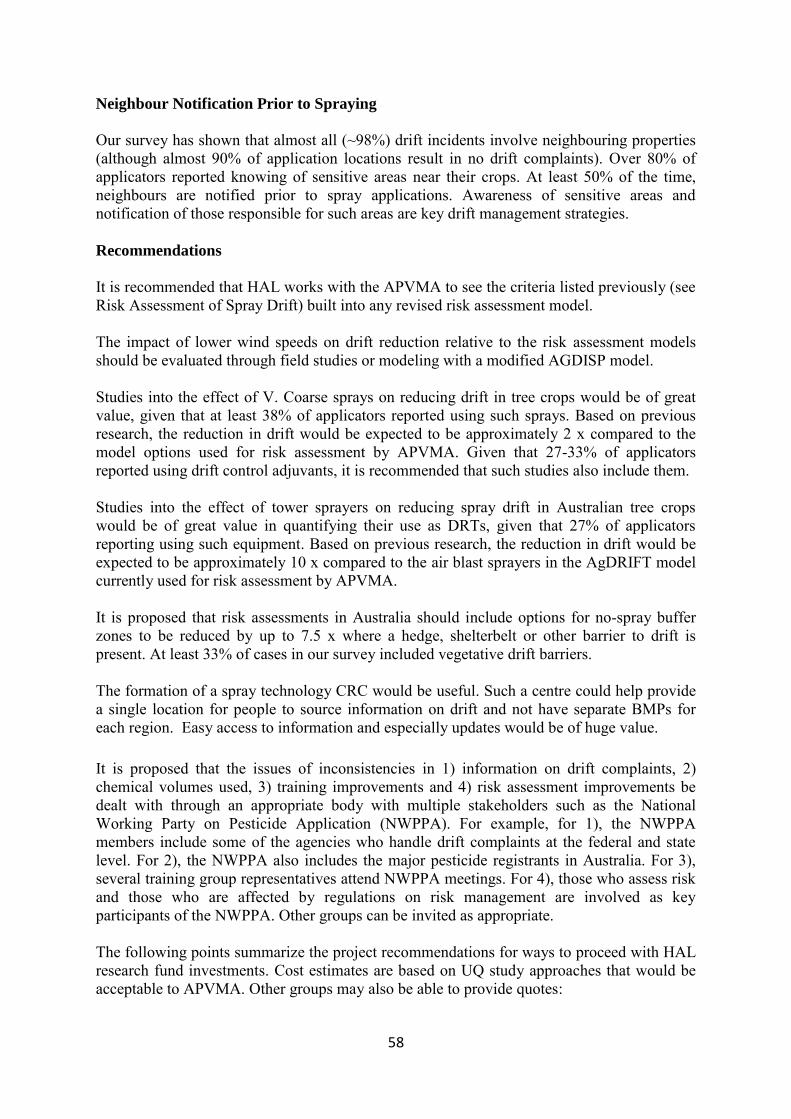
58
Neighbour Notification Prior to Spraying
Our survey has shown that almost all (~98%) drift incidents involve neighbouring properties (although almost 90% of application locations result in no drift complaints). Over 80% of applicators reported knowing of sensitive areas near their crops. At least 50% of the time, neighbours are notified prior to spray applications. Awareness of sensitive areas and notification of those responsible for such areas are key drift management strategies. Recommendations
It is recommended that HAL works with the APVMA to see the criteria listed previously (see Risk Assessment of Spray Drift) built into any revised risk assessment model. The impact of lower wind speeds on drift reduction relative to the risk assessment models should be evaluated through field studies or modeling with a modified AGDISP model. Studies into the effect of V. Coarse sprays on reducing drift in tree crops would be of great value, given that at least 38% of applicators reported using such sprays. Based on previous research, the reduction in drift would be expected to be approximately 2 x compared to the model options used for risk assessment by APVMA. Given that 27-33% of applicators reported using drift control adjuvants, it is recommended that such studies also include them. Studies into the effect of tower sprayers on reducing spray drift in Australian tree crops would be of great value in quantifying their use as DRTs, given that 27% of applicators reporting using such equipment. Based on previous research, the reduction in drift would be expected to be approximately 10 x compared to the air blast sprayers in the AgDRIFT model currently used for risk assessment by APVMA. It is proposed that risk assessments in Australia should include options for no-spray buffer zones to be reduced by up to 7.5 x where a hedge, shelterbelt or other barrier to drift is present. At least 33% of cases in our survey included vegetative drift barriers. The formation of a spray technology CRC would be useful. Such a centre could help provide a single location for people to source information on drift and not have separate BMPs for each region. Easy access to information and especially updates would be of huge value.
It is proposed that the issues of inconsistencies in 1) information on drift complaints, 2) chemical volumes used, 3) training improvements and 4) risk assessment improvements be dealt with through an appropriate body with multiple stakeholders such as the National Working Party on Pesticide Application (NWPPA). For example, for 1), the NWPPA members include some of the agencies who handle drift complaints at the federal and state level. For 2), the NWPPA also includes the major pesticide registrants in Australia. For 3), several training group representatives attend NWPPA meetings. For 4), those who assess risk and those who are affected by regulations on risk management are involved as key participants of the NWPPA. Other groups can be invited as appropriate. The following points summarize the project recommendations for ways to proceed with HAL research fund investments. Cost estimates are based on UQ study approaches that would be acceptable to APVMA. Other groups may also be able to provide quotes:
59
Precision sprayers for row crops: GRDC studies by UQ have shown that hooded sprayers can reduce drift by over 90%, even with finer sprays. A brand new technology is available in Australia from Micron Sprayers through Technigro which provides a “win-win” of allowing applicators to spray herbicides in between the crop row without any drift exposure to the crop through custom-designed hoods. Relatively fine sprays can be used to optimize coverage on the weeds because the hood prevents drift. Options allow for spray to be turned on and off using camera imaging so that spray is only used when weeds are actually present in an area of land (spot spraying). A second spray tank and nozzles on a boom adjacent to the hooded boom allows an applicator to also spray fungicides, insecticides or fertilizers on the actual crop at the same time as the herbicide is sprayed in between the rows. A field study to prove these approaches to drift elimination (the ultimate proof of drift elimination is that a grower can safely spray herbicide within centimeters of his own vegetable crop), chemical savings and improved efficiency could be conducted in the Lockyer Valley at The University of Queensland for approximately $80,000 - $100,000 depending on scope.
Sensor sprayers for vineyards and tree crops: Electronic eye systems are commercially available in the US but almost never used in Australia. These turn the sprayer on and off according to the canopy. This is incredibly useful for reducing spray use rates in half and also preventing drift when turning at the row ends. New sprayers are being developed by the report author in NZ which can sense the canopy and adjust the spray rate for the canopy density at a nozzle-by-nozzle level. This could be developed in and for Australian vine and tree crops for approx. $90,000.
Tower sprayers for tree crops: Orchard air blast sprayers direct the spray vertically which increases drift risk and inefficiently uses chemical. Tower spray equipment more effectively target the upper canopy regions as well as reducing spray drift potential. A study to prove this to APVMA and growers for Australian crops would cost approximately $90,000.
Bluff plate sprayer for field crops: A bluff plate sprayer developed at SARDI by Geoff Furness has shown that spray can be better targeted to field crops with lower drift potential and increased spray deposition. A field study to prove this system for canopy deposition and reduced drift potential would cost approximately $90,000.
Training course updates: UQ can work with training course providers to update the current certification courses with the latest technologies and approaches to drift management while improving chemical use in horticulture for approximately $30,000.
Electrostatic charge, adjuvant, turbulent spray and drop nozzle spraying systems: UQ can conduct on-target deposition and off-target drift field studies to compare conventional spray application systems in row, tree and vine crops with systems which add an electrostatic charge to the spray (e.g. ESS), adjuvants for reduction in “fine” droplets and evaporation rates (e.g. 2 of the best available emulsion systems), turbulence in the spray (e.g. rotary atomizer system) and optimized spray release position (e.g. drop nozzle for targeting underside leaf surfaces without spray drift risk in row crops). Field studies with these systems would cost approximately $170,000.
BMP development: UQ can develop BMPs for spraying row, tree and vine crops based on Australian scenarios for a cost of approximately $30,000.
The field studies described above would be written up in reports to HAL as well as being added to the spray drift risk assessment scenarios used by APVMA – i.e. they would be added to the AgDRIFT drift curve options to allow drift reduction technologies to be proven to reduce no-spray buffer zones by an estimated 50-99%. The 99% figure is not unreasonable
60
when several DRTs are linked together as part of a comprehensive strategy to greatly reduce pesticide use rates through improved targeting. Linking several field studies together will reduce the field study cost estimates. Acknowledgements
We would like to thank all the growers who took time to complete the survey. We recognize that their time is valuable and appreciate the very significant contribution they made to this study. We would also like to acknowledge the horticulture industry’s peak bodies for their assistance with the grower survey. In particular we thank Trevor Ranford for distributing the survey requests to the peak bodies and for sending out follow-up reminders on our behalf. Special thanks are due to all of the government and industry representatives who provided the information required to compile large sections of this report. Bibliography
Hewitt, A.J. (2004) Pesticide Chemistry and Adjuvants, Proc. International Conference on Pesticide
Application and Drift Management, Kona, HI.
Hewitt, A.J. (2008) Adjuvants for Application Optimization. Proc. Conf. American Society for
Testing and Materials, Miami, Florida. Hewitt, A.J., Woods, N. and Bagley, W.E. (2001) Adjuvant Effects on Aerial and Ground Sprays. NAAA/ ASAE Paper No. AA01-001. Las Vegas, NV. Hewitt, A.J., Miller, P.C.H., Dexter, R.W. and Bagley, W.E. (2001) The Influence of Tank Mix Adjuvants on the Formation, Characteristics and Drift Potential of Agricultural Sprays, International
Symposium on Adjuvants for Agrochemicals, Amsterdam, Netherlands.
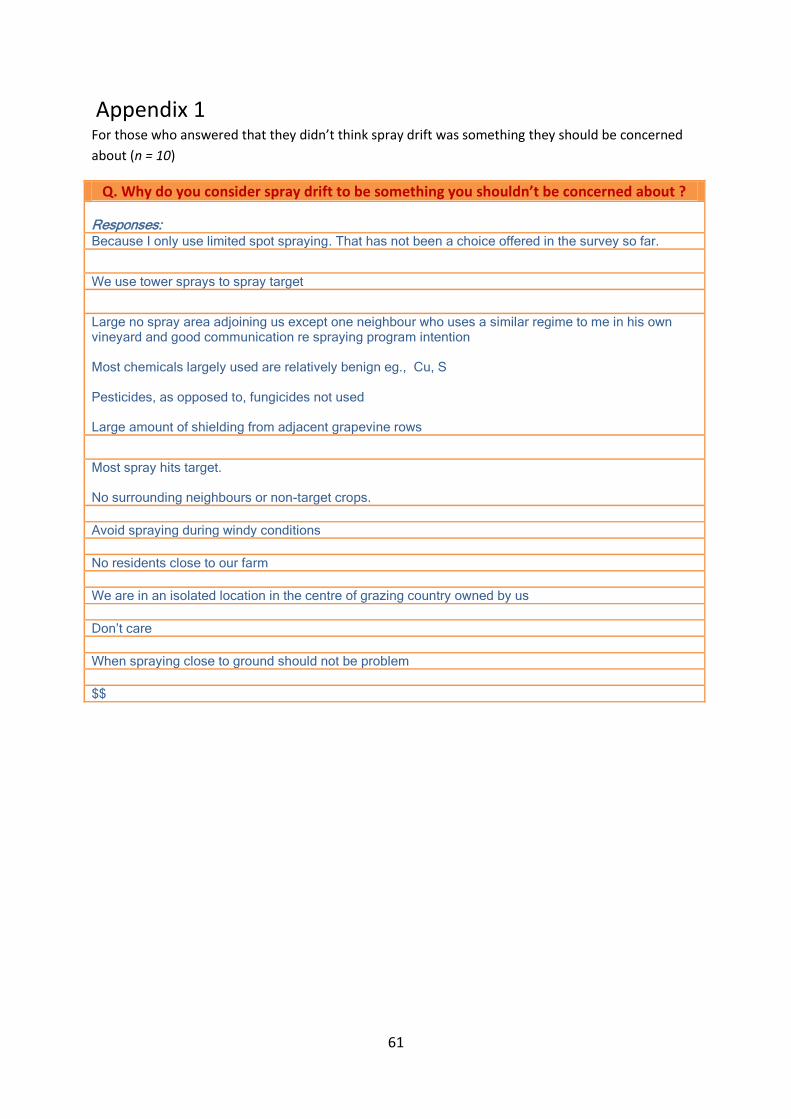
61
Appendix 1 For those who answered that they didn’t think spray drift was something they should be concerned
about (n = 10)
Q. Why do you consider spray drift to be something you shouldn’t be concerned about ? Responses: Because I only use limited spot spraying. That has not been a choice offered in the survey so far.
We use tower sprays to spray target Large no spray area adjoining us except one neighbour who uses a similar regime to me in his own vineyard and good communication re spraying program intention Most chemicals largely used are relatively benign eg., Cu, S Pesticides, as opposed to, fungicides not used Large amount of shielding from adjacent grapevine rows
Most spray hits target. No surrounding neighbours or non-target crops.
Avoid spraying during windy conditions
No residents close to our farm
We are in an isolated location in the centre of grazing country owned by us
Don’t care
When spraying close to ground should not be problem
$$
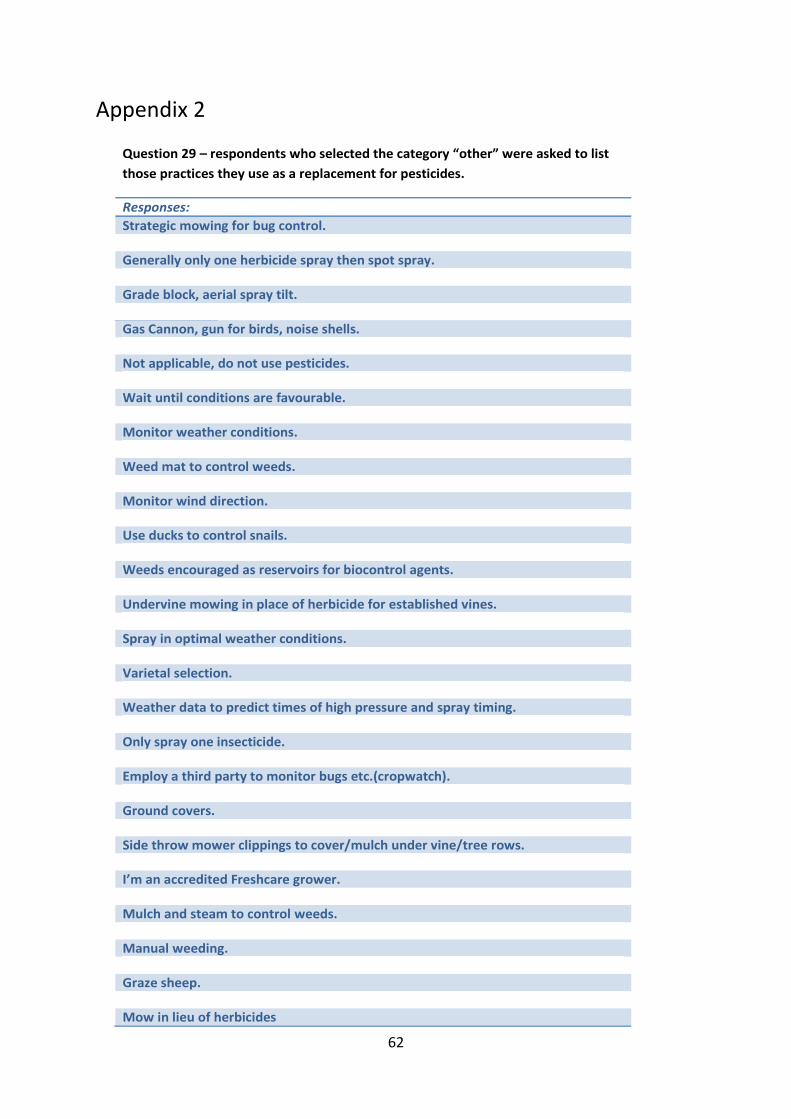
62
Appendix 2
Question 29 – respondents who selected the category “other” were asked to list
those practices they use as a replacement for pesticides.
Responses:
Strategic mowing for bug control. Generally only one herbicide spray then spot spray. Grade block, aerial spray tilt. Gas Cannon, gun for birds, noise shells. Not applicable, do not use pesticides. Wait until conditions are favourable. Monitor weather conditions. Weed mat to control weeds. Monitor wind direction. Use ducks to control snails. Weeds encouraged as reservoirs for biocontrol agents. Undervine mowing in place of herbicide for established vines. Spray in optimal weather conditions. Varietal selection. Weather data to predict times of high pressure and spray timing. Only spray one insecticide. Employ a third party to monitor bugs etc.(cropwatch). Ground covers. Side throw mower clippings to cover/mulch under vine/tree rows. I’m an accredited Freshcare grower. Mulch and steam to control weeds. Manual weeding. Graze sheep. Mow in lieu of herbicides

63
Appendix 3
Question 30 follow on: Do youuse any other practices not listed as a replacement for pesticide
applications.
Responses:
“No” (14 responses). Mowing, ground covers for beneficials. Cover crops, shake almonds to the ground Manipulate canopy – mechanical harvesting. Use burner for ephemeral weeds. Use paraffin oil. Ear wig baiting, not applied to trees. Graze sheep. Yes, encourage vertebrate insectivores, various cultural practices, minimise pruning, monitor weather to avoid unnecessary fungicide applications. Yes, hand chipping of weeds. Steam to control Weeds. This is a bit confusing. The previous questions appeared to apply to HERBICIDES but now we are talking pesticides which I believe to be a different group. We apply PESTICIDES to the olive groves using the hand-gun from the RTV method.. Strategic spraying when required. No blanket spraying. Rotating registered chemicals to minimise resistance. Pest models to better time applications. Ground covers. Apply crop mulching to suppress weeds and reduce fungal diseases. Mulching, hand weeding, steam weeding. Good orchard hygiene. Growers need to send produce under ICA31 scheme so it is not possible to reduce number of sprays of certain chemicals especially QFF and blueberry rust. Oil sprays. Keep weed growth under control, keep stock healthy, grow improved resistant varieties.
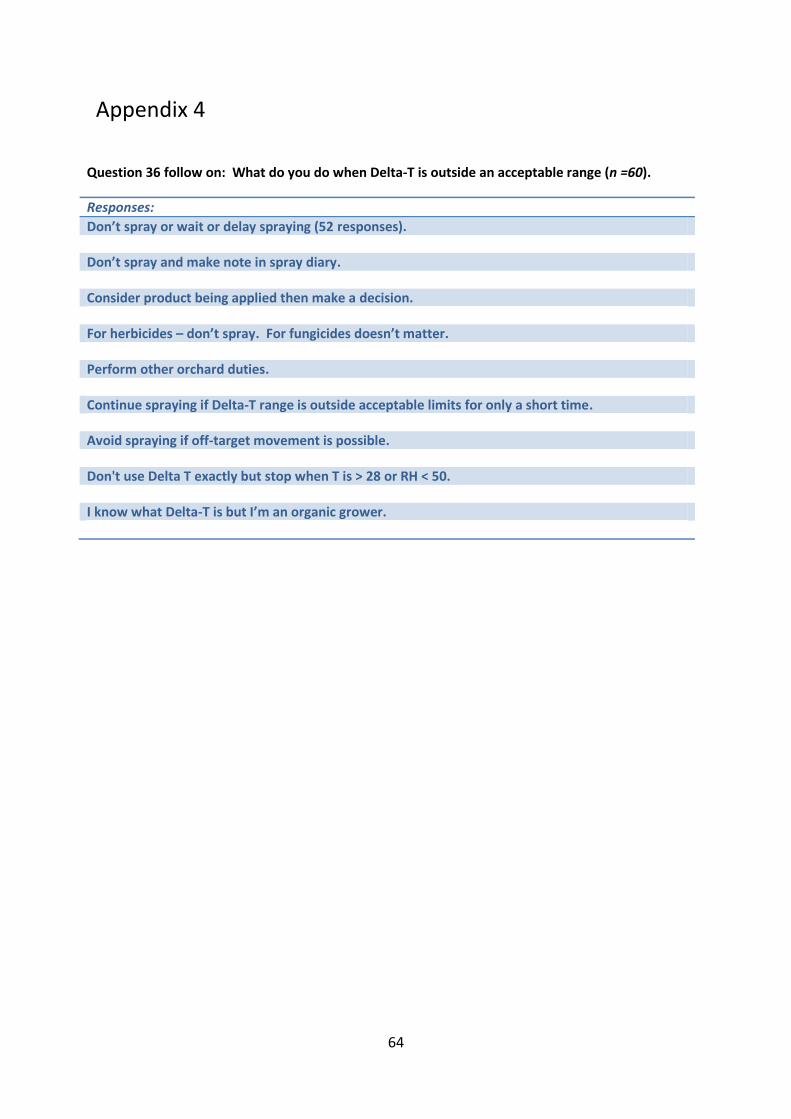
64
Appendix 4
Question 36 follow on: What do you do when Delta-T is outside an acceptable range (n =60).
Responses:
Don’t spray or wait or delay spraying (52 responses). Don’t spray and make note in spray diary. Consider product being applied then make a decision. For herbicides – don’t spray. For fungicides doesn’t matter. Perform other orchard duties. Continue spraying if Delta-T range is outside acceptable limits for only a short time. Avoid spraying if off-target movement is possible. Don't use Delta T exactly but stop when T is > 28 or RH < 50. I know what Delta-T is but I’m an organic grower.
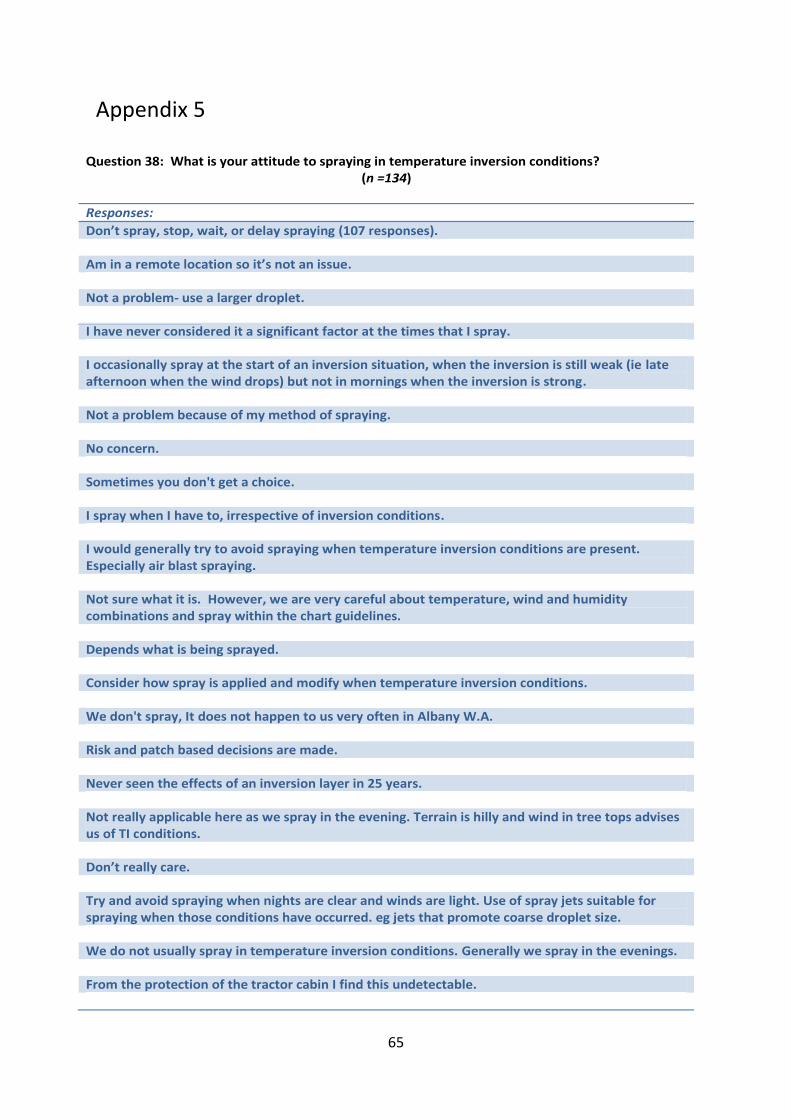
65
Appendix 5
Question 38: What is your attitude to spraying in temperature inversion conditions? (n =134)
Responses:
Don’t spray, stop, wait, or delay spraying (107 responses). Am in a remote location so it’s not an issue. Not a problem- use a larger droplet. I have never considered it a significant factor at the times that I spray. I occasionally spray at the start of an inversion situation, when the inversion is still weak (ie late afternoon when the wind drops) but not in mornings when the inversion is strong. Not a problem because of my method of spraying. No concern. Sometimes you don't get a choice. I spray when I have to, irrespective of inversion conditions. I would generally try to avoid spraying when temperature inversion conditions are present. Especially air blast spraying. Not sure what it is. However, we are very careful about temperature, wind and humidity combinations and spray within the chart guidelines. Depends what is being sprayed. Consider how spray is applied and modify when temperature inversion conditions. We don't spray, It does not happen to us very often in Albany W.A. Risk and patch based decisions are made. Never seen the effects of an inversion layer in 25 years. Not really applicable here as we spray in the evening. Terrain is hilly and wind in tree tops advises us of TI conditions. Don’t really care. Try and avoid spraying when nights are clear and winds are light. Use of spray jets suitable for spraying when those conditions have occurred. eg jets that promote coarse droplet size. We do not usually spray in temperature inversion conditions. Generally we spray in the evenings. From the protection of the tractor cabin I find this undetectable.

66
Appendix 6
Question 41: Describe the nature and extent of the damage. Did you report it? Was it resolved? (n = 34)
(Follows on from Question 40 - Have you experienced drift damage?)
Responses: Herbicide damage own operation.
Damage was fairly minor, no legal action taken. Wasn’t worth worrying about. Neighbour fumigated a large area and lifted the covers while wind was blowing in our direction. A large number of plants defoliated. We discussed this with our neighbour to be aware of what happened.
A neighbour spraying blackberries and chemical drift onto our crop. Neighbour made aware and no
further problems. During latest harvest observed limited tree damage in row adjoining neighbouring cropping property.
Reported damage to neighbour. Expect they will be more aware of danger in future. Years ago neighbour spraying chlorphos on windy day up wind of me which i think would have killed a
lot of my beneficial bugs in my citrus tree. Very minimal foliar damage, believed to be 2-4-D or similar. Many vineyards in the area found similar
damage. The issue was discussed within the region but outcome not known. Suspected damage from power line easement maintenance. Did not report it.. Leaf damage was visually evident from herbicide originating outside the vineyard and which left a distinctive pattern of damaged leaf growth. No economic loss experienced. Grapegrowers in area report existence of general leaf damage when it has occurred. Usually instances of such damage is spread amongst several vineyards in a pattern downwind of the likely area where the herbicide was sprayed. Contact with EPA has not been of use because of the difficulty they have with their limited resources to fully investigate and determine source when there is low level and widespread damage.
Herbicide damage, not reported. Possible ester damage from neighbouring broadacre summer weed control affecting winegrape planting. Completed chemical trespass report but did not monitor well enough to know exactly when the damage occurred and in what weather conditions etc - will monitor heavily this year as we were
affected by at least two chemical trespass incidents 2 months apart. 2,4-D on vines. Only slight. Foliar burn of native forest. Few Ha, increase droplet size. Rural residential neighbour applied ester formulation of 2,4-D in hot weather in a restricted zone. Damaged tree crops. Reported. Allowed formal investigation to proceed, then after discussion of issue, withdrew complaint. More of a problem with Herbicides 'bouncing' and affecting flowers and leaves on fruit trees. Problem solved by applying a small amount of summer oil to weed sprayer

67
Appendix 7
General comments – data mining
8 respondents said they had received drift complaints from their neighbours.
7 of the 8 knew what a temperature inversion was
5 of the 8 consider Delta-T in their decision making
6 of the 8 avoid winds > 15.0 kmh
3 of the 8 have shelterbelts
8 of the 8 had current accreditation (Chemcert)
5 of the 8 use radial airblast sprayers
8 of the 8 generally notified their neighbours in advance of spraying operations
8 of the 8 said they manage their pesticide application due to concerns about spray drift
8 of the 8 had not experienced spray drift damage themselves
2 of the 8 cases were officially investigated but no action was taken against any party
2 of the 8 respondents took additional measures to make their spraying operation safer
(installation of windsocks, implementation of a shelterbelt).
1 of the 8 cases was in an area where local authorities had enacted zoning for pesticide
applications.
77 respondents didn’t know what a surface temperature inversion was.
62 of the 77 had current chemical accreditation (60 with ChemCert, 2 with SMARTtrain)
76 respondents weren’t aware of the Delta-T concept.
61 of the 76 had current chemical accreditation.
Wind during spraying.
145 respondents said they didn’t spray in winds above 15 kmh but only 48 said they didn’t
spray in winds below 3 kmh.
Calibration
59 out of 249 respondents said they calibrate their sprayer(s) several times per season. All
except 2 respondents had current chemical accreditation
78 out of 249 respondents said they calibrate their sprayers annually. All but 6 of these had
current chemical accreditation.
20 out of 250 respondents said they did not manage or alter their pesticide applications due
to concerns about spray drift (but 11 of these 20 said spray drift was a problem they should
be concerned about)
9 out of the 20 were perennial crop growers. (7 of these use airblast sprayers)
1 out of the 20 was an almond grower who uses ULV, rotary atomisers and enviromist
equipment
1 out of the 20 was a cherry grower who uses a handgun sprayer
1 out of the 20 was a blueberry grower who did not describe the type of sprayer

68
Appendix 8 Survey respondents grouped by commodity
Commodity Number of
respondents
Almond 4 Apples 3 Avocado 3 Banana 1 Berries 20 Brassicas 3 Cherries 2 Citrus 13 Custard apples 2 Grapes 5 Kiwifruit 1 Legumes 1 Lychees 5 Macadamias 8 Nursery, cut flowers 12 Nuts 68 Olives 2 Passion fruit 1 Peaches 3 Persimmons 1 Potatoes 1 Raspberries 1 Stone fruit 55 Strawberries 1 Sweet corn 1 Table grapes 2 Tree crops 2 Vegetables 3 Vine crops 2 Wine grapes 21
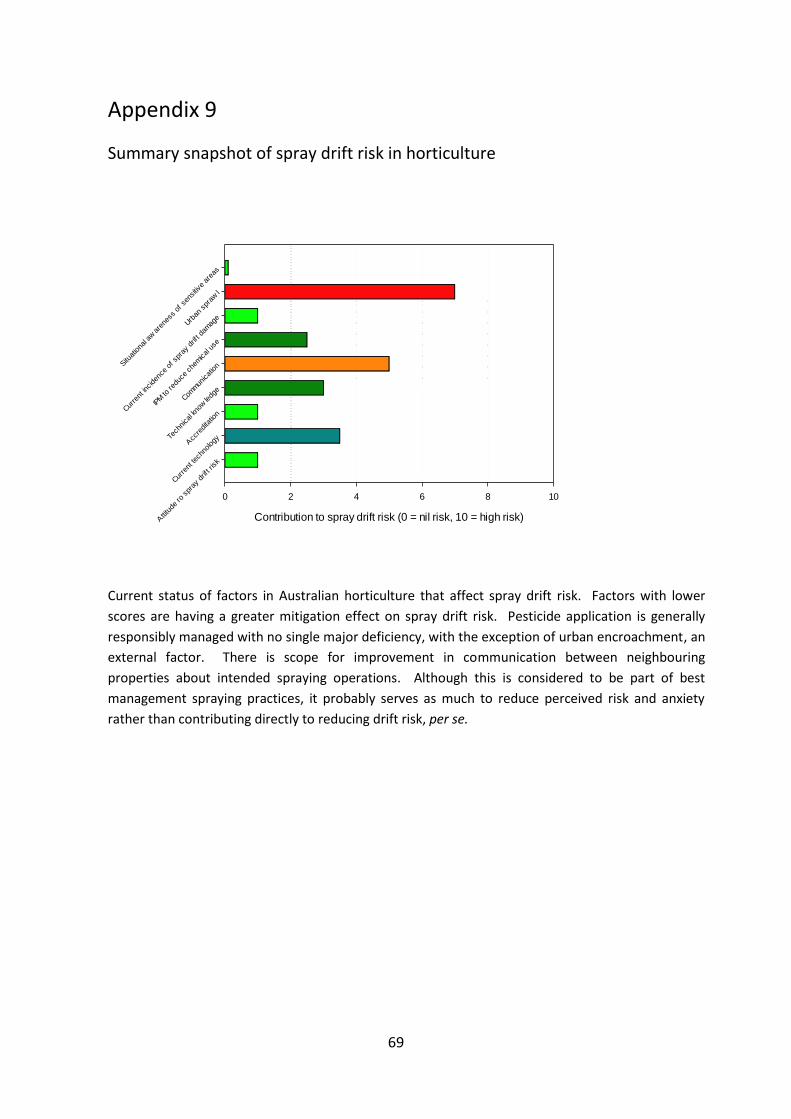
69
Appendix 9
Summary snapshot of spray drift risk in horticulture
Current status of factors in Australian horticulture that affect spray drift risk. Factors with lower
scores are having a greater mitigation effect on spray drift risk. Pesticide application is generally
responsibly managed with no single major deficiency, with the exception of urban encroachment, an
external factor. There is scope for improvement in communication between neighbouring
properties about intended spraying operations. Although this is considered to be part of best
management spraying practices, it probably serves as much to reduce perceived risk and anxiety
rather than contributing directly to reducing drift risk, per se.
Contribution to spray drift risk (0 = nil risk, 10 = high risk)
0 2 4 6 8 10
Attitu
de ro
spr
ay d
rift r
isk
Curre
nt te
chno
logyA
ccre
dita
tion
Tech
nica
l kno
wledg
eCom
mun
icat
ion
IPM to
redu
ce c
hemical u
se
Curre
nt in
cide
nce
of s
pray
drif
t dam
age
Urban
spr
awl
Situat
iona
l aw
aren
ess
of s
ensitiv
e ar
eas