Embed Size (px)
Citation preview

Horizons Managed Global Opportunities ETF(HGM, HGM.A:TSX)
Interim Report | June 30, 2016
www.HorizonsETFs.comInnovation is our capital. Make it yours.
ALPHA BENCHMARK BETAPRO
90412 - Horizons HGM.indd 1 2016-08-11 9:20 AM

ContentsMANAGEMENT REPORT OF FUND PERFORMANCE
Management Discussion of Fund Performance . . . . . . . . . . . . . . . . . . . . . 1
Financial Highlights . . . . . . . . . . . . . . . . . . . . . . . . . . . . . . . . . . . . . . . . . . . . . . . 6
Past Performance . . . . . . . . . . . . . . . . . . . . . . . . . . . . . . . . . . . . . . . . . . . . . . . . . 11
Summary of Investment Portfolio . . . . . . . . . . . . . . . . . . . . . . . . . . . . . . . . . 12
MANAGER’S RESPONSIBILITY FOR FINANCIAL REPORTING . . . . . . . . . . . . 14
FINANCIAL STATEMENTS
Statements of Financial Position . . . . . . . . . . . . . . . . . . . . . . . . . . . . . . . . . . 15
Statement of Comprehensive Income . . . . . . . . . . . . . . . . . . . . . . . . . . . . . 16
Statement of Changes in Financial Position . . . . . . . . . . . . . . . . . . . . . . . . 17
Statement of Cash Flows . . . . . . . . . . . . . . . . . . . . . . . . . . . . . . . . . . . . . . . . . . 18
Schedule of Investments . . . . . . . . . . . . . . . . . . . . . . . . . . . . . . . . . . . . . . . . . . 19
Notes to Financial Statements . . . . . . . . . . . . . . . . . . . . . . . . . . . . . . . . . . . . 21
90412 - Horizons HGM.indd 3 2016-08-11 9:20 AM
Letter from the Co-CEO:
So far, 2016 has been a road to recovery for North American investors, as equity markets continue to bounce back from the lows of late January. In fact, the Canadian equity market, up more than 8% year-to-date has been one of the best-performing developed equity markets in the world. Additionally, we have seen the price of crude oil stabilize which we believe has been a leading contributor to the recovery and strengthening of the Canadian dollar relative to the U.S. dollar, up approximately 7% since the beginning of 2016.
Overall, the first half of the year has been very successful for the North American ETF industry, with U.S. assets at US$2.2 trillion and Canadian ETF assets surpassing the CAD$100 billion mark in May. Equities and fixed income ETFs continue to make up the largest inflows for both Canada and the U.S.
For Horizons ETFs, in particular, this has been a year of new milestones. In April, we surpassed more than $6 billion in assets under management and have continued to watch our active and benchmark lineup of ETFs grow. In fact, the Horizons Cdn High Dividend Index ETF (“HXH”) has been one of the largest launches on the Canadian side of the border, acquiring more than $100 million in assets within its first week of launch.
With the regulatory landscape in North America, particularly Canada, shifting towards fee-based transparency, and fewer tax efficient products available to the retail investor, we’ve focused on expanding our line-up of Total Return Index (TRI) ETFs. This includes the launch of HXH and the Horizons Nasdaq-100® Index ETF (“HXQ”), and lowering the cost of our flagship TRI ETFs like the Horizons S&P 500® Index ETF (“HXS”), reducing its management fee to 0.10% from 0.15%. We also launched the Horizons China High Dividend Yield Index ETF (“HCN”), the first benchmark ETF to provide Canadian investors with exposure to the Hang Seng High Dividend Yield Index.
Looking to the remainder of 2016, it will be an interesting time for global markets. Many investors are watching every Federal Open Market Committee (FOMC) meeting closely, wondering whether or not the U.S. is in fact in a strong enough position economically to take on another rate hike. As well, the outcome of the June 23 referendum in the United Kingdom to leave the European Union could have far reaching implications in the markets, both locally and abroad, for the months and years to come.
At Horizons ETFs we try and remain agnostic on the direction of the markets, however, we do think it’s fair to say that investors can no longer rely on easy returns. Investors require more creative solutions that take advantage of volatility, such as covered call and alternative asset strategies.
Knowing investors shouldn’t rely on a single strategy for success, we believe that our diverse suite of ETF solutions provides investors with the tools they need for handling any of the market conditions that 2016 holds on the horizon. We remain proud to be a partner in your investment process.
For more information on our strategies, please visit our website at www.horizonsetfs.com where we offer a range of resources designed to help you become a skilled ETF investor.
Wishing you the best for the remainder of 2016,
Steven J. Hawkins, President & Co-CEOHorizons ETFs Management (Canada) Inc.
90412 - Horizons HGM.indd 5 2016-08-11 9:20 AM
1
Horizons Managed Global Opportunities ETF
MANAGEMENT REPORT OF FUND PERFORMANCE
This interim management report of fund performance for Horizons Managed Global Opportunities ETF (“Horizons HGM” or the “ETF”) contains financial highlights and is included with the unaudited interim financial statements for the invest-ment fund. You may request a copy of the ETF’s unaudited interim or audited annual financial statements, interim or annual management report of fund performance, current proxy voting policies and procedures, proxy voting disclosure record, or quarterly portfolio disclosures, at no cost, from the ETF’s manager, AlphaPro Management Inc. (“AlphaPro” or the “Manager”), by calling toll free 1-866-641-5739, or locally (416) 933-5745, by writing to us at: 26 Wellington Street East, Suite 700, Toronto ON, M5E 1S2, or by visiting our website at www.horizonsetfs.com or SEDAR at www.sedar.com.
This document may contain forward-looking statements relating to anticipated future events, results, circumstances, per-formance, or expectations that are not historical facts but instead represent our beliefs regarding future events. By their nature, forward-looking statements require us to make assumptions and are subject to inherent risks and uncertainties. There is significant risk that predictions and other forward-looking statements will not prove to be accurate. We caution readers of this document not to place undue reliance on our forward-looking statements as a number of factors could cause actual future results, conditions, actions or events to differ materially from the targets, expectations, estimates or intentions expressed or implied in the forward-looking statements.
Actual results may differ materially from management expectations as projected in such forward-looking statements for a variety of reasons, including but not limited to market and general economic conditions, interest rates, regulatory and statutory developments, and the effects of competition in the geographic and business areas in which the ETF may invest and the risks detailed from time to time in the ETF’s prospectus. New risk factors emerge from time to time and it is not possible for management to predict all such risk factors. We caution that the foregoing list of factors is not exhaustive, and that when relying on forward-looking statements to make decisions with respect to investing in the ETF, investors and others should carefully consider these factors, as well as other uncertainties and potential events, and the inherent uncertainty of forward-looking statements. Due to the potential impact of these factors, the Manager does not under-take, and specifically disclaims, any intention or obligation to update or revise any forward-looking statements, whether as a result of new information, future events or otherwise, unless required by applicable law.
Management Discussion of Fund Performance
Investment Objective and Strategies
The investment objectives of Horizons HGM are to use flexible tactical asset allocation among multiple global asset classes to seek long term growth, while also seeking to protect against downside risk. Horizons HGM invests primarily in exchange traded products that are listed on North American stock exchanges and may be exposed to equity securities, fixed-income securities or currencies around the world, or to gold.
To achieve Horizons HGM’s investment objectives, the ETF’s portfolio sub-advisor, Forstrong Global Asset Management Inc. (“Forstrong” or the “Sub-Advisor”), employs a proprietary differentiated risk-based approach to asset allocation. Com-pared to traditional asset allocation approaches that are typically backward looking and statistically driven, Forstrong’s approach is forward looking and driven by global macro trends. Forstrong constructs and maintains a portfolio that is highly diversified not only across asset classes, but also across risk categories. The investment strategy also incorporates a form of tail risk hedging, which seeks to protect against sudden market shocks.
Please refer to the ETF’s most recent prospectus for a complete description of Horizons HGM’s investment restrictions.
90412 - Horizons HGM.indd 1 2016-08-11 9:20 AM
2
Horizons Managed Global Opportunities ETF
Risk
The Manager, as a summary for existing investors, is providing the list below of the risks to which an investment in the ETF may be subject. Prospective investors should read the ETF’s most recent prospectus and consider the full descrip-tion of the risks contained therein before purchasing units.
The risks to which an investment in the ETF is subject are listed below and have not changed from the list of risks found in the ETF’s most recent prospectus. A full description of each risk listed below may also be found in the most recent prospectus. The most recent prospectus is available at www.horizonsetfs.com or from www.sedar.com, or by contacting AlphaPro Management Inc. directly via the contact information on the back page of this document.
• Stock market risk • Specific issuer risk • Legal and regulatory risk • Exchange traded funds risk• Reliance on historical data risk • Corresponding net asset value risk• Designated broker/dealer risk • Cease trading of securities risk • Exchange risk • Early closing risk • No assurance of meeting investment objective • Tax risk • Securities lending, repurchase and reverse repurchase transaction risk• Loss of limited liability • Reliance on key personnel• Distributions risk• Conflicts of interest• No ownership interest• Market for units• Redemption price
• Net asset value fluctuation• Limited operating history• Restrictions on certain unitholders• Highly volatile markets• Multi-class risk• No guaranteed return• Derivatives and counterparty risk• Interest rate risk• Foreign currency risk• Emerging markets risk• Credit risk• Leveraged ETFs risk• Income trust investment risk• Foreign stock exchange risk• High yield bond risk and risk of other lower rated investments• Call risk• Risk of difference between quoted and actionable market price• Commodity price volatility risk
Results of Operations
For the six-month period ended June 30, 2016, the Class E, Advisor Class and Class F units of the ETF returned -5.52%, -5.92% and -5.32%, respectively, including distributions paid to unitholders.
Global Market Review
A composite index comprised of 60% of the S&P Global 1200 Index (the “Equity Index”) and 40% of the Bank of America Merrill Lynch Global Broad Bond Index (the “Bond Index”), which returned -4.70% and 1.76%, respectively, posted a return of -2.12%, for the six-month period ended June 30, 2016, all figures presented on a total return basis in Canadian dollars. The Equity Index provides efficient exposure to the global equity market, capturing approximately 70% of global market capitalization. The Bond Index tracks the performance of investment grade debt publicly issued in the major domestic and eurobond markets, including sovereign, quasi-government, corporate, securitized and collateralized securities.
Management Discussion of Fund Performance (continued)
90412 - Horizons HGM.indd 2 2016-08-11 9:20 AM
3
Horizons Managed Global Opportunities ETF
Management Discussion of Fund Performance (continued)
Thus far, 2016 has been quite a volatile period for investors, as equity markets have plummeted and subsequently recov-ered twice in short order. Stock markets rang in the new year in a panicked fashion, as bourses worldwide sold off sharply in January and early February. Blame was frequently attributed to U.S. recession worries, which had been exacerbated by the initiation of a rate hike cycle in December 2015. Fears of a Chinese economic implosion peaked following continued capital outflows and the disastrous implementation (and swift removal) of circuit breakers in the Shanghai and Shenzhen stock exchanges resulting in frantic selling in between trading halts. Oil prices took another leg down, which raised con-cerns of systemic risk caused by spillover effects from the energy sector.
While most of the risks cited were legitimate, they were widely recognized and discounted in financial markets in 2015. Furthermore, the notion that crashing oil prices signaled a global demand deficiency and represented a powerful nega-tive leading indicator appeared to be fundamentally flawed. Weakness in oil markets had largely been driven by oversup-ply, as the U.S. shale revolution pushed production above equilibrium levels. Furthermore, oil price spikes have historical-ly tended to be much better recessionary predictors than oil price crashes. As market conditions became highly oversold, buyers began to re-enter the market in mid-February and equity markets rallied strongly.
The second quarter was dominated by the impending U.K. referendum on whether to leave the European Union (“Brex-it”). While polling data had been exceptionally close leading up to the vote, the notion that undecided voters would “vote with their wallets” to remain in the European Union clearly did not materialize. With the “Leave” side winning the referen-dum, investors in North America woke up on June 24 to sharp declines in the British pound and the Euro, as well as equity market sell-offs in Europe and Asia. Equities in the European periphery economies were hit especially hard, as concerns spread that Brexit would validate and embolden their respective Euroskeptic movements. Perceived safe haven assets such as the Japanese yen, gold and U.S. treasuries soared throughout the market panic. When the dust settled that night, almost $2.1 trillion (USD) of market capitalization had been erased from stock markets worldwide; the biggest single day loss in history.
Forstrong viewed the turmoil opportunistically, as the severity of the sell-off appeared to be a striking overreaction. Aided by expectations of additional monetary policy loosening from central banks, stock markets recovered a significant portion of their losses in the last week of the second quarter. However, bond investors appeared to be at odds with equity markets which “shrugged off” Brexit as global yields continued to decline while stocks rallied. Shockingly, almost $12 tril-lion (USD) of sovereign bonds worldwide now have negative nominal yields.
Portfolio Review
Performance was benefitted by overweight exposures to high yielding assets such as mortgage real estate investment trusts (REITs), emerging market sovereign bonds and U.S. high yield bonds. With global bond yields at extreme lows, investors continue to be forced up the risk curve to generate sufficient yield.
In terms of negative attribution, Chinese A-share equities have fared poorly, as they have been unable to recoup the losses suffered at the start of the year during the circuit breaker implementation. Additionally, a position in solar equities negatively impacted performance as SunEdison Inc., a predominant solar equipment supplier, filed for bankruptcy and severely damaged industry sentiment. However, the SunEdison collapse appears to be the product of an overly aggres-sive, debt-fueled acquisition strategy and does not signal imminent distress for the solar industry as a whole.
Outlook
Sources of uncertainty are clearly numerous, ranging from the increasingly theatric U.S. elections to the implications of the Brexit vote to the insolvency issues Italian banks are facing. Any measure of investor activity confirms current macro fears. Volume in inverse and volatility ETFs have reached record highs (recently accounting for more than 10% of the NYSE’s trading activity). What’s also notable is that optimism on bonds is at an almost record high as well. Investment
90412 - Horizons HGM.indd 3 2016-08-11 9:20 AM
4
Horizons Managed Global Opportunities ETF
professionals are similarly nervous. In addition to cash positions sitting at a 15 year high, the latest Bank of America Merrill Lynch Global Investor Survey also showed risk appetite and global equity allocation at four-year lows.
To be sure, markets are reacting to some legitimate macro fears. Central bank actions are increasingly frantic, China’s longer-running agenda has been poorly communicated and global demand remains structurally deficient. And, there are times when even false beliefs can change economic reality so much that they become true (this is George Soros’ reflexivity thesis).
Still, since 2008, we have argued that post-financial crisis periods are a different animal. Investors, still carrying crisis-made scar tissue, tend to cling close to shore. Endless financial crisis fears prevail — whether U.S. fiscal cliffs, Chinese devalua-tions, Euro banking insolvencies and so on. The narrative keeps shifting but a bearish bias lingers. This time has not been different and we are now living through another episode of fear. In this jittery environment, staying widely diversified is crucial. However, panicky responses from market participants create opportunities for nimble investors.
Other Operating Items and Changes in Net Assets Attributable to Holders of Redeemable Units
For the six-month period ended June 30, 2016, the ETF generated gross comprehensive income (loss) from investments and derivatives of ($5,259,141). The period ended June 30, 2016 is the first full interim reporting period for the ETF, therefore there are no 2015 numbers with which to compare the 2016 operating items. The ETF paid management, op-erating and transaction expenses of $591,377 of which $90,025 was either paid or absorbed by the Manager on behalf of the ETF. The waiving and/or absorption of such fees and/or expenses by the Manager may be terminated at any time, or continued indefinitely, at the discretion of the Manager.
The ETF distributed $80,810 to Class E unitholders, $1,943 to Advisor Class unitholders, and $961,283 to Class F unithold-ers during the period.
Unitholder Activity
An “ETF” is a stock exchange listed, open-ended, continuously offered fund. All orders to purchase units directly from the ETF must be placed by designated brokers and/or underwriters. On any trading day, a designated broker or an under-writer may place a subscription order for a prescribed number of units (“PNU”) or integral multiple PNU. The ETF reserves the absolute right to reject any subscription order placed by a designated broker and/or an underwriter. No fees will be payable by the ETF to a designated broker or an underwriter in connection with the issuance of units. On the issuance of units, the Manager may, at its discretion, charge an administrative fee to an underwriter or designated broker to offset any expenses incurred in issuing the units.
All unitholders of the ETF may exchange the applicable PNU (or an integral multiple thereof ) of the ETF on any trading day for a prescribed basket of securities (as determined by the investment manager) and/or cash, subject to the require-ment that a minimum PNU be exchanged. The Manager may, in its complete discretion, pay exchange proceeds consist-ing of cash only in an amount equal to the net asset value of the applicable PNU of the ETF next determined following the receipt of the exchange request. The Manager will, upon receipt of the exchange request, advise the unitholder submit-ting the request as to whether cash and/or a basket of securities will be delivered to satisfy the request.
Investors are able to trade units of the ETF in the same way as other securities traded on the Toronto Stock Exchange (“TSX”), including by using market orders and limit orders. An investor may buy or sell units of the ETF on the TSX only through a registered broker or dealer in the province or territory where the investor resides. Investors may incur custom-ary brokerage commissions when buying or selling units.
Class F units of Horizons HGM are only available for purchase to certain investors who qualify as “accredited investors”. The Class F units are subject to the terms and conditions of a Confidential Offering Memorandum. These units are not traded publicly on a stock exchange.
Management Discussion of Fund Performance (continued)
90412 - Horizons HGM.indd 4 2016-08-11 9:20 AM
5
Horizons Managed Global Opportunities ETF
Management Discussion of Fund Performance (continued)
Presentation
The attached financial statements have been prepared in accordance with International Financial Reporting Standards (“IFRS”). Any mention of total net assets, net assets, net asset value or increase (decrease) in net assets in the financial statements and/or management report of fund performance is referring to net assets or increase (decrease) in net assets attributable to holders of redeemable units as reported under IFRS.
Recent Developments
There are no recent industry, management or ETF related developments that are pertinent to the present and future of the ETF.
Related Party Transactions
Certain services have been provided to the ETF by related parties and those relationships are described below.
Manager, Trustee and Investment Manager
The manager and trustee of the ETF is AlphaPro Management Inc., 26 Wellington Street East, Suite 700, Toronto, Ontario, M5E 1S2, a corporation incorporated under the laws of Ontario specializing in actively managed ETFs. AlphaPro is a subsidiary of Horizons ETFs Management (Canada) Inc., which also serves as the ETF’s investment manager (“Horizons Management” or the “Investment Manager”), and both entities are members of the Mirae Asset Financial Group. If the ETF invests in the Horizons Management ETFs, Horizons Management may receive management fees in respect of the ETF’s assets invested in such Horizons Management ETFs. The offices of the Manager and Investment Manager are the same.
Other Related Parties
An affiliate of National Bank of Canada (“NBC”) and National Bank Financial Inc. (“NBF”) holds an indirect minority interest in the Manager. NBF acts or may act as a designated broker, an underwriter and/or a registered trader (market maker). These relationships may create actual or perceived conflicts of interest which investors should consider in relation to an investment in the ETF. In particular, by virtue of these relationships, NBF may profit from the sale and trading of the ETF’s units. NBF, as market maker of the ETF in the secondary market, may therefore have economic interests which differ from and may be adverse to those of unitholders.
NBF’s potential roles as a designated broker and a dealer of the ETF is not as an underwriter of the ETF in connection with the primary distribution of units under the ETF’s prospectus. NBF was not involved in the preparation of, nor did it per-form any review of, the contents of the ETF’s prospectus. NBF and its affiliates may, at present or in the future, engage in business with the ETF, the issuers of securities making up the investment portfolio of the ETF, or with the Manager or any funds sponsored by the Manager or its affiliates, including by making loans, executing brokerage transactions, entering into derivative transactions or providing advisory or agency services. In addition, the relationship between NBF and its af-filiates, and the Manager and its affiliates may extend to other activities, such as being part of a distribution syndicate for other funds sponsored by the Manager or its affiliates.
The ETF, in its course of normal business in seeking to achieve its investment objective, may enter into portfolio transac-tions that involve an investment in securities of an issuer that is a related party to the Manager. The Manager is permitted to execute these transactions without seeking advance approval from the ETF’s Independent Review Committee (“IRC”), provided the Manager complies with the predetermined list of requirements agreed upon with the IRC.
For the period ended June 30, 2016, the ETF paid $33,043 to NBF and/or its affiliates in broker commissions on portfolio transactions.
90412 - Horizons HGM.indd 5 2016-08-11 9:20 AM

6
Horizons Managed Global Opportunities ETF
The following tables show selected key financial information about the ETF and are intended to help you understand the ETF’s financial performance since it effectively began operations on August 25, 2015. This information is derived from the ETF’s audited annual financial statements and the current unaudited interim financial statements. Please see the front page for information on how you may obtain the ETF’s annual or interim financial statements.
The ETF’s Net Assets per Unit
Class EPeriod 2016 2015
Net assets, beginning of period (1) $ 10.49 10.00
Increase (decrease) from operations: Total revenue 0.12 0.35 Total expenses (0.07) (0.06) Realized gains for the period 0.11 0.26 Unrealized gains (losses) for the period (0.73) 0.05
Total increase (decrease) from operations (2) (0.57) 0.60
Distributions: From net investment income (excluding dividends) (0.08) (0.10) From net realized capital gains – (0.10)
Total distributions (3) (0.08) (0.20)
Net assets, end of period (4) $ 9.82 10.49
Advisor ClassPeriod 2016 2015
Net assets, beginning of period (1) $ 10.49 10.00
Increase (decrease) from operations: Total revenue 0.12 0.35 Total expenses (0.11) (0.09) Realized gains for the period 0.11 0.26 Unrealized losses for the period (0.75) (0.10)
Total increase (decrease) from operations (2) (0.63) 0.42
Distributions: From net investment income (excluding dividends) (0.04) (0.07) From net realized capital gains – (0.08)
Total distributions (3) (0.04) (0.15)
Net assets, end of period (4) $ 9.82 10.49
Financial Highlights
90412 - Horizons HGM.indd 6 2016-08-11 9:20 AM
7
Horizons Managed Global Opportunities ETF
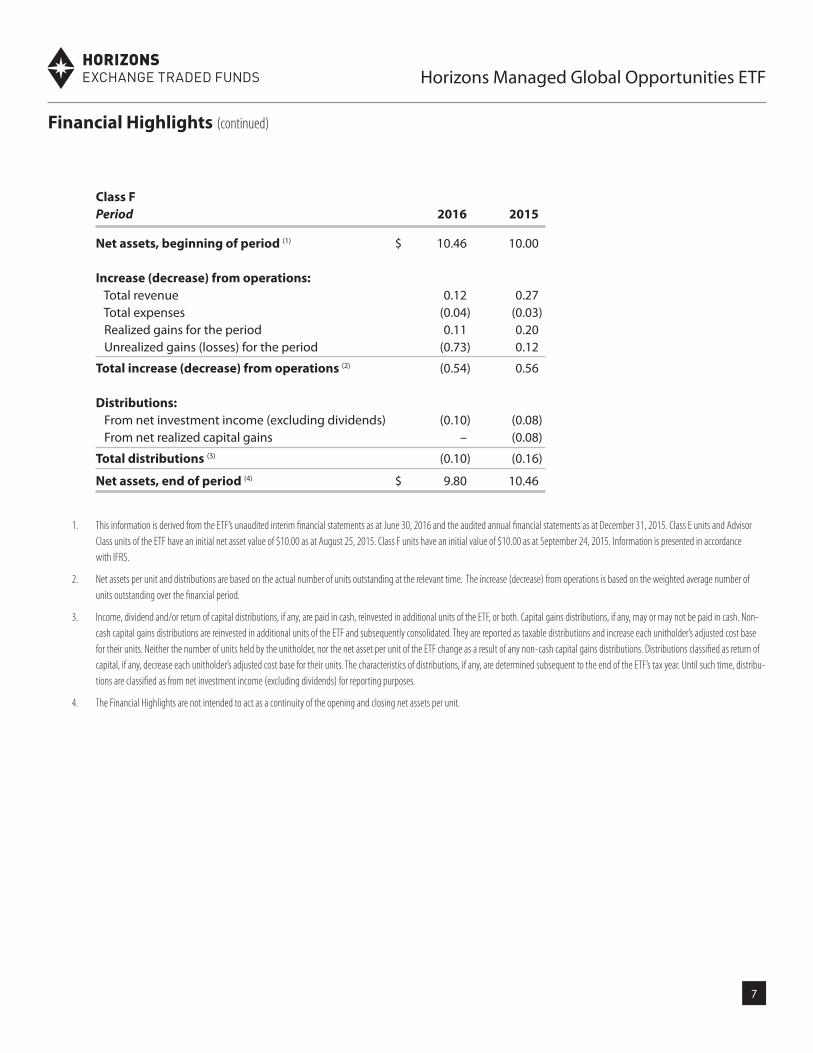
Class FPeriod 2016 2015
Net assets, beginning of period (1) $ 10.46 10.00
Increase (decrease) from operations: Total revenue 0.12 0.27 Total expenses (0.04) (0.03) Realized gains for the period 0.11 0.20 Unrealized gains (losses) for the period (0.73) 0.12
Total increase (decrease) from operations (2) (0.54) 0.56
Distributions: From net investment income (excluding dividends) (0.10) (0.08) From net realized capital gains – (0.08)
Total distributions (3) (0.10) (0.16)
Net assets, end of period (4) $ 9.80 10.46
1. This information is derived from the ETF’s unaudited interim financial statements as at June 30, 2016 and the audited annual financial statements as at December 31, 2015. Class E units and Advisor Class units of the ETF have an initial net asset value of $10.00 as at August 25, 2015. Class F units have an initial value of $10.00 as at September 24, 2015. Information is presented in accordance with IFRS.
2. Net assets per unit and distributions are based on the actual number of units outstanding at the relevant time. The increase (decrease) from operations is based on the weighted average number of units outstanding over the financial period.
3. Income, dividend and/or return of capital distributions, if any, are paid in cash, reinvested in additional units of the ETF, or both. Capital gains distributions, if any, may or may not be paid in cash. Non-cash capital gains distributions are reinvested in additional units of the ETF and subsequently consolidated. They are reported as taxable distributions and increase each unitholder’s adjusted cost base for their units. Neither the number of units held by the unitholder, nor the net asset per unit of the ETF change as a result of any non-cash capital gains distributions. Distributions classified as return of capital, if any, decrease each unitholder’s adjusted cost base for their units. The characteristics of distributions, if any, are determined subsequent to the end of the ETF’s tax year. Until such time, distribu-tions are classified as from net investment income (excluding dividends) for reporting purposes.
4. The Financial Highlights are not intended to act as a continuity of the opening and closing net assets per unit.
Financial Highlights (continued)
90412 - Horizons HGM.indd 7 2016-08-11 9:20 AM

8
Horizons Managed Global Opportunities ETF
Ratios and Supplemental Data
Class EPeriod (1) 2016 2015
Total net asset value (000’s) $ 9,824 10,126 Number of units outstanding (000’s) 1,000 965 Management expense ratio (2) (5) 1.53% 1.38%Management expense ratio excluding proportion of expenses from underlying investment funds 0.99% 0.99%Management expense ratio before waivers and absorptions (3) 1.74% 3.14%Trading expense ratio (4) (5) 0.07% 0.18%Trading expense ratio excluding proportion of costs from underlying investment funds 0.07% 0.18%Portfolio turnover rate (6) 38.13% 116.21%Net asset value per unit, end of period $ 9.82 10.49 Closing market price $ 9.83 10.52
Advisor ClassPeriod (1) 2016 2015
Total net asset value (000’s) $ 491 524 Number of units outstanding (000’s) 50 50 Management expense ratio (2) (5) 2.38% 2.22%Management expense ratio excluding proportion of expenses from underlying investment funds 1.84% 1.83%Management expense ratio before waivers and absorptions (3) 2.59% 3.99%Trading expense ratio (4) (5) 0.07% 0.18%Trading expense ratio excluding proportion of costs from underlying investment funds 0.07% 0.18%Portfolio turnover rate (6) 38.13% 116.21%Net asset value per unit, end of period $ 9.82 10.49 Closing market price $ 9.83 10.61
Financial Highlights (continued)
90412 - Horizons HGM.indd 8 2016-08-11 9:20 AM
9
Horizons Managed Global Opportunities ETF
Financial Highlights (continued)
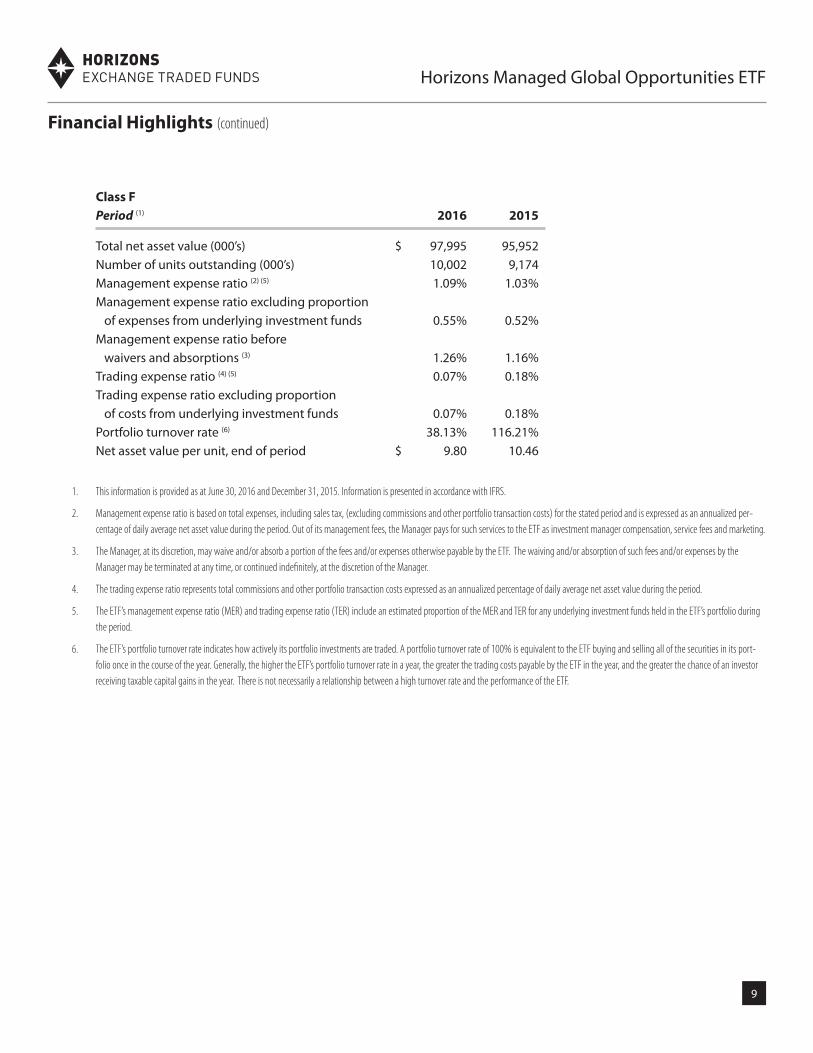
Class FPeriod (1) 2016 2015
Total net asset value (000’s) $ 97,995 95,952 Number of units outstanding (000’s) 10,002 9,174 Management expense ratio (2) (5) 1.09% 1.03%Management expense ratio excluding proportion of expenses from underlying investment funds 0.55% 0.52%Management expense ratio before waivers and absorptions (3) 1.26% 1.16%Trading expense ratio (4) (5) 0.07% 0.18%Trading expense ratio excluding proportion of costs from underlying investment funds 0.07% 0.18%Portfolio turnover rate (6) 38.13% 116.21%Net asset value per unit, end of period $ 9.80 10.46
1. This information is provided as at June 30, 2016 and December 31, 2015. Information is presented in accordance with IFRS.
2. Management expense ratio is based on total expenses, including sales tax, (excluding commissions and other portfolio transaction costs) for the stated period and is expressed as an annualized per-centage of daily average net asset value during the period. Out of its management fees, the Manager pays for such services to the ETF as investment manager compensation, service fees and marketing.
3. The Manager, at its discretion, may waive and/or absorb a portion of the fees and/or expenses otherwise payable by the ETF. The waiving and/or absorption of such fees and/or expenses by the Manager may be terminated at any time, or continued indefinitely, at the discretion of the Manager.
4. The trading expense ratio represents total commissions and other portfolio transaction costs expressed as an annualized percentage of daily average net asset value during the period.
5. The ETF’s management expense ratio (MER) and trading expense ratio (TER) include an estimated proportion of the MER and TER for any underlying investment funds held in the ETF’s portfolio during the period.
6. The ETF’s portfolio turnover rate indicates how actively its portfolio investments are traded. A portfolio turnover rate of 100% is equivalent to the ETF buying and selling all of the securities in its port-folio once in the course of the year. Generally, the higher the ETF’s portfolio turnover rate in a year, the greater the trading costs payable by the ETF in the year, and the greater the chance of an investor receiving taxable capital gains in the year. There is not necessarily a relationship between a high turnover rate and the performance of the ETF.
90412 - Horizons HGM.indd 9 2016-08-11 9:20 AM
10
Horizons Managed Global Opportunities ETF
Management Fees
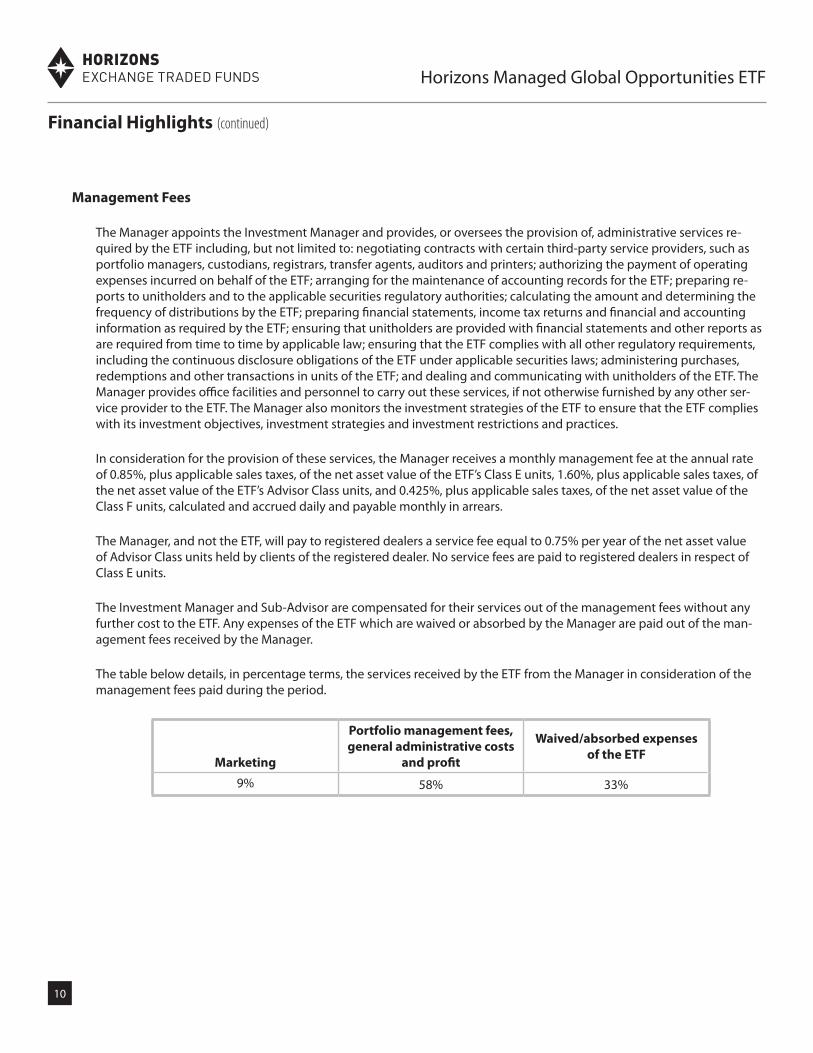
The Manager appoints the Investment Manager and provides, or oversees the provision of, administrative services re-quired by the ETF including, but not limited to: negotiating contracts with certain third-party service providers, such as portfolio managers, custodians, registrars, transfer agents, auditors and printers; authorizing the payment of operating expenses incurred on behalf of the ETF; arranging for the maintenance of accounting records for the ETF; preparing re-ports to unitholders and to the applicable securities regulatory authorities; calculating the amount and determining the frequency of distributions by the ETF; preparing financial statements, income tax returns and financial and accounting information as required by the ETF; ensuring that unitholders are provided with financial statements and other reports as are required from time to time by applicable law; ensuring that the ETF complies with all other regulatory requirements, including the continuous disclosure obligations of the ETF under applicable securities laws; administering purchases, redemptions and other transactions in units of the ETF; and dealing and communicating with unitholders of the ETF. The Manager provides office facilities and personnel to carry out these services, if not otherwise furnished by any other ser-vice provider to the ETF. The Manager also monitors the investment strategies of the ETF to ensure that the ETF complies with its investment objectives, investment strategies and investment restrictions and practices.
In consideration for the provision of these services, the Manager receives a monthly management fee at the annual rate of 0.85%, plus applicable sales taxes, of the net asset value of the ETF’s Class E units, 1.60%, plus applicable sales taxes, of the net asset value of the ETF’s Advisor Class units, and 0.425%, plus applicable sales taxes, of the net asset value of the Class F units, calculated and accrued daily and payable monthly in arrears.
The Manager, and not the ETF, will pay to registered dealers a service fee equal to 0.75% per year of the net asset value of Advisor Class units held by clients of the registered dealer. No service fees are paid to registered dealers in respect of Class E units.
The Investment Manager and Sub-Advisor are compensated for their services out of the management fees without any further cost to the ETF. Any expenses of the ETF which are waived or absorbed by the Manager are paid out of the man-agement fees received by the Manager.
The table below details, in percentage terms, the services received by the ETF from the Manager in consideration of the management fees paid during the period.
Marketing
Portfolio management fees, general administrative costs
and profit
Waived/absorbed expenses of the ETF
9% 58% 33%
Financial Highlights (continued)
90412 - Horizons HGM.indd 10 2016-08-11 9:20 AM

11
Horizons Managed Global Opportunities ETF
Commissions, trailing commissions, management fees and expenses all may be associated with an investment in the ETF. Please read the prospectus before investing. The indicated rates of return are the historical total returns including changes in unit value and reinvestment of all distributions, and do not take into account sales, redemptions, distributions or optional charges or income taxes payable by any investor that would have reduced returns. An investment in the ETF is not guaranteed. Its value changes frequently and past performance may not be repeated. The ETF’s performance num-bers assume that all distributions are reinvested in additional units of the ETF. If you hold this ETF outside of a registered plan, income and capital gains distributions that are paid to you increase your income for tax purposes whether paid to you in cash or reinvested in additional units. The amount of the reinvested taxable distributions is added to the adjusted cost base of the units that you own. This would decrease your capital gain or increase your capital loss when you later redeem from the ETF, thereby ensuring that you are not taxed on this amount again. Please consult your tax advisor regarding your personal tax situation.
Year-by-Year Returns
The following chart presents the ETF’s performance for its Class E, Advisor Class and Class F units for the periods shown. In percentage terms, the chart shows how much an investment made on the first day of the financial period would have grown or decreased by the last day of the financial period.
2015 2016Class E 5.84% -5.52%
Advisor Class 5.53% -5.92%
Class F 4.51% -5.32%
-8.00%
-6.00%
-4.00%
-2.00%
0.00%
2.00%
4.00%
6.00%
8.00%
Rate
of R
etur
n
Class E units and Advisor Class units of the ETF have an initial net asset value of $10.00 as at August 25, 2015. Class F units have an initial value of $10.00 as at September 24, 2015.
Past Performance
90412 - Horizons HGM.indd 11 2016-08-11 9:20 AM
12
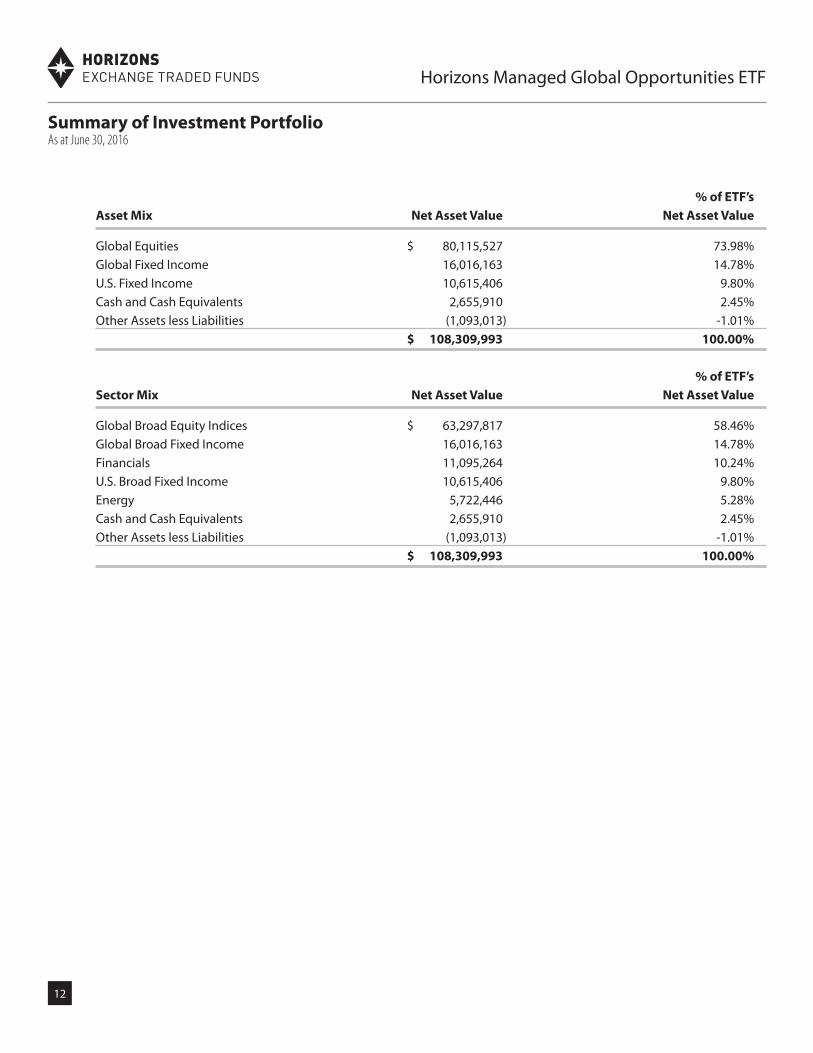
% of ETF’sAsset Mix Net Asset Value Net Asset Value
Global Equities $ 80,115,527 73.98%Global Fixed Income 16,016,163 14.78%U.S. Fixed Income 10,615,406 9.80%Cash and Cash Equivalents 2,655,910 2.45%Other Assets less Liabilities (1,093,013) -1.01% $ 108,309,993 100.00%
% of ETF’sSector Mix Net Asset Value Net Asset Value
Global Broad Equity Indices $ 63,297,817 58.46%Global Broad Fixed Income 16,016,163 14.78%Financials 11,095,264 10.24%U.S. Broad Fixed Income 10,615,406 9.80%Energy 5,722,446 5.28%Cash and Cash Equivalents 2,655,910 2.45%Other Assets less Liabilities (1,093,013) -1.01% $ 108,309,993 100.00%
Summary of Investment PortfolioAs at June 30, 2016
Horizons Managed Global Opportunities ETF
90412 - Horizons HGM.indd 12 2016-08-11 9:20 AM
13
Horizons Managed Global Opportunities ETF
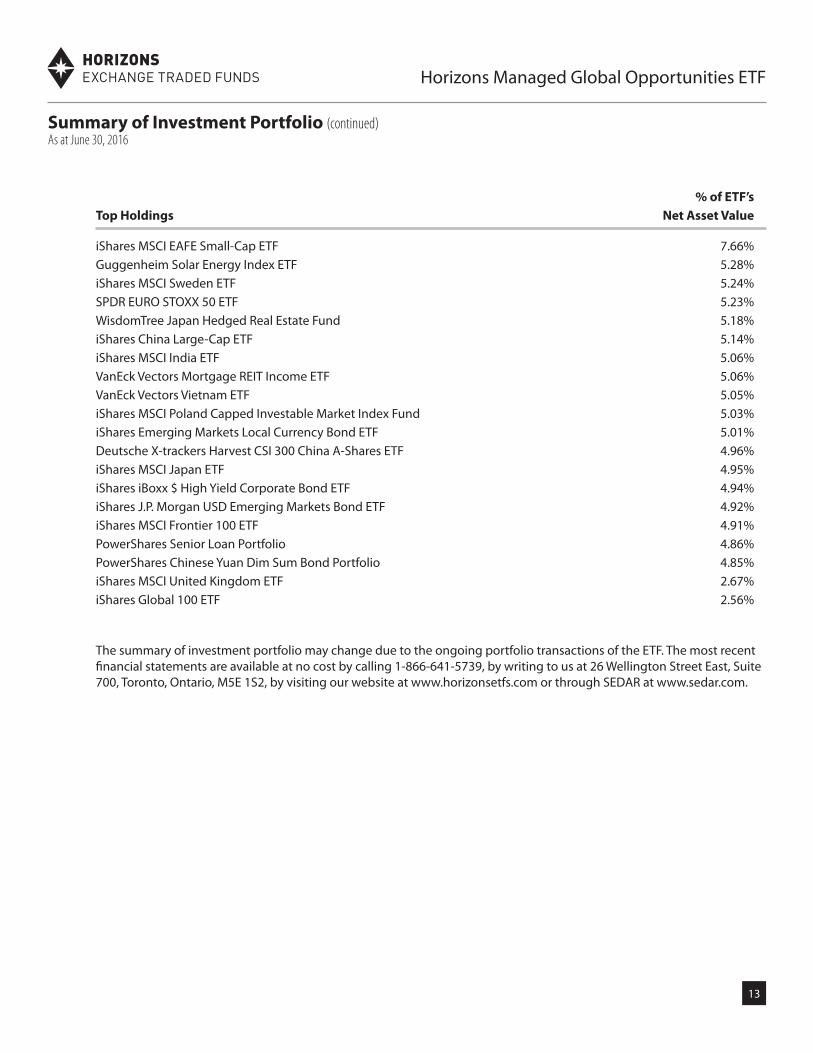
% of ETF’sTop Holdings Net Asset Value
iShares MSCI EAFE Small-Cap ETF 7.66%Guggenheim Solar Energy Index ETF 5.28%iShares MSCI Sweden ETF 5.24%SPDR EURO STOXX 50 ETF 5.23%WisdomTree Japan Hedged Real Estate Fund 5.18%iShares China Large-Cap ETF 5.14%iShares MSCI India ETF 5.06%VanEck Vectors Mortgage REIT Income ETF 5.06%VanEck Vectors Vietnam ETF 5.05%iShares MSCI Poland Capped Investable Market Index Fund 5.03%iShares Emerging Markets Local Currency Bond ETF 5.01%Deutsche X-trackers Harvest CSI 300 China A-Shares ETF 4.96%iShares MSCI Japan ETF 4.95%iShares iBoxx $ High Yield Corporate Bond ETF 4.94%iShares J.P. Morgan USD Emerging Markets Bond ETF 4.92%iShares MSCI Frontier 100 ETF 4.91%PowerShares Senior Loan Portfolio 4.86%PowerShares Chinese Yuan Dim Sum Bond Portfolio 4.85%iShares MSCI United Kingdom ETF 2.67%iShares Global 100 ETF 2.56%
The summary of investment portfolio may change due to the ongoing portfolio transactions of the ETF. The most recent financial statements are available at no cost by calling 1-866-641-5739, by writing to us at 26 Wellington Street East, Suite 700, Toronto, Ontario, M5E 1S2, by visiting our website at www.horizonsetfs.com or through SEDAR at www.sedar.com.
Summary of Investment Portfolio (continued)As at June 30, 2016
90412 - Horizons HGM.indd 13 2016-08-11 9:20 AM

14
Horizons Managed Global Opportunities ETF
MANAGER’S RESPONSIBILITY FOR FINANCIAL REPORTING
The accompanying unaudited interim financial statements of Horizons Managed Global Opportunities ETF (the “ETF”) are the responsibility of the manager and trustee to the ETF, AlphaPro Management Inc. (the “Manager”). They have been prepared in accordance with International Financial Reporting Standards using information available and include certain amounts that are based on the Manager’s best estimates and judgments.
The Manager has developed and maintains a system of internal controls to provide reasonable assurance that all assets are safeguarded and to produce relevant, reliable and timely financial information, including the accompanying financial statements.
These financial statements have been approved by the Board of Directors of the Manager.
________________________ ________________________Steven J. Hawkins Taeyong LeeDirector DirectorAlphaPro Management Inc. AlphaPro Management Inc.
NOTICE TO UNITHOLDERS
The Auditors of the ETF have not reviewed these Financial Statements.
AlphaPro Management Inc., the Manager of the ETF, appoints an independent auditor to audit the ETF’s annual financial statements.
The ETF’s independent auditors have not performed a review of these interim financial statements in accordance with Canadian generally accepted auditing standards.
90412 - Horizons HGM.indd 14 2016-08-11 9:20 AM

15
Horizons Managed Global Opportunities ETF
2016 2015
Assets Cash and cash equivalents $ 2,655,910 $ 5,454,508 Investments 106,747,096 102,738,014 Amounts receivable relating to accrued income – 190,538 Accounts receivable relating to securities issued – 431,212
Total assets 109,403,006 108,814,272
Liabilities Accrued expenses 48,977 39,188 Amounts payable relating to securities redeemed – 92,832 Amounts payable for portfolio assets purchased – 1,979,275 Distribution payable 1,044,036 100,106
Total liabilities 1,093,013 2,211,401
Total net assets (note 2) $ 108,309,993 $ 106,602,871
Total net assets, Class E $ 9,823,880 $ 10,125,952 Number of redeemable units outstanding, Class E (note 9) 1,000,000 965,000 Total net assets per unit, Class E $ 9.82 $ 10.49
Total net assets, Advisor Class $ 491,072 $ 524,497 Number of redeemable units outstanding, Advisor Class (note 9) 50,000 50,000 Total net assets per unit, Advisor Class $ 9.82 $ 10.49
Total net assets, Class F $ 97,995,041 $ 95,952,422 Number of redeemable units outstanding, Class F (note 9) 10,001,834 9,174,250 Total net assets per unit, Class F $ 9.80 $ 10.46
(See accompanying notes to financial statements)
Approved on behalf of the Board of Directors of the Manager:
______________________ _______________________Steven J. Hawkins Taeyong Lee
Statements of Financial Position (unaudited)As at June 30, 2016 and December 31, 2015
90412 - Horizons HGM.indd 15 2016-08-11 9:20 AM
16
Horizons Managed Global Opportunities ETF
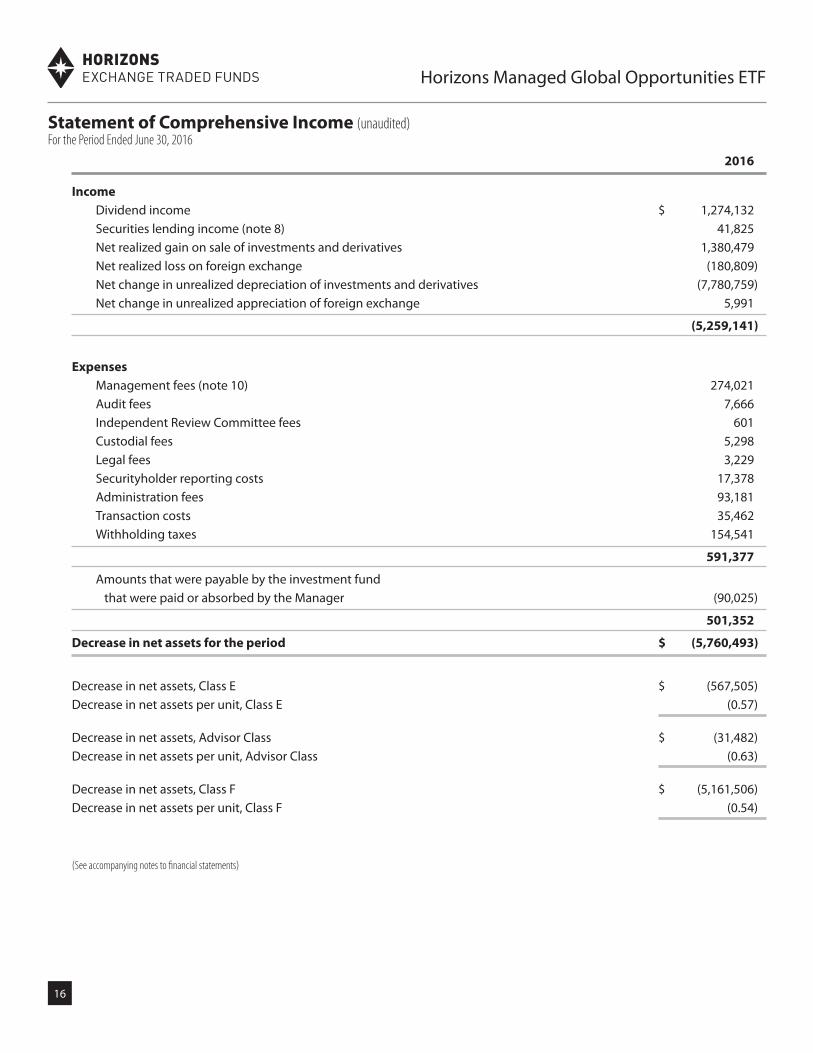
2016
Income Dividend income $ 1,274,132 Securities lending income (note 8) 41,825 Net realized gain on sale of investments and derivatives 1,380,479 Net realized loss on foreign exchange (180,809) Net change in unrealized depreciation of investments and derivatives (7,780,759) Net change in unrealized appreciation of foreign exchange 5,991
(5,259,141)
Expenses Management fees (note 10) 274,021 Audit fees 7,666 Independent Review Committee fees 601 Custodial fees 5,298 Legal fees 3,229 Securityholder reporting costs 17,378 Administration fees 93,181 Transaction costs 35,462 Withholding taxes 154,541
591,377
Amounts that were payable by the investment fund that were paid or absorbed by the Manager (90,025)
501,352
Decrease in net assets for the period $ (5,760,493)
Decrease in net assets, Class E $ (567,505)Decrease in net assets per unit, Class E (0.57)
Decrease in net assets, Advisor Class $ (31,482)Decrease in net assets per unit, Advisor Class (0.63)
Decrease in net assets, Class F $ (5,161,506)Decrease in net assets per unit, Class F (0.54)
(See accompanying notes to financial statements)
Statement of Comprehensive Income (unaudited)For the Period Ended June 30, 2016
90412 - Horizons HGM.indd 16 2016-08-11 9:20 AM
17
Horizons Managed Global Opportunities ETF
Statement of Changes in Financial Position (unaudited)For the Period Ended June 30, 2016
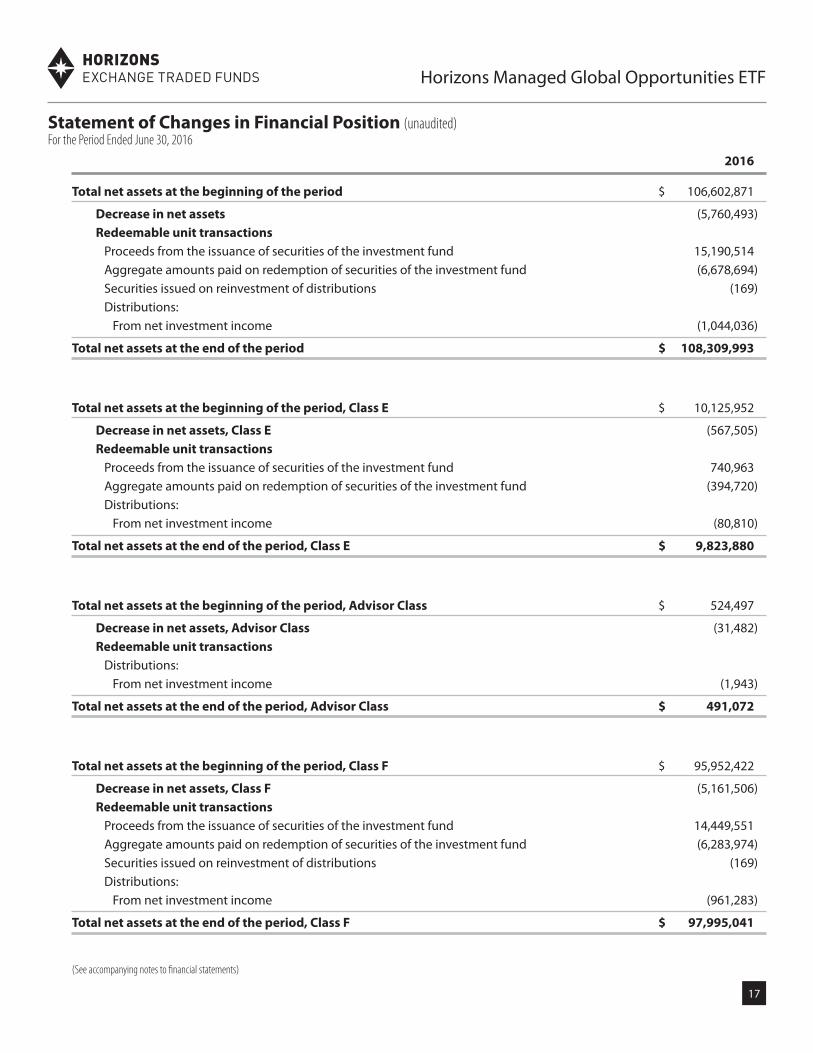
2016
Total net assets at the beginning of the period $ 106,602,871
Decrease in net assets (5,760,493) Redeemable unit transactions Proceeds from the issuance of securities of the investment fund 15,190,514 Aggregate amounts paid on redemption of securities of the investment fund (6,678,694) Securities issued on reinvestment of distributions (169) Distributions: From net investment income (1,044,036)
Total net assets at the end of the period $ 108,309,993
Total net assets at the beginning of the period, Class E $ 10,125,952
Decrease in net assets, Class E (567,505) Redeemable unit transactions Proceeds from the issuance of securities of the investment fund 740,963 Aggregate amounts paid on redemption of securities of the investment fund (394,720) Distributions: From net investment income (80,810)
Total net assets at the end of the period, Class E $ 9,823,880
Total net assets at the beginning of the period, Advisor Class $ 524,497
Decrease in net assets, Advisor Class (31,482) Redeemable unit transactions Distributions: From net investment income (1,943)
Total net assets at the end of the period, Advisor Class $ 491,072
Total net assets at the beginning of the period, Class F $ 95,952,422
Decrease in net assets, Class F (5,161,506) Redeemable unit transactions Proceeds from the issuance of securities of the investment fund 14,449,551 Aggregate amounts paid on redemption of securities of the investment fund (6,283,974) Securities issued on reinvestment of distributions (169) Distributions: From net investment income (961,283)
Total net assets at the end of the period, Class F $ 97,995,041
(See accompanying notes to financial statements)
90412 - Horizons HGM.indd 17 2016-08-11 9:20 AM

18
Horizons Managed Global Opportunities ETF
Statement of Cash Flows (unaudited)For the Period Ended June 30, 2016
2016
Cash flows from operating activities:Decrease in net assets for the period $ (5,760,493)Adjustments for: Net realized gain on sale of investments and derivatives (1,380,479) Net change in unrealized depreciation of investments and derivatives 7,780,759 Net change in unrealized appreciation of foreign exchange (4,274) Purchase of investments (51,529,202) Proceeds from the sale of investments 39,140,565 Amounts receivable relating to accrued income 190,538 Accrued expenses 9,789
Net cash used in operating activities (11,552,797)
Cash flows from financing activities: Amount received from the issuance of units 15,621,726 Amount paid on redemptions of units (6,771,526) Distributions paid to unitholders (100,275)
Net cash from financing activities 8,749,925
Net decrease in cash and cash equivalents during the period (2,802,872)Effect of exchange rate fluctuations on cash and cash equivalents 4,274 Cash and cash equivalents at beginning of period 5,454,508
Cash and cash equivalents at end of period $ 2,655,910
Dividends received, net of withholding taxes $ 1,310,129
(See accompanying notes to financial statements)
90412 - Horizons HGM.indd 18 2016-08-11 9:20 AM
19
Horizons Managed Global Opportunities ETF
Schedule of Investments (unaudited)As at June 30, 2016
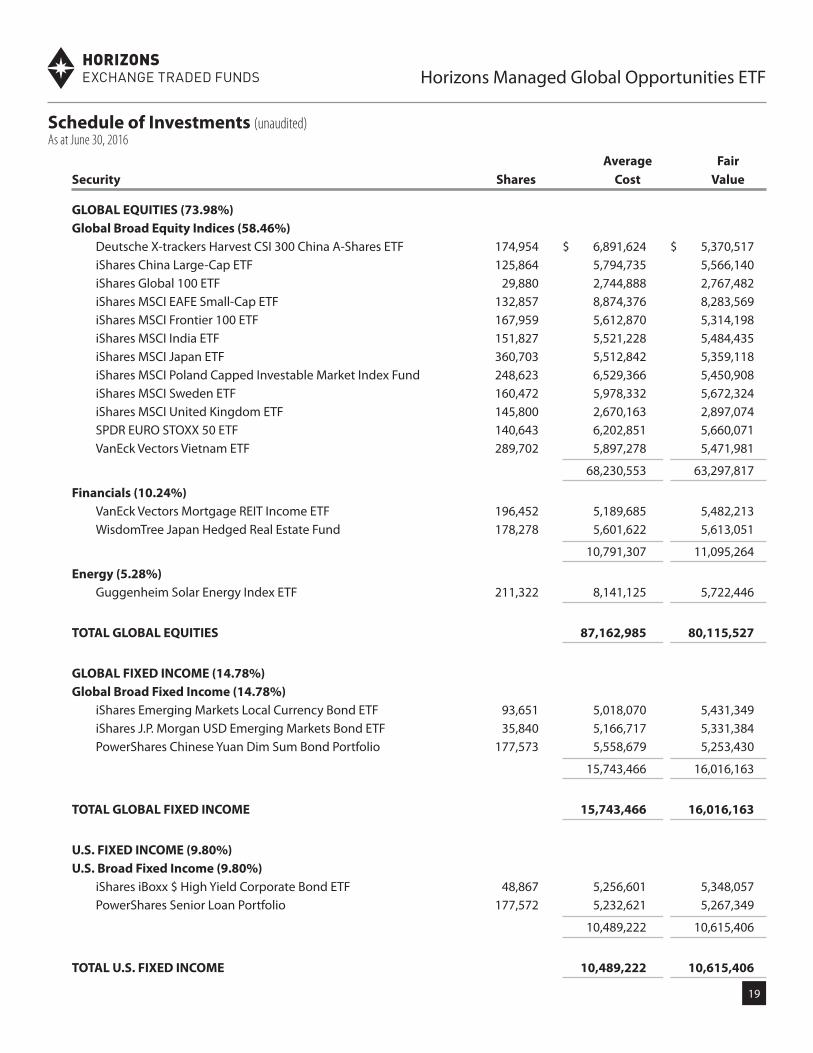
Average Fair Security Shares Cost Value
GLOBAL EQUITIES (73.98%)Global Broad Equity Indices (58.46%) Deutsche X-trackers Harvest CSI 300 China A-Shares ETF 174,954 $ 6,891,624 $ 5,370,517 iShares China Large-Cap ETF 125,864 5,794,735 5,566,140 iShares Global 100 ETF 29,880 2,744,888 2,767,482 iShares MSCI EAFE Small-Cap ETF 132,857 8,874,376 8,283,569 iShares MSCI Frontier 100 ETF 167,959 5,612,870 5,314,198 iShares MSCI India ETF 151,827 5,521,228 5,484,435 iShares MSCI Japan ETF 360,703 5,512,842 5,359,118 iShares MSCI Poland Capped Investable Market Index Fund 248,623 6,529,366 5,450,908 iShares MSCI Sweden ETF 160,472 5,978,332 5,672,324 iShares MSCI United Kingdom ETF 145,800 2,670,163 2,897,074 SPDR EURO STOXX 50 ETF 140,643 6,202,851 5,660,071 VanEck Vectors Vietnam ETF 289,702 5,897,278 5,471,981
68,230,553 63,297,817
Financials (10.24%) VanEck Vectors Mortgage REIT Income ETF 196,452 5,189,685 5,482,213 WisdomTree Japan Hedged Real Estate Fund 178,278 5,601,622 5,613,051
10,791,307 11,095,264
Energy (5.28%) Guggenheim Solar Energy Index ETF 211,322 8,141,125 5,722,446
TOTAL GLOBAL EQUITIES 87,162,985 80,115,527
GLOBAL FIXED INCOME (14.78%)Global Broad Fixed Income (14.78%) iShares Emerging Markets Local Currency Bond ETF 93,651 5,018,070 5,431,349 iShares J.P. Morgan USD Emerging Markets Bond ETF 35,840 5,166,717 5,331,384 PowerShares Chinese Yuan Dim Sum Bond Portfolio 177,573 5,558,679 5,253,430
15,743,466 16,016,163
TOTAL GLOBAL FIXED INCOME 15,743,466 16,016,163
U.S. FIXED INCOME (9.80%)U.S. Broad Fixed Income (9.80%) iShares iBoxx $ High Yield Corporate Bond ETF 48,867 5,256,601 5,348,057 PowerShares Senior Loan Portfolio 177,572 5,232,621 5,267,349
10,489,222 10,615,406
TOTAL U.S. FIXED INCOME 10,489,222 10,615,406
90412 - Horizons HGM.indd 19 2016-08-11 9:20 AM

20
Horizons Managed Global Opportunities ETF
Average Fair Security Shares Cost Value
Schedule of Investments (unaudited) (continued)As at June 30, 2016
Transaction costs (40,943)
TOTAL INVESTMENT PORTFOLIO (98.56%) $ 113,354,730 $ 106,747,096
Cash and cash equivalents (2.45%) 2,655,910 Other assets less liabilities (-1.01%) (1,093,013)
TOTAL NET ASSETS (100.00%) $ 108,309,993
(See accompanying notes to financial statements)
90412 - Horizons HGM.indd 20 2016-08-11 9:20 AM

21
Notes to Financial Statements (unaudited)June 30, 2016
Horizons Managed Global Opportunities ETF
1. REPORTING ENTITY
Horizons Managed Global Opportunities ETF (“Horizons HGM” or the “ETF”) is an investment trust established under the laws of the Province of Ontario by Declaration of Trust and effectively began operations on August 25, 2015. The address of the ETF’s registered office is: c/o AlphaPro Management Inc., 26 Wellington Street East, Suite 700, Toronto, Ontario, M5E 1S2.
The ETF is offered for sale on a continuous basis by its prospectus in both class E units (“Class E”) and advisor class units (“Advisor Class”) which trade on the Toronto Stock Exchange (“TSX”) under the symbols HGM and HGM.A, respectively. Advisors are directly compensated with a service fee on a trailing quarterly basis (the “Service Fee”). The only difference between the Advisor Class and existing Class E units of the ETF is that the Advisor Class charges higher management fees that include the Service Fees paid to the advisor (see note 10). The purchase and sale process for the Advisor Class units is identical to that of any other ETF listed on the TSX. An investor may buy or sell units of the ETF on the TSX only through a registered broker or dealer in the province or territory where the investor resides. Investors are able to trade units of the ETF in the same way as other securities traded on the TSX, including by using market orders and limit orders and may incur customary brokerage commissions when buying or selling units.
Class F units of Horizons HGM are only available for purchase to certain investors who qualify as “accredited investors”. The Class F units are subject to the terms and conditions of a Confidential Offering Memorandum. These units are not traded publicly on a stock exchange.
The investment objectives of Horizons HGM are to use flexible tactical asset allocation among multiple global asset classes to seek long term growth, while also seeking to protect against downside risk. Horizons HGM invests primarily in exchange traded products that are listed on North American stock exchanges and may be exposed to equity securities, fixed-income securities or currencies around the world, or to gold.
AlphaPro Management Inc. (“AlphaPro” or the “Manager”) is the manager and trustee of the ETF. The Manager has ap-pointed Horizons ETFs Management (Canada) Inc. (“Horizons Management” or the “Investment Manager”), an affiliate of the Manager, to act as the investment manager to the ETF.
The Investment Manager is responsible for implementing the ETF’s investment strategies and for engaging the services of Forstrong Global Asset Management Inc. (“Forstrong” or the “Sub-Advisor”), to act as the sub-advisor to the ETF. The Man-ager and Investment Manager are both members of the Mirae Asset Financial Group (“Mirae Asset”).
2. BASIS OF PREPARATION
(i) Statement of compliance
These financial statements have been prepared in accordance with International Financial Reporting Standards (“IFRS”). Any mention of total net assets, net assets, net asset value or increase (decrease) in net assets is referring to net assets or increase (decrease) in net assets attributable to holders of redeemable units as reported under IFRS.
These financial statements were authorized for issue on August 10, 2016 by the Board of Directors of the Manager.
(ii) Basis of measurement
The financial statements have been prepared on the historical cost basis except for financial instruments at fair value though profit or loss, which are measured at fair value.
90412 - Horizons HGM.indd 21 2016-08-11 9:20 AM
Notes to Financial Statements (unaudited) (continued)June 30, 2016
22
Horizons Managed Global Opportunities ETF
(iii) Functional and presentation currency
These financial statements are presented in Canadian dollars, which is the ETF’s functional currency.
3. SIGNIFICANT ACCOUNTING POLICIES
The accounting policies set out below have been applied consistently to all periods presented in these financial statements.
(a) Financial instruments
(i) Recognition, initial measurement and classification
Financial assets and financial liabilities at fair value through profit or loss (“FVTPL”) are initially recognized on the trade date, at fair value (see below), with transaction costs recognized in the statements of comprehensive income. Other finan-cial assets and financial liabilities are recognized on the date on which they are originated at fair value.
The ETF classifies financial assets and financial liabilities into the following categories:
• Financial assets at fair value through profit or loss:
- Held for trading: derivative financial instruments
- Designated as at fair value through profit or loss: debt securities and equity investments
• Financial assets at amortized cost: All other financial assets are classified as loans and receivables
• Financial liabilities at fair value through profit or loss:
- Held for trading: derivative financial instruments
• Financial liabilities at amortized cost: all other financial liabilities are classified as other financial liabilities
(ii) Fair value measurement
Fair value is the price that would be received to sell an asset or paid to transfer a liability in an orderly transaction be-tween market participants at the measurement date in the principal or, in its absence, the most advantageous market to which the ETF has access at that date. The fair value of a liability reflects its non-performance risk.
Investments are valued at fair value as of the close of business on each day upon which a session of the TSX is held (“Valu-ation Date”) and based on external pricing sources to the extent possible. Investments held that are traded in an active market through recognized public stock exchanges, over-the-counter markets, or through recognized investment deal-ers, are valued at their closing sale price. However, such prices may be adjusted if a more accurate value can be obtained from recent trading activity or by incorporating other relevant information that may not have been reflected in pricing obtained from external sources. Short-term investments, including notes and money market instruments, are valued at amortized cost which approximates fair value.
Investments held that are not traded in an active market, including some derivative financial instruments, are valued us-ing observable market inputs where possible, on such basis and in such manner as established by the Manager. Deriva-tive financial instruments are recorded in the statements of financial position according to the gain or loss that would be realized if the contracts were closed out on the Valuation Date. Margin deposits, if any, are included in the schedule of investments as margin deposits. See also the summary of fair value measurements in note 7.
90412 - Horizons HGM.indd 22 2016-08-11 9:20 AM

Notes to Financial Statements (unaudited) (continued)June 30, 2016
23
Horizons Managed Global Opportunities ETF
Fair value policies used for financial reporting purposes are the same as those used to measure the net asset value (“NAV”) for transactions with unitholders.
The fair value of other financial assets and liabilities approximates their carrying values due to the short-term nature of these instruments.
(iii) Offsetting
Financial assets and liabilities are offset and the net amount presented in the statements of financial position when there is a legally enforceable right to offset the recognized amounts and there is an intention to settle on a net basis, or to real-ize the asset and settle the liability simultaneously.
Income and expenses are presented on a net basis for gains and losses from financial instruments at fair value through profit or loss and foreign exchange gains and losses.
(iv) Specific instruments
Cash and cash equivalents
Cash and cash equivalents consist of cash on deposit and short-term, interest bearing notes with a term to maturity of less than three months from the date of purchase.
Forward foreign exchange contracts
Forward foreign exchange contracts, if any, are valued at the current market value thereof on the Valuation Date. The val-ue of these forward contracts is the gain or loss that would be realized if, on the Valuation Date, the positions were to be closed out and recorded as derivative assets and/or liabilities in the statements of financial position and as a net change in unrealized appreciation (depreciation) of investments and derivatives in the statements of comprehensive income. When the forward contracts are closed out or mature, realized gains or losses on forward contracts are recognized and are included in the statements of comprehensive income in net realized gain (loss) on sale of investments and derivatives. The Canadian dollar value of forward foreign exchange contracts is determined using forward currency exchange rates supplied by an independent service provider.
Redeemable units
The redeemable units are measured at the present value of the redemption amounts and are considered a residual amount of the net assets attributable to holders of redeemable units. They are classified as financial liabilities as a result of the ETF’s requirement to distribute net income and capital gains to unitholders and because the ETF has multiple classes of units with different features, as described in note 10.
(b) Investment income
Investment transactions are accounted for as of the trade date. Realized gains and losses from investment transactions are calculated on a weighted average cost basis. The difference between fair value and average cost, as recorded in the financial statements, is included in the statements of comprehensive income as part of the net change in unrealized ap-preciation (depreciation) of investments and derivatives. Interest income for distribution purposes from investments in bonds and short-term investments represents the coupon interest received by the ETF accounted for on an accrual basis.
90412 - Horizons HGM.indd 23 2016-08-11 9:20 AM
Notes to Financial Statements (unaudited) (continued)June 30, 2016
24
Horizons Managed Global Opportunities ETF
The ETF does not amortize premiums paid or discounts received on the purchase of fixed income securities. The ETF does not use the effective interest method. Dividend income is recognized on the ex-dividend date. Distribution income from investments in other funds or ETFs is recognized when earned.
Income from derivatives is shown in the statements of comprehensive income as net realized gain (loss) on sale of invest-ments and derivatives; net change in unrealized appreciation (depreciation) of investments and derivatives; and, interest income for distribution purposes, in accordance with its nature.
Income from securities lending, if any, is included in “Securities lending income” on the statements of comprehensive income and is recognized when earned. Any securities on loan continue to be displayed in the schedule of investments and the market value of the securities loaned and collateral held is determined daily (see note 8).
If the ETF incurs withholding taxes imposed by certain countries on investment income and capital gains, such income and gains are recorded on a gross basis and the related withholding taxes are shown as a separate expense in the state-ments of comprehensive income.
(c) Foreign currency
Transactions in foreign currencies are translated into the ETF’s reporting currency using the exchange rate prevailing on the trade date. Monetary assets and liabilities denominated in foreign currencies at the reporting date are translated at the period-end exchange rate. Foreign exchange gains and losses are presented as “Net realized gain (loss) on foreign exchange”, except for those arising from financial instruments at fair value through profit or loss, which are recognized as a component within “Net realized gain (loss) on sale of investments and derivatives” and “Net change in unrealized appre-ciation (depreciation) of investments and derivatives” in the statements of comprehensive income.
(d) Cost basis
The cost of portfolio investments is determined on an average cost basis.
(e) Increase (decrease) in net assets attributable to holders of redeemable units per unit
The increase (decrease) in net assets per unit by class in the statements of comprehensive income represents the change in net assets attributable to holders of redeemable units from operations attributable to each class divided by the weighted average number of units of that class outstanding during the reporting period. Income, expenses other than management fees, and realized and unrealized capital gains (losses) are distributed amongst the different classes of units in proportion to the amount invested in them. For management fees please refer to note 10.
(f) Unitholder transactions
The value at which units are issued or redeemed is determined by dividing the net asset value of the class by the total number of units outstanding of that class on the Valuation Date. Amounts received on the issuance of units and amounts paid on the redemption of units are included in the statements of changes in financial position.
(g) Amounts receivable (payable) relating to portfolio assets sold (purchased)
In accordance with the ETF’s policy of trade date accounting for sale and purchase transactions, sales/purchase transac-tions awaiting settlement represent amounts receivable/payable for securities sold/purchased, but not yet settled as at the reporting date.
90412 - Horizons HGM.indd 24 2016-08-11 9:20 AM

Notes to Financial Statements (unaudited) (continued)June 30, 2016
25
Horizons Managed Global Opportunities ETF
(h) Net assets attributable to holders of redeemable units per unit
Net assets attributable to holders of redeemable units per unit is calculated for each class of units of the ETF by taking the respective class’ proportionate share of the ETF’s net assets attributable to holders of redeemable units and dividing by the number of units of that class outstanding on the Valuation Date.
(i) Transaction costs
Transaction costs are incremental costs that are directly attributable to the acquisition, issue or disposal of an investment, which include fees and commissions paid to agents, advisors, brokers and dealers, levies by regulatory agencies and secu-rities exchanges, and transfer taxes and duties. Transaction costs are expensed and are included in “Transaction costs” in the statements of comprehensive income.
(j) Future accounting changes
The International Accounting Standards Board (“IASB”) has issued the following new standards and amendments to exist-ing standards that are not yet effective.
IFRS 9, Financial Instruments (“IFRS 9”):
In July 2014, the IASB issued IFRS 9, Financial Instruments, to replace International Accounting Standard 39, Financial In-struments – Recognition and Measurement (“IAS 39”). IFRS 9 addresses classification and measurement, impairment and hedge accounting.
The new standard requires assets to be classified based on the ETF’s business model for managing the financial assets and contractual cash flow characteristics of the financial assets. Financial assets will be measured at fair value through profit and loss unless certain conditions are met which permit measurement at amortized cost or value through other compre-hensive income.
The classification and measurement of liabilities remain generally unchanged, with the exception of liabilities recorded at fair value through profit and loss. For financial liabilities designated at fair value through profit and loss, IFRS 9 requires the presentation of the effects of changes in the ETF’s own credit risk in other comprehensive income instead of net income.
IFRS 9 is effective for fiscal years beginning on January 1, 2018, though early adoption is permitted. The Manager is cur-rently assessing the impact of this new standard on the ETF’s financial statements.
4. CRITICAL ACCOUNTING ESTIMATES AND JUDGEMENTS
In preparing these financial statements, the Manager has made judgements, estimates and assumptions that affect the application of accounting policies and the reported amounts of assets, liabilities, income and expenses. Actual results may differ from these estimates. Estimates and underlying assumptions are reviewed on an ongoing basis. Revisions to estimates are recognized prospectively.
The ETF may hold financial instruments that are not quoted in active markets, including derivatives. The determination of the fair value of these instruments is the area with the most significant accounting judgements and estimates that the ETF has made in preparing the financial statements. See note 7 for more information on the fair value measurement of the ETF’s financial instruments.
90412 - Horizons HGM.indd 25 2016-08-11 9:20 AM

Notes to Financial Statements (unaudited) (continued)June 30, 2016
26
Horizons Managed Global Opportunities ETF
5. FINANCIAL INSTRUMENTS RISK
In the normal course of business, the ETF’s investment activities expose it to a variety of financial risks. The Manager seeks to minimize potential adverse effects of these risks for the ETF’s performance by employing professional, experienced portfolio advisors, by daily monitoring of the ETF’s positions and market events, and periodically may use derivatives to hedge certain risk exposures. To assist in managing risks, the Manager maintains a governance structure that oversees the ETF’s investment activities and monitors compliance with the ETF’s stated investment strategies, internal guidelines and securities regulations.
Please refer to the most recent prospectus for a complete discussion of the risks attributed to an investment in the units of the ETF. Significant financial instrument risks that are relevant to the ETF and an analysis of how they are managed are presented below.
(a) Market risk
Market risk is the risk that changes in market prices, such as interest rates, equity prices, foreign exchange rates and credit spreads (not relating to changes in the obligor’s/issuer’s credit standing) will affect the ETF’s income or the fair value of its holdings of financial instruments. The objective of market risk management is to manage and control market risk expo-sures within acceptable parameters, while optimizing the return.
(i) Currency risk
Currency risk is the risk that financial instruments which are denominated in currencies other than the ETF’s reporting currency, the Canadian dollar, will fluctuate due to changes in exchange rates and adversely impact the ETF’s income, cash flows or fair values of its investment holdings. The ETF may reduce its foreign currency exposure through the use of derivative arrangements such as foreign exchange forward contracts or futures contracts. The following tables indicate the foreign currencies to which the ETF had significant exposure as at June 30, 2016 and December 31, 2015 in Canadian dollar terms and the potential impact on the ETF’s net assets (including the underlying principal amount of future or for-ward currency contracts, if any), as a result of a 1% change in these currencies relative to the Canadian dollar:
June 30, 2016 Financial Instruments Currency Forward and/
or Futures Contracts TotalImpact on Net
Asset Value
Currency ($000's) ($000's) ($000's) ($000's)
Chinese Yuan 10,695 – 10,695 107
Euro Currency 8,233 – 8,233 82
Hong Kong Dollar 6,879 – 6,879 69
Indian Rupee 5,467 – 5,467 55
Japanese Yen 13,701 – 13,701 137
Polish Zloty 5,666 – 5,666 57
Swedish Krona 6,100 – 6,100 61
U.S. Dollar 28,715 – 28,715 287
Other Currencies* 21,290 – 21,290 213
Total 106,746 – 106,746 1,068
As % of Net Asset Value 98.6% – 98.6% 1.0%
90412 - Horizons HGM.indd 26 2016-08-11 9:20 AM
Notes to Financial Statements (unaudited) (continued)June 30, 2016
27
Horizons Managed Global Opportunities ETF
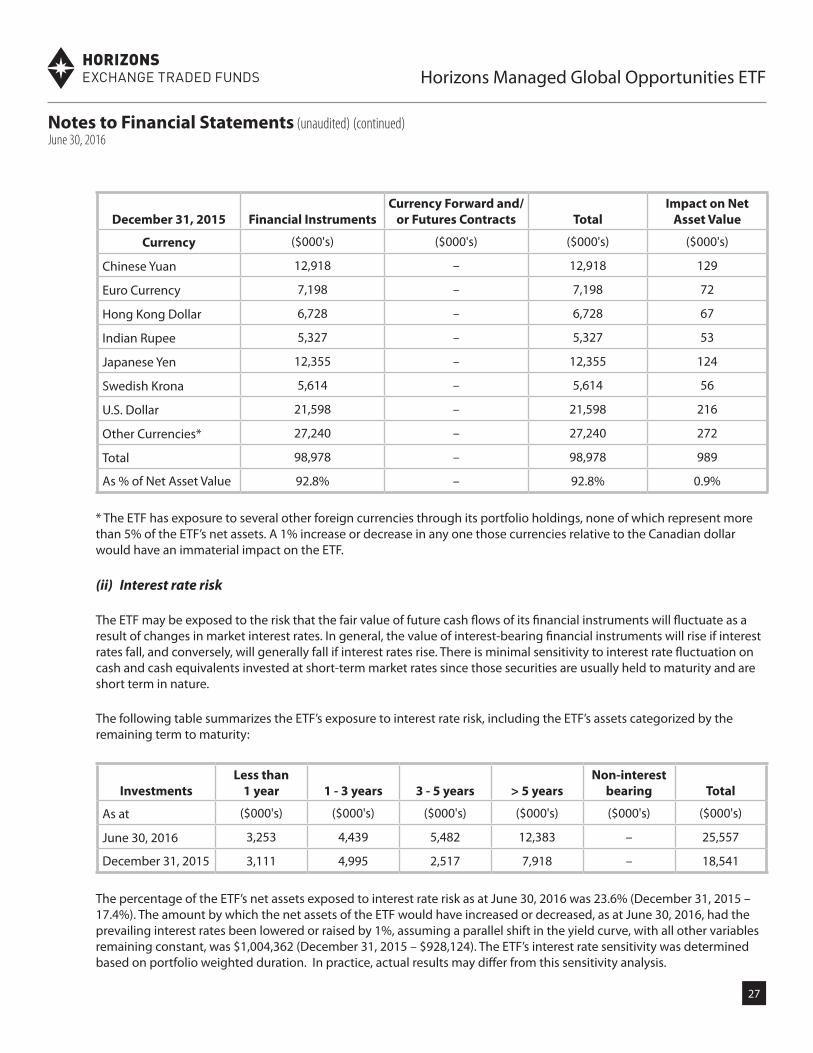
December 31, 2015 Financial Instruments Currency Forward and/
or Futures Contracts TotalImpact on Net
Asset Value
Currency ($000's) ($000's) ($000's) ($000's)
Chinese Yuan 12,918 – 12,918 129
Euro Currency 7,198 – 7,198 72
Hong Kong Dollar 6,728 – 6,728 67
Indian Rupee 5,327 – 5,327 53
Japanese Yen 12,355 – 12,355 124
Swedish Krona 5,614 – 5,614 56
U.S. Dollar 21,598 – 21,598 216
Other Currencies* 27,240 – 27,240 272
Total 98,978 – 98,978 989
As % of Net Asset Value 92.8% – 92.8% 0.9%
* The ETF has exposure to several other foreign currencies through its portfolio holdings, none of which represent more than 5% of the ETF’s net assets. A 1% increase or decrease in any one those currencies relative to the Canadian dollar would have an immaterial impact on the ETF.
(ii) Interest rate risk
The ETF may be exposed to the risk that the fair value of future cash flows of its financial instruments will fluctuate as a result of changes in market interest rates. In general, the value of interest-bearing financial instruments will rise if interest rates fall, and conversely, will generally fall if interest rates rise. There is minimal sensitivity to interest rate fluctuation on cash and cash equivalents invested at short-term market rates since those securities are usually held to maturity and are short term in nature.
The following table summarizes the ETF’s exposure to interest rate risk, including the ETF’s assets categorized by the remaining term to maturity:
InvestmentsLess than
1 year 1 - 3 years 3 - 5 years > 5 yearsNon-interest
bearing Total
As at ($000's) ($000's) ($000's) ($000's) ($000's) ($000's)
June 30, 2016 3,253 4,439 5,482 12,383 – 25,557
December 31, 2015 3,111 4,995 2,517 7,918 – 18,541
The percentage of the ETF’s net assets exposed to interest rate risk as at June 30, 2016 was 23.6% (December 31, 2015 – 17.4%). The amount by which the net assets of the ETF would have increased or decreased, as at June 30, 2016, had the prevailing interest rates been lowered or raised by 1%, assuming a parallel shift in the yield curve, with all other variables remaining constant, was $1,004,362 (December 31, 2015 – $928,124). The ETF’s interest rate sensitivity was determined based on portfolio weighted duration. In practice, actual results may differ from this sensitivity analysis.
90412 - Horizons HGM.indd 27 2016-08-11 9:20 AM
Notes to Financial Statements (unaudited) (continued)June 30, 2016
28
Horizons Managed Global Opportunities ETF
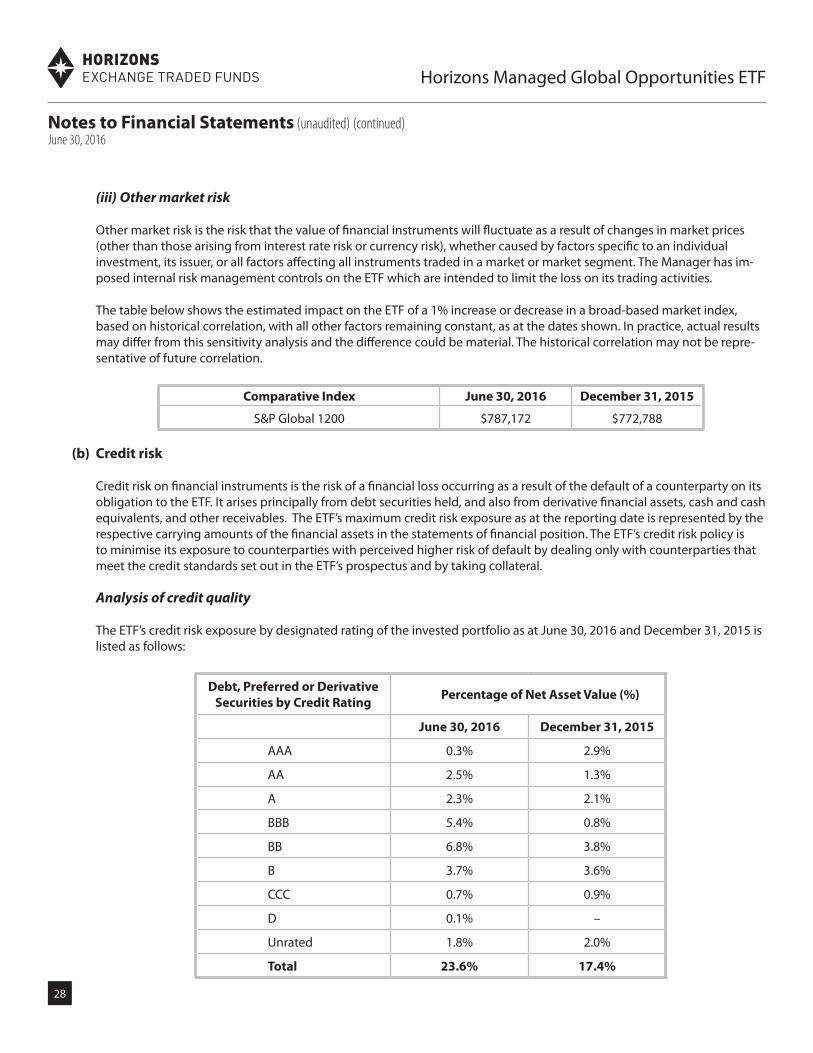
(iii) Other market risk
Other market risk is the risk that the value of financial instruments will fluctuate as a result of changes in market prices (other than those arising from interest rate risk or currency risk), whether caused by factors specific to an individual investment, its issuer, or all factors affecting all instruments traded in a market or market segment. The Manager has im-posed internal risk management controls on the ETF which are intended to limit the loss on its trading activities.
The table below shows the estimated impact on the ETF of a 1% increase or decrease in a broad-based market index, based on historical correlation, with all other factors remaining constant, as at the dates shown. In practice, actual results may differ from this sensitivity analysis and the difference could be material. The historical correlation may not be repre-sentative of future correlation.
Comparative Index June 30, 2016 December 31, 2015
S&P Global 1200 $787,172 $772,788
(b) Credit risk
Credit risk on financial instruments is the risk of a financial loss occurring as a result of the default of a counterparty on its obligation to the ETF. It arises principally from debt securities held, and also from derivative financial assets, cash and cash equivalents, and other receivables. The ETF’s maximum credit risk exposure as at the reporting date is represented by the respective carrying amounts of the financial assets in the statements of financial position. The ETF’s credit risk policy is to minimise its exposure to counterparties with perceived higher risk of default by dealing only with counterparties that meet the credit standards set out in the ETF’s prospectus and by taking collateral.
Analysis of credit quality
The ETF’s credit risk exposure by designated rating of the invested portfolio as at June 30, 2016 and December 31, 2015 is listed as follows:
Debt, Preferred or Derivative Securities by Credit Rating Percentage of Net Asset Value (%)
June 30, 2016 December 31, 2015
AAA 0.3% 2.9%
AA 2.5% 1.3%
A 2.3% 2.1%
BBB 5.4% 0.8%
BB 6.8% 3.8%
B 3.7% 3.6%
CCC 0.7% 0.9%
D 0.1% –
Unrated 1.8% 2.0%
Total 23.6% 17.4%
90412 - Horizons HGM.indd 28 2016-08-11 9:20 AM

Notes to Financial Statements (unaudited) (continued)June 30, 2016
29
Horizons Managed Global Opportunities ETF
Designated ratings are obtained by Standard & Poor’s, Moody’s and/or Dominion Bond Rating Services. Where more than one rating is obtained for a security, the lowest rating has been used. Credit risk is managed by dealing with counterpar-ties the ETF believes to be creditworthy and by regular monitoring of credit exposures. The maximum exposure to any one debt issuer as of June 30, 2016 was 0.9% (December 31, 2015 – 2.4%) of the net assets of the ETF.
(c) Liquidity risk
Liquidity risk is the risk that the ETF will encounter difficulty in meeting the obligations associated with its financial liabili-ties that are settled by delivering cash or another financial asset. The ETF’s policy and the investment manager’s approach to managing liquidity is to ensure, as far as possible, that it will always have sufficient liquidity to meet its liabilities when due, under both normal and stress conditions, including estimated redemptions of shares, without incurring unaccept-able losses or risking damage to the ETF’s reputation. Liquidity risk is managed by investing the majority of the ETF’s as-sets in investments that are traded in an active market and can be readily disposed. The ETF aims to retain sufficient cash and cash equivalent positions to maintain liquidity; therefore, the liquidity risk for the ETF is considered minimal.
6. NET CHANGES FROM FINANCIAL INSTRUMENTS AT FAIR VALUE THROUGH PROFIT OR LOSS
Net changes in fair value on financial assets and financial liabilities at fair value through profit or loss presented in the table below are comprised of the following: net realized gain (loss) on sale of investments and derivatives, net change in unrealized appreciation (depreciation) of investments and derivatives, dividend income and interest income for distribution purposes. Their classifications between held for trading and designated at fair value are presented in the following table:
Net Changes at FVTPL ($)
Category June 30, 2016
Financial assets (liabilities) at FVTPL:
Held for trading –
Designated at fair value (5,300,966)
Total financial assets (liabilities) at FVTPL (5,300,966)
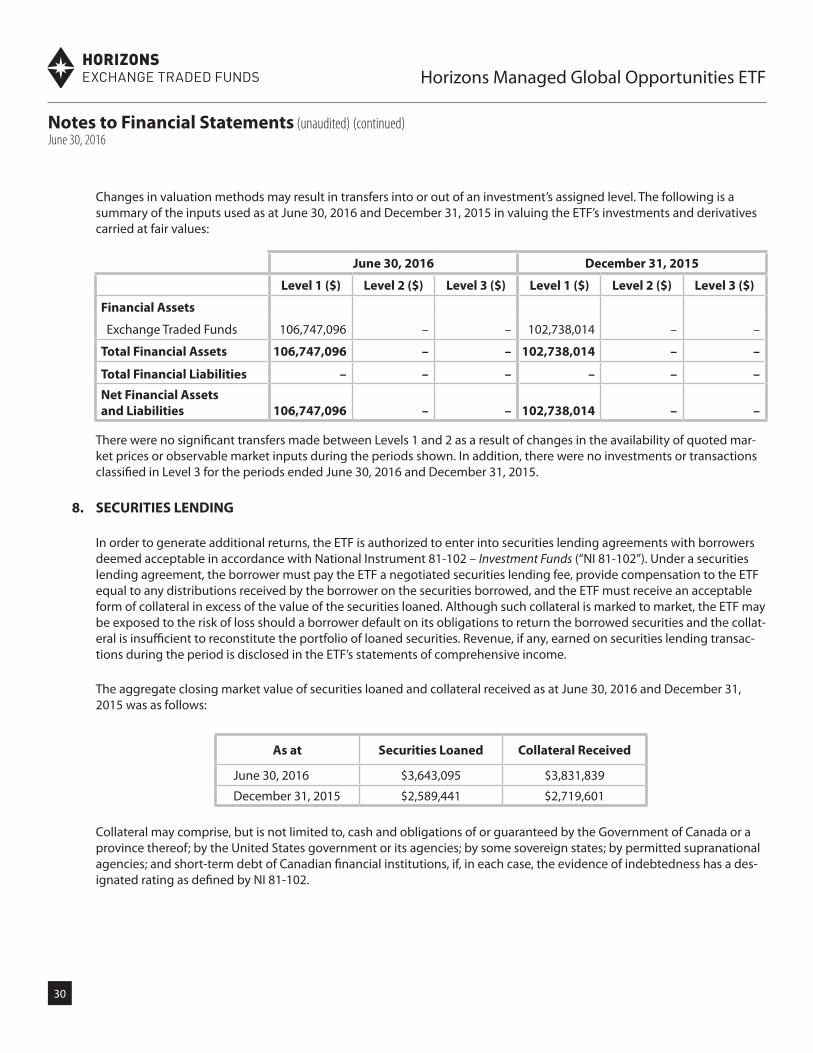
7. FAIR VALUE MEASUREMENT
Below is a classification of fair value measurements of the ETF’s investments based on a three level fair value hierarchy and a reconciliation of transactions and transfers within that hierarchy. The hierarchy of fair valuation inputs is summa-rized as follows:
• Level 1: securities that are valued based on quoted prices in active markets.
• Level 2: securities that are valued based on inputs other than quoted prices that are observable, either directly as prices, or indirectly as derived from prices.
• Level 3: securities that are valued with significant unobservable market data.
90412 - Horizons HGM.indd 29 2016-08-11 9:20 AM
Notes to Financial Statements (unaudited) (continued)June 30, 2016
30
Horizons Managed Global Opportunities ETF
Changes in valuation methods may result in transfers into or out of an investment’s assigned level. The following is a summary of the inputs used as at June 30, 2016 and December 31, 2015 in valuing the ETF’s investments and derivatives carried at fair values:
June 30, 2016 December 31, 2015
Level 1 ($) Level 2 ($) Level 3 ($) Level 1 ($) Level 2 ($) Level 3 ($)
Financial Assets
Exchange Traded Funds 106,747,096 – – 102,738,014 – –
Total Financial Assets 106,747,096 – – 102,738,014 – –
Total Financial Liabilities – – – – – –
Net Financial Assets and Liabilities 106,747,096 – – 102,738,014 – –
There were no significant transfers made between Levels 1 and 2 as a result of changes in the availability of quoted mar-ket prices or observable market inputs during the periods shown. In addition, there were no investments or transactions classified in Level 3 for the periods ended June 30, 2016 and December 31, 2015.
8. SECURITIES LENDING
In order to generate additional returns, the ETF is authorized to enter into securities lending agreements with borrowers deemed acceptable in accordance with National Instrument 81-102 – Investment Funds (“NI 81-102”). Under a securities lending agreement, the borrower must pay the ETF a negotiated securities lending fee, provide compensation to the ETF equal to any distributions received by the borrower on the securities borrowed, and the ETF must receive an acceptable form of collateral in excess of the value of the securities loaned. Although such collateral is marked to market, the ETF may be exposed to the risk of loss should a borrower default on its obligations to return the borrowed securities and the collat-eral is insufficient to reconstitute the portfolio of loaned securities. Revenue, if any, earned on securities lending transac-tions during the period is disclosed in the ETF’s statements of comprehensive income.
The aggregate closing market value of securities loaned and collateral received as at June 30, 2016 and December 31, 2015 was as follows:
As at Securities Loaned Collateral Received
June 30, 2016 $3,643,095 $3,831,839
December 31, 2015 $2,589,441 $2,719,601
Collateral may comprise, but is not limited to, cash and obligations of or guaranteed by the Government of Canada or a province thereof; by the United States government or its agencies; by some sovereign states; by permitted supranational agencies; and short-term debt of Canadian financial institutions, if, in each case, the evidence of indebtedness has a des- ignated rating as defined by NI 81-102.
90412 - Horizons HGM.indd 30 2016-08-11 9:20 AM
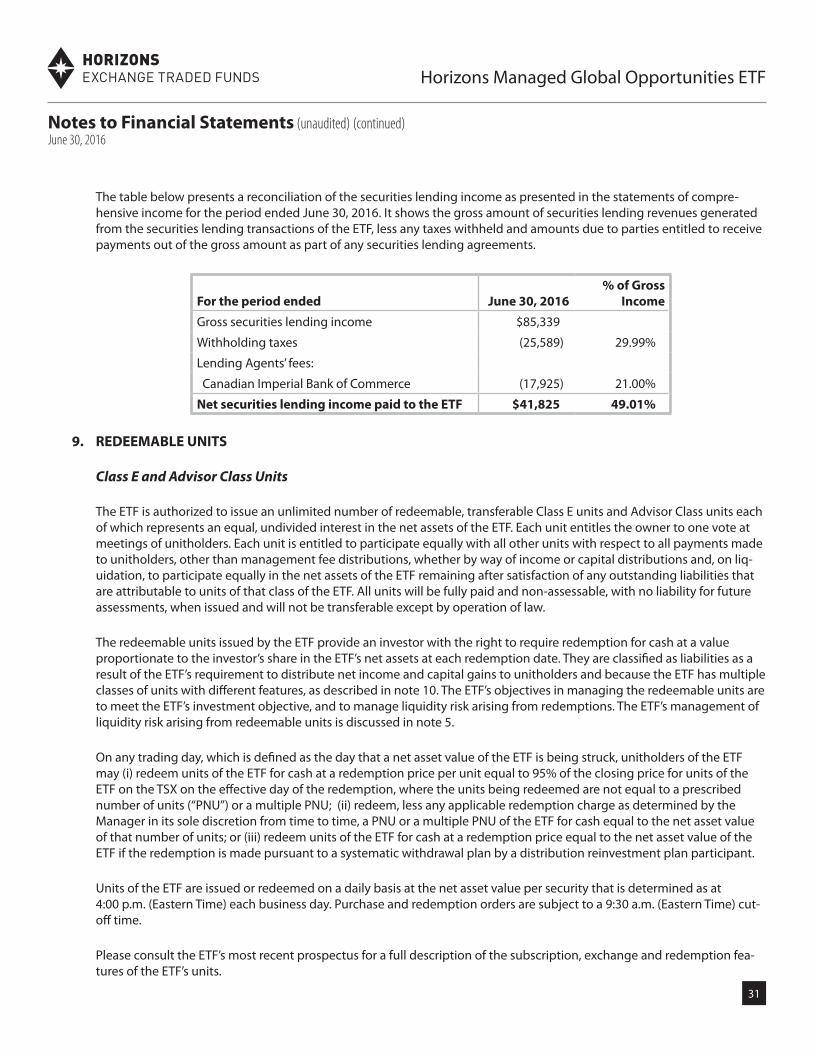
Notes to Financial Statements (unaudited) (continued)June 30, 2016
31
Horizons Managed Global Opportunities ETF
The table below presents a reconciliation of the securities lending income as presented in the statements of compre-hensive income for the period ended June 30, 2016. It shows the gross amount of securities lending revenues generated from the securities lending transactions of the ETF, less any taxes withheld and amounts due to parties entitled to receive payments out of the gross amount as part of any securities lending agreements.
For the period ended June 30, 2016% of Gross
Income
Gross securities lending income $85,339
Withholding taxes (25,589) 29.99%
Lending Agents’ fees:
Canadian Imperial Bank of Commerce (17,925) 21.00%
Net securities lending income paid to the ETF $41,825 49.01%
9. REDEEMABLE UNITS
Class E and Advisor Class Units
The ETF is authorized to issue an unlimited number of redeemable, transferable Class E units and Advisor Class units each of which represents an equal, undivided interest in the net assets of the ETF. Each unit entitles the owner to one vote at meetings of unitholders. Each unit is entitled to participate equally with all other units with respect to all payments made to unitholders, other than management fee distributions, whether by way of income or capital distributions and, on liq-uidation, to participate equally in the net assets of the ETF remaining after satisfaction of any outstanding liabilities that are attributable to units of that class of the ETF. All units will be fully paid and non-assessable, with no liability for future assessments, when issued and will not be transferable except by operation of law.
The redeemable units issued by the ETF provide an investor with the right to require redemption for cash at a value proportionate to the investor’s share in the ETF’s net assets at each redemption date. They are classified as liabilities as a result of the ETF’s requirement to distribute net income and capital gains to unitholders and because the ETF has multiple classes of units with different features, as described in note 10. The ETF’s objectives in managing the redeemable units are to meet the ETF’s investment objective, and to manage liquidity risk arising from redemptions. The ETF’s management of liquidity risk arising from redeemable units is discussed in note 5.
On any trading day, which is defined as the day that a net asset value of the ETF is being struck, unitholders of the ETF may (i) redeem units of the ETF for cash at a redemption price per unit equal to 95% of the closing price for units of the ETF on the TSX on the effective day of the redemption, where the units being redeemed are not equal to a prescribed number of units (“PNU”) or a multiple PNU; (ii) redeem, less any applicable redemption charge as determined by the Manager in its sole discretion from time to time, a PNU or a multiple PNU of the ETF for cash equal to the net asset value of that number of units; or (iii) redeem units of the ETF for cash at a redemption price equal to the net asset value of the ETF if the redemption is made pursuant to a systematic withdrawal plan by a distribution reinvestment plan participant.
Units of the ETF are issued or redeemed on a daily basis at the net asset value per security that is determined as at 4:00 p.m. (Eastern Time) each business day. Purchase and redemption orders are subject to a 9:30 a.m. (Eastern Time) cut-off time.
Please consult the ETF’s most recent prospectus for a full description of the subscription, exchange and redemption fea-tures of the ETF’s units.
90412 - Horizons HGM.indd 31 2016-08-11 9:20 AM
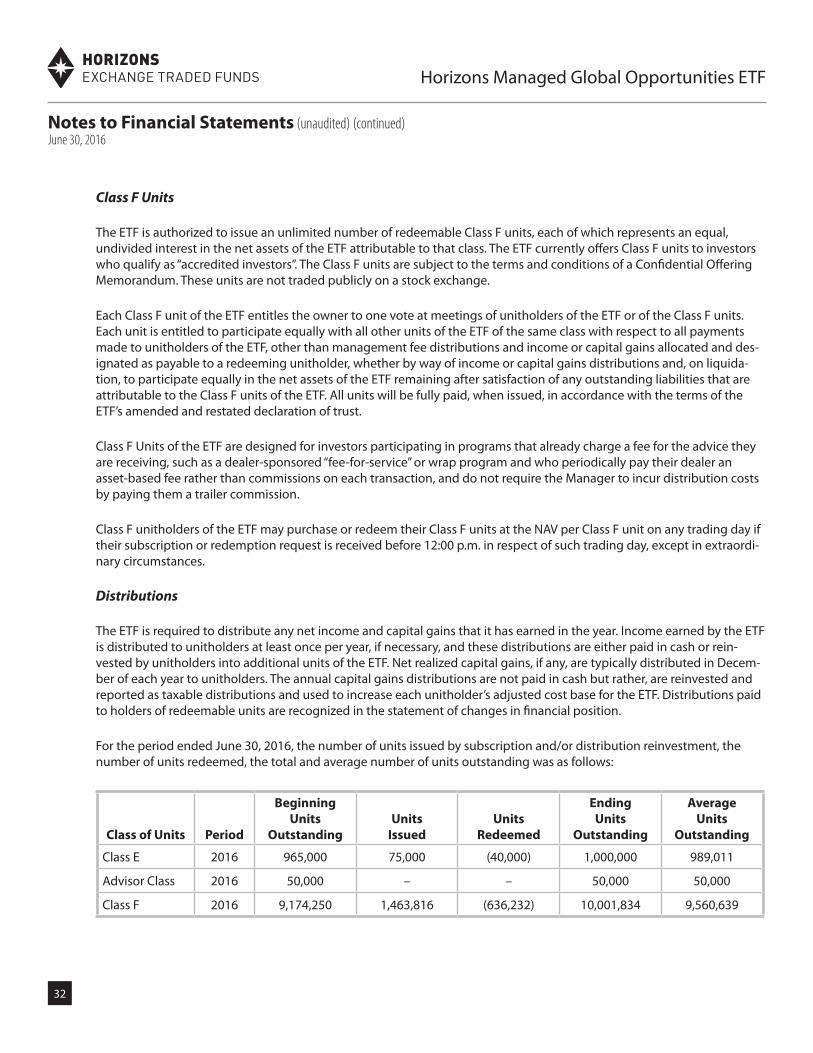
Notes to Financial Statements (unaudited) (continued)June 30, 2016
32
Horizons Managed Global Opportunities ETF
Class F Units
The ETF is authorized to issue an unlimited number of redeemable Class F units, each of which represents an equal, undivided interest in the net assets of the ETF attributable to that class. The ETF currently offers Class F units to investors who qualify as “accredited investors”. The Class F units are subject to the terms and conditions of a Confidential Offering Memorandum. These units are not traded publicly on a stock exchange.
Each Class F unit of the ETF entitles the owner to one vote at meetings of unitholders of the ETF or of the Class F units. Each unit is entitled to participate equally with all other units of the ETF of the same class with respect to all payments made to unitholders of the ETF, other than management fee distributions and income or capital gains allocated and des-ignated as payable to a redeeming unitholder, whether by way of income or capital gains distributions and, on liquida-tion, to participate equally in the net assets of the ETF remaining after satisfaction of any outstanding liabilities that are attributable to the Class F units of the ETF. All units will be fully paid, when issued, in accordance with the terms of the ETF’s amended and restated declaration of trust.
Class F Units of the ETF are designed for investors participating in programs that already charge a fee for the advice they are receiving, such as a dealer-sponsored “fee-for-service” or wrap program and who periodically pay their dealer an asset-based fee rather than commissions on each transaction, and do not require the Manager to incur distribution costs by paying them a trailer commission.
Class F unitholders of the ETF may purchase or redeem their Class F units at the NAV per Class F unit on any trading day if their subscription or redemption request is received before 12:00 p.m. in respect of such trading day, except in extraordi-nary circumstances.
Distributions
The ETF is required to distribute any net income and capital gains that it has earned in the year. Income earned by the ETF is distributed to unitholders at least once per year, if necessary, and these distributions are either paid in cash or rein-vested by unitholders into additional units of the ETF. Net realized capital gains, if any, are typically distributed in Decem-ber of each year to unitholders. The annual capital gains distributions are not paid in cash but rather, are reinvested and reported as taxable distributions and used to increase each unitholder’s adjusted cost base for the ETF. Distributions paid to holders of redeemable units are recognized in the statement of changes in financial position.
For the period ended June 30, 2016, the number of units issued by subscription and/or distribution reinvestment, the number of units redeemed, the total and average number of units outstanding was as follows:
Class of Units Period
Beginning Units
Outstanding Units
Issued Units
Redeemed
Ending Units
Outstanding
Average Units
Outstanding
Class E 2016 965,000 75,000 (40,000) 1,000,000 989,011
Advisor Class 2016 50,000 – – 50,000 50,000
Class F 2016 9,174,250 1,463,816 (636,232) 10,001,834 9,560,639
90412 - Horizons HGM.indd 32 2016-08-11 9:20 AM
Notes to Financial Statements (unaudited) (continued)June 30, 2016
33
Horizons Managed Global Opportunities ETF
10. EXPENSES
Management fees
The Manager appoints the Investment Manager and provides, or oversees the provision of, administrative services re-quired by the ETF including, but not limited to: negotiating contracts with certain third-party service providers, such as portfolio managers, custodians, registrars, transfer agents, auditors and printers; authorizing the payment of operating expenses incurred on behalf of the ETF; arranging for the maintenance of accounting records for the ETF; preparing re-ports to unitholders and to the applicable securities regulatory authorities; calculating the amount and determining the frequency of distributions by the ETF; preparing financial statements, income tax returns and financial and accounting information as required by the ETF; ensuring that unitholders are provided with financial statements and other reports as are required from time to time by applicable law; ensuring that the ETF complies with all other regulatory requirements, including the continuous disclosure obligations of the ETF under applicable securities laws; administering purchases, redemptions and other transactions in units of the ETF; and dealing and communicating with unitholders of the ETF. The Manager provides office facilities and personnel to carry out these services, if not otherwise furnished by any other ser-vice provider to the ETF. The Manager also monitors the investment strategies of the ETF to ensure that the ETF complies with its investment objectives, investment strategies and investment restrictions and practices.
In consideration for the provision of these services, the Manager receives a monthly management fee at the annual rate of 0.85%, plus applicable sales taxes, of the net asset value of the ETF’s Class E units, 1.60%, plus applicable sales taxes, of the net asset value of the ETF’s Advisor Class units, and 0.425%, plus applicable sales taxes, of the net asset value of the Class F units, calculated and accrued daily and payable monthly in arrears.
The Manager, and not the ETF, will pay to registered dealers a service fee equal to 0.75% per year of the net asset value of Advisor Class units held by clients of the registered dealer. No service fees are paid to registered dealers in respect of Class E units.
The Investment Manager and Sub-Advisor are compensated for their services out of the management fees without any further cost to the ETF. Any expenses of the ETF which are waived or absorbed by the Manager are paid out of the man-agement fees received by the Manager.
Other expenses
Unless otherwise waived or absorbed by the Manager, the ETF pays all of its operating expenses, including but not limited to: audit fees; trustee and custodial expenses; valuation, accounting and record keeping costs; legal expenses; permitted prospectus preparation and filing expenses; costs associated with delivering documents to unitholders; listing and annual stock exchange fees; index licensing fees, if applicable; CDS Clearing and Depository Services Inc. fees; bank related fees and interest charges; extraordinary expenses; unitholder reports and servicing costs; registrar and transfer agent fees; costs of the Independent Review Committee; income taxes; sales taxes; brokerage expenses and commissions; and withholding taxes.
The Manager, at its discretion, may waive and/or absorb a portion of the fees and/or expenses otherwise payable by the ETF. The waiving and/or absorption of such fees and/or expenses by the Manager may be terminated at any time, or con-tinued indefinitely, at the discretion of the Manager.
90412 - Horizons HGM.indd 33 2016-08-11 9:20 AM

Notes to Financial Statements (unaudited) (continued)June 30, 2016
34
Horizons Managed Global Opportunities ETF
11. BROKER COMMISSIONS, SOFT DOLLARS AND RELATED PARTY TRANSACTIONS
An affiliate of National Bank of Canada (“NBC”) and National Bank Financial Inc. (“NBF”) holds an indirect minority interest in the Manager. NBF acts or may act as a designated broker, an underwriter and/or a registered trader (market maker). NBC, NBF and its affiliates may, at present or in the future, engage in business with the ETF, the issuers of securities mak-ing up the investment portfolio of the ETF, or with the Manager or any funds sponsored by the Manager or its affiliates, including by making loans, executing brokerage transactions, entering into derivative transactions or providing advisory or agency services.
Brokerage commissions paid on securities transactions may include amounts paid to related parties of the Manager for brokerage services provided to the ETF.
Research and system usage related services received in return for commissions generated with specific dealers are gener-ally referred to as soft dollars.
Total brokerage commissions paid to dealers in connection with investment portfolio transactions, soft dollar transac-tions incurred and amounts paid to related parties of the Manager for the period ended June 30, 2016 were as follows:
Period Ended Brokerage Commissions Paid
Soft Dollar Transactions
Amount Paid to Related Parties
June 30, 2016 $33,043 $nil $33,043
In addition to the information contained in the table above, the management fees paid to the Manager described in note 10 are related party transactions, as the Manager is considered to be a related party to the ETF. Fees paid to the Inde-pendent Review Committee are also considered to be related party transactions and are disclosed in the statements of comprehensive income.
The ETF may invest in other ETFs managed by the Manager or its affiliates, in accordance with the ETF’s investment objec-tives and strategies. Such investments, if any, are disclosed in the schedule of investments.
12. INCOME TAX
The ETF has qualified as a mutual fund trust under the Income Tax Act (Canada) (the “Tax Act”) and accordingly, is not taxed on the portion of taxable income that is paid or allocated to unitholders. As well, tax refunds (based on redemp-tions and realized and unrealized gains during the year) may be available that would make it possible to retain some net capital gains in the ETF without incurring any income taxes.
13. TAX LOSSES CARRIED FORWARD
Capital losses for income tax purposes may be carried forward indefinitely and applied against capital gains realized in future years. Non-capital losses carried forwards may be applied against future years’ taxable income. Non-capital losses that are realized in the current taxation year may be carried forward for 20 years. As at December 31, 2015, the ETF had no net capital or non-capital losses available.
90412 - Horizons HGM.indd 34 2016-08-11 9:20 AM
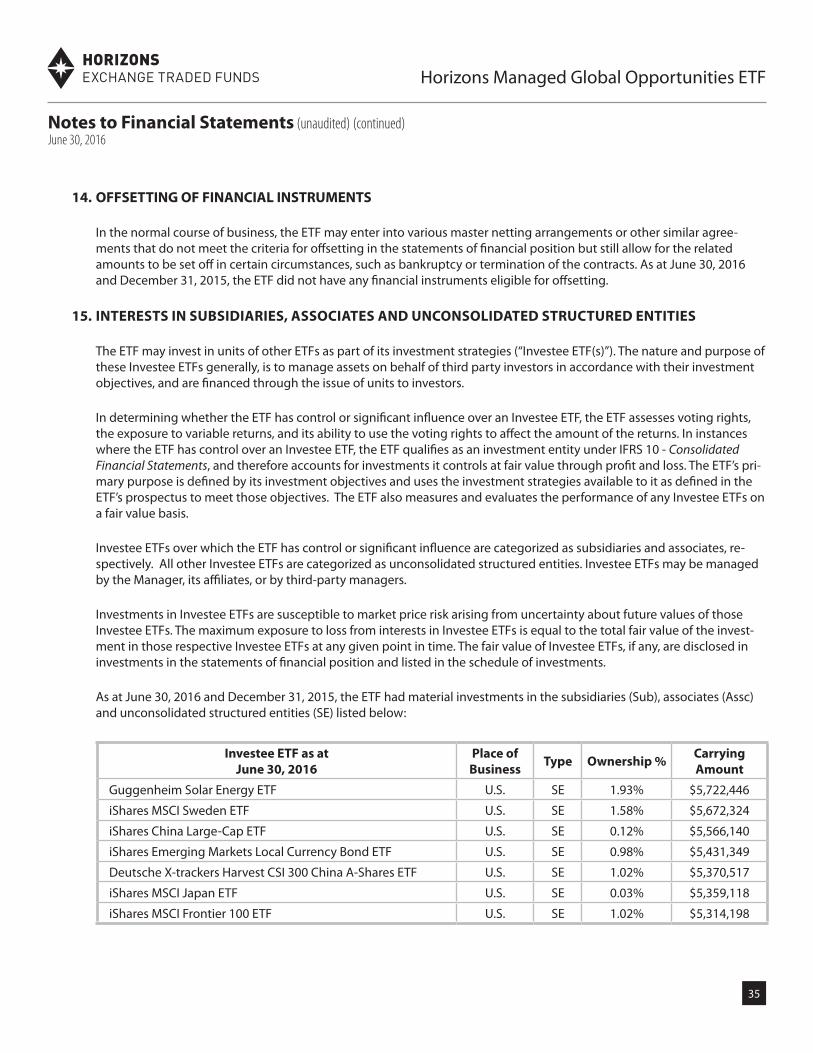
Notes to Financial Statements (unaudited) (continued)June 30, 2016
35
Horizons Managed Global Opportunities ETF
14. OFFSETTING OF FINANCIAL INSTRUMENTS
In the normal course of business, the ETF may enter into various master netting arrangements or other similar agree-ments that do not meet the criteria for offsetting in the statements of financial position but still allow for the related amounts to be set off in certain circumstances, such as bankruptcy or termination of the contracts. As at June 30, 2016 and December 31, 2015, the ETF did not have any financial instruments eligible for offsetting.
15. INTERESTS IN SUBSIDIARIES, ASSOCIATES AND UNCONSOLIDATED STRUCTURED ENTITIES
The ETF may invest in units of other ETFs as part of its investment strategies (“Investee ETF(s)”). The nature and purpose of these Investee ETFs generally, is to manage assets on behalf of third party investors in accordance with their investment objectives, and are financed through the issue of units to investors.
In determining whether the ETF has control or significant influence over an Investee ETF, the ETF assesses voting rights, the exposure to variable returns, and its ability to use the voting rights to affect the amount of the returns. In instances where the ETF has control over an Investee ETF, the ETF qualifies as an investment entity under IFRS 10 - Consolidated Financial Statements, and therefore accounts for investments it controls at fair value through profit and loss. The ETF’s pri-mary purpose is defined by its investment objectives and uses the investment strategies available to it as defined in the ETF’s prospectus to meet those objectives. The ETF also measures and evaluates the performance of any Investee ETFs on a fair value basis.
Investee ETFs over which the ETF has control or significant influence are categorized as subsidiaries and associates, re-spectively. All other Investee ETFs are categorized as unconsolidated structured entities. Investee ETFs may be managed by the Manager, its affiliates, or by third-party managers.
Investments in Investee ETFs are susceptible to market price risk arising from uncertainty about future values of those Investee ETFs. The maximum exposure to loss from interests in Investee ETFs is equal to the total fair value of the invest-ment in those respective Investee ETFs at any given point in time. The fair value of Investee ETFs, if any, are disclosed in investments in the statements of financial position and listed in the schedule of investments.
As at June 30, 2016 and December 31, 2015, the ETF had material investments in the subsidiaries (Sub), associates (Assc) and unconsolidated structured entities (SE) listed below:
Investee ETF as atJune 30, 2016
Place of Business Type Ownership % Carrying
Amount
Guggenheim Solar Energy ETF U.S. SE 1.93% $5,722,446
iShares MSCI Sweden ETF U.S. SE 1.58% $5,672,324
iShares China Large-Cap ETF U.S. SE 0.12% $5,566,140
iShares Emerging Markets Local Currency Bond ETF U.S. SE 0.98% $5,431,349
Deutsche X-trackers Harvest CSI 300 China A-Shares ETF U.S. SE 1.02% $5,370,517
iShares MSCI Japan ETF U.S. SE 0.03% $5,359,118
iShares MSCI Frontier 100 ETF U.S. SE 1.02% $5,314,198
90412 - Horizons HGM.indd 35 2016-08-11 9:20 AM
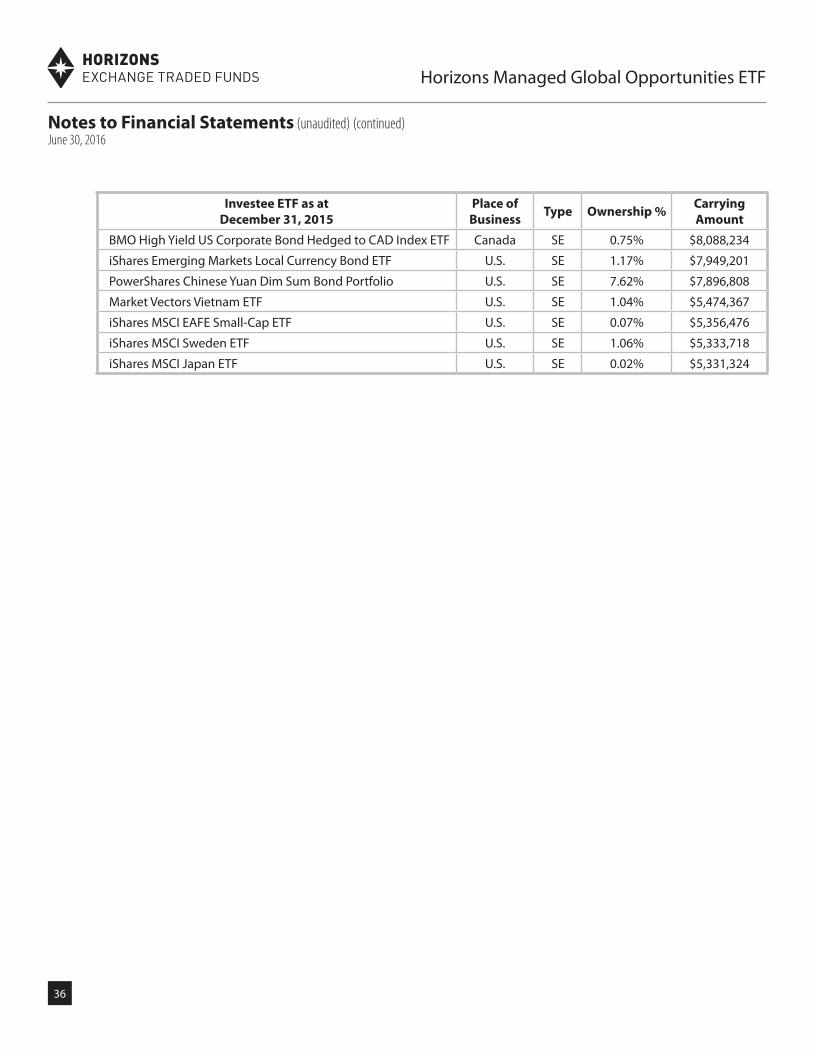
Notes to Financial Statements (unaudited) (continued)June 30, 2016
36
Investee ETF as atDecember 31, 2015
Place of Business Type Ownership % Carrying
Amount
BMO High Yield US Corporate Bond Hedged to CAD Index ETF Canada SE 0.75% $8,088,234
iShares Emerging Markets Local Currency Bond ETF U.S. SE 1.17% $7,949,201
PowerShares Chinese Yuan Dim Sum Bond Portfolio U.S. SE 7.62% $7,896,808
Market Vectors Vietnam ETF U.S. SE 1.04% $5,474,367
iShares MSCI EAFE Small-Cap ETF U.S. SE 0.07% $5,356,476
iShares MSCI Sweden ETF U.S. SE 1.06% $5,333,718
iShares MSCI Japan ETF U.S. SE 0.02% $5,331,324
Horizons Managed Global Opportunities ETF
90412 - Horizons HGM.indd 36 2016-08-11 9:20 AM

ALPHA BENCHMARK BETAPRO
ETF Solutions for every investorTM
Innovation is our capital. Make it yours.
sInnovation is our capital. Make it yours.
Horizons Exchange Traded Funds | 26 Wellington Street East, Suite 700 | Toronto, Ontario, M5E 1S2
T 416 933 5745 | TF 1 866 641 5739 | w horizonsetfs.com
ManagerAlphaPro Management Inc.26 Wellington Street East, Suite 700Toronto, OntarioM5E 1S2Tel: 416-933-5745Fax: 416-777-5181Toll Free: [email protected]
CustodianCIBC Mellon Trust Company320 Bay StreetP.O. Box 1Toronto, OntarioM5H 4A6
AuditorsKPMG LLPBay Adelaide Centre333 Bay Street, Suite 4600Toronto, OntarioM5H 2S5
Registrar and Transfer AgentCST Trust Company320 Bay StreetP.O. Box 1Toronto, OntarioM5H 4A6
90412 - Horizons HGM.indd 38 2016-08-11 9:20 AM