Embed Size (px)
Citation preview
1
Hoping to Win, Expected to Lose: Theory and Lessons on Micro Enterprise Development 1
Dean Karlan
Ryan Knight
Christopher Udry
September 2012
Abstract
We show how financial and managerial constraints impede experimentation, and thus limit learning
about the profitability of investments. Imperfect information about one’s own type, but willingness to
experiment to learn one’s type, leads to short‐run negative expected returns to investments, with some
outliers succeeding. We find in an experiment that entrepreneurs invest randomized grants of cash, and
adopt advice from randomized grants of consulting services, but both lead to lower profits on average.
In the long run, they revert back to their prior scale of operations. In a meta‐analysis, results from 19
other experiments find mixed support for this theory.
JEL Codes: D21, D24, D83, D92, L20, M13, O12
Keywords: entrepreneurship; credit constraints; business training; consulting; managerial capital
1 Contact information: [email protected] (Yale University, Innovations for Poverty Action, M.I.T. Jameel Poverty Action Lab, and NBER); [email protected] (Yale University and Innovations for Poverty Action), and [email protected] (Yale University). The authors thank USAID‐BASIS and the Bill and Melinda Gates Foundation for funding, Matt Hoover for project management and research assistance, the field staff at Innovations for Poverty Action (IPA) for survey and project management, and the IPA Ghana country directors, Justin Oliver, Kelly Bidwell and Jessica Kiessel. The authors thank the Ernst & Young Ghana office for their collaboration, including subsidizing the consulting rates. Institutional Review Board approval received from both Yale University and Innovations for Poverty Action. The authors retained full intellectual freedom to report the results throughout the study. All opinions herein are our own and not those of any of the donors or partners.

2
I. IntroductionIn developing countries, firm size within an industry often varies all the way from single‐person firms to
large firms. Naturally, this leads many entrepreneurs to aspire to grow, but if special managerial talent is
necessary to succeed at larger scales, how do individuals learn whether they have what it takes to
manage a larger enterprise? We start off with a model that incorporates heterogeneity in
entrepreneurial talent, unobserved to all, to help understand the experimentation and learning process
for micro‐entrepreneurs about their optimal size. We show how financial and managerial capital market
imperfections can impede experimentation,n and thus limit learning about the profitability of
alternative ways of organizing one’s business.
The assumptions and the model generate a simple prediction: on average most businesses will not, in
fact, do better after attempting to grow, but a few will succeed. Specifically, relaxing credit or
managerial capital constraints may encourage some entrepreneurs to experiment, but such
experimentation will not necessarily lead to success and in fact on average will not succeed. This is
consistent with the stylized evidence that few firms transform from microenterprises into small or
medium enterprises. This stagnation comes despite a plethora of effort from government, NGOs and
social businesses, through for example microcredit and training. We have learned that microcredit
generates important impacts but not transformational positive impacts on firm size (for credit targeted
at informal sector entrepreneurs, see Attanasio et al. 2011; Augsburg et al. 2012; Banerjee et al. 2011;
Karlan and Zinman 2011; for credit targeted at individuals with some formal sector employment, see
Karlan and Zinman 2010). Micro‐training programs similarly generate positive but not transformational
impacts (Berge, Bjovatn and Tungodden 2011; Bruhn and Zia 2011; Drexler et al. 2011; Karlan and
Valdivia 2011).
We present several sources of evidence to test the model, both primary (an experiment in Ghana
conducted by the authors) and secondary (a series of experiments by others, reported elsewhere and
summarized here), and find mixed support empirically. The primary data source is a randomized
controlled trial conducted in Ghana with microentrepreneurs, specifically tailors. We provide inputs to
the tailors in the form of financial capital (a cash grant) and/or managerial capital (consulting services),
to catalyze adoption of investments and practices aimed towards enterprise growth. We find that
entrepreneurs invest the cash and take the advice, but both lead to lower profits on average. In the long
run, they revert back to their prior operations. We do not have a large enough sample size to detect
with statistical significance any positive outliers, but we present anecdotal evidence of such. We then
discuss secondary evidence from other recent, similar experiments. We examine two types of
experiments: those that relax financial constraints with cash grants or improved access to loans; and
those that provide training, and find evidence supporting this model (although not every result in the
other papers lines up with the predictions in our model).
In the Ghana experiment, 160 tailors were randomly assigned to one of the three treatment groups or a
control group. The first treatment group tests investment behavior after relaxing capital constraints by
3
providing 200 cedi grants (about US $133) to 38 small tailors and seamstress in and around Accra,
Ghana. The second treatment group tests the managerial ability theory by providing one year of
management consulting services from Ernst & Young, a major international consulting firm, to 41 tailors.
The third treatment group, containing 36 tailors, received both the cash grant and the managerial
training. The control group contained 45 tailors.
Working with managerial consultants was not intended to test a policy per se, as their fees would likely
be too high for a scalable intervention. Rather, the intent was an enterprise experiment: let four
talented, creative individuals, who know the local business environment, provide mentorship and
consulting services to micro‐entrepreneurs to see if they could generate transformative change.
At the baseline, the microenterprises did not appear to be well managed by standards in the managerial
performance literature (Bloom et al. 2012). Only 17% of the respondents reported keeping any written
financial records, 7% reported spending any money on marketing in a year and only 30% of shops were
rated as very organized by our enumerators.
The context and dichotomy of experiences is perhaps well illustrated by stories of two of the
respondents.
“Jess” was 26 years old, had attended vocational school to be a seamstress, and financed her start‐up
capital herself. She was single, with no children, and cared for a sick mother. She had a bank account but
had never applied for a loan from a bank or microfinance institution. She sewed out of a wooden kiosk,
and the fair value of her total capital was 765 Cedis ($510). She carried all of her materials back and
forth from her home to the shop every day because she was worried they would be stolen from her
shop, which lacked a secure padlock, and had been broken into before. A strong padlock would cost
about 25 Cedis ($17), but she had drained all of her working capital from the business caring for her
mother. She had recently stopped sewing for an extended period of time because caring for her mother
took so much of her time, and when she returned she found that her primary clients had found another
seamstress during her absence. She wanted to rebuild her customer base, but did no marketing and had
no signs advertising her shop. She spoke softly, did not make eye contact and was shy with new people,
but spoke briskly to well‐known clients.
Across town, “Sarah” was 28 years old, had attended a polytechnic school for fashion, and inherited her
business four years before the baseline. She had two bank accounts, one for business and one personal,
and unlike Jess had previously received a loan. The fair value of her capital was 2730 Cedis ($1840).
Sarah had two good sewing machines and a couple of special purpose machines, which she kept in her
concrete shop. The quality of her sewing was good, and she was already keeping transaction records at
the baseline. However, her shop was on an out‐of‐the‐way street in a tough neighborhood, so she slept
on the floor of her shop to protect her machines. She identified a new site on a main road that she
wanted to move to, but she was having trouble saving up enough money. She had a natural ease with
customers, but her relationships with her employee and apprentice were tense. The consultants judged
Sarah to have great potential and they wanted to help her start marketing, but were concerned her
location and ability to effectively manage her employees as she grew.

4
Both of these women appeared to face capital constraints. Jess had liquidated her business money for a
personal emergency, and could not afford a small amount for a padlock to protect her investment. Sarah
believed that a new location would be more profitable, but she could not save enough to make the
move.
Both also faced managerial challenges. Jess needed to work on her customer service and needed to
develop a plan to reconnect with her old clients and attract new clients. Sarah needed to learn to be a
more effective manager and begin doing marketing.
Jess and Sarah both received the double treatment of the mentoring and the capital grants. At the end
of the study, Jess was mourning her lost mother and hardly working. She had not reclaimed her old
clients or launched any new marketing campaigns. She tried out record keeping for a time, but stopped
keeping any records. She invested the capital grant in fabrics that she hoped to sell from her kiosk, but
still had no padlock and was still carrying her material back and forth from home every day she worked.
The consultant worked on a plan to put a little money away every day for the padlock, but she was not
saving. Her profit increased from 30 Cedis in December 2008 to 80 Cedis in December 2010, half of the
average increase in control group profit of 109 Cedis over the same time period.
Sarah, on the other hand, stood out for how well she adopted the consulting. With her consultant’s
guidance, she began “sew and sell” – sewing products with no specific customer in mind and selling
them from her shop. She saved the capital grant for improvements to her new shop and expanded her
record keeping. She added a small dressing room area to her shop and gave purified water satchels and
candies out to clients. She designed a label with her phone number on it that she started affixing to all of
the items she sewed. She successfully helped an apprentice start her own business, found a new
apprentice to replace her, and hired a second employee.
Sarah’s experience shows that there is much that a micro‐entrepreneur can do to expand her business
and improve business practices. Sarah’s efforts increased her profits from 90 Cedis in December 2008 to
333 Cedis in December 2010, a substantial increase that is more than twice the average control group
increase of 109 Cedis. Jess’ contrary experience shows that this is not always easy, and not everyone is
capable of making large changes in their business model.
We found that, on average, the experience of the tailors was more similar to that of Jess than to that of
Sarah. The consultants’ recommendations were adopted for a time, but the tailors had abandoned them
one year after the training stopped. On average, there was no positive impact on profit or revenue from
the consulting and, if anything, there was a negative impact. The tailors who received the capital grant
invested the money in their businesses, but these investments did not increase profits. In fact, one year
after the capital grant, profit was lower among those who received the capital drop compared to the
control group.
This paper proceeds as follows: Section II will put forward a theoretical model as described above,
Section III will present the setting and experimental design, Section IV the data, and Section V the results
from the Ghana experiment. Section VI will present the meta analysis of the other 18 experiments.
Section VII concludes.

5
II. FinancialMarketsandEntrepreneurialExperimentationImperfect financial markets, combined with non‐convexities in the production technology, are the
classic foundation for poverty trap arguments in the informal sector and provide a formal foundation to
motivate many financial market interventions. We combine this classic model with uncertainty about
the profitability of moving to a larger scale. This helps us understand why entrepreneurs in a
competitive market might aggressively invest when financial market constraints are relaxed, yet achieve
on average negative profits from these investments. A parallel model helps us to understand a similar
pattern for business training, in which entrepreneurs at least temporarily adopt suggested new
techniques that turn out to be unprofitable.
Consider two business techniques which cost l hx x . The revenue of the low technique is ( )lx and we
assume that this technique is profitable, i.e., ( ) 0l lx x . Every existing entrepreneur has repeatedly
used technique l and knows ( )lx . Technique l is equally profitable for all entrepreneurs. Technique h,
however, is profitable only for some: if you are a `good’ entrepreneur, you’ll get ( )ghx such
that ( ) ( )gh h l lx x x x . On the other hand, if you are a ` bad’ entrepreneur you’ll
earn ( ) ( )bh h l lx x x x . The key is that entrepreneurs do not know their type until they
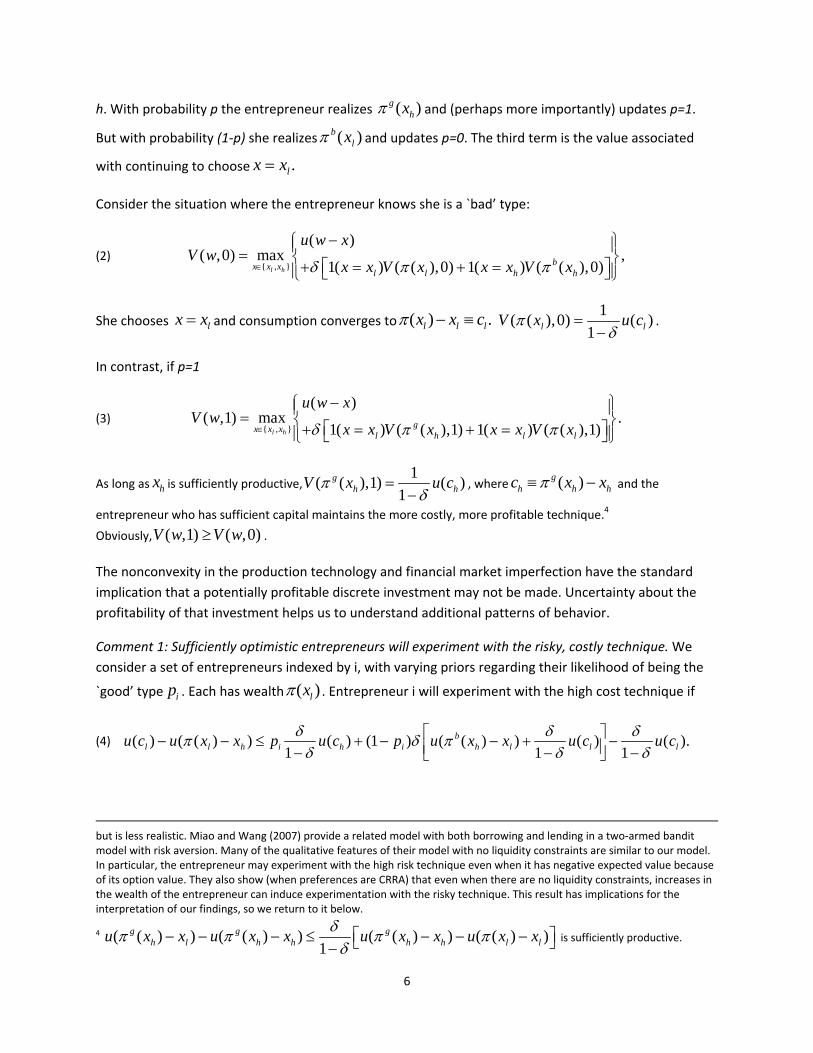
invest hx and thus try h. Before trying h the entrepreneur believes that her likelihood of being type g is p.
Once she tries h, she knows with certainty if she is of type g.2 The entrepreneur gets instantaneous
utility from consumption of ( )u c and maximizes the simple expected utility ( )tt
E u c
. The
entrepreneur has no access to financial markets, so if she has current assets w her value function is
(1) { , }
( )
( , ) max 1[ ] ( ( ),1) (1 ) ( ( ),0) ,
1[ ] ( ( ), )l h
g bh h h
x x x
l l
u w x
V w p x x pV x p V x
x x V x p
where 1[.] is the indicator function.3 The first term is current consumption. h lx x , so consumption
falls if the entrepreneur tries h. The second term is the future value associated with experimenting with
2 The assumption that the entrepreneur learns his/her type with a single try at technique h is extreme but inconsequential for the purposes of the arguments below. A richer model would have uncertain profits from technique h for each type, with the distribution of returns being better for type g. The entrepreneur would gradually learn his or her type with repeated attempts at technique h. 3 The assumption that the entrepreneur can neither save nor borrow simplifies the analysis tremendously, but is obviously extreme. If the entrepreneur can save at a fixed interest rate, little changes in our analysis provided that interest rate is
sufficiently low (specifically, as long as1
r
). Saving is only undertaken to smooth expected declines in consumption; it
therefore lowers the cost of experimentation, but changes none of the qualitative features of the model below. Permitting
borrowing as well (and setting1
r
) is a more substantive change to the interpretation of the entrepreneur’s situation,
6
h. With probability p the entrepreneur realizes ( )ghx and (perhaps more importantly) updates p=1.
But with probability (1‐p) she realizes ( )blx and updates p=0. The third term is the value associated
with continuing to choose .lx x
Consider the situation where the entrepreneur knows she is a `bad’ type:
(2) { , }
( )( ,0) max ,
1( ) ( ( ),0) 1( ) ( ( ),0)l hbx x x
l l h h
u w xV w
x x V x x x V x
She chooses lx x and consumption converges to ( ) .l l lx x c
1( ( ),0) ( )
1l lV x u c
.
In contrast, if p=1
(3) { , }
( )( ,1) max .
1( ) ( ( ),1) 1( ) ( ( ),1)l hgx x x
l h l l
u w xV w
x x V x x x V x
As long as hx is sufficiently productive,1
( ( ),1) ( )1
gh hV x u c
, where ( )g
h h hc x x and the
entrepreneur who has sufficient capital maintains the more costly, more profitable technique.4
Obviously, ( ,1) ( ,0)V w V w .
The nonconvexity in the production technology and financial market imperfection have the standard
implication that a potentially profitable discrete investment may not be made. Uncertainty about the
profitability of that investment helps us to understand additional patterns of behavior.
Comment 1: Sufficiently optimistic entrepreneurs will experiment with the risky, costly technique. We
consider a set of entrepreneurs indexed by i, with varying priors regarding their likelihood of being the
`good’ type ip . Each has wealth ( )lx . Entrepreneur i will experiment with the high cost technique if
(4) ( ) ( ( ) ) ( ) (1 ) ( ( ) ) ( ) ( ).1 1 1
bl l h i h i h l l lu c u x x p u c p u x x u c u c
but is less realistic. Miao and Wang (2007) provide a related model with both borrowing and lending in a two‐armed bandit model with risk aversion. Many of the qualitative features of their model with no liquidity constraints are similar to our model. In particular, the entrepreneur may experiment with the high risk technique even when it has negative expected value because of its option value. They also show (when preferences are CRRA) that even when there are no liquidity constraints, increases in the wealth of the entrepreneur can induce experimentation with the risky technique. This result has implications for the interpretation of our findings, so we return to it below.
4 ( ( ) ) ( ( ) ) ( ( ) ) ( ( ) )1
g g gh l h h h h l lu x x u x x u x x u x x
is sufficiently productive.

7
The LHS is the one‐shot cost of trying out the high technique; the RHS is the long‐term gain. The RHS of
(4) is strictly increasing in ip , and if the cost of investing in h is not too high ( ( )l hx x is not too small)
then there exists a p*<1 such that (4) is satisfied. All entrepreneurs with *ip p will experiment with
the h technique. The implication is that entrepreneurs using technique l in any dataset will be those with
*ip p , which will include some fraction of those who have tried h in the past and learned that they
are not type g.
Comment 2: There is an option value to trying the risky, costly technique. Suppose that
(1 ) ( )g bh l lp p x x x , so trying the high technique has a negative expected value this
period. The entrepreneur will choose h if and only if
(5) ( , ) ( ) ( ,1) (1 ) ( ,0).g bhV w p u w x pV p V
Rearranging (5), the entrepreneur will choose h if
(6)
2
( ) ( ) ( ) ( ) (1 ) ( ( ) )
( ) ( ) .1
bl h l h h l
h l
u w x u w x u c pu c p u x c
p u c u c
The first term on the LHS of the inequality is the immediate cost of the investment, and the second is
the one‐time expected loss because of the likely failure of the attempt.5 The RHS is the option value of
the potential long run gain from the entrepreneur learning that she can manage a large‐scale enterprise.
As approaches 1, this option value dominates the short term costs and option h is chosen.
Comment 3: Increases in the wealth of an entrepreneur reduce the critical prior belief in the likelihood of
success required for that entrepreneur to experiment with the risky, costly technique. As in comment 1, if
we consider at any given level of wealth w a range of entrepreneurs with prior beliefs ip about the
likelihood that they would be successful at running a larger scale enterprise, there is a *( )p w such that
all entrepreneurs with wealth w and *( )ip p w choose l and those with higher ip choose h. The LHS
of (6) is strictly decreasing in w, so*( )
0dp w
dw . Increases in w increase the share of entrepreneurs
choosing h. The randomized capital grants will generate investment in the enterprise, even if the
immediate expected return of those investments is negative.
Comment 4: A reduction in hx increases the share of entrepreneurs choosing technique h. The LHS of (6)
is strictly decreasing in hx (because ( )gh h hc x x ), while the RHS is strictly increasing.
5 (1 ) ( )g b
h l lp p x x x implies that (1 )( ( ) ) .bh h l lpc p x c c Concavity of u(.) ensures
that ( ) ( ) (1 ) ( ( ) ) 0bl h h lu c pu c p u x c .

8
So*( )
0h
h
dp x
dx . The randomized provision of consulting services lowers the cost of adopting the set of
techniques associated with operating at a larger scale, so a broader set of entrepreneurs will experiment
with h.
III. SampleFrameandExperimentalDesignThe study participants are 160 urban tailors and seamstresses in Accra, Ghana, and were randomly
selected from a census we conducted of tailors and seamstresses in eight neighborhoods in/around
Accra who had five or fewer total employees and apprentices. If two or more tailors were immediate
neighbors, we randomly selected at most one to be in the sample frame.
We chose to work with microenterprises in the same industry because it would allow the consultants to
develop some expertise in that sector, and it would allow us to gather more precise data on business
practices by asking industry‐specific questions in our surveys. We then wanted an industry which was
geographically dispersed across Accra (to minimize possible spillovers to control groups), and also
diverse in size so that there were plausibly different firm sizes that could be sustained in competitive
equilibrium. One‐person tailoring shops are common, but many 10‐person small tailor firms also exist.
We constrained our sample to tailors with 5 or fewer employees at the baseline: 35% or our sample had
zero employees, and 94% had three or fewer employees. Thus, our sample frame includes very small,
urban tailors and seamstresses, most of who work directly in their shops. Also, 82.5% of our sample
frame had not previously accessed formal credit markets.
We employed a 2x2 experimental design involving a 200 cedi capital grant and/or consulting services
from Ernst & Young. Figure 1 shows a full timeline of the interventions, and data collection. The
consulting treatment began first, and then after eight months the second randomization assigned
individuals to either receive the capital grant or not. More details are below on each treatment.
Five of the tailors passed away over the course of the study, leaving a final sample of 155. We located
149 of the 155 tailors for the final follow‐up in December 2009. Attrition is not correlated with
treatment status6. We saw no tailors permanently exit the tailoring business by selling off their
machines. We did see tailors temporarily stop sewing, for health or other reasons. These individuals
would be counted as having zero profit or negative profit if they had business expenses but not income.
All businesses operated from the same premise by the same individual were counted in financial
outcomes, so if a respondent diversified out of tailoring and into the selling of goods, income from
selling the goods is counted in our data.
ConsultingTreatmentWe worked with one partner, a director and four consultants from Ernst & Young in Ghana. The Ernst &
Young consultants typically work on business advisory engagements in a variety of areas including
training, human resources, monitoring and evaluation and project management. Consultant biographies
6 Appendix Table 1 details the sample attrition.

9
and examples of prior engagements are in Appendix B. The consultants received a two‐day training on
microenterprise coaching from Ghana’s National Bureau of Small Scale Industries, which frequently
provides training to microenterprises in Ghana, on the Bureau’s method for training micro‐
entrepreneurs.
The consultants largely followed an adapted version of this framework (outlined in Appendix C) but
were also encouraged to think creatively, to discuss important business decisions facing the tailors, and
to provide ad hoc advice that they felt would be beneficial. Examples of this ad hoc support can be seen
in the consultants’ notes in Appendix D. The training modules were twelve‐fold: (1) Record Keeping, (2)
Procurement, (3) Operational Activities, (4) Motivation of workers, (5) Value addition, (6) Costing, (7)
Customer service, (8) Security of shop, (9) Sales and marketing, (10) Lifestyle in relation to work/life
balance, (11) Financing of business and savings, and (12) Business growth.
The training took place at the tailors’ shops over the course of one year, from February 2009 to February
2010. It began with lessons on the importance of record keeping, used the new records to help the
tailors calculate their profit margin on each item they sew, then taught how to calculate a monthly
income statement. Lessons on customer service and managing employees were discussed throughout.
For example, if the consultants observed impolite behavior to customers while in the shop, they might
take the opportunity to discuss customer service. The training moved at the pace of the tailors, such
that some never moved past record keeping, while others began preparing cash flow statements and
developing detailed plans to finance expansion.
The training involved simple, targeted lessons like, “keep your business and personal money separate”;
“Buy a second wallet to keep your business money in, so you don’t mix it with personal money”; and “it
is better to finance expansion through savings than through loans.” For those who moved past these
basic lessons, there were more detailed lessons on a variety of topics, like how you should calculate how
much to save to replace aging machines.
The consultants gave the tailors two record books: a standard cash book to record daily transactions;
and a second book they developed to record capital stock, available materials, customer contact
information, revenue, expenses and other items. The emphasis was placed first on simply recording
every transaction in the cash book, then recording in the more complicated book if they were
successfully tracking transactions.
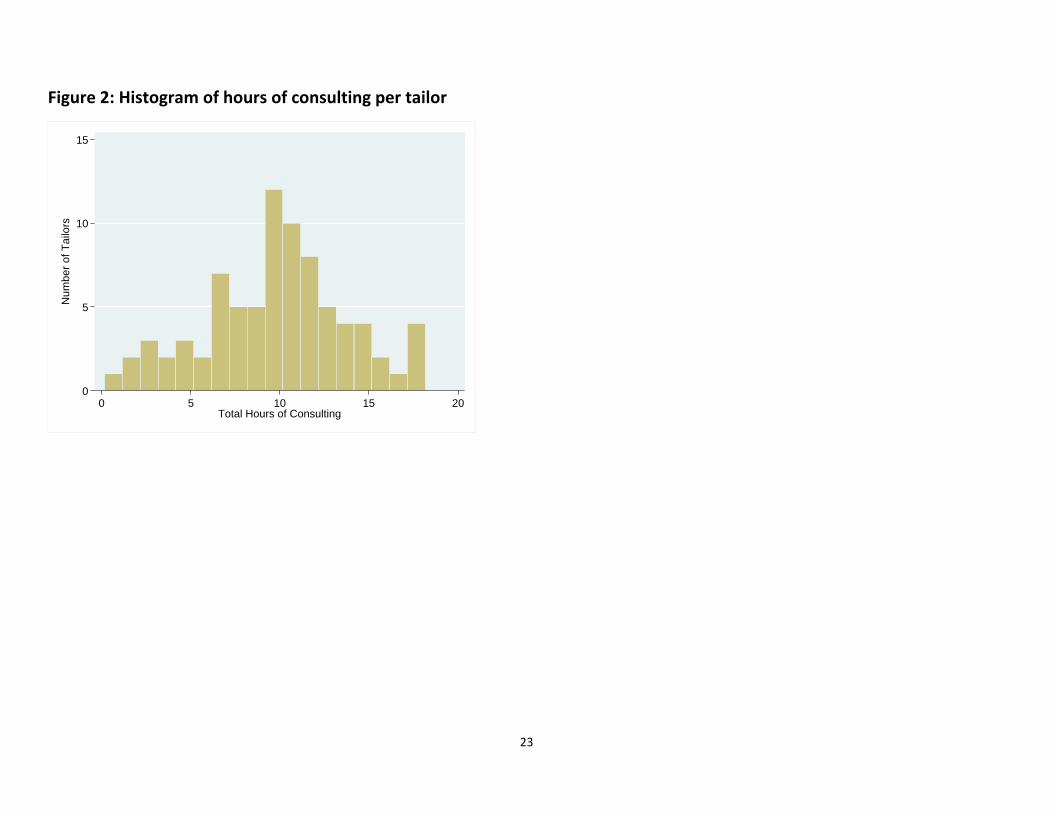
As with other studies on business training, there was a surprising degree of reluctance among some
tailors to make time for the consultants, and the tailors covered fewer modules than expected. The
average total time spent interacting with each tailor was 10 hours over the course of the study (Figure
2). Each available tailor was visited 1‐4 times per month, with each visit lasting 30 minutes to 1 hour.
One of the consultants was unavailable after November 2009 and was replaced by a consultant from the
National Bureau of Small Scale Industries for the final two months – the same consultant who provided
the initial two‐day training for the E&Y team. The randomization into consulting/non‐consulting was
done in January 2009, stratifying only on the community in which the tailors lived.

10
The tailors did report valuing the consulting, and in particular the training they were receiving. In a
follow‐up survey, the tailors reported being willing to pay 5.9 cedis per hour for the same consultants to
come and continue the training, 2.8 cedis per hour for other consultants to continue the same training
(p value of equality to our consultants, 0.001), 4.2 cedis per hour for another training of their choice (p
value of equality to our consultants, 0.014).
CapitalGrantThe capital grant randomization was done in October 2009, eight months after the consulting began,
and was stratified on existing treatment status and community only. Deceased respondents and
respondents who had permanently moved out of the study area in the first eight months of the study
were excluded from the randomization, leaving 154 respondents eligible for the capital drop
randomization. Of these, 75 were randomly selected to receive capital (37 from the consulting group
and 38 from the no consulting group).
The capital grant was 200 Cedis (approximately US $133) and unconditional. Approximately two weeks
before distributing the capital grants, IPA field workers visited all the respondents to inform them that
we were doing a raffle with various prizes, one of which was 200 Ghana Cedis. The respondents were
given a sealed envelope that had a picture of their prize inside. The runner‐up prizes were an IPA‐
branded keychain, t‐shirt and mug. The field workers then explained that they would return in about
two weeks with the prize. If they won the capital, we asked that they spend the money on their
business, but explained that they would not have to repay the money if they spent it on personal items,
and that no repayment would be required under any circumstances.
We included the two week buffer between notification and delivery for the consultants to meet with the
winning respondents to help them plan for how to use the money. However, not all consultants and
tailors were available in this two week window, so not every tailor developed a plan before receiving the
money.
The 200 Cedi capital drop is a little more than the average baseline working capital, defined as all cash,
savings and on‐hand money. The capital drop therefore represents, on average, a doubling of the
reported cash available for investment. 200 Cedis is about twice baseline monthly income, about equal
to one month’s business expenses, and about equal to 13% of average fair market value of all baseline
fixed assets.
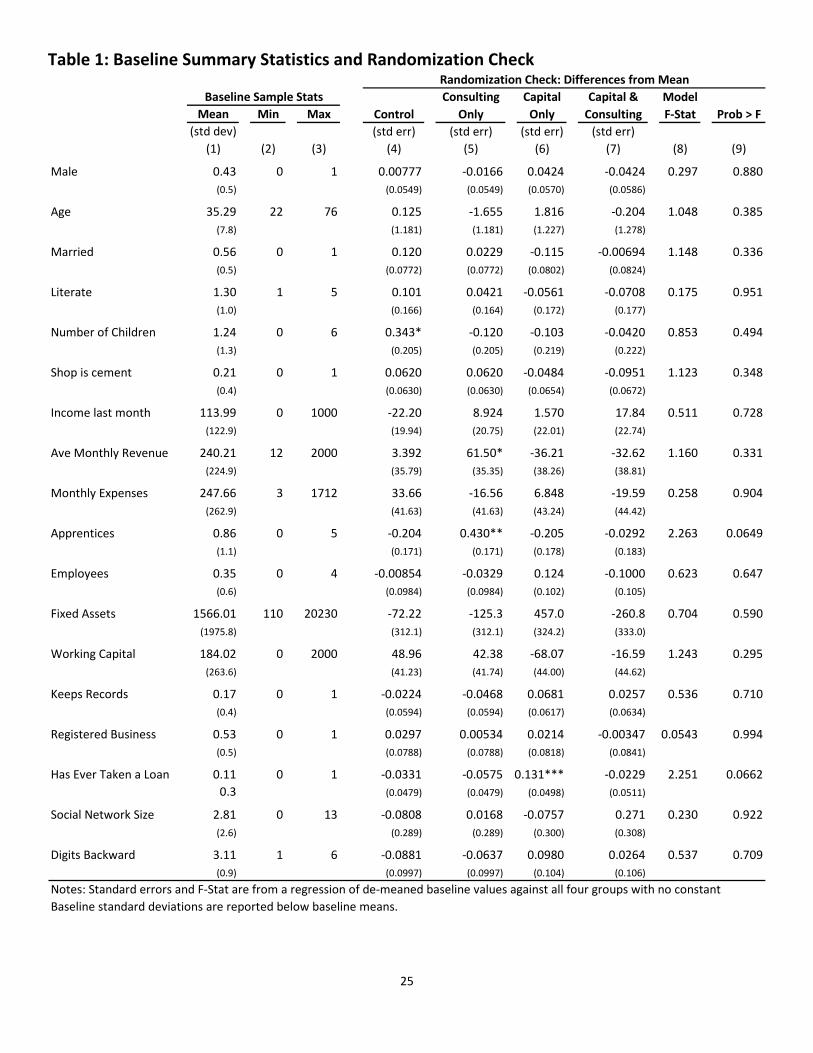
Table 1 reports baseline values for various relevant metrics and shows that assignment to the capital or
consulting groups is not correlated with baseline characteristics.
IV. DataAll surveys were administered using paper/pencil questionnaires, and data entry was done in the IPA
offices by Project Associates or locally‐hired data entry operators. All surveys after the baseline were
audited by re‐administering select questions from 5‐10 questionnaires by each surveyor. Surveyors were
hired and monitored by IPA.

11
Baseline survey: (1) December 2008 and (2) January 2009
The baseline survey was conducted in two visits to minimize the intrusion (a particular concern in the
first visit because it was conducted in December, during a peak season). The first, administered in
December 2008, focused on financial outcomes, and the second, administered in January 2009, focused
on business processes and attitudes. Each survey took about 40 minutes to one hour.
The first follow‐up after the consulting began was conducted six months later, in July 2009 (Survey #3),
and primarily included questions on business processes.
In August 2009 (Survey #4), we visited the respondents every other day to record how much money they
received, how much they spent and how many sales they made. The goal of these visits was to get a
measure of profitability that is unaffected by changes in the consulting group’s understanding of how to
calculate profit and ability to recall revenue/expenses.
Then in September 2009 (Survey #5), we recorded the financial outcomes for expenses, revenue and
profit.
We repeated the format from the baseline, and split measures between December 2009 (Survey #6),
focused on financial outcomes, and January 2010 (Survey #7), focused on business process outcomes.
In December 2010 we conducted a long‐term follow‐up focused on financial outcomes and business
processes. This survey occurred 14 months after the capital drop and 11 months after the consulting
stopped.
V. EstimationModelsandResultsThe experimental design simplifies analysis. We examine a series of outcomes related to the
interventions: knowledge of business practices in the consulting curriculum, adoption of these practices,
investment and savings behavior, and business income and profits. This series of indicators is collected
over the 8 rounds of data (although no single indicator is available for all 8 of the rounds because the
questionnaires were varied to reduce respondent fatigue). A typical column in the tables that follow
reports the results of a cross‐sectional regression of the form
(7) itiiiit NyTy 3201 ,
where ity is the outcome for tailor i in round t, iT is a vector of indicators of the intent‐to‐treat status of
tailor i, ioy is the value of the outcome for tailor i in the baseline (either round 1 or round 2, depending
upon the measure) and iN is a vector of dummy variables corresponding to the neighborhood in which i
operates. This specification permits a flexible examination of the timing of responses to the treatments.
To estimate average effects across rounds, we pool all follow‐up rounds, add round dummies (“R”), and
report robust standard errors clustered at the individual level.

12
(8) ittiiitit RNyTy 43201 ,
ResultsWe divide the results into three categories: (1) business literacy and business practices; (2) investments,
savings and loans, and; (3) profitability.
BusinessliteracyandpracticesThe consulting treatment apparently succeeded in generating knowledge among treated tailors about
the business practices that were a focus of the curriculum. In Table 2, column 1 we report the results of
estimating (7) where ity is a measure of business literacy. In this instance, 0 0iy , because we did not
ask about business literacy until the final survey in December 2010. Eleven months after the end of the
consulting, we find that being assigned to consulting (irrespective of capital treatment status) increased
business literacy knowledge by an average of 0.3 questions on a 4‐question quiz, which is 0.52 standard
deviations.
We find that tailors who received the consulting treatment adopted the practices discussed in the
curriculum, at least temporarily. Columns 3‐5 report the results of estimating (7) where ity is an index of
the business practices encouraged by the consultants at three different times after consulting began.
Business practices were measured by self‐reported responses to 35 questions on various practices
advocated by the consultants. Not all of the questions were asked in every round. ity for columns 3
through 5 is generated by taking the percentage of questions answered correctly in that round.
In the 6 month follow‐up (July 2009), there is a strong impact of 5.65% of business practices, significant
at the 1% level. At the 12‐month follow‐up (January 2010), this effect had diminished to 2.95%, although
the reduction from the 6‐month treatment effect to the 12‐month treatment effect is not statistically
significant. At the two‐year follow‐up (December 2010), the treatment effect further diminished, 0.8%
(although still not significantly different from that estimated in the six month follow‐up).
In column 2, we estimate (8), the average effect of the consulting treatment on business practices over
all post‐consulting rounds. The pooled index for Column 2 was generated by taking the average number
of practices adopted across all post‐consulting rounds. As can be expected, the average effect falls
within the range described above for each round and it is statistically significant at the 10% level.
The consultants’ foundational lesson was record keeping. The most tailors received this lesson, and this
lesson was returned to most often. If the tailors learned anything from the consulting, we would expect
it to be record keeping. We do indeed find a strong impact on record keeping, significant at the 1% level,
with the tailors who received consulting being 45% more likely to report keeping records in July 2009
and 23% more likely to keep records in January 2010. By December 2010, however, this point estimate
had decreased to 6.6%, which is statistically distinguishable from the initial 45% impact at the 1% level.
13
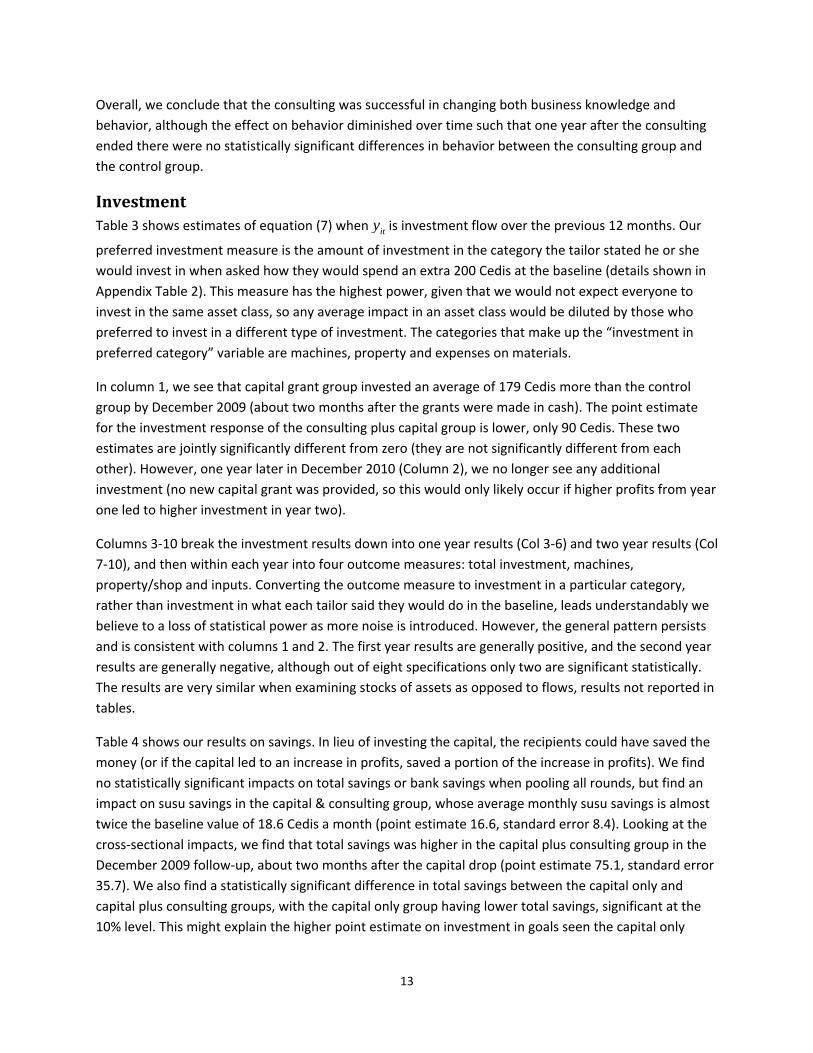
Overall, we conclude that the consulting was successful in changing both business knowledge and
behavior, although the effect on behavior diminished over time such that one year after the consulting
ended there were no statistically significant differences in behavior between the consulting group and
the control group.
InvestmentTable 3 shows estimates of equation (7) when ity is investment flow over the previous 12 months. Our
preferred investment measure is the amount of investment in the category the tailor stated he or she
would invest in when asked how they would spend an extra 200 Cedis at the baseline (details shown in
Appendix Table 2). This measure has the highest power, given that we would not expect everyone to
invest in the same asset class, so any average impact in an asset class would be diluted by those who
preferred to invest in a different type of investment. The categories that make up the “investment in
preferred category” variable are machines, property and expenses on materials.
In column 1, we see that capital grant group invested an average of 179 Cedis more than the control
group by December 2009 (about two months after the grants were made in cash). The point estimate
for the investment response of the consulting plus capital group is lower, only 90 Cedis. These two
estimates are jointly significantly different from zero (they are not significantly different from each
other). However, one year later in December 2010 (Column 2), we no longer see any additional
investment (no new capital grant was provided, so this would only likely occur if higher profits from year
one led to higher investment in year two).
Columns 3‐10 break the investment results down into one year results (Col 3‐6) and two year results (Col
7‐10), and then within each year into four outcome measures: total investment, machines,
property/shop and inputs. Converting the outcome measure to investment in a particular category,
rather than investment in what each tailor said they would do in the baseline, leads understandably we
believe to a loss of statistical power as more noise is introduced. However, the general pattern persists
and is consistent with columns 1 and 2. The first year results are generally positive, and the second year
results are generally negative, although out of eight specifications only two are significant statistically.
The results are very similar when examining stocks of assets as opposed to flows, results not reported in
tables.
Table 4 shows our results on savings. In lieu of investing the capital, the recipients could have saved the
money (or if the capital led to an increase in profits, saved a portion of the increase in profits). We find
no statistically significant impacts on total savings or bank savings when pooling all rounds, but find an
impact on susu savings in the capital & consulting group, whose average monthly susu savings is almost
twice the baseline value of 18.6 Cedis a month (point estimate 16.6, standard error 8.4). Looking at the
cross‐sectional impacts, we find that total savings was higher in the capital plus consulting group in the
December 2009 follow‐up, about two months after the capital drop (point estimate 75.1, standard error
35.7). We also find a statistically significant difference in total savings between the capital only and
capital plus consulting groups, with the capital only group having lower total savings, significant at the
10% level. This might explain the higher point estimate on investment in goals seen the capital only

14
group – the consultants reported encouraging the capital winners to top up the capital drop with their
own money to make larger purchases, saving to do so if necessary.
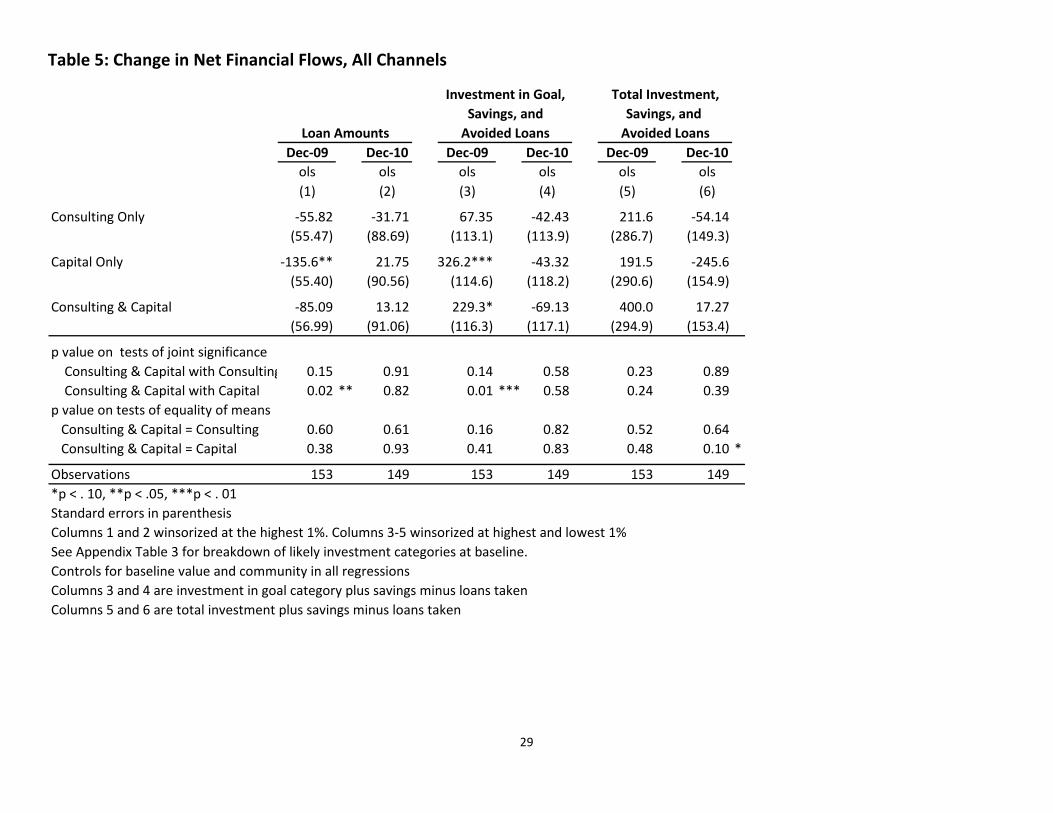
Table 5 examines net financial flows, in order to examine the net use of funds in the short run, and also
long term impact on all investment and savings (or reduction in borrowing). In the short run (Column 1,
one‐year), we find a reduction in take‐up of loans for those in the capital group in the months following
the capital drop. We find no long term impact on borrowing (Column 2). This is evidence at least
partially that the capital grant satisfied liquidity needs, and that at least some individuals had alternative
(and presumably more costly, since they would have to repay them) sources of capital if necessary.7
Adding together all of the potential uses for the money (investing, saving, replacing loans), except for
dividends, we find no statistically significant impacts, unless we look at investment in their goal
category, savings and loan replacement, in which case we find point estimates similar in magnitude to
total investment, but with much smaller standard errors, leading to statistically significant, positive
impacts from receiving any capital in December 2009. These results are shown in Columns 3‐6. The point
estimates on capital and capital plus consulting are greater than 200, but are not significantly different
from 200. Total uses for the money one year later in December 2010 are primarily negative and not
significant.
ProfitabilityOur results so far show short run impacts of the consulting and capital grant treatments on behavior:
knowledge and business practices improve in the consulting group and investments are made in the
capital grant group. The tailors do seem to be learning about new types of techniques from the
consultants (or modifying their prior beliefs about the profitability of these techniques). And the tailors
are responding to the capital grant as though they are capital constrained in their business. However, in
both cases we find that these changes in behavior are short‐lived. After a year there is no significant
difference between the capital grant or consulting groups and the control group of tailors.
An examination of profits provides an explanation for why the tailors abandoned these changes in
behavior. Table 6, column 1 reports the results of estimating (7) where ity is the tailor’s stated income
from his or her business. There is no evidence that the consulting treatment is associated with higher
profits. Worse, the capital grant seems to have lowered profit. The point estimate is that post‐treatment
income fell by 45 Cedis from a base of 110 Cedis for the capital only treatment. There is a smaller (and
statistically not significant) drop of 20 Cedis in income of the consulting plus capital grant group. The
capital only and capital plus consulting point estimates are jointly statistically significant at the 10%
level.
The standard errors on profit are large, relative to the means. For example, the standard error on the
consulting treatment is 21.4 Cedis. To have detected an effect at the 5% level, we would have needed to
observe an average change of 1.96*21.4 = 41.9 Cedis, or 37% of the average baseline profit of 112 Cedis.
7 To examine if we are measuring debt at a high borrowing season (and thus may be at a peak of liquidity constraints), we examine seasonality of borrowing and find that borrowing over the three months from September to November is roughly equal to borrowing over the six months from January to June.

15
We find no statistically significant impacts on revenue. Both the consulting and the consulting & capital
groups have positive point estimates, which are large relative to the baseline average revenue, but we
note fairly large standard errors. At the baseline, we asked only for average weekly revenue, weekly
revenue in a “good” week and weekly revenue in a bad week. In the follow‐ups, we asked for revenue in
the previous month to ensure that we were measuring only post‐treatment outcomes that were
separate from our previous surveys.
We find no evidence of changes in hours worked by the entrepreneur him or herself as a consequence
of any of the treatments (column 5 of Table 6). Nor is there a statistically significant impact on total
staff, apprentice use, or paid employees of any of the treatments (columns 6‐8).
Table 6 examined the average impact of the capital, consulting and combined treatments on post‐
treatment profits and employment. An examination of the time path of the impacts is revealing (shown
in Figure 3). Recall from our earlier examination of business practices that tailors in the consulting group
had adopted the advocated practices by round 3, but that the use of these practices dropped off in
round 7 and then again in round 8. We find in column 1 of Table 7 that by round 3, monthly income in
the consulting group is 25 Cedis lower than in the control group. By round 5, income is (almost)
statistically significantly higher in the consulting group, but in later rounds there is no difference in
income between the consulting group and the control group.
In round 7, after the first post‐grant holiday season, the point estimate on the capital is 50 Cedis lower
income than the control and the capital plus consulting group is 16 Cedis lower, but these estimates are
not statistically significant. One year later, both groups have large drops in income relative to the control
group (point estimates ‐75 and ‐98, standard errors 46 and 46, for capital versus capital plus consulting,
respectively). Our revenue and expense measures, reported in columns (6‐11) are too noisy to permit
conclusions to be drawn.
These results, regrettably, are consistent with the model we presented above. Capital‐constrained
tailors respond to the relaxation of their budget constraint upon receipt of the capital grant by investing
more. But why invest in activities that yield, on average, negative profits? Similarly they respond to the
intensive consulting intervention by attempting a set of new business practices, and again are rewarded
with declines in profits. Were they fooled in both instances? Perhaps, but this pattern is consistent with
entrepreneurs exploring new techniques and new levels of investment in a tentative manner in order to
learn about the profitability of these innovations for themselves, knowing that on average such
experiments yield a negative immediate return. Nevertheless, the option value of experimentation is
sufficiently high that it is worth taking the risk. On average, as perhaps expected, the experiments
yielded negative results and the innovative techniques were abandoned.
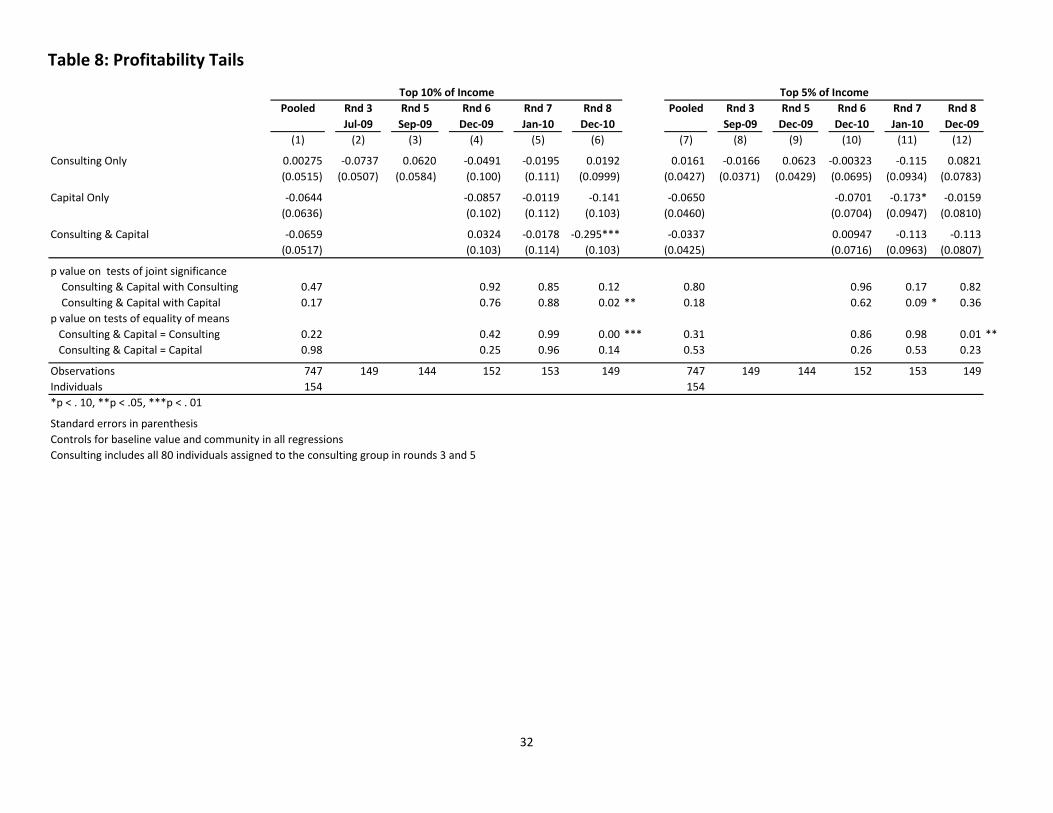
Table 8 reports our impact on profitability tails, i.e., likelihood of having profits above the 10th percentile
(columns 1‐6) and 5th percentile (columns 7‐12) from the baseline distribution. We do not find any
systematic statistically significant results, but also have large standard errors. If the impact of either
consulting or grants was to generate one or two positive outliers, such as one of the positive anecdotes

16
we observed and reported in the introduction, then we did not have sufficient sample size to detect
such impacts.
VI. SupportingEvidencefromOtherStudiesWe started by examining the universe of papers we are aware of that employ a randomized financial
capital infusion (either through a grant or credit) to a microenterprise. This yields seven papers, three
unconditional cash grant experiments and four credit experiments.8 We then examine papers with
experimental infusion of managerial or entrepreneurship training. This yields 11 papers, with a wide
range of intensity of intervention as well as sample frames.
From each of these papers, we test three hypotheses: (a) did the study find an average positive impact
on investment, (b) conditional on finding a positive impact on investment, did the study find an average
negative impact on profits for the firm, and (c) did the study find evidence of a fat right tail, i.e., of
treatment leading to a small set of individuals doing considerably better than the control. Table 9
summarizes the results from these tests.
The first question, examining changes in either investment or business practice, yields a fairly consistent answer: capital does get invested, and business advice does get followed. This is true for 16 out of the 18 studies (albeit 2 of the 16 positive results are not statistically significant). The second question, the impact on average profits, is far less clear. For capital infusions, 2 out of 7 find
positive and statistically significant results, 3 find positive but not statistically significant results, one
finds close to a null result, and one finds negative but not statistically significant results. Clearly this is
more of a muddled pattern, indicating that while there are some cases where positive returns are strong
it is not a systematic result. For training infusions, the variation in the results is much higher than the
capital infusions. Out of 11 experiments, 4 report statistically significant and positive average impacts
(although Valdivia (2012) on revenues, profits not measures), 3 report positive but not statistically
significant average impacts, and 3 report negative but not statistically significant average impacts, and
one reports mixed impacts.
The third question, the creation of positive outliers, many of the studies do not report. For those that
do, for capital infusion we find positive results for 3 out of 3 studies. For training studies however we are
only able to examine two studies, and in neither study do we observe positive and statistically significant
impacts on creation of positive outliers. However, each of these studies is typically not designed with
sufficient power to detect effects on outliers, such as we are examining. Furthermore, pooling of data
across studies will suffer from lack of comparability of interventions and measurement (see McKenzie
and Woodruff (2012) for a discussion of this literature and similar conclusions regarding the state of
knowledge across such studies).
8 We excluded two papers which are close, but do not fit as precisely: de Mel et al. (2012) which provides grants to microentrepreneurs conditional on completing formalization process in Sri Lanka (and they do find that this creates positive outliers), and Karlan and Zinman (2010) which randomly assigned credit to individuals, but with no enterprise targeting component as with more traditional microcredit.

17
VII. ConclusionCanonical theories of development suggest that credit and managerial capital constraints inhibit
investment and thus profits. This misallocation of resources in the economy has important implications
for growth. Yet in many (but certainly not all) situations we see interventions that infuse capital or
training not actually lead to higher profits, and we also see many examples of seemingly unprofitable
firms, including farms (e.g., see Anagol, Etang, and Karlan 2012; Morduch, Ravi and Bauchet 2011; Duflo,
Kremer, and Robinson 2011; Karlan, Osei, Osei, and Udry 2012).
We put forward a simple learning model, with heterogeneous types of enterprises, which helps
illuminate why we may see failure on average, as well as positive outliers. Clearly no one model,
particularly a simple model, accurately captures the complex reality of business operations in developing
countries. Likewise, not all of the predictions in our model are borne out consistently in the data of the
experiment reported here, nor of the 18 studies we examined in a small meta‐analysis. However, there
is evidence to suggest this model provides a useful framework for thinking about the dynamics between
micro and small enterprises, and the choice individual enterprise owners make when deciding to
experiment with expansion or diversification.
Critical questions remain, as the meta‐analysis, and also the literature review in McKenzie and Woodruff
(2012), documents a wide variety of outcomes across studies. We suggest four directions for further
research that apply to theorists, meta and re‐analysis of existing data, as well as design of future studies:
(1) heterogeneity with respect to type of entrepreneur and individual, (2) dynamics and determinants of
learning (which includes, e.g., differences in program design), (3) market selection for interventions, and
(4) general equilibrium and competitive effects. Obviously no one study, model or analysis, will produce
a complete picture that explains all of the observed heterogeneity in results. We discuss each of the four
directions briefly.
What are the individual factors that should be incorporated into the model? Most importantly for both
policy and modeling, what are the critical characteristics that help predict what type of individual has
potential to be an outlier? In our model, neither we nor entrepreneurs themselves can predict who
profits the most after relaxing a constraint. Are there diagnostics that could substitute for the costly
experimentation otherwise required to distinguish the minority who can flourish at larger scale from
those who will not? For policy, such diagnostics could be used to target more efficiently, which is
particularly critical if the intervention is great for some and bad for others.
Further related questions pertain to the process of learning. Here, we have focused entirely on learning
by doing and learning from formal trainers. Clearly there are many channels for learning: from one’s
own experience, from that of a teacher in a classroom setting, from a paid consultant, from an NGO,
from a mentor with experience in one’s own industry, etc. How do these different channels of learning
differ in effectiveness, and why? For example, are some more credible than others, do some provide
better information, are some more inspirational on a psychological level thus more likely to trigger
behavior change even if the underlying information is the same, etc. Lastly, and critically, how important
is it for people to see results (and how do individual entrepreneurs determine causality from process
18
changes to outcomes), rather than merely receive information on suggested processes, in order to
change behavior?
Third, markets differ in terms of competitiveness, and such interventions as discussed here should
generate different impacts depending on the competitive landscape. Take the tailor experiment in
Ghana as an example: perhaps the tailor industry is in perfectly competitive equilibrium, but some other
industry is less so in the same geography. Understanding, and then testing, the underlying market
factors that are necessary for success is important both for validating our models and for establishing
diagnostics for policymakers and institutions interested in improving the industrial performance. For
example, markets with potential product differentiation or skilled and available supply of labor may be
ripe for such interventions, but those with fully competitive markets less so or even damaging.
Lastly, few if any studies have satisfactorily tackled the impact of improving one set of firms’
performance on general equilibrium outcomes. The challenge is simple and obvious: if helping one firm
improve its performance greatly yields a smidgeon of negative impacts for 100 other firms, it will be
difficult to have sufficient statistical power to measure the smidgeons. Theory can help, as well as a
focus on collecting data about the mechanisms of changes within the firm and thus the actual changes in
services that customers receive. For example, if the intervention primarily teaches better persuasive
marketing, but not informative marketing, then business is likely simply being shifted from one firm to
another. If, on the other hand, product quality has increased, or costs have been lowered, then general
equilibrium benefits are likely accruing. We believe this is a gaping hole in the entrepreneurship
development literature.

19
VIII. References
Anagol, Santosh, Alvin Etang, and Dean Karlan (2012). “Continued Existence of Cows Disproves Central
Tenets of Capitalism,” working paper.
Attanasio, Orazio, Britta Augsburg, Ralph De Haas, Emla Fitzsimons, and Heike Harmgart (2011). "Group
lending or individual lending? Evidence from a randomised field experiment in Mongolia," European
Bank for Reconstruction and Development Working Paper No. 136.
Augsburg, Britta, Ralph De Haas, Heike Harmgart, and Costas Meghir (2012). “Microfinance at the
margin: experimental evidence from Bosnia and Herzegovina,” European Bank for Reconstruction
and Development Working Paper No. 146.
Banerjee, Abhijit, and Esther Duflo (2008). “Do Firms Want to Borrow More: Testing Credit Constraints
Using a Targeted Lending Program,” BREAD Working Paper No. 005, 2004, revised 2008.
Banerjee, Abhijit, Esther Duflo, Rachel Glennerster and Cynthia Kinnan (2011). “The miracle of
microfinance? Evidence from a Randomized Evaluation,” mimeo, MIT.
Berge, Lars Ivar Oppedal, Kjetil Bjorvatn, and Bertil Tungodden (2011). "Human and financial capital for
microenterprise development: Evidence from a field and lab experiment," CMI Working Papers 1,
CMI (Chr. Michelsen Institute), Bergen, Norway.
Bloom, Nicholas, Benn Eifert, Aprajit Mahajan, David McKenzie, and John Roberts (2012). "Does
Management Matter? Evidence from India," Quarterly Journal of Economics, forthcoming.
Bruhn, Miriam, and Bilal Zia (2011). "Stimulating managerial capital in emerging markets: the impact of
business and financial literacy for young entrepreneurs," Policy Research Working Paper
Series 5642, The World Bank.
Bruhn, Miriam, Dean Karlan, and Antoinette Schoar (2012). “The Impact of Consulting Services on Small
and Medium Enterprises: Evidence from a Randomized Trial in Mexico,” Yale Economics Department
Working Paper No. 100.
Calderon, Gabriela, Jesse M. Cunha, and Giacomo de Giorgi (2011). “Business Literacy and Development:
Evidence from a Randomized Trial in Rural Mexico,” working paper.
Cole, Shawn, Thomas Sampson, and Bilal Zia (2009). “Money or Knowledge? What drives demand for
financial services in emerging markets?” Harvard Business School Working Paper No. 09‐117.
20
Cole, Shawn and Guari Kartini Shastry (2009). “Smart Money: The Effect of Education, Cognitive Ability,
and Financial Literacy on Financial Market Participation,” Harvard Business School Working Paper
No. 09‐071.
de Mel, Suresh, David McKenzie, and Christopher Woodruff (2008). "Returns to Capital in
Microenterprises: Evidence from a Field Experiment," The Quarterly Journal of Economics, 123(4),
1329‐1372, November.
de Mel, Suresh, David McKenzie, and Christopher Woodruff (2009). “Measuring Microenterprise Profits:
Must We Ask How the Sausage Is Made?” Journal of Development Economics, 88(1): 19‐31.
de Mel, Suresh, David McKenzie, and Christopher Woodruff (2012). “The demand for, and consequences
of, formalization among informal firms in Sri Lanka,” NBER Working Paper No. 18019.
Drexler, Alejandro, Greg Fischer, and Antoinette Schoar (2011). “Keeping it Simple: Financial Literacy
and Rules of Thumb,” CEPR Discussion Paper No. DP7994.
Duflo, Esther, Michael Kremer, and Jonathan Robinson (2011). "Nudging Farmers to Use Fertilizer:
Theory and Experimental Evidence from Kenya," American Economic Review, 101(6): 2350–90.
Fafchamps, Marcel, David McKenzie, Simon R. Quinn, and Christopher Woodruff (2011). "When is capital
enough to get female microenterprises growing? Evidence from a randomized experiment in
Ghana," NBER Working Paper No. 17207.
Giné, Xavier, and Ghazala Mansuri (2011). “Money or Ideas? A Field Experiment on Constraints to Entrepreneurship in Rural Pakistan,” mimeo.
Karlan, Dean, Isaac Osei‐Akoto, Robert Osei, and Chris Udry (2012). “Agricultural Decisions after Relaxing Credit and Risk Constraints,” working paper.
Karlan, Dean and Martin Valdivia (2011). “Teaching Entrepreneurship: Impact Of Business Training On
Microfinance Clients and Institutions,” Review of Economics and Statistics,93(2):510‐527. Karlan, Dean, and Jonathan Zinman (2010). “Expanding Credit Access: Using Randomized Supply
Decisions To Estimate the Impacts,” Review of Financial Studies, 23(1), January 2010.
Karlan, Dean, and Jonathan Zinman (2011). “Microcredit in Theory and Practice: Using Randomized
Credit Scoring for Impact Evaluation,” Science, 332(6035):1278‐1284.
Mano, Yukichi, Alhassan Iddrisu, Yutaka Yoshino, and Tetsushi Sonobe (2011). “How Can Micro and
Small Enterprises in Sub‐Saharan Africa Become More Productive? The Impacts of Experimental
Basic Managerial Training,” Policy Research Working Paper Series 5755, The World Bank.
McKenzie, David and Christopher Woodruff (2008). "Experimental Evidence on Returns to Capital and
Access to Finance in Mexico," The World Bank Economic Review 22(3):457‐482, 2008.
21
McKenzie, David, and Christopher Woodruff (2012). “What are we learning from business training and
entrepreneurship evaluations around the developing world?” working paper.
Morduch, Jonathan, Shamika Ravi and Jonathan Bauchet (2011). “Failure vs. Displacement: Why an
Innovative Anti‐Poverty Program Showed No Net Impact” working paper.
Sonobe, Tetsushi, and Aya Suzuki (2011). “KAIZEN for Managerial Skills Improvement in Small and
Medium Enterprises: An Impact Evaluation Study,” working paper.
Udry, Christopher, and Santosh Anagol (2006). "The Return to Capital in Ghana," American Economic
Review Papers & Proceedings, vol. 96(2), pages 388‐393, May.
Valdivia, Martin (2012). “Training or Technical Assistance for Female Entrepreneurship? Evidence from a
Field Experiment in Peru,” GRADE working paper.

22
IX. TablesandFiguresFigure 1: Timeline
Survey Modules
All Modules Rnd 1 Rnd 2 Rnd 3 Rnd 4 Rnd 5 Rnd 6 Rnd 7 Rnd 8
Income Income Income Income Income Income Income
Biz Overview Biz Overview Biz Overview Biz Overview Biz Overview
Staff Staff Staff Staff
Assets Assets Assets Assets
Finance Finance Finance Finance Finance
Operations Operations Operations Operations
Rev/Expense Rev/Expense Rev/Expense Rev/Expense Rev/Expense
Products Products Products Products Products Products
Marketing Marketing Marketing
Skills/Formality Skills/Formality Formality
Household Household Household
Financial Literacy Financial Literacy FInancial LIteracy
Attitudes Attitudes Attitudes
Social Networks Social Networks
Games Games Games
Bookkeeping Bookkeeping Bookkeeping Bookkeeping
Quality of Consulting Quality of Consulting
Daily Logs Daily Logs
Nov2008
Dec Jan2009
Feb Mar Apr May Jun Jul Aug Sep Oct Nov Dec Jan2010
Feb Mar … Dec Jan2011
0
0.5
1
1.5
2
Average
Hours of Consulting Per Tailor
Rnd 1Survey
Rnd 2Survey
Rnd 3Survey
Rnd 4Daily Visits
Rnd 5Survey
CapitalDelivered
Rnd 6Survey
Rnd 8Survey
Rnd 7Survey
Average Hours of Consulting per Client per Month
23
Figure 2: Histogram of hours of consulting per tailor
0
5
10
15
Num
ber
of T
ailo
rs
0 5 10 15 20Total Hours of Consulting

24
Figure 3: Mean Income by Month
Start of Consulting Capital Drop
050
100
150
200
250
Ced
is
Nov 08 June 09 Aug 09 Nov 09 Dec 09 Nov 10
Control Consulting
Capital Cap + Consult
95% Confidence Interval Shown
Mean Income by Month
25
Table 1: Baseline Summary Statistics and Randomization Check Randomization Check: Differences from Mean
Baseline Sample Stats Consulting Capital Capital & Model
Mean Min Max Control Only Only Consulting F‐Stat Prob > F
(std dev) (std err) (std err) (std err) (std err)
(1) (2) (3) (4) (5) (6) (7) (8) (9)
Male 0.43 0 1 0.00777 ‐0.0166 0.0424 ‐0.0424 0.297 0.880
(0.5) (0.0549) (0.0549) (0.0570) (0.0586)
Age 35.29 22 76 0.125 ‐1.655 1.816 ‐0.204 1.048 0.385
(7.8) (1.181) (1.181) (1.227) (1.278)
Married 0.56 0 1 0.120 0.0229 ‐0.115 ‐0.00694 1.148 0.336
(0.5) (0.0772) (0.0772) (0.0802) (0.0824)
Literate 1.30 1 5 0.101 0.0421 ‐0.0561 ‐0.0708 0.175 0.951
(1.0) (0.166) (0.164) (0.172) (0.177)
Number of Children 1.24 0 6 0.343* ‐0.120 ‐0.103 ‐0.0420 0.853 0.494
(1.3) (0.205) (0.205) (0.219) (0.222)
Shop is cement 0.21 0 1 0.0620 0.0620 ‐0.0484 ‐0.0951 1.123 0.348
(0.4) (0.0630) (0.0630) (0.0654) (0.0672)
Income last month 113.99 0 1000 ‐22.20 8.924 1.570 17.84 0.511 0.728
(122.9) (19.94) (20.75) (22.01) (22.74)
Ave Monthly Revenue 240.21 12 2000 3.392 61.50* ‐36.21 ‐32.62 1.160 0.331
(224.9) (35.79) (35.35) (38.26) (38.81)
Monthly Expenses 247.66 3 1712 33.66 ‐16.56 6.848 ‐19.59 0.258 0.904
(262.9) (41.63) (41.63) (43.24) (44.42)
Apprentices 0.86 0 5 ‐0.204 0.430** ‐0.205 ‐0.0292 2.263 0.0649
(1.1) (0.171) (0.171) (0.178) (0.183)
Employees 0.35 0 4 ‐0.00854 ‐0.0329 0.124 ‐0.1000 0.623 0.647
(0.6) (0.0984) (0.0984) (0.102) (0.105)
Fixed Assets 1566.01 110 20230 ‐72.22 ‐125.3 457.0 ‐260.8 0.704 0.590
(1975.8) (312.1) (312.1) (324.2) (333.0)
Working Capital 184.02 0 2000 48.96 42.38 ‐68.07 ‐16.59 1.243 0.295
(263.6) (41.23) (41.74) (44.00) (44.62)
Keeps Records 0.17 0 1 ‐0.0224 ‐0.0468 0.0681 0.0257 0.536 0.710
(0.4) (0.0594) (0.0594) (0.0617) (0.0634)
Registered Business 0.53 0 1 0.0297 0.00534 0.0214 ‐0.00347 0.0543 0.994
(0.5) (0.0788) (0.0788) (0.0818) (0.0841)
Has Ever Taken a Loan 0.11 0 1 ‐0.0331 ‐0.0575 0.131*** ‐0.0229 2.251 0.0662
0.3 (0.0479) (0.0479) (0.0498) (0.0511)
Social Network Size 2.81 0 13 ‐0.0808 0.0168 ‐0.0757 0.271 0.230 0.922
(2.6) (0.289) (0.289) (0.300) (0.308)
Digits Backward 3.11 1 6 ‐0.0881 ‐0.0637 0.0980 0.0264 0.537 0.709
(0.9) (0.0997) (0.0997) (0.104) (0.106)
Notes: Standard errors and F‐Stat are from a regression of de‐meaned baseline values against all four groups with no constant
Baseline standard deviations are reported below baseline means.

26
Table 2: Business Literacy and Practices
Business
Literacy Business Practices Record Keeping
Rnd 8 Pooled Rnd 3 Rnd 7 Rnd 8 Pooled Rnd 3 Rnd 7 Rnd 8
Dec‐10 Jul‐09 Jan‐10 Dec‐10 Jul‐09 Jan‐10 Dec‐10
ols ols ols ols probit probit probit
(1) (2) (3) (4) (5) (6) (7) (8) (9)
Consulting 0.309** 0.0363* 0.0565*** 0.0295 0.00807 0.220*** 0.448*** 0.227*** 0.0663
(0.120) (0.0200) (0.0216) (0.0211) (0.0312) (0.0519) (0.0786) (0.0777) (0.0713)
Test Consulting = Consulting in Rnd 3
Chi‐sq 0.86 1.74 3.70 9.12
p 0.355 0.187 0.055 0.003
Observations 149 749 150 153 149 452 150 153 149
Rounds with Data 1, 2, 3, 5, 6, 7, 8 1, 3, 7, 8
Individuals 154 154
Outcome Mean at Baseline None 0.398 0.398 0.398 0.398 0.169 0.169 0.169 0.169
Control for Outcome Value at Baseline No Yes Yes Yes Yes Yes Yes Yes Yes
Number of items in practices index 35 19 20 23
*p < . 10, **p < .05, ***p < . 01
Standard errors in parenthesis
All regressions include dummies for which neighborhood the tailors lived in at the baseline.
Consulting in this table includes both individuals assigned to Consulting and individuals assigned to Consulting and Capital
Business literacy is the number of answers correct on a 4 question test of business literacy
Business Practices is the percentage of all practices recommended by the consultants that were adopted in that round. All practices were not measured in all rounds.
Record Keeping is whether the respondent stated that they keep financial records.
Round‐by‐round record keeping regressions are probit models with marginal effects reported
Test Consult = Consult in Rnd 3 reports the result of a Wald test that the coefficient on Consulting in Round I is equal to the coefficient on Consulting in Round 3.

27
Table 3: Investment Flows
Actual Investment in Investments Made During Previous Year
Category of Likely Use for Dec‐09 Dec‐10
200 Cedi Grant at Baseline Total Property/ Total Property/
Dec‐09 Dec‐10 Investment Machines Shop Inputs Investment Machines Shop Inputs
ols ols ols ols ols ols ols ols ols ols
(1) (2) (3) (4) (5) (6) (7) (8) (9) (10)
Consulting Only 11.33 ‐72.74 151.6 ‐61.56 211.8 ‐5.396 ‐175.9 ‐32.57 ‐36.55 ‐35.76
(90.89) (85.75) (270.8) (72.66) (226.5) (27.49) (184.5) (57.09) (106.1) (59.94)
Capital Only 179.3* ‐13.70 73.52 ‐85.88 166.8 46.35* ‐378.3* ‐106.0* ‐123.9 ‐21.52
(92.13) (88.96) (274.7) (73.75) (229.5) (27.52) (191.6) (59.31) (110.0) (61.30)
Consulting & Capital 89.57 ‐64.92 269.0 54.75 199.4 21.12 ‐66.51 ‐13.64 63.45 9.693
(93.34) (88.00) (278.7) (74.66) (232.8) (28.16) (189.7) (58.62) (108.9) (61.37)
p value on tests of joint significance
Consulting & Capital with Consulting 0.53 0.36 0.38 0.96 0.30 0.75 0.46 0.65 0.89 0.81
Consulting & Capital with Capital 0.10 0.61 0.47 0.81 0.36 0.16 0.18 0.24 0.75 0.91
p value on tests of equality of means
Consulting & Capital = Consulting 0.40 0.93 0.67 0.12 0.96 0.34 0.56 0.74 0.35 0.45
Consulting & Capital = Capital 0.34 0.57 0.49 0.06 0.89 0.37 0.11 0.13 0.10 0.61
Observations 153 149 153 153 153 153 149 149 149 149
*p < . 10, **p < .05, ***p < . 01
Standard errors in parenthesis
All variables winsorized at the highest 1%
See Appendix Table 3 for breakdown of likely investment categories at baseline.
All regressions include baseline asset controls and dummies for community

28
Table 4: Savings
Total Savings Bank Savings Susu Savings
Rnd 3 Rnd 6 Rnd 8 Rnd 3 Rnd 6 Rnd 8 Rnd 3 Rnd 6 Rnd 8
Jul‐09 Dec‐09 Dec‐10 Pooled Jul‐09 Dec‐09 Dec‐10 Pooled Jul‐09 Dec‐09 Dec‐10 Pooled
ols ols ols ols ols ols ols ols ols ols ols ols
(1) (2) (3) (4) (5) (6) (7) (8) (9) (10) (11) (12)
Consulting Only 8.842 36.61 3.233 10.46 9.592 20.65 7.693 10.83 8.244 16.55* 13.21 8.547
(14.27) (34.89) (46.43) (18.28) (13.24) (30.56) (38.92) (16.80) (5.444) (9.439) (15.98) (6.203)
Capital Only 11.61 6.639 3.159 6.999 ‐2.228 0.742 2.783 10.81 2.158
(31.05) (42.17) (29.49) (28.81) (37.37) (26.45) (8.368) (14.48) (8.081)
Consulting & Capital 75.13** 8.617 28.96 47.42 ‐2.079 19.33 28.38*** 22.75 16.63*
(35.68) (47.44) (21.99) (31.31) (39.83) (18.31) (9.649) (16.34) (8.448)
p value on tests of joint significance
Consulting & Capital with Consulting 0.08 0.89 0.24 0.22 0.94 0.30 0.01 0.22 0.04
Consulting & Capital with Capital 0.14 0.84 0.41 0.29 0.95 0.57 0.05 0.21 0.16
p value on tests of equality of means
Consulting & Capital = Consulting 0.22 0.89 0.42 0.36 0.79 0.66 0.16 0.50 0.33
Consulting & Capital = Capital 0.06 0.97 0.45 0.19 1.00 0.52 0.01 0.44 0.14
Observations 150 153 149 452 150 153 149 452 150 153 149 452
Outcome Mean at Baseline 79.4 79.4 79.4 79.4 53.3 53.3 53.3 53.3 18.6 18.6 18.6 18.6
*p < . 10, **p < .05, ***p < . 01
Standard errors in parenthesis
Controls for baseline value and community in all regressions
29
Table 5: Change in Net Financial Flows, All Channels
Investment in Goal, Total Investment,
Savings, and Savings, and
Loan Amounts Avoided Loans Avoided Loans
Dec‐09 Dec‐10 Dec‐09 Dec‐10 Dec‐09 Dec‐10
ols ols ols ols ols ols
(1) (2) (3) (4) (5) (6)
Consulting Only ‐55.82 ‐31.71 67.35 ‐42.43 211.6 ‐54.14
(55.47) (88.69) (113.1) (113.9) (286.7) (149.3)
Capital Only ‐135.6** 21.75 326.2*** ‐43.32 191.5 ‐245.6
(55.40) (90.56) (114.6) (118.2) (290.6) (154.9)
Consulting & Capital ‐85.09 13.12 229.3* ‐69.13 400.0 17.27
(56.99) (91.06) (116.3) (117.1) (294.9) (153.4)
p value on tests of joint significance
Consulting & Capital with Consulting 0.15 0.91 0.14 0.58 0.23 0.89
Consulting & Capital with Capital 0.02 ** 0.82 0.01 *** 0.58 0.24 0.39
p value on tests of equality of means
Consulting & Capital = Consulting 0.60 0.61 0.16 0.82 0.52 0.64
Consulting & Capital = Capital 0.38 0.93 0.41 0.83 0.48 0.10 *
Observations 153 149 153 149 153 149
*p < . 10, **p < .05, ***p < . 01
Standard errors in parenthesis
Columns 1 and 2 winsorized at the highest 1%. Columns 3‐5 winsorized at highest and lowest 1%
See Appendix Table 3 for breakdown of likely investment categories at baseline.
Controls for baseline value and community in all regressions
Columns 3 and 4 are investment in goal category plus savings minus loans taken
Columns 5 and 6 are total investment plus savings minus loans taken

30
Table 6: Profitability Pooled
Revenue Hours
Stated less Worked Total Paid
Income Revenue Expenses Expenses per Month Staff Apprentices Employees
Pooled Pooled Pooled Pooled Pooled Pooled Pooled Pooled
(1) (2) (3) (4) (5) (6) (7) (8)
Consulting Only 0.905 ‐33.34 ‐18.24 ‐15.89 2.325 0.0565 0.0687 0.0474
(21.42) (38.76) (29.97) (22.35) (11.40) (0.205) (0.157) (0.106)
Capital Only ‐45.43** 29.24 12.52 ‐23.41 4.284 ‐0.158 0.0166 ‐0.169
(21.99) (86.31) (49.82) (32.50) (10.89) (0.205) (0.146) (0.112)
Consulting & Capital ‐23.23 ‐29.94 7.778 ‐42.33* ‐12.87 ‐0.0159 ‐0.0376 0.104
(20.06) (39.43) (34.36) (24.07) (11.63) (0.192) (0.155) (0.117)
p value on tests of joint significance
Any Consulting 0.52 0.34 0.85 0.12 0.58 0.91 0.91 0.44
Any Capital 0.06 * 0.99 0.77 0.15 0.65 0.61 0.93 0.74
p value on tests of equality of means
Consulting & Capital = Consulting 0.29 0.93 0.42 0.34 0.25 0.73 0.53 0.61
Consulting & Capital = Capital 0.30 0.49 0.92 0.59 0.17 0.49 0.74 0.02 **
Observations 747 445 447 444 452 302 302 302
Rounds with Data 1,3,5,6,7,8 1,5,6,8 1,5,6,8 1,5,6,8 1,3,6,8 1,6,8 1,6,8 1,6,8
Individuals 154 154 154 154 154 153 153 153
Outcome Mean at Baseline 111.9 235.0 244.9 1.2 243.0 1.3 0.9 0.4
*p < . 10, **p < .05, ***p < . 01
Standard errors in parenthesis
Revenue, expenses and revenue less expenses all include both baseline revenue and baseline expenses as a control for consistency
Profit, Revenue less expenses and profit per hour are winsorized (capped) at highest and lowest 1%
Revenue, expenses and hours worked are winsorized (capped) at the highest 1%
Controls for baseline value and community in all regressions

31
Table 7: Profitability by Round
Income Revenue Expenses
Rnd 3 Rnd 5 Rnd 6 Rnd 7 Rnd 8 Rnd 5 Rnd 6 Rnd 8 Rnd 5 Rnd 6 Rnd 8
Jul‐09 Sep‐09 Dec‐09 Jan‐10 Dec‐10 Sep‐09 Dec‐09 Dec‐10 Sep‐09 Dec‐09 Dec‐10
ols ols ols ols ols ols ols ols ols ols ols
(1) (2) (3) (4) (5) (6) (7) (8) (9) (10) (11)
Consulting Only ‐25.83* 25.67 ‐17.04 ‐15.83 11.35 24.25 ‐7.319 ‐131.2 5.541 ‐0.327 ‐68.33
(13.39) (16.74) (29.91) (40.02) (44.69) (26.24) (47.73) (114.0) (13.02) (33.30) (73.77)
Capital Only ‐29.21 ‐52.62 ‐74.61 ‐3.283 45.69 52.67 ‐25.61
(30.31) (40.58) (46.28) (48.30) (118.4) (33.73) (76.64)
Consulting & Capital 6.597 ‐16.06 ‐98.46** 35.79 ‐143.8 34.62 ‐0.459
(30.83) (41.29) (46.09) (48.90) (116.9) (34.14) (75.63)
p value on tests of joint significance
Consulting & Capital with Consulting 0.84 0.65 0.27 0.73 0.17 0.56 0.59
Consulting & Capital with Capital 0.67 0.33 0.03 ** 0.70 0.63 0.14 0.84
p value on tests of equality of means
Consulting & Capital = Consulting 0.43 1.00 0.02 ** 0.37 0.91 0.31 0.37
Consulting & Capital = Capital 0.24 0.37 0.61 0.42 0.11 0.60 0.74
Observations 149 144 152 153 149 144 151 149 145 153 149
Outcome Mean at Baseline 111.9 111.9 111.9 111.9 111.9 235.0 235.0 235.0 244.9 244.9 244.9
*p < . 10, **p < .05, ***p < . 01
Standard errors in parenthesis
Controls for baseline value and community in all regressions
Consulting includes all 80 individuals assigned to the consulting group in rounds 3 and 5
Revenue and expenses include both baseline revenue and baseline expenses as a control for consistency
Revenue and expenses are winsorized at the highest 1% and income is winsorized at the highest and lowest 1%
32
Table 8: Profitability Tails
Top 10% of Income Top 5% of Income
Pooled Rnd 3 Rnd 5 Rnd 6 Rnd 7 Rnd 8 Pooled Rnd 3 Rnd 5 Rnd 6 Rnd 7 Rnd 8
Jul‐09 Sep‐09 Dec‐09 Jan‐10 Dec‐10 Sep‐09 Dec‐09 Dec‐10 Jan‐10 Dec‐09
(1) (2) (3) (4) (5) (6) (7) (8) (9) (10) (11) (12)
Consulting Only 0.00275 ‐0.0737 0.0620 ‐0.0491 ‐0.0195 0.0192 0.0161 ‐0.0166 0.0623 ‐0.00323 ‐0.115 0.0821
(0.0515) (0.0507) (0.0584) (0.100) (0.111) (0.0999) (0.0427) (0.0371) (0.0429) (0.0695) (0.0934) (0.0783)
Capital Only ‐0.0644 ‐0.0857 ‐0.0119 ‐0.141 ‐0.0650 ‐0.0701 ‐0.173* ‐0.0159
(0.0636) (0.102) (0.112) (0.103) (0.0460) (0.0704) (0.0947) (0.0810)
Consulting & Capital ‐0.0659 0.0324 ‐0.0178 ‐0.295*** ‐0.0337 0.00947 ‐0.113 ‐0.113
(0.0517) (0.103) (0.114) (0.103) (0.0425) (0.0716) (0.0963) (0.0807)
p value on tests of joint significance
Consulting & Capital with Consulting 0.47 0.92 0.85 0.12 0.80 0.96 0.17 0.82
Consulting & Capital with Capital 0.17 0.76 0.88 0.02 ** 0.18 0.62 0.09 * 0.36
p value on tests of equality of means
Consulting & Capital = Consulting 0.22 0.42 0.99 0.00 *** 0.31 0.86 0.98 0.01 **
Consulting & Capital = Capital 0.98 0.25 0.96 0.14 0.53 0.26 0.53 0.23
Observations 747 149 144 152 153 149 747 149 144 152 153 149
Individuals 154 154
*p < . 10, **p < .05, ***p < . 01
Standard errors in parenthesis
Controls for baseline value and community in all regressions
Consulting includes all 80 individuals assigned to the consulting group in rounds 3 and 5
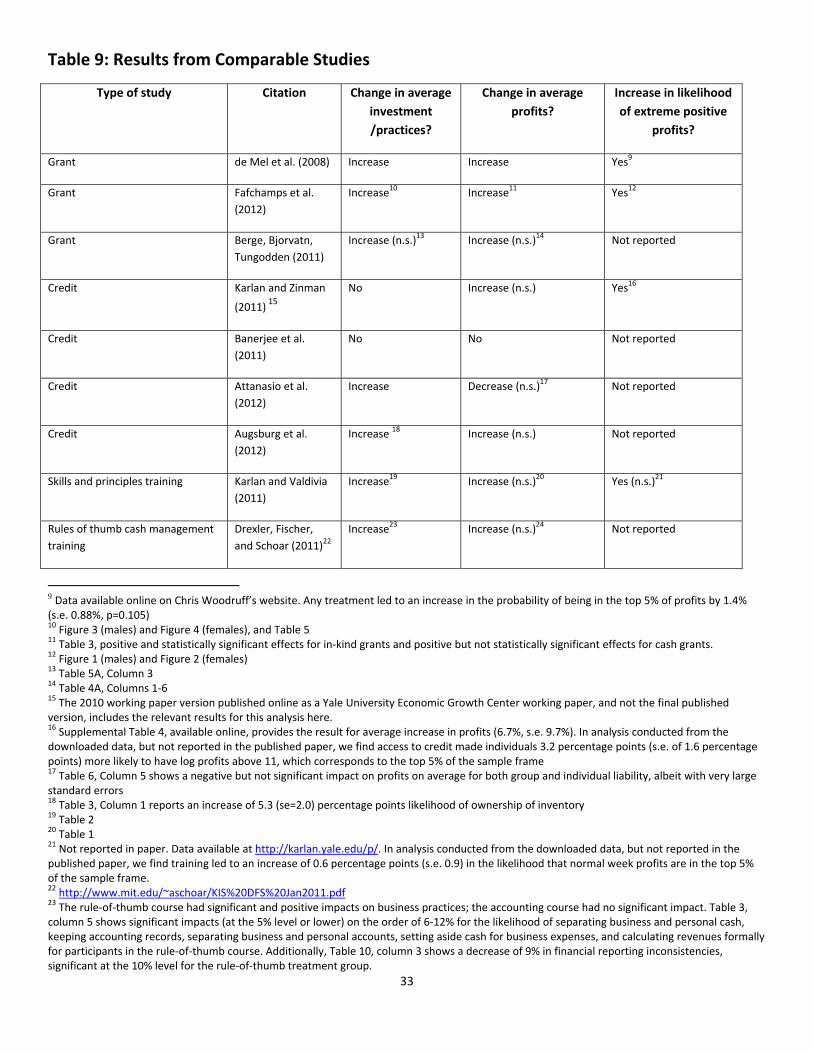
33
Table 9: Results from Comparable Studies
Type of study Citation Change in average
investment
/practices?
Change in average
profits?
Increase in likelihood
of extreme positive
profits?
Grant de Mel et al. (2008) Increase Increase Yes9
Grant Fafchamps et al.
(2012)
Increase10 Increase11 Yes12
Grant Berge, Bjorvatn,
Tungodden (2011)
Increase (n.s.)13 Increase (n.s.)14 Not reported
Credit Karlan and Zinman
(2011) 15
No Increase (n.s.) Yes16
Credit Banerjee et al.
(2011)
No No Not reported
Credit Attanasio et al.
(2012)
Increase Decrease (n.s.)17 Not reported
Credit Augsburg et al.
(2012)
Increase 18 Increase (n.s.) Not reported
Skills and principles training Karlan and Valdivia
(2011)
Increase19 Increase (n.s.)20 Yes (n.s.)21
Rules of thumb cash management
training
Drexler, Fischer,
and Schoar (2011)22
Increase23 Increase (n.s.)24 Not reported
9 Data available online on Chris Woodruff’s website. Any treatment led to an increase in the probability of being in the top 5% of profits by 1.4% (s.e. 0.88%, p=0.105) 10 Figure 3 (males) and Figure 4 (females), and Table 5 11 Table 3, positive and statistically significant effects for in‐kind grants and positive but not statistically significant effects for cash grants. 12 Figure 1 (males) and Figure 2 (females) 13 Table 5A, Column 3 14 Table 4A, Columns 1‐6 15 The 2010 working paper version published online as a Yale University Economic Growth Center working paper, and not the final published version, includes the relevant results for this analysis here. 16 Supplemental Table 4, available online, provides the result for average increase in profits (6.7%, s.e. 9.7%). In analysis conducted from the downloaded data, but not reported in the published paper, we find access to credit made individuals 3.2 percentage points (s.e. of 1.6 percentage points) more likely to have log profits above 11, which corresponds to the top 5% of the sample frame 17 Table 6, Column 5 shows a negative but not significant impact on profits on average for both group and individual liability, albeit with very large standard errors 18 Table 3, Column 1 reports an increase of 5.3 (se=2.0) percentage points likelihood of ownership of inventory 19 Table 2 20 Table 1 21 Not reported in paper. Data available at http://karlan.yale.edu/p/. In analysis conducted from the downloaded data, but not reported in the published paper, we find training led to an increase of 0.6 percentage points (s.e. 0.9) in the likelihood that normal week profits are in the top 5% of the sample frame. 22 http://www.mit.edu/~aschoar/KIS%20DFS%20Jan2011.pdf 23 The rule‐of‐thumb course had significant and positive impacts on business practices; the accounting course had no significant impact. Table 3, column 5 shows significant impacts (at the 5% level or lower) on the order of 6‐12% for the likelihood of separating business and personal cash, keeping accounting records, separating business and personal accounts, setting aside cash for business expenses, and calculating revenues formally for participants in the rule‐of‐thumb course. Additionally, Table 10, column 3 shows a decrease of 9% in financial reporting inconsistencies, significant at the 10% level for the rule‐of‐thumb treatment group.

34
Type of study Citation Change in average
investment
/practices?
Change in average
profits?
Increase in likelihood
of extreme positive
profits?
Principles of accounting training Drexler, Fischer,
and Schoar (2011) 25
Increase (n.s.) Decrease (n.s.) Not reported
Eight‐day training session on business fundamentals with hands‐on activities.
Giné and Mansuri (2011)26
Increase27 Decrease (n.s.)28 Not reported
Twenty‐one sessions of forty‐five‐minute business training classes with case studies and role play.
Berge, Bjorvatn, Tungodden (2011)29
Increase 30 Increase for males, decrease for females (n.s.)31
Not reported
Six modules on the basics of accounting, investment, and other business fundamentals.
Bruhn and Zia (2011) 32
Increase33 Decrease (n.s.)34 Not reported
Five‐months of free management consulting to randomly selected plants of large Indian textile firms.
Bloom et al. (2012) 35
Increase36 Increase37 Not reported
Three modules of business training administered over fifteen days.
Mano et al. (2011) 38
Increase39 Increase40 Not reported
Classroom and on‐site business training.
Sonobe and Suzuki41 (2011)
Increase42 Mixed (n.s.)43 Not reported
Forty‐seven hours of basic business training for female entrepreneurs.
Calderon, Cunha, and Giorgi (2011)44
Increase45 Increase (n.s.)46 Not reported
24 Table 3 columns 5 and 3 show that sales increased more than expenses for the rule‐of‐thumb treatment, while expenses decreased less than sales did for the accounting principles treatment. 25 http://www.mit.edu/~aschoar/KIS%20DFS%20Jan2011.pdf 26 http://siteresources.worldbank.org/DEC/Resources/Money_or_Ideas.pdf 27 Panel A of Table 3 shows significant and positive increase of 0.131 standard deviations in an index of business practices. 28 Panel A of Table 3 shows negative but not statistically significant impact on average sales and profits (‐0.021 standard deviations, s.e. 0.054). 26http://www.nhh.no/Admin/Public/DWSDownload.aspx?File=%2fFiles%2fFiler%2finstitutter%2fsam%2fDiscussion+papers%2f2011%2f01.11.pdf 30 Table 5C columns 1‐3 show that training increased indices of business practices around marketing, commerce and record‐keeping, (p<0.05). Table 6A column 2 shows that business knowledge increased (p<0.05). 31 Table 4A, columns 1‐6 show that male participants in business training increased profits by 20‐30% (p<0.05), while female participants had decreased profits (n.s.). 32http://econ.worldbank.org/external/default/main?pagePK=64165259&piPK=64165421&theSitePK=469372&menuPK=64216926&entityID=000158349_20110427082512 33 Table 11 column 1 shows a significant decrease of 21% in the likelihood of using a personal account for business. 34 Table 9 column 1 shows a decrease (n.s.) in net profits. 35 http://www.stanford.edu/~nbloom/DMM.pdf 36 Table A1 shows a p‐value below .01 for a positive difference in difference between the treatment and control group management practices before and after the treatment. 37 Table A2 shows an estimated impact of $325, 000 on plant profitability for significant improvements in plant performance, tested in columns 1‐8 of Table 2. 38 http://www‐wds.worldbank.org/external/default/WDSContentServer/IW3P/IB/2011/08/09/000158349_20110809112532/Rendered/PDF/WPS5755.pdf 39 Table 6 columns 1‐3 show significant increases in visiting customers, record keeping, and record analysis. 40 Table 6 column 6 shows positive impacts of training on profits for both fabricators and machinists. The impact is significant and large for the fabricators but not significant for the machinists. 41 Note: this study is ongoing and the results presented are preliminary. http://siteresources.worldbank.org/DEC/Resources/VolumeIVPart2.pdf 42 Table 3‐7‐6 part 3 shows a positive and significant increase in total KAIZEN practices for both trainings in Tanzania. Table 4‐10 shows a positive and significant impact on KAIZEN practices for both trainings in Ethiopia. Tables 5‐13a & 5‐13b show a positive and significant impact on the total business practice score for both trainings in Vietnam. Tables 6‐13a and 6‐13b show positive and significant impact on the total score for management practices for both trainings, also in Vietnam. 43 Table 3‐8 column 3 shows a decrease (n.s.) in gross profits for both trainings in Tanzania. Further study is required to identify causal impacts on profits in Ethiopia (p. 324). Table 6‐5 shows an increase in profits in the latest round of surveying for training groups in Ethiopia. 44 http://www.stanford.edu/~gabcal/financial_literacy.pdf. Note this study is ongoing and the results are for seven months only.

35
Type of study Citation Change in average
investment
/practices?
Change in average
profits?
Increase in likelihood
of extreme positive
profits?
One year of weekly consulting services from local consulting firms
Bruhn, Karlan and Schoar (2012)
Increase Increase No (not reported in paper, analysis available from authors)
General business training (+ technical assistance sub‐treatment group)
Valdivia (2012) Increase Increase (revenues, not profits, reported)
Not reported
45 Table 3 columns 1 and 2 show positive and significant increases in keeping formal business accounts and positive increases in knowing daily and weekly profits. 46 Table 3 columns 1 and 2 show positive, but not significant increases in daily and weekly profits.

36
X. AppendixA:AdditionalTables
Appendix Table 1: Attrition
Reasons Not Found Not Found by Treatment
Not Permanently No Info/ Capial and
Round Found Found Deceased Moved Temporary Control Consulting Capital^^ Consulting
1) Dec 2008 160 0 0 0 0
2) Jan 2009 160 0 0 0 0
3) July 2009 150 10 2 4 4 5 5
4) Aug 2009 150^ 10 2 4 4 7 4
5) Sept 2009 145 15 2 4 9 7 8
6) Dec 2009 153 7 3 4 0 3 4 0 0
7) Jan 2010 153 7 3 4 0 3 4 0 0
8) Dec 2010 149 11 5 6 0 3 4 3 0
^ Found on at least one day
^^ Note that capital group randomization excluded 6 individuals not found in any of rounds 3‐5.
Appendix Table 2: Baseline Characteristics
Mean SD Min Median Max N
Income Last Month 114 123 0 80 1000 141
Average Monthly Revenue 240 225 12 200 2000 154
Monthly Expenses Excluding Rent 237 261 3 151 1712 160
Working Capital 184 264 0 100 2000 156
Fair Value of Fixed Assets 1566 1976 110 1140 20230 160
Number of Paid Employees 0.4 0.6 0.0 0.0 4.0 160
Keeps Financial Records 0.2 0.4 0.0 0.0 1.0 160
Has Ever Taken a Loan 0.1 0.3 0.0 0.0 1.0 160
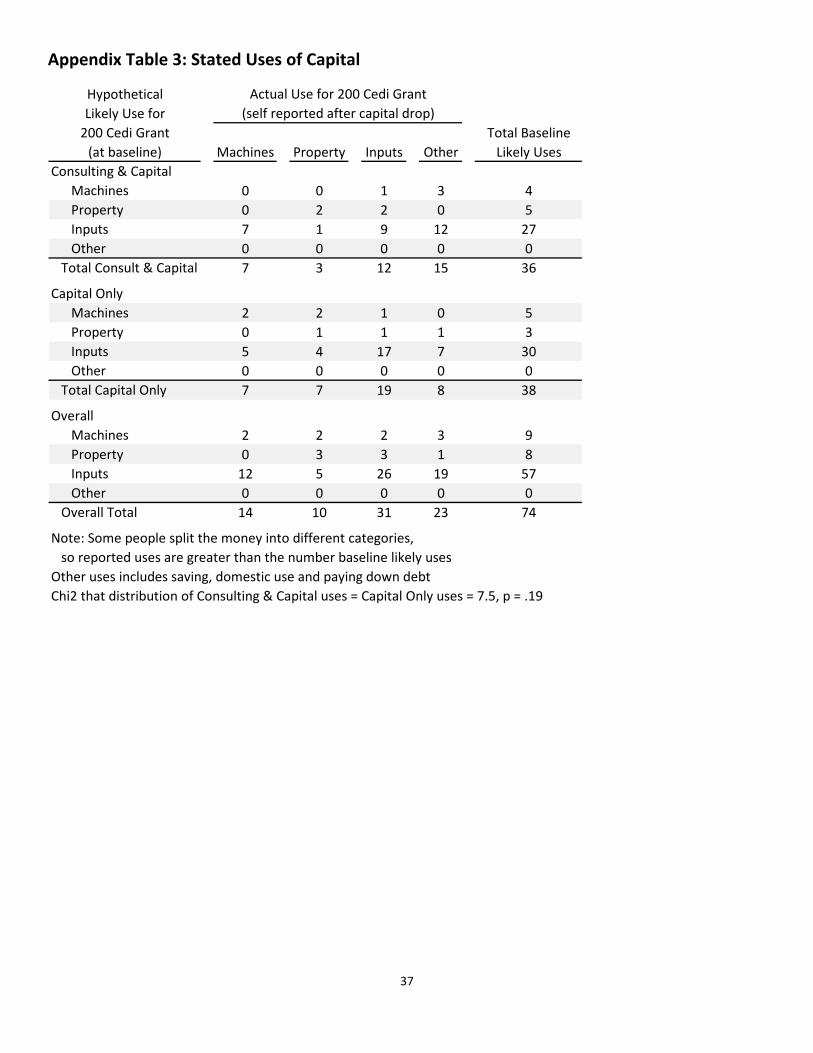
37
Appendix Table 3: Stated Uses of Capital
Hypothetical Actual Use for 200 Cedi Grant
Likely Use for (self reported after capital drop)
200 Cedi Grant Total Baseline
(at baseline) Machines Property Inputs Other Likely Uses
Consulting & Capital
Machines 0 0 1 3 4
Property 0 2 2 0 5
Inputs 7 1 9 12 27
Other 0 0 0 0 0
Total Consult & Capital 7 3 12 15 36
Capital Only
Machines 2 2 1 0 5
Property 0 1 1 1 3
Inputs 5 4 17 7 30
Other 0 0 0 0 0
Total Capital Only 7 7 19 8 38
Overall
Machines 2 2 2 3 9
Property 0 3 3 1 8
Inputs 12 5 26 19 57
Other 0 0 0 0 0
Overall Total 14 10 31 23 74
Note: Some people split the money into different categories,
so reported uses are greater than the number baseline likely uses
Other uses includes saving, domestic use and paying down debt
Chi2 that distribution of Consulting & Capital uses = Capital Only uses = 7.5, p = .19

38
XI. AppendixB:Ernst&YoungTeam
The four Ernst & Young consultants were supervised by a Director and a Partner at Ernst & Young – Ghana, and
monitored by field staff at Innovations for Poverty Action ‐ Ghana.
Consultant A
Consultant A is an assistant manager in the Business Advisory Service line of Ernst & Young, Ghana. He has 6
years of experience in business process reviews, monitoring and evaluation, financial re‐engineering, fund
management, monitoring and evaluation and internal audit. He has been involved in number of Performance
Improvement related assignments in both private and public sectors. He joined Ernst & Young in 2007 and is
currently based in the Accra Office. Prior to joining Ernst & Young, Consultant A worked with TOTAL Petroleum
Ghana Limited as Internal Auditor.
Consultant A was team leader in the ‘Returns to Business Management Consulting Study’ engagement
undertaken for Innovations for Poverty Action (IPA). Consultant A holds a Bachelors degree in Administration
(Accounting) from the University of Ghana and a MBA in Financial Management from the University of Hull. He is
a member of the Association of Chartered Certified Accountants (UK).
Consultant B
Consultant B is a Manager in Advisory Service Line and engaged in the provision of performance improvement
services, including monitoring and evaluation (M&E) for clients in the public and private sector. Consultant B has
over 6 years of experience in diverse areas, including Monitoring and Evaluation, Policy Analysis, Project
Management, Training, Strategy Planning, Communication, Advocacy and Campaigns and Fundraising,
Knowledge Management and consultancy. He joined Ernst & Young Ghana in 2008 and is based in the Accra
office. He has work experience in Ghana, Sierra Leone and Liberia before joining Ernst & Young.
Consultant B holds a Master of Science in Development Policy and Planning and a Bachelor of Science in
Development Planning. He is a member of Ghana Monitoring and Evaluation forum.
Consultant C
Consultant B Mensa is a Manager with Ernst & Young and has experience in Human Resource Management. Her
areas of focus include HR Reorganization and Management, Training, Human Resource Policies and Procedures,
Salary Surveys and Performance Management. She has highly developed research abilities and has led and
supported Capacity Development and Institutional Strengthening assignments for clients both in the Public and
Private Sectors. Consultant B has been involved in various roles, from support to managing, in a number of
engagements. She joined Ernst & Young in 2004 and is based in the Accra office.
Consultant D
Consultant D is a Manager with Business Advisory Services within Ernst & Young focusing more on training and
human resource management. She joined Ernst & Young in 2007 and is based in the Accra office. She has over
18 years work experience and prior to joining Ernst & Young, Consultant D worked with the World Vision, SNV‐

39
Ghana (Netherlands Development Organisation), African Centre for Human Development and DANIDA Volta
Region Water and Sanitation Project. She holds a BSc. Administration (Human Resource Management) from the
Central University College, Ghana.
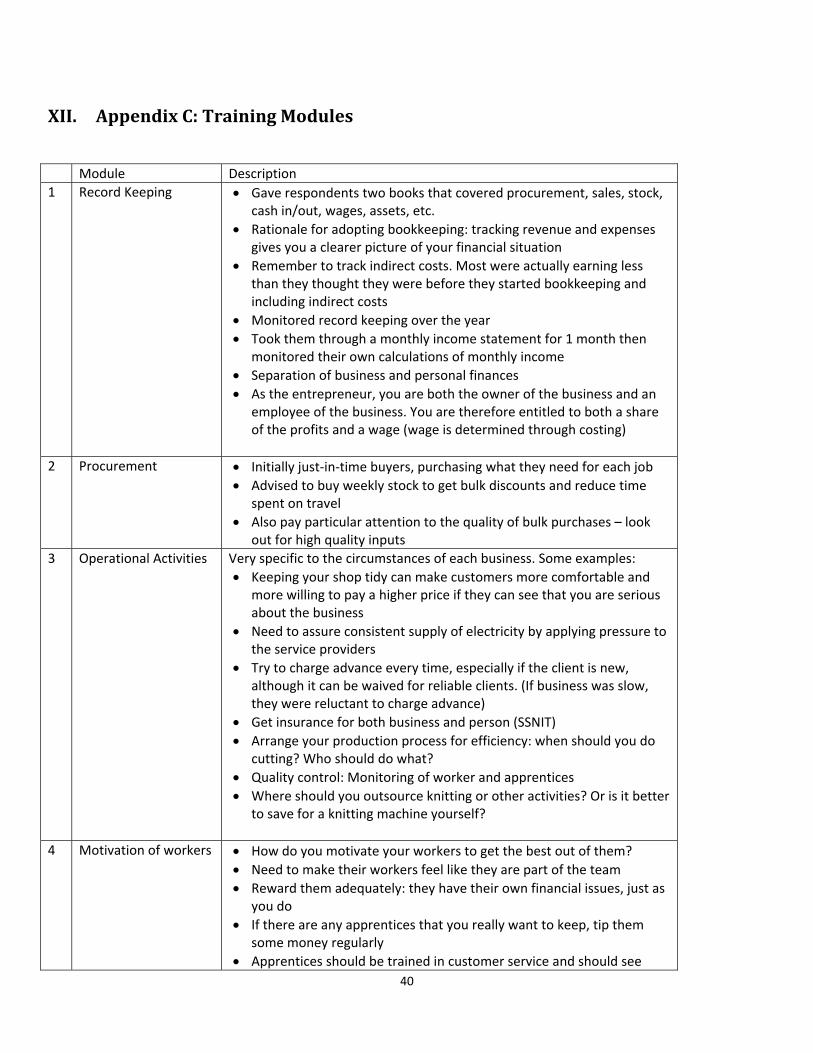
40
XII. AppendixC:TrainingModules
Module Description
1 Record Keeping Gave respondents two books that covered procurement, sales, stock, cash in/out, wages, assets, etc.
Rationale for adopting bookkeeping: tracking revenue and expenses gives you a clearer picture of your financial situation
Remember to track indirect costs. Most were actually earning less than they thought they were before they started bookkeeping and including indirect costs
Monitored record keeping over the year
Took them through a monthly income statement for 1 month then monitored their own calculations of monthly income
Separation of business and personal finances
As the entrepreneur, you are both the owner of the business and an employee of the business. You are therefore entitled to both a share of the profits and a wage (wage is determined through costing)
2 Procurement Initially just‐in‐time buyers, purchasing what they need for each job
Advised to buy weekly stock to get bulk discounts and reduce time spent on travel
Also pay particular attention to the quality of bulk purchases – look out for high quality inputs
3 Operational Activities Very specific to the circumstances of each business. Some examples:
Keeping your shop tidy can make customers more comfortable and more willing to pay a higher price if they can see that you are serious about the business
Need to assure consistent supply of electricity by applying pressure to the service providers
Try to charge advance every time, especially if the client is new, although it can be waived for reliable clients. (If business was slow, they were reluctant to charge advance)
Get insurance for both business and person (SSNIT)
Arrange your production process for efficiency: when should you do cutting? Who should do what?
Quality control: Monitoring of worker and apprentices
Where should you outsource knitting or other activities? Or is it better to save for a knitting machine yourself?
4 Motivation of workers How do you motivate your workers to get the best out of them?
Need to make their workers feel like they are part of the team
Reward them adequately: they have their own financial issues, just as you do
If there are any apprentices that you really want to keep, tip them some money regularly
Apprentices should be trained in customer service and should see
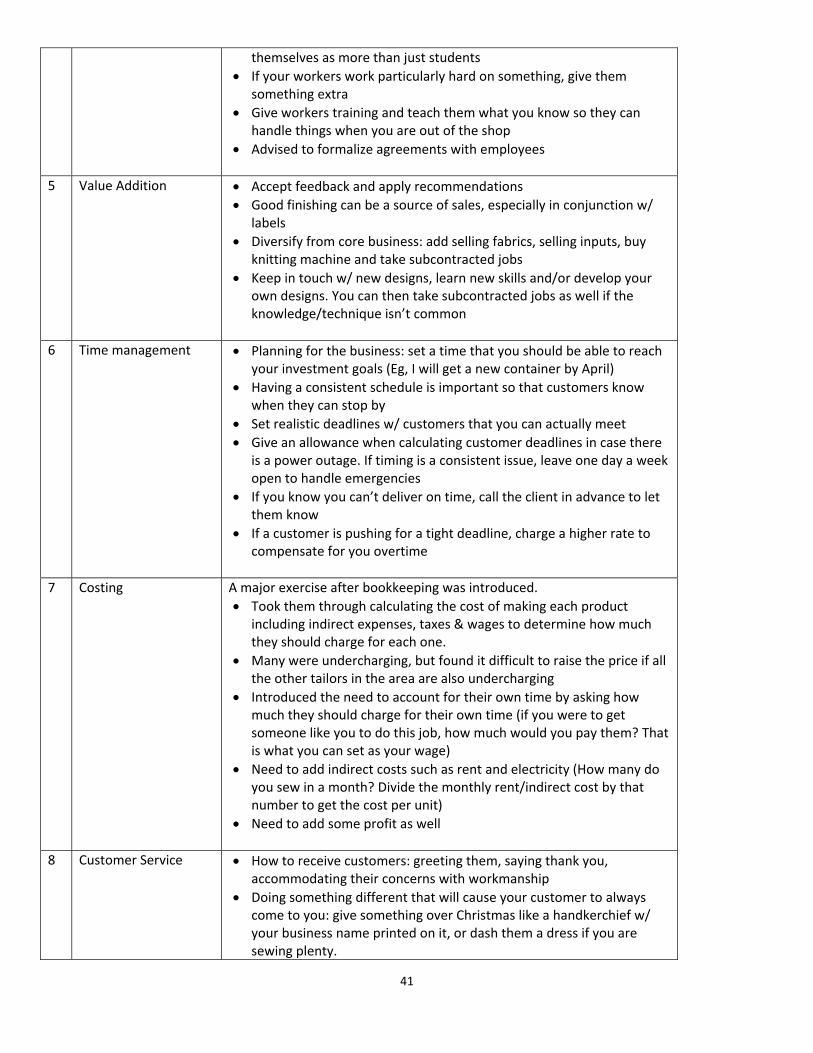
41
themselves as more than just students
If your workers work particularly hard on something, give them something extra
Give workers training and teach them what you know so they can handle things when you are out of the shop
Advised to formalize agreements with employees
5 Value Addition Accept feedback and apply recommendations
Good finishing can be a source of sales, especially in conjunction w/ labels
Diversify from core business: add selling fabrics, selling inputs, buy knitting machine and take subcontracted jobs
Keep in touch w/ new designs, learn new skills and/or develop your own designs. You can then take subcontracted jobs as well if the knowledge/technique isn’t common
6 Time management Planning for the business: set a time that you should be able to reach your investment goals (Eg, I will get a new container by April)
Having a consistent schedule is important so that customers know when they can stop by
Set realistic deadlines w/ customers that you can actually meet
Give an allowance when calculating customer deadlines in case there is a power outage. If timing is a consistent issue, leave one day a week open to handle emergencies
If you know you can’t deliver on time, call the client in advance to let them know
If a customer is pushing for a tight deadline, charge a higher rate to compensate for you overtime
7 Costing
A major exercise after bookkeeping was introduced.
Took them through calculating the cost of making each product including indirect expenses, taxes & wages to determine how much they should charge for each one.
Many were undercharging, but found it difficult to raise the price if all the other tailors in the area are also undercharging
Introduced the need to account for their own time by asking how much they should charge for their own time (if you were to get someone like you to do this job, how much would you pay them? That is what you can set as your wage)
Need to add indirect costs such as rent and electricity (How many do you sew in a month? Divide the monthly rent/indirect cost by that number to get the cost per unit)
Need to add some profit as well
8 Customer Service
How to receive customers: greeting them, saying thank you, accommodating their concerns with workmanship
Doing something different that will cause your customer to always come to you: give something over Christmas like a handkerchief w/ your business name printed on it, or dash them a dress if you are sewing plenty.

42
Know the individual customers and what they like
Create a database w/ customer names, phone numbers & where they live so you can call ones you haven’t seen in a long time
Closely related to time management
Sewing well isn’t enough: need to also meet deadlines, treat them nicely, make alterations for free, and so on
Be patient if the customers treat you w/ disrespect
Customer service is the key to building a base of loyal customers
Package things nicely for customers and use labels
9 Security of shop Have someone sleep in the store at night for security
Change the locks/buy more secure padlocks.
Keep valuables at home if possible.
If they have a wooden kiosk, can they save for a container?
10 Sales and Marketing
Most viewed time spent marketing as competing with time spent sewing
Market your products through labels, finishing, customer service, displaying sewn items
Buy fabrics so you can do sew & sell or let the customer buy their fabric right from your shop.
Help your customers to understand why you charge the prices you do if they think that the price is high
Go to offices/businesses/schools to let them know about your product
Tell people around about your abilities
Call customers that haven’t visited in a while
Register business as this can be necessary for large contracts
When you get the contract, formalize terms of payment and deliverables
Get a signboard if you don’t already have one.
Making sure you kiosk isn’t an eyesore: look presentable!
11 Lifestyle in relation to work/life
How do you balance child rearing/other household responsibilities and business? Do you need to work early or late or work from home sometimes?
Need to rest to maintain stamina
Dress professionally as if you come to work, not casually as if you’re at home
Have a serious mind for work
See a doctor regularly and check your blood pressure
12 Financing of business/savings
If you want to be able to grow, the best source for cash is retained profits. Identify how much you can save through your bookkeeping
Advised against getting a loan unless they have a concrete goal and plan to repay the principal and interest. o If you do to take a loan, top it up with savings to keep the amount
borrowed low. o Pay particular attention to how much interest you will be paying.
Ask them to calculate the amount of cash you will actually pay as interest instead of talking about it as a percentage
If you don’t have a bank account, open one. If you don’t have a

43
separate business account, open one.
Don’t dip hands into business money
Buy treasury bills for savings
13 Business Growth Identify concrete goals for expansion o How much will it cost to reach your goal? o How much would you have to save every week to get that much
money? o If the savings goal is realistic, no need to take a loan o If the savings goal is unrealistic, a loan + savings might be
worthwhile
If you consider a new location, be sure that the land rights are secure o Is a new location necessary or could your problems be solved
through better marketing?
If you know that there is a weakness in your skills set, take a course with a fashion school or association
Objective setting; short term, medium term and long term
Apart from sewing, what else can you do? Add on other businesses to protect against the seasonality of sewing
Sell the raw materials you use
How will your grow your customer base? o As your customer base is growing, how do you keep meeting your
deadlines? Additional workers? Better machines?
Model: build customer base, hire more workers, buy faster machines with savings
If you have a specific need that requires investments to meet your customer demands, you can go in for a loan

44
XIII. AppendixD:ExamplesofMentorshipClient Consultant’s Notes
819 Introduced bookkeeping and she adopted it and maintained records consistently. Wants to be a designer so advised her to seek a training course. Starting doing some more marketing but she is near the limit of her capacity so they developed plans to increase capacity by hiring a worker. Has expanded her shop a lot and took on an apprentice. Got connected to electricity and keeps a very clean shop. Adopted labels and sales of materials. Aims at a higher end customer. Responded to questions; client really embraced the consultancy.
810 Covered all models but he wasn't very interested in actually adopting new ideas. Wants to relocate his shop. Sews uniforms for school sports teams. Thinks that since he's approaching retirement it's not necessary to be aggressive about expanding and he wants to move his shop. Advised to do aggressive marketing for schools & use calling cards
402 Was suspicious of consultancy at first but really caught on. Registered her business, buys in bulk, keeps records, started using labels, dashes customers toffees. Developed plan to get a new apprentice. Wants to relocate to a place on the main road and discussed issues involved in moving. Will often ask questions about the decisions she's facing.
415 Has a second job sewing for industrial sewing shop so he's often not in the shop. Even when he's around he is not open regularly. Met him late in the year & didn't spend much time together.
304 Sews under a tree. Started well w/ bookkeeping although stopped along the line. Opened a bank account and was saving through account, also bought t‐bills. No employees. Raised prices a bit before Christmas. Sews well & has good customer relations. Started insisting on advance.
309
Was big on record keeping before she feel sick. Very disciplined w/ finances. Help provide structure for her saving, separating business & personal expenses, paying self wage. Was sick, lost her mother, then got sick again, so we didn't have as much time together. Went through costing & value addition but doesn't have employees. Didn't cover sales/marketing. Already had good customer service. Lifestyle was an important topic. Started insisting on advance.
709 Initially difficult to convince of the value of consulting but became more receptive over time. Discussed diversifying away from sewing only suits. Tried sewing shirts and was overwhelmed by their popularity. Has a huge potential if he can diversify his products and do enough marketing. Discussed bookkeeping but he stopped along the line, although he has a good memory. Discussed savings. Wants to move to a new place (w/ help in financing from one of his customers). Procurement: started buying enough for ~5 suits at once. Interested in labels for suits and branding on bags. Was sick for a month so discussed health issues.
713 Very unreceptive at the start but warmed up eventually. Started insisting on advance and changed prices based on costing. Had a special interest in selling raw materials and used the capital drop for this after some discussion. Is moving shops. Opened a bank account for the first time with the money from the money games (the 6 Cedis). Has also started saving. Didn't really take up bookkeeping at all (may be only semi‐literate). Talked about value addition but she didn't implement it. Didn't really cover marketing at all.
509 Didn't spend much time on record keeping because she was already keeping records on a computer. Has several other businesses in addition to sewing. Discussed strategies to get more retailers to sew for and open up her own retail shop. Is taking a professional course in marketing.
515 Is considering taking a loan of GHc 1000 to buy knitting and babylocking machines so they
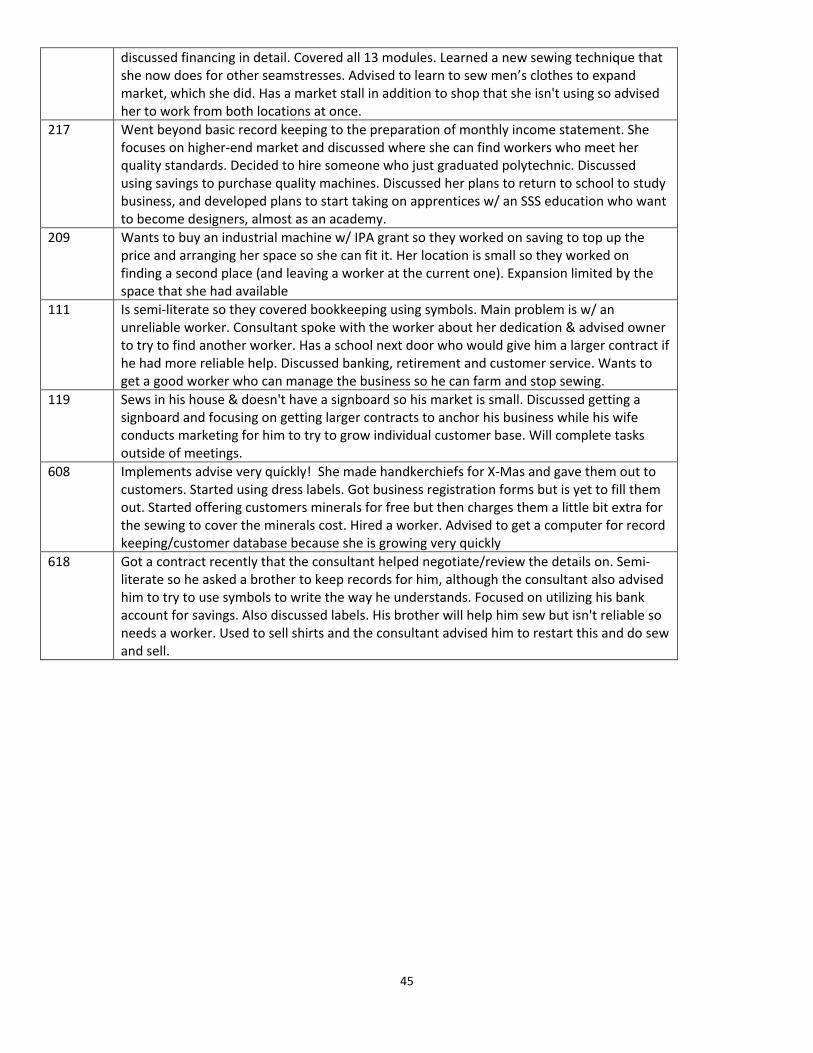
45
discussed financing in detail. Covered all 13 modules. Learned a new sewing technique that she now does for other seamstresses. Advised to learn to sew men’s clothes to expand market, which she did. Has a market stall in addition to shop that she isn't using so advised her to work from both locations at once.
217 Went beyond basic record keeping to the preparation of monthly income statement. She focuses on higher‐end market and discussed where she can find workers who meet her quality standards. Decided to hire someone who just graduated polytechnic. Discussed using savings to purchase quality machines. Discussed her plans to return to school to study business, and developed plans to start taking on apprentices w/ an SSS education who want to become designers, almost as an academy.
209 Wants to buy an industrial machine w/ IPA grant so they worked on saving to top up the price and arranging her space so she can fit it. Her location is small so they worked on finding a second place (and leaving a worker at the current one). Expansion limited by the space that she had available
111 Is semi‐literate so they covered bookkeeping using symbols. Main problem is w/ an unreliable worker. Consultant spoke with the worker about her dedication & advised owner to try to find another worker. Has a school next door who would give him a larger contract if he had more reliable help. Discussed banking, retirement and customer service. Wants to get a good worker who can manage the business so he can farm and stop sewing.
119 Sews in his house & doesn't have a signboard so his market is small. Discussed getting a signboard and focusing on getting larger contracts to anchor his business while his wife conducts marketing for him to try to grow individual customer base. Will complete tasks outside of meetings.
608 Implements advise very quickly! She made handkerchiefs for X‐Mas and gave them out to customers. Started using dress labels. Got business registration forms but is yet to fill them out. Started offering customers minerals for free but then charges them a little bit extra for the sewing to cover the minerals cost. Hired a worker. Advised to get a computer for record keeping/customer database because she is growing very quickly
618 Got a contract recently that the consultant helped negotiate/review the details on. Semi‐literate so he asked a brother to keep records for him, although the consultant also advised him to try to use symbols to write the way he understands. Focused on utilizing his bank account for savings. Also discussed labels. His brother will help him sew but isn't reliable so needs a worker. Used to sell shirts and the consultant advised him to restart this and do sew and sell.

46
XIV. AppendixE:ExamplesofTailors
A tailor who shares his small wooden shop with another tailor
A tailor operating out of a crowded market stall, with several apprentices.

47
A tailor working out of a kiosk.
A tailor who owns rents space in a concrete building.

48
A tailor who shares a kiosk.
A seamstress who owns a converted shipping container

49
A tailor in his wooden shop.