Embed Size (px)
Citation preview

Hooked on Smartphones: An Exploratory Study onSmartphone Overuse among College Students
Uichin Lee, Joonwon Lee, Minsam Ko, Changhun Lee†, Yuhwan Kim§, Subin YangKoji Yatani‡, Gahgene Gweon, Kyong-Mee Chung♯, Junehwa Song§
Knowledge Service Engineering Department, KAIST, †Web Science and Technology Division, KAIST‡Microsoft Research Asia, §Computer Science Department, KAIST
♯Department of Psychology, Yeonsei University{uclee, joonwonlee, msko, changhun, yuhwan, subin.yang, ggweon, junesong}@kaist.ac.kr
‡[email protected] ♯[email protected]
ABSTRACT
The negative aspects of smartphone overuse on young adults,such as sleep deprivation and attention deficits, are beingincreasingly recognized recently. This emerging issue mo-tivated us to analyze the usage patterns related to smartphoneoveruse. We investigate smartphone usage for 95 college stu-dents using surveys, logged data, and interviews. We firstdivide the participants into risk and non-risk groups based onself-reported rating scale for smartphone overuse. We thenanalyze the usage data to identify between-group usage dif-ferences, which ranged from the overall usage patterns to app-specific usage patterns. Compared with the non-risk group,our results show that the risk group has longer usage time perday and different diurnal usage patterns. Also, the risk groupusers are more susceptible to push notifications, and tend toconsume more online content. We characterize the overallrelationship between usage features and smartphone overuseusing analytic modeling and provide detailed illustrations ofproblematic usage behaviors based on interview data.
Author Keywords
Smartphone Overuse; Measurement
ACM Classification Keywords
H.5.m. Information Interfaces and Presentation (e.g. HCI):Miscellaneous
INTRODUCTION
The popularity of smartphones has been increasing rapidlyin recent years. In most of developed countries, the rateof smartphone adoption exceeded 50% in the first half of2012 [2]. Thus, smartphones have now become an integralpart of the daily lives of many individuals. However, negative
Permission to make digital or hard copies of all or part of this work for personal orclassroom use is granted without fee provided that copies are not made or distributedfor profit or commercial advantage and that copies bear this notice and the full citationon the first page. Copyrights for components of this work owned by others than theauthor(s) must be honored. Abstracting with credit is permitted. To copy otherwise, orrepublish, to post on servers or to redistribute to lists, requires prior specific permissionand/or a fee. Request permissions from [email protected] 2014, April 26–May 1, 2014, Toronto, Ontario, Canada.Copyright is held by the owner/author(s). Publication rights licensed to ACM.ACM 978-1-4503-2473-1/14/04 ...$15.00.http://dx.doi.org/10.1145/2556288.2557366
aspects of their use have emerged, such as the disruption ofsocial interactions. In addition, researchers have found closerelationship between their overuse and poor mental health(e.g., sleep deprivation and attention deficits) [24]. Interac-tive characteristics of smartphones contain inducing and rein-forcing features that promote excessive usage behaviors [17,10]. For example, Oulasvirta et al. [25] have demonstratedthat frequently checking dynamic content (e.g., updates fromonline social networks) on mobile devices weakens self-regulation, which may lead to smartphone overuse [17, 10].
Researchers have tried to identify the problematic usage pat-terns that are related with smartphone overuse [5, 16], mainlythrough self-reported scale which are subjective and proneto recall errors [27]. Thus far, relatively little informationis known about how smartphone overuse is reflected in theactual use of smartphones. In this paper, we investigate thecollege students as a focusing lens on emerging technologicalissues. Smartphones are used widely by college students. Inthe first half of 2012, the smartphone adoption rates in the UKand South Korea were 72% and 86%, respectively [2]. More-over, college students are considered to be vulnerable to tech-nology overuse because of their developmental dynamics andrelative independence from social roles and expectations [14].
We collected actual smartphone usage data from 95 collegestudents (over 50,000 hours of usage data) and performed anexploratory data analysis along with the smartphone addic-tion psychometric scale [15]. Our smartphone usage loggerallowed for unobtrusive monitoring that has minimal impactson user behavior [27]. Participants were divided into twogroups based on rating score: a risk group (whose scoresindicated a potential for smartphone overuse) and a non-risk group. We examined the differences in the usage pat-terns of the two groups by comparing various usage features,which were extracted from the dataset (e.g., overall usageand content-specific usage). These usage differences werevalidated by analytic modeling, and also corroborated by thefindings from our interviews.
We identified several usage patterns that were closely relatedto smartphone overuse. The risk group spent more time onsmartphone use per day (risk group: 253.0 min vs. non-risk group: 207.0 min) compared with the non-risk group,

and there were also diurnal usage differences (greater usagein the morning and evening). The usage sessions that wereinitiated by the push notifications were longer for the riskgroup, which demonstrated that notifications acted as externalcues related to problematic usage patterns. The risk groupconsumed significantly more online content that can provideinstant gratifications (e.g., pastimes, entertainment, and infor-mation seeking).
These findings were supported by the results of our analyticmodeling and the analysis of our interview data. Regres-sion analysis showed that the key components of smartphoneoveruse, such as interference, withdrawal, and tolerance,were closely related to usage features. In addition, we usedmachine learning techniques to test the predictive power ofthe usage features and found that smartphone overuse couldbe classified accurately based on these features with an F-score of 0.87. The interview results provided more detailedexamples of problematic usage behavior, such as limited self-control when consuming online content (e.g., aimlessly fol-lowing web/Facebook links while in bed). Our key findingssupport the existing theories related to technological addic-tions [11, 17, 10]. In particular, repeated consumption of on-line content may lead to addictive behaviors, and problematicbehaviors depend mainly on specific functions rather than thevolume of usage.
BACKGROUND AND RELATED WORK
Technological Addiction and Smartphone Overuse
Technological addictions are defined as behavioral (non-chemical) addictions, where interactive components of com-puter devices can have inducing and reinforcing featuresthat may promote addictive tendencies (e.g., tolerance, with-drawal, interference, and relapse) [11]. Despite recent clinicaland scientific evidence, however, there is a lack of agreementon the existence of technological addictions. According toMorahan-Martin’s report [22], some researchers argue thatthe pathological use of technology services is driven by at-tempts to avoid the underlying mental or social problems.Others contend that technology is merely a medium for ser-vice delivery, and that obsessive use is related to specific ser-vices such as gambling and games. These arguments are de-batable, but an awareness of technological addictions is grow-ing in scientific communities. The Diagnostic and StatisticalManual of Mental Disorders, Fifth Edition (DSM-5), whichwas released in May 2013 by the American Psychiatric Asso-ciation (APA), officially recognized behavioral addictions forthe first time and recommended further research into existingtechnological addictions for later inclusion [1].
Prior studies have identified contributing factors that makedigital media, such as the Internet and cell phones, attractiveand often addictive [11, 17, 10]. Digital media provide easyand convenient ways of accessing a large amount of onlinecontent (e.g., music, news, and games) and maintaining socialrelationships. Such access gives instant gratifications to users(e.g., interpersonal utility, pastimes, information seeking, andentertainment), in turn reinforcing continuous usage of it [17,10]. This concept is known as operant conditioning, whichis one of the fundamental learning theories in behavioralpsychology [21]. Excessive usage may follow subsequently,
possibly due to deficient self-regulation or maladaptive think-ing [11, 18, 17, 10].
Previous studies of Internet addiction showed that excessiveuse of online communication and games occurs often, whichis related to various psychological factors, including socialanxiety, depression, impulsivity, self-esteem/identity deficits,and situational stress during life changing events [23, 28, 19].Similarly, excessive usage has also been studied in the contextof mobile phone use [5, 13]. Carbonell et al. [5] reportedthat the excessive use of mobile phones by teenagers is at-tributable to text-messaging and mobile games. Hwang etal. [13] showed that it is also related with various psycho-logical factors such as social anxiety, depression, and impul-sivity. In contrast to previous studies [5, 13], we perform anexploratory data analysis of real usage datasets to uncover theusage features related to smartphone overuse, and validate thedifferences between usage patterns using analytic modelingand analysis of interview data.
Smartphone Usage Studies
Cui and Roto [6] found that the main use of smartphoneswas task-oriented with goals of information seeking, com-munications, online transactions, and managing personal in-formation. In an observational study of smartphone usage onthe Stanford campus, Ames [3] showed that the availabilityof always-on connectivity meant that the students had to ex-hibit the techno-social practices of balancing their extendednetworks with the immediate surroundings and to limit thenegative impacts of smartphone usage (e.g., social pressure,and multi-tasking). Harmon and Mazmanian [12] identifiedtwo themes of smartphone use that are reflected in commer-cials, where one theme recommends the deep integration ofsmartphones in daily life, and the other urges people towarddisintegration. Oulasvirta et al. [25] reported that the use ofmobile devices may lead to the development of a checkinghabit that involves brief and frequent content consumption(e.g., checking emails and Facebook updates).
A few studies have characterized how users access their mo-bile devices during their everyday lives. For example, Falakiet al. [8] studied the usage patterns of Android and WindowsMobile phones by analyzing user interactions, app use, net-work traffic, and energy consumption. Despite the differencesin the objectives and frequencies of smartphone use, theyfound that there were similarities in the fine-grained usagepatterns of users (e.g., the session time distribution). Bohmeret al. [4] analyzed a large-scale, global dataset primarily fromthe US and Europe. They found that users typically spentalmost one hour per day on smartphones, and that the aver-age session duration was less than one minute. Their studyalso indicated the different time dependencies for app usage.For example, news apps were accessed most frequently inthe morning, whereas communication apps (email and SMS)were used throughout the day. Although earlier studies [8,4] provided general overviews of smartphone usage, theydid not investigate the usage patterns related to smartphoneoveruse. By contrast, our study examines the similarities anddifferences between the smartphone usage among users withoveruse risks and those without.

HCI Research into Addictive Behavior
Addiction-related studies have been increasing recently in theHCI community. A major goal of these studies is to explorethe main factors to develop effective addiction interventionmechanisms. Seay and Kraut [26] showed that self-regulationis critical for controlling online gaming behaviors, and theyconsidered how it can be incorporated into the game designsto prevent addictive behaviors. Another direction is to designnew computing services or to simply use existing servicesto mitigate problematic use and assist traditional treatments.Wang et al. [29] built a smartphone-based system for trackingsobriety after patients left a rehabilitation center and for com-municating relevant information to fellow patients and coun-selors. Yarosh [30] performed an observational study on therole of technology in alcoholism recovery. Our study attemptsto identify the usage patterns related to smartphone overuseand to provide several guidelines to facilitate the design ofintervention software.
METHODOLOGY
Participants
We investigated the smartphone usage behaviors of under-graduate students at a large university in Korea during the fallsemester of 2012. We selected this homogeneous user popu-lation to help improve the internal validity of this study. Thisis a common practice in psychological studies [5, 28]. Se-lecting college students as the study groups is also beneficialbecause the smartphone adoption rate among young adults isvery high [2]. In addition, they are vulnerable to technologyoveruse due to their developmental dynamics (e.g., identityformation) and relative independence from social roles andexpectations [14]. We recruited students in 2012 during thetime period between the mid-term and final exams in orderto avoid the influence of exams affecting our study. Ninety-five students participated in the experiment for at least twoweeks. The average age of the participants was 20.6 years(SD 1.7); and 67 (i.e., 70.5%) were male. Data were collectedfor an average of 26.8 days (SD 9.5). All of the participantswere compensated for their participation with a gift that wasequivalent to $20.
Smartphone Usage Logging
We developed the SmartLogger software to log a variety ofapplication events (active/inactive apps, touch and text inputevents, web browsing URLs, and notification events), systemevents (power on/off and screen on/off/unlock), and phoneevents (calls and SMS). SmartLogger operates as an Androidaccessibility service. After an accessibility service has beenenabled in the system settings, it runs automatically in thebackground.
Our approach can be considered as an unobtrusive method be-cause the participants were generally unaware that they werebeing observed, which meant that their usage behavior wasnot affected by the data collection process [27]. We examinedwhether there were any significant differences in the daily us-age levels during the experimental period (excluding the dataobtained on the day of installation). We found that there werestatistically significant differences only in the first two dayscompared with the remainder of the first week, and there were
F1
“My school grades (or work productivity) dropped due to excessivesmartphone use.”“People often complained about excessive smartphone use.”
F2
“Using a smartphone is more enjoyable than spending time withmy family or friends.”“When I cannot use my smartphone, I feel like I have lost the entireworld.”
F3“It would be distressing if I am not allowed to use my smartphone.”“I become restless and nervous when smartphone use is impeded.”
F4“Even when I think I should stop, I continue to use my smartphone.”“Spending a lot of time on my smartphone has become a habit.”
Table 1. Illustration of Smartphone Addiction Proneness Scale (its sub-factors include F1: Interference, F2: Virtual World, F3: Withdrawal,and F4: Tolerance)
no significant changes subsequently. Therefore, we excludedthe data recorded during the first two days of participationfrom the subsequent analysis.
User Surveys and Interviews
Before initiating the data collection process, we administeredsurveys to acquire demographic data and measure the levelof smartphone overuse. We used the Smartphone AddictionProneness Scale for Adults [15], which is an established scalefor smartphone overuse. The scale comprises 15 four-pointLikert-scale questions (see the examples in Table 1), whichmeasure four factors associated with addictive behaviors (in-terference, virtual world, withdrawal, and tolerance). Thescale was designed to classify users into three groups (i.e.,high-risk, at-risk, and normal user groups) [15]. In our study,we divided the participants into two groups: i.e., high/at-risk(total score ≥ 40 or F1: interference score ≥ 14) and non-risk (the remaining participants). This decision was based onthe fact that the sample size would have been too small forsubsequent analyses otherwise (< 3% as the threshold usedto separate the high-risk group was set at 2 SD above themean in the scale). Figure 1 shows the distribution of theparticipants based on the F1 (interference) score and the totalscore. The risk and non-risk groups comprised 36 and 59participants, respectively.
1 1
4
1
1
2
7
1
4
15
2
1
2
4
14
5
10
9
1
3
2
1
2
1
1
10
15
20
25
30
35
40
45
50
55
60
0 2 4 6 8 10 12 14 16 18 20
Factor 1 score (interference)
To
tal sco
re
Figure 1. Score distribution of the experimental participants (high/at-risk groups: factor 1 score ≥ 14 or total score ≥ 40, non-risk group:remaining participants)
After the data collection process, we performed additionalsurveys and interviews to supplement the results from ourquantitative data analysis and to characterize problematic us-age behaviors. In the exit-surveys, we explored the usageof mobile instant messaging and its negative impacts. Inaddition, we selected seven participants (four risk and threenon-risk) to participate in semi-structured interviews, where

our selection criterion required that their average smartphoneusage per day exceed four hours. We aimed to enhance ourunderstanding of the usage characteristics determined in thequantitative analysis and to identify more detailed themes re-lated to problematic usage behaviors. All of the interviewswere transcribed and open coding was performed to facilitatecontent analysis.
Data Analysis Model
Active smartphone usage can be represented based on a seriesof sessions, as shown in Figure 2. A session was defined asthe time between turning on and off events of the screen.
Usage Sessions Sessioni-1 timeSessioni+1
ScreenOn ScreenOffUnlock
app1 app2launcher �
App sequence
Notifications
unlocked period
Inter-notification time
Inter-session
time
locked period
app1 app1 Session
time
Sessioni
Figure 2. Usage data analysis model
During a typical session, a participant first unlocked thephone and then operated a series of apps; we excludedlauncher usage in between apps. Several types of events,such as notifications and battery charging, could switch onthe screen automatically. In our analysis, we filtered out theevents that did not elicit further user interactions (i.e., screenunlocking). Users may have apps that provided notificationmessages (e.g., for new chats and emails). In Android, anicon appears in the notification area, and users can open thenotification drawer to check the details and interact with theirapps. For app-specific usage analysis, we designed simplifiedcategories based on existing app categories from app storesand a previous study [4].
OVERALL DIFFERENCES IN USAGE PATTERNS
We analyzed the aggregated usage, session-level usage, andtemporal usage patterns to identify differences in the specificusage levels of the risk and non-risk groups. The overall us-age results are presented in Figure 3 and Figure 4.
Aggregated Usage: For a given day, the daily usage time wasdefined as the sum of all the session times. We calculatedthe mean daily usage time for each participant. There was asignificant difference in the daily usage time, where the riskgroup (253.0 min, SD: 90.9, p = .011, Cohen’s d = 0.54) hada longer average smartphone usage period than the non-riskgroup (207.4 min, SD: 77.2). We also measured how oftenthe participants interacted with their smartphones by calculat-ing the mean session frequency per day and the mean inter-session duration (i.e., the interval between two consecutivesessions), but there were no significant differences. The riskgroup had a slightly higher mean session frequency (risk:111.5 vs. non-risk: 100.1, p = .146, Cohen’s d = 0.31) anda shorter mean inter-session time (risk: 729.1 s vs. 816.6s, p = .216, Cohen’s d = 0.26), but the differences were notsignificant.
Session-level Usage: We also investigated whether the usagepatterns within a session differed between the groups. We
0
120
240
360
480
Overall Comm. Web SNS Game Media Launcher Misc.
Ave
rag
e u
sa
ge
tim
e (
min
)
Group
allnon−riskrisk
Figure 3. Usage amount: overall and app-specific results
0
100
200
Overall Comm. Web SNS Game Media Launcher Misc.
Ave
rag
e u
sa
ge
fre
qu
en
cy
Group
allnon−riskrisk
Figure 4. Usage frequency: overall and app-specific results
inspected the number of apps used during each session. Weassumed that a session comprised a sequence of n apps used,{a1, a2, · · · , an} where ak denotes the name of the kth usedapp, and the sequence length was simply given as n. Ourresults indicated that the sequence length was slightly longerfor the risk group, but the difference was not significant (risk:3.53 vs. non-risk: 3.16, p = .072, Cohen’s d = 0.43).
We examined the app usage patterns of the risk group in orderto determine whether the patterns were skewed. We checkedthe number of unique apps used during the experiment, butthere was no significant difference (risk: 66.1 vs. non-risk:65.5, p = .885, Cohen’s d = 0.03). We used the entropy metricto measure the degree of usage for the top-k apps. For a givenuser, the entropy value was calculated based on the usage timedistribution for the top-k apps using −
∑i=1,k p(i) log p(i),
where p(i) is the relative usage time of the ith app. Entropyhas the following property. The lower the entropy, the higherthe level of focus on certain apps. For example, if a persononly uses a single app, the entropy becomes zero. If shespends an equal amount of time on every app, the entropyis maximized.
Given that most participants frequently used a small numberof apps, we examined the number of top-k apps using k = 5,10, and 50, and we then calculated the entropy values. Therewas a significant difference in the top-5 app usage (p = .046,Cohen’s d = 0.42), which showed that the top-5 usage patternsof the risk group were highly skewed. We performed unpairedt-tests (two-tailed) of the usage levels for the k-th ranked appsand found that the risk group spent more time interacting withthe first ranked apps and on the second ranked apps (primarilyKakaoTalk, Facebook, and browsers). The mean usage timesof the first-ranked apps were 97.8 min and 69.9 min (p = .003,
Agg. Usage Non-Risk [95% CI] Risk [95% CI] T P d
Usage time (m) 207.4 [187.3, 227.5] 253.0 [222.3, 283.8] 2.61 .011 0.54
Usage freq 100.1 [91.5, 108.6] 111.5 [97.2, 125.9] 1.47 .146 0.31
Session Usage Non-Risk [95% CI] Risk [95% CI] T P d
Session time (s) 129.9 [115.6, 144.1] 157.6 [123.6, 191.6] 1.53 .134 0.36
Inter-ses. time (s) 816.6 [726.9, 906.4] 729.1 [623.7, 835.5] 1.25 .216 0.26
# unique apps 65.5 [60.0, 70.1] 66.1 [60.1, 72.1] 0.15 .885 0.03
Sequence len. 3.16 [2.9, 3.3] 3.53 [3.2,3.9] 1.84 .072 0.42
Agg. seq. len 204.2 [181.7, 226.6] 235.2 [204.4, 265.9] 1.66 .099 0.35
Top-5 entropy 1.96 [1.9, 2.0] 1.85 [1.7,1.9] 2.02 .046 0.42
Top-10 entropy 2.53 [2.5, 2.6] 2.40 [2.3, 2.5] 1.74 .085 0.36
#1 app time (m) 69.9 [60.6,79.0] 97.8 [81.5, 114.2] 3.02 .003 0.66
#1 app freq 115.4 [105.1,125.5] 134.7 [119.0,150.6] 2.18 .031 0.46
#2 app time (m) 37.2 [32.5, 42.6] 47.4 [38.4, 56.4] 1.93 .060 0.43
#2 app freq 70.3 [62.4, 78.1] 85.3 [70.2, 100.4] 1.78 .080 0.41
Table 2. Two-sample t-test results of the aggregated usage (two-tailed)
Cohen’s d = 0.66), and the mean usage times for the second-ranked apps were 47.4 min and 37.5 min (p = .058, Cohen’sd = 0.43), for the risk and non-risk groups, respectively.
Diurnal Usage: We hypothesized that the risk group wouldhave different diurnal patterns compared with the non-riskgroup because they used smartphones for longer periods oftime. We divided each day into four blocks; i.e., night: [0,6), morning: [6, 12), afternoon: [12, 18), and evening [18,24). We performed unpaired t-tests (one-tailed) of the usagelevels with Bonferroni correction. Figure 5 shows that therisk group used their smartphones for significantly more timein the morning (p = .022, Cohen’s d = 0.53) and evening (p= .038, Cohen’s d = 0.49). Comparisons of the mean ses-sion durations across time blocks revealed that our partici-pants had longer usage sessions during the morning and nightblocks; e.g., morning vs. afternoon (p = .004, Cohen’s d =0.43) (detailed information can be found in the Appendix).
●
●
●
●
●
●
●
●
0
20
40
60
80
[0,6)(p=.094/d=0.41)
[6,12)(p=.022/d=0.53)
[12,18)(p=.195/d=0.35)
[18,24)(p=.038/d=0.49)
Time of day (p−value/Cohen's d)
Ave
rag
e u
sa
ge
am
ou
nt
(m)
risk non−risk
●
●
●
●
●
●
●
●
0
10
20
30
40
[0,6)(p=.287/d=0.33)
[6,12)(p=.049/d=0.47)
[12,18)(p=.727/d=0.19)
[18,24)(p=.592/d=0.24)
Time of day (p−value/Cohen's d)
Ave
rag
e u
sa
ge
fre
qu
en
cy
risk non−risk
Figure 5. Overall diurnal usage time and frequency (mean value with95% confidence interval, p-value/Cohen’s d)
Summary of Findings: Our results showed that the riskgroup used their smartphones for more time than the non-risk group (risk: 253.0 min vs. non-risk: 207.0 min). Therisk group users tended to use smartphones more frequentlyand to engage in longer usage sessions. Their app usagewas highly skewed toward a small number of frequently usedapps. In particular, significant differences were found in theusage amount/frequency of the first ranked apps. In addi-tion, diurnal usage differences were observed, where the riskgroup used their smartphones for more time during the morn-ing/evening than the non-risk group. Despite these usage dif-ferences, there was no significant difference in the number ofunique apps used (risk: 66.1 vs. non-risk: 65.5).
Comm. Usage Non-Risk [95% CI] Risk [95% CI] T P d
Usage time (m) 87.1 [75.8, 98.3] 98.8 [80.0, 118.6] 1.15 .257 0.24
Usage freq 112.5 [100.7, 124.2] 126.3 [107.4, 145.2] 1.32 .189 0.28
Voice time (m) 12.0 [ 9.4, 14.6] 14.5 [8.9, 20.0] 0.83 .411 0.20
Voice freq 6.2 [5.4, 7.0] 5.8 [4.6, 7.0] 0.51 .610 0.11
SMS time (m) 2.7 [2.1, 3.3] 4.4 [2.4, 6.4] 1.64 .108 0.41
SMS freq 6.9 [5.8, 8.0] 9.5 [6.7, 12.2] 1.75 .086 0.42
MIM time (m) 65.8 [56.1, 75.6] 75.6 [58.8, 92.3] 1.08 .281 0.23
MIM freq 76.9 [66.6, 87.2] 91.2 [73.9, 108.5] 1.53 .130 0.32
Inter-MIM time (m) 25.6 [19.8, 31.4] 21.0 [16.2, 25.8] 1.21 .228 0.23
Inter-MIM noti (m) 9.5 [4.9, 14.0] 6.9 [3.8, 10.0] 0.94 .351 0.17
MIM noti freq 378.5 [227.1, 529.8] 451.8 [449.1, 454.7] 0.64 .353 0.16
Web Usage Non-Risk [95% CI] Risk [95% CI] T P d
Usage time (m) 41.1 [33.6, 48.6] 67.1 [48.4, 85.9] 2.60 .012 0.61
Usage freq 22.3 [18.7, 26.0] 38.5 [25.7, 51.3] 2.47 .018 0.61
Inter-web time (m) 81.0 [68.4, 93.5] 71.4 [53.3, 89.4] 0.90 .370 0.19
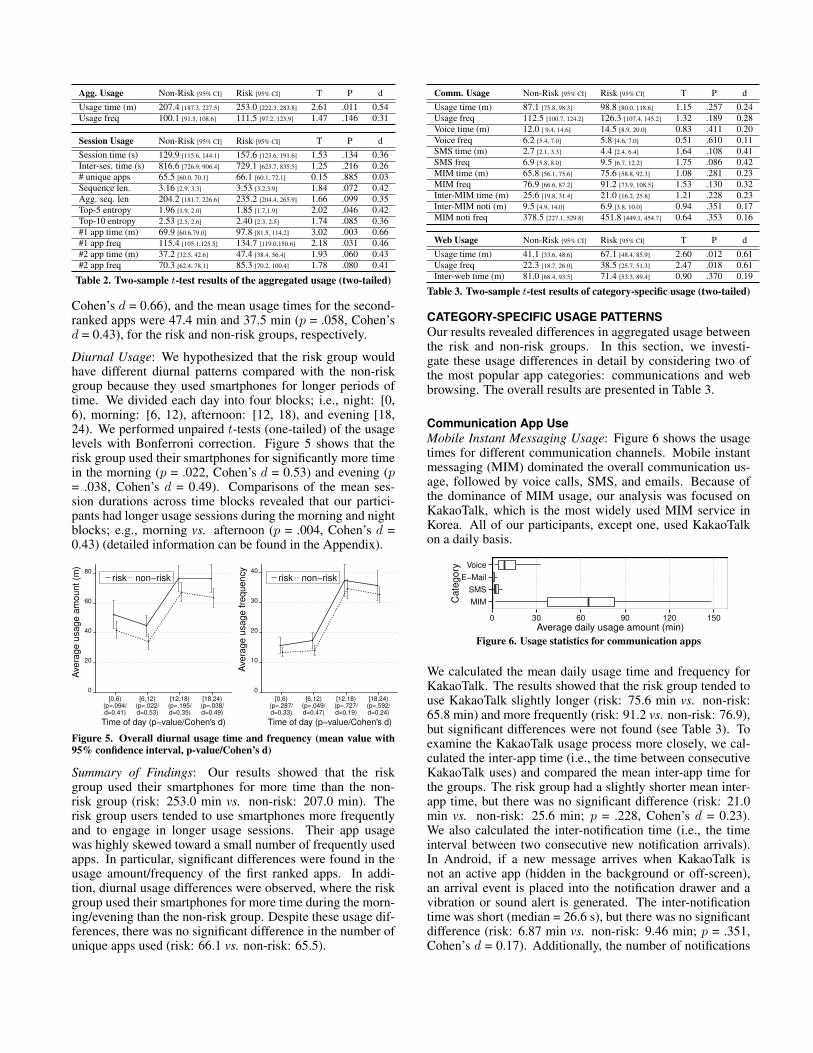
Table 3. Two-sample t-test results of category-specific usage (two-tailed)
CATEGORY-SPECIFIC USAGE PATTERNS
Our results revealed differences in aggregated usage betweenthe risk and non-risk groups. In this section, we investi-gate these usage differences in detail by considering two ofthe most popular app categories: communications and webbrowsing. The overall results are presented in Table 3.
Communication App Use
Mobile Instant Messaging Usage: Figure 6 shows the usagetimes for different communication channels. Mobile instantmessaging (MIM) dominated the overall communication us-age, followed by voice calls, SMS, and emails. Because ofthe dominance of MIM usage, our analysis was focused onKakaoTalk, which is the most widely used MIM service inKorea. All of our participants, except one, used KakaoTalkon a daily basis.
MIM
SMS
E−Mail
Voice
0 30 60 90 120 150
Average daily usage amount (min)
Ca
teg
ory
Figure 6. Usage statistics for communication apps
We calculated the mean daily usage time and frequency forKakaoTalk. The results showed that the risk group tended touse KakaoTalk slightly longer (risk: 75.6 min vs. non-risk:65.8 min) and more frequently (risk: 91.2 vs. non-risk: 76.9),but significant differences were not found (see Table 3). Toexamine the KakaoTalk usage process more closely, we cal-culated the inter-app time (i.e., the time between consecutiveKakaoTalk uses) and compared the mean inter-app time forthe groups. The risk group had a slightly shorter mean inter-app time, but there was no significant difference (risk: 21.0min vs. non-risk: 25.6 min; p = .228, Cohen’s d = 0.23).We also calculated the inter-notification time (i.e., the timeinterval between two consecutive new notification arrivals).In Android, if a new message arrives when KakaoTalk isnot an active app (hidden in the background or off-screen),an arrival event is placed into the notification drawer and avibration or sound alert is generated. The inter-notificationtime was short (median = 26.6 s), but there was no significantdifference (risk: 6.87 min vs. non-risk: 9.46 min; p = .351,Cohen’s d = 0.17). Additionally, the number of notifications

Externally Cued Internally CuedTotal
Kakao FB Email Voice Total Kakao FB Email Voice Total
Total num. ses-sions per day
Risk 38.9 5.4 0.5 6.0 76.7 *11.2 2.9 0.1 0.7 25.1 101.3
Non-Risk 32.0 4.7 0.5 5.1 68.5 *7.2 1.7 0.1 1.2 18.8 89.0
Total app seq.length per day
Risk *88.7 16.6 1.8 11.5 *199.6 14.9 4.5 0.1 1.3 36.2 235.2
Non-Risk *63.9 13.3 1.5 10.2 *164.6 11.2 2.6 0.2 2.4 31.6 204.2
Total session du-ration per day (s)
Risk *4978.9 1084.7 112.0 305.8 *11910.7 540.5 272.0 1.4 14.3 1585.8 *13525.8
Non-Risk *3661.5 1010.0 112.3 251.8 *9645.8 385.4 134.2 10.2 36.6 1179.4 *11006.8
Per session dura-tion (s)
Risk 170.1 233.9 209.6 58.8 390.4 55.3 69.5 3.0 31.0 64.3 335.5
Non-Risk 164.6 263.2 170.8 57.6 348.4 64.7 70.1 30.7 24.9 70.6 314.2
App seq. lengthper session
Risk 2.6 3.2 2.9 2.1 1.4 1.4 0.2 2.0
Non-Risk 2.6 3.1 3.8 2.6 1.8 1.3 0.9 2.3
Table 4. Usage differences in external and internal sessions (* p < .05)
per day was quite high, but the difference was not significant(risk: 451.8 vs. non-risk: 378.5; p = .353, Cohen’s d = 0.16).
Notifications as External Cues for Usage: Smartphone usagecan be triggered by external cues (e.g., incoming calls andmessages), or internal cues (e.g., outbound calls/messagesand web searches). In studies of technological addictions,external cues are regarded as a potential trigger of problem-atic usage behavior [18, 17, 10]. Given that our participantsreceived a large number of notification alerts (more than 400notifications; 90% of them from KakaoTalk), we investigatedwhether there were any usage differences among the exter-nally cued sessions. We defined a session as externally-cued(or simply an external session) if any notifications from theapps that were used in the session have arrived during thetime interval between that session and the preceding session(see Figure 7). Otherwise, sessions were treated as internalsessions.
timeapp1 app2
Notification (app1)
�app2
Inter-sessioni Sessioni
�
Sessioni-1
Figure 7. Illustration of an external session
Our data showed that the majority of sessions were external(79%). We further divided the external sessions based on thefirst app that was used in the respective session. For example,if an external session began with KakaoTalk, we referred toit as a KakaoTalk cued session. We considered KakaoTalk,Facebook, Email, and Voice Call as the first apps in externalsessions because most notifications came from these apps.
For the external sessions, we found significant differences inthe mean usage time per day (p = .037, Cohen’s d = 0.44) andin the aggregated sequence length of the usage sessions perday (p = .033, Cohen’s d = 0.45) (see Table 4). However, thenumber of sessions did not differ significantly (p = .192, Co-hen’s d = 0.28). We found no significant differences in thesefeatures of internal sessions. We examined the external ses-sions based on the first app (i.e., into KakaoTalk, Facebook,and Voice call cued sessions), and found significant usagedifferences only for KakaoTalk cued sessions with respect tothe mean usage time per day (p = .030, Cohen’s d = 0.50) andthe aggregated sequence length of usage sessions per day (p= .029, Cohen’s d = 0.50).
Summary of Findings: Our participants mainly used MIMsfor mobile communications, and the usage was over 60 min-
utes per day. Each participant typically received more than400 notifications per day on average and 90% of these noti-fications were from MIMs. There were no significant differ-ences in the overall MIM usage, but MIM use tended to belonger (with the effect size of > 0.2) for the risk group andmore frequent than the non-risk group, which was also sup-ported by our diurnal usage analysis results (see Appendix).After dividing smartphone usage into internally-cued andexternally-cued sessions, we found that 79% of the usage wasexternal usage (e.g., MIM and Facebook). We found thatthe usage time of MIM-initiated sessions was significantlygreater for the risk group compared with the non-risk group.This result confirms that MIM notifications act as externalcues for smartphone usage and they can be considered to bea cause of problematic smartphone usage.
Web Browsing App Use
Usage Pattern Analysis: There were significant differences inthe usage of web browsing apps between the groups (see Ta-ble 3). The daily usage times for the risk and non-risk groupswere 67.14 min (SD: 55.25) and 41.14 min (SD: 28.87), re-spectively. Similarly, the daily usage frequencies for the riskand non-risk groups were 38.50 (SD: 37.77) and 22.30 (SD:13.96), respectively. In addition, we compared the inter-apptimes of web browsers for the two groups. The risk groupshowed a shorter mean inter-app time: risk: 71.4 min (SD:53.3) vs. non-risk: 80.9 min, (SD: 48.2), but the differencewas not significant.
Content Consumption Pattern Analysis: We also comparedthe content consumption patterns of the risk and non-riskgroups. We only considered the participants who used thedefault web browser, which allowed us to record their URLhistories. As a result, there were 24 participants from thenon-risk group, and 18 from the risk group. For each par-ticipant, we extracted the top ten frequently visited web sitesand calculated their average usage frequencies per day. Weaggregated these statistics within each group, and the re-sults are presented in Table 5. We classified each domainname manually using the following categories: online com-munities, web portals (e.g., Naver and Yahoo!), news, websearches, entertainment (e.g., webtoons and movies), schoolweb sites, and miscellaneous sites. Unequal-variance t-tests(one-tailed) showed significant differences in web portal us-age (p = .049, Cohen’s d = 0.60) and web search usage (p =.013, Cohen’s d = 0.75). Web portals, such as Naver, Daumand Nate, are the top three web portals in Korea as a whole.

Community Portal News Search Entertainment School Misc. Total
Risk (SD) 43.7(101.7) 8.9 (14.8) 19.0 (59.2) 9.6 (9.2) 0.6 (0.8) 2.4 (3.8) 14.3 (11.3) 99.5 (130.6)95% CI [9.3, 78.1] [3.9, 13.9] [1.0, 39.1] [6.5, 12.7] [0.3, 0.8] [1.1, 3.7] [10.5, 18.1] [55.3, 143.7]
Non-Risk (SD) 7.5 (13.2) 2.7 (3.1) 1.0 (1.4) 4.0 (5.3) 1.6 (3.6) 1.5 (2.1) 7.6 (11.6) 24.8(28.6)95% CI [4.0, 10.9] [1.9, 3.5] [0.6, 1.3] [2.6, 5.3] [0.4, 2.8] [1.0, 2.1] [4.6, 10.6] [17.3, 32.2]
P (d) .076 (0.53) .049 (0.60) .107 (0.46) .013 (0.75) .125 (0.42) .189 (0.30) .034 (0.57) .014 (0.79)
Table 5. Distribution of the visit frequency on each category by the risk and non-risk groups
These web portals have similar content and functionalities,such as web search, news, trending issues, and links to otherportal services. The risk group tended to check the portalpages for information updates more often (8.9 vs. 2.7 vis-its per day on average), and to search for information needsmore frequently (9.6 vs. 3.9 visits per day on average) com-pared with the non-risk group. Detailed usage analysis of theNaver search queries showed that the risk group participantssearched for trending issues (i.e., top search keywords) moreoften than the non-risk group participants.
We found that five participants who visited these sites to anexcessive degree all belonged to the risk group. Three of thesevisited specific community sites 414.0, 166.3, and 96.7 timesper day on average, respectively. Two other participants in therisk group visited news pages an average of 250.8 and 55.8times per day, respectively. The most popular online commu-nities among our participants included Todayhumor (sharingjokes, as on 9gag), Ruliweb (sharing game and animationinformation), and Ppomppu (shopping and discount informa-tion). These sites were visited primarily for the purpose ofsharing user-generated content. We uncovered a unique usagepattern based on a detailed analysis of the URLs visited byour participants. Community web sites typically have a num-ber of topical boards, and the participants would visit eachseparate board to check for new posts. Existing sites displaynew posts on a daily basis, but heavy web users checked thesesites very frequently throughout the day, thereby exhibitingthis pattern of checking for new information.
Summary of Findings: Compared with the non-risk group,our results showed that the risk group browsed the web moreoften and they tended to search for content updates more fre-quently (e.g., visiting web portals, and checking trending is-sues). Moreover, a few of the risk group participants searchedfor and consumed online content in an excessive manner andthey exhibited unique surfing patterns while searching for thiscontent.
ANALYTIC MODELING OF USAGE BEHAVIOR
Our results revealed quantitative differences in the usage pat-terns of the risk and non-risk groups. However, these resultsdid not indicate how the usage features were associated withthe key factors of smartphone overuse and how the usagefeatures can be used to predict the potential for smartphoneoveruse. Thus, we perform analytic modeling of the usagebehavior using multiple regression and machine learning.
Regression Analysis
The key factors (or symptoms) in the Smartphone AddictionProneness Scale include interferences with work/personalactivities (interference), virtual world orientation (virtual),emotional alterations such as anxiety and irritation if smart-phone use is impeded (withdrawal), and habituated usage
Total Inter. Virtu. Withd. Toler.
Model Summary
Adjusted R2 .12∗∗ .14∗∗ .07∗ .07∗ 0.14∗∗
F 6.25 5.05 6.83 6.84 7.76
Standardized β
Usage freq .26∗∗ .26∗∗
Top 1 app time .30∗∗
6-12 usage time .26∗∗
Web usage time .21∗∗ .31∗∗
# ext. sessions .23∗∗
Ext. MIM agg. seq. len. .48∗∗
∗p<0.05, ∗∗p<0.01
Table 6. Regression analysis results
without reducing the level of usage (tolerance) [15]. Be-cause of our limited sample size for regression analysis, weselected a set of representative features that characterizedthe general usage behaviors, including overall usage features(usage time/frequency, top-1 app usage time/frequency, top-5 app entropy, and usage time in 6-12/18-24 blocks) andcategory-specific usage features (MIM usage time/frequency,Web usage time/frequency, MIM/Web usage time in 6-12/18-24 blocks, external MIM session frequency, and aggregatedMIM external session length/time).
Table 6 summarizes the regression results. Overall, the us-age time and frequency were closely related with smartphoneoveruse. Given that the usage of instant messaging was dom-inant, we hypothesized that its usage may play a critical rolein problematic usage behaviors. Incoming MIM messagesacted as external usage cues for smartphone use. The par-ticipants who experienced more interference tended to havelonger session sequence lengths of MIM initiated sessions.Moreover, web usage and external cues were related to thetolerance factor; i.e., consuming online content that providesgratifications causes people to continue to use smartphones.These observations agree with the well-known theories oftechnological addictions [11, 17, 10]. Repeated content con-sumption (message exchanges, and web content) forms a ha-bitual usage pattern, which may lead to addictive behaviors.External cues further reinforce this behavior.
Classification Analysis
We used machine learning algorithms to test the feasibility ofthe risk-group classification. During model training, we con-sidered all of the features explored in the previous sections.For each feature, we considered the following basic statis-tics: mean, median, SD, and soft min/max (mean±2SD). Weused the classification models in Weka v3.6 such as DecisionTree (DT), Naive Bayes (NB), and Support Vector Machine(SVM). We reduced the number of features using the Infor-mation Gain filter and Rank-based search algorithms. To de-termine the importance of the feature categories, we testedthe performance using different category combinations (seeTable 7). The general set contained the general usage fea-tures, such as the usage time/frequency, top-k entropies, and

Feature set Acc. (%) Pre. Rec. F-score Classifier
All 81.05 .816 .811 .813 DT
General 72.63 .723 .726 .724 DT
Category 87.37 .874 .874 .874 DT
Temporal 78.95 .792 .789 .790 DT
ExtCue 64.21 .622 .642 .632 NB
ExcludeGeneral 85.26 .863 .853 .858 DT
ExcludeCategory 80.00 .806 .800 .803 NB
ExcludeTemporal 77.89 .782 .779 .780 DT
ExcludeExtCue 81.05 .816 .811 .813 DT
Table 7. Classification Results
sequence length. The temporal set included the diurnal usagefeatures for aggregated usage and category-specific usage.The category set included the category-level usage features(no temporal aspects). The external set included all of theusage features for the external sessions. The models wereevaluated based on a 10-fold cross validation. The datasetwas divided into 10 roughly equal subsets. One subset wasleft out for validation, and the remaining subsets were usedfor training. The average performance of the classifiers wereestimated by repeating this process for each subset.
Table 7 shows the best accuracy, precision, recall, and F-scorevalues. We obtained the best performance when the categoryset was used with DT (F-score = 0.87). The ranked featuresin the best model included the web usage time (mean, SD,median), SNS usage time (SD), SNS usage frequency (softmax, median), inter-MIM time (median), and inter-browsertime (mean, SD, soft max). By contrast, the performancewas lower when all of the features were employed, where theranked features included four general features, four categoryfeatures, and two diurnal features. In addition, we examinedthe predictive power of each feature set. The performance ofthe general and temporal feature sets did not differ substan-tially, although the external feature set had the poorest perfor-mance. To measure the performance gain for each feature set,we trained the classifiers by excluding each set. As shownin the table, removing the category feature set resulted in asignificant performance drop, which demonstrated its impor-tance for classification. Moreover, the general features hadnegative effects on the overall performance.
In summary, we found that investigating various category-specific usage patterns was of critical importance, and ourclassification model allowed us to accurately classify whethera person belonged to the risk group. The current study fo-cused mainly on communications and web browsing, but ourfeature selection results indicated the importance of other fea-tures. Thus, other categories such as social networking andmobile games may be explored in our future research.
PROBLEMATIC USAGE BEHAVIOR
We perform a content analysis of the interview/survey datato corroborate the earlier findings and to better characterizeproblematic usage behaviors.
Overall Usage Behavior
Our participants used smartphones for various purposes,which ranged from managing personal information and build-ing social relationships, to passing the time and managingmoods. Here, the seven participants who participated in theinterviews are referred to using R (for the risk group) and N
(for the non-risk group) followed by a number. Participantscommented: “In general, I use it to check news and updates.I can easily satisfy all of my curiosities with smartphones.”(N1); “When I have nothing to do like waiting for someone,or if I feel bored during a class, I check Facebook.” (R1). Thetemporal usage patterns were closely related to the typicalschool lifestyle. Students have more free time in the morning(fewer classes), late at night (going to sleep), and over theweekends (no classes). During the day, smartphone usagewas frequent and brief, as explained by N3: “I frequentlycheck my smartphone if there are new messages or alarms.I check it in every 5 to 20 minutes. I don’t use it for a longtime unless I play a game.” In general, our participants con-curred that smartphone usage tended to last longer during thenight, in the morning, or at the weekend (e.g., for relaxing andchecking). For example, N1 stated: “Unless I’m really tired, Ialways check my smartphone before going to bed. When I getup, I check my smartphone. Lots of updates [like Facebook]happen overnight.”
Frequent Interferences
We asked the participants an open-ended question to deter-mine whether instant messaging interfered with their dailylives (in an exit-survey after the data collection process). Thedata showed that 92% experienced interference in varioussituations. One participant complained about a loss of at-tention and stated that: “I sometimes lose track of a lecturedue to KakaoTalk.” Similarly, another participant mentioned,“I have to focus, but I check KakaoTalk in almost every 5minutes.” Sleep patterns were disturbed, and one partici-pant reflected, “I sometimes chat before going to bed, andit makes me to stay up until late. Also, I was woken up bysilly messages from my friends, who asked for game timevia KakaoTalk.” Social activities were also interrupted often.One participant commented, “When I’m dating or hangingout with friends, KakaoTalk messages make me feel nervous.I have had experiences where KakaoTalk disrupted ongoingconversations.” As demonstrated earlier, after receiving ex-ternal cues, the risk group spent more time for using theirsmartphones. External cues disrupted the users’ attention,and they may have experienced greater attention loss as theirsession durations became longer. Thus, the degree of interfer-ences attributable to instant messaging was probably greaterfor the risk group than the non-risk group.
Habitual Usage and Limited Self-Control
The risk group expressed difficulty in regulating their smart-phone use. They felt more compelled to check their smart-phone: “I keep paying attention, because I feel like new mes-sages may have arrived.” (R1). Moreover, the risk groupparticipants were less conscious of their smartphone use: “Idon’t have any thoughts when using my smartphone. ... Atthat moment, [I’m] without any sense of time.” (R1). R2reported an experience of excessive usage: “It’s not like Iplan to use my smartphone, but I just turn on my smartphoneunconsciously. I once used my smartphone to wake myselfup in the morning. I got up at 9AM, but it turned out it wasalready 11AM.” R3 even claimed that smartphone usage isnot problematic at all, by stating: “I’m not a person who is

likely to be addicted to something. I sometimes feel that I usemy smartphone too much, but only very occasionally.”
The content consumption behavior of the risk group was lessstructured than that of the non-risk group, particularly whenonline content was consumed. In general, the risk group par-ticipants had difficulties in explaining the details of their con-tent consumption behavior. R1 mentioned: “I check articlesin online communities in the morning, and I keep checkingwhether there are any updates. ... If one community doesnot have any updates, I visit other communities to check forupdates.” R4 commented about Facebook usage: “For ex-ample if there are no updates in Facebook, I check out anew person or keep following pages to seek for new content.”This behavior sometimes disturbed their sleep patterns. R4acknowledged: “I use my smartphone before going to bed,but in the end spend too much time; about one to two hours.There is always something new because I can dig in deeply.I don’t sleep well because of this. After about two hours, Isometimes fall asleep even though I didn’t think of stopping.”
By contrast, usage behavior was self-regulated in the non-risk group although they were also heavy users: “I use mysmartphone for about 20 minutes before going to bed. I takecare of messages piled up in KakaoTalk, and check Facebook,and webtoon updates at 11:30 PM. After checking that, I’mdone!” (N1). N3 commented: “I feel like Facebook is part ofmy daily task. I use Everytown [a game] when I feel drowsyafter a meal, but not to fall asleep because it makes me feellazy. I use Joara [an online novel app] when I have time topass. I mostly use my smartphone, when I really don’t feellike studying for an exam, when I have done all the work andthere is nothing to do, and when I’m waiting for my friends,and I have some time to wait.”
DISCUSSION AND CONCLUSION
Our exploratory data analysis determined the usage patternsrelated to smartphone overuse. We found that the risk groupspent longer time engaged in smartphone usage than the non-risk group. The number of apps used was similar, but the riskgroup exhibited a highly skewed usage pattern with respectto a few frequently used apps. In addition, there were sig-nificant diurnal usage differences, where the risk group usedsmartphones for longer periods in the morning and evening.Overall, our participants mainly used their smartphones forcommunications. MIM was the most frequently used app,followed by voice calls, SMS, and emails. They receiveda large number of MIM notifications per day (> 400). Wefound that the risk group spent more time on MIM-triggeredsessions. This result serves as evidence that MIM notifica-tions act as external cues that can lead to excessive smart-phone usage. Another major component of smartphone usagewas consuming various types of online content that provideinstant gratifications (e.g., pastimes, entertainment, and in-formation seeking). The risk group users spent more time onthe web consuming these types of online content.
According to our analysis, the overall difference in the us-age times between the risk/non-risk groups was not very high(< 50 minutes). In previous studies of technological addic-tions, however, researchers reported that the excessive and
problematic usage depends mainly on function rather thanthe usage amount [11, 17]. For example, repeated usage formood adjustment purposes (e.g., relieving boredom, stress,or depression) may form habitual usage and lead to addictivebehaviors [11, 17, 10]. Our regression results demonstratedthat smartphone overuse is closely related to the content con-sumption function of smartphones. Our interview resultsalso provided detailed evidence of addictive usage behav-iors. The risk group showed limited self-control, particularlywhen consuming online content (e.g., aimlessly followingweb/Facebook links while in bed). These findings providenew insights into previous research on scale development andproblematic usage behaviors [16, 5, 13].
Understanding smartphone usage patterns has been an ac-tive area of research [8, 4, 25]. Our work supplements pre-vious measurement studies [8, 4, 25] by reporting recentsmartphone usage patterns (e.g., mobile instant messaging)—detailed information can be found in the Appendix—and byinvestigating problematic usage behaviors, which are emerg-ing social issues associated with technology overuse. Weobserved significant changes in usage behaviors comparedwith the usage statistics based on the earlier datasets collectedin 2009 [8] and 2010 [4]. We hypothesize that the muchlonger usage duration (224.7 min vs. 59.2 min [4]) may beattributable to the participant demographics, as well as thenetwork effect of smartphones and MIM. Moreover, our re-search extends the study of Oulasvirta et al. [25] by exam-ining real usage patterns from the perspective of smartphoneoveruse, and we demonstrated the importance of externally-cued usage behavior.
Our study provides new insights into the usage practices re-lated to mobile communications [20, 3, 12]. We studied thelatest trends for MIM use. As we reported, its usage is preva-lent, and it can be indicative of overuse risks (e.g., causingnegative impacts on an individual’s personal and social ac-tivities). Thus, our results help to understand the impactsof semi-synchronous communication channels such as MIM,on the social expectations related to constant connectivity [3]and interruption management practices [20].
The use of computing technology for promoting health andsustainable behaviors has been of great interest to the HCIcommunity [9]. In addition, addiction-related research hasbeen increasing recently [26, 29, 30]. Our study on usageanalysis and automatic behavior assessment may be usefulwhen designing mobile software that can moderate excessiveuse (e.g., visualizing usage information, and utilizing socialsupport), or it could facilitate the design of intelligent parentalcontrols (e.g., addressing a child’s smartphone overuse). Weconsider that designing and evaluating intervention softwaremay be an interesting avenue for future HCI research [7]. Ourresearch may provide a foundation for such research.
Similar to any cross-sectional and single-site study, the gen-eralizability of this research may be limited by the char-acteristics of our participants. However, an earlier analy-sis partly affirmed the generalizability of this research [8];i.e., fine-grained usage features such as the session timedistribution exhibited consistent patterns across the datasets

collected from different sites. We suggest that further ex-ploratory and confirmatory studies might consider differentsites, demographics, mobile devices/platforms, and culturalbackgrounds. The present analysis could be extended byinvestigating additional contextual factors (e.g., location andactivity), and content categories (e.g., social networking andmobile games).
ACKNOWLEDGEMENTS
This research was supported in part by the MSIP,Korea, and Microsoft Research, under the IT/SWCreative research program supervised by the NIPA(National IT Industry Promotion Agency) (NIPA-2013-ITAH0503130110270001000100100), by the IT R&Dprogram of MSIP/KEIT [10041313, UX-oriented MobileSW Platform], and by the National Research Foundation ofKorea (NRF) grant funded by the Korea government (MSIP)(No. 2011-0018120, 2012R1A1A1008858). We thank theanonymous reviewers for their many useful comments andsuggestions, which helped improve the paper.
REFERENCES
1. DSM-5. http://www.dsm5.org/.
2. The Mobile Consumer: A Global Snapshot, The NielsenCompany, Feb. 2013.
3. Ames, M. G. Managing Mobile Multitasking: TheCulture of iPhones on Stanford Campus. In CSCW(2013).
4. Bohmer, M., Hecht, B., Schoning, J., Kruger, A., andBauer, G. Falling Asleep with Angry Birds, Facebookand Kindle: A Large Scale Study on Mobile ApplicationUsage. In MobileHCI (2011).
5. Carbonell, X., Chamarro, A., Griffiths, M., Oberst, U.,Cladellas, R., and Talarn, A. Problematic Internet andCell Phone Use in Spanish Teenagers and YoungStudents. Anales de Psicologia (2012).
6. Cui, Y., and Roto, V. How People Use the Web onMobile Devices. In WWW (2008).
7. de Abreu, C. N., and Goes, D. S. Psychotherapy forInternet Addiction. Internet Addiction, John Wiley &Sons, Inc., 2011.
8. Falaki, H., Mahajan, R.and Kandula, S.,Lymberopoulos, D., Govindan, R., and Estrin, D.Diversity in Smartphone Usage. In MobiSys (2010).
9. Fogg, B. J. Persuasive Technology: Using Computers toChange What We Think and Do. Morgan Kaufmann,2002.
10. Greenfield, D. The Addictive Properties of InternetUsage. Internet Addiction, John Wiley & Sons, Inc.,2011.
11. Griffiths, M. D. Technological Addictions. ClinicalPsychology Forum (1995).
12. Harmon, E., and Mazmanian, M. Stories of theSmartphone in Everyday Discourse: Conflict, Tension &Instability. In CHI (2013).
13. Hwang, K. H., Yoo, Y. S., and Cho, O. H. SmartphoneOveruse and Upper Extremity Pain, Anxiety,Depression, and Interpersonal Relationships amongCollege Students. The Journal of the Korea ContentsAssociation (2012).
14. Kandell, J. J. Internet Addiction on Campus: TheVulnerability of College Students. CyberPsychology &Behavior (1998).
15. Kim, D., Jung, Y., Lee, J., Kim, M., Lee, Y., Kang, E.,Keum, C., and Nam, J. Development of SmartphoneAddiction Proneness Scale for Adults: Self-Report. TheKorean Journal of Counseling (2012).
16. Koo, H. Y. Development of a Cell Phone AddictionScale for Korean Adolescents. J Korean Acad Nurs(2009).
17. LaRose, R. Use and Gratifications of Internet Addiction.Internet Addiction, John Wiley & Sons, Inc., 2011.
18. LaRose, R., Lin, C. A., and Eastin, M. S. UnregulatedInternet Usage: Addiction, Habit, or DeficientSelf-Regulation? Media Psychology (2003).
19. Leung, L. Stressful Life Events, Motives for InternetUse, and Social Support among Digital Kids.CyberPsychology & Behavior (2007).
20. Levine, L. E., Waite, B. M., and Bowman, L. L. MobileMedia Use, Multitasking and Distractibility. IJCBPL(2012).
21. Miltenberger, R. G. Behavior Modification: Principlesand Procedures. Cengage Learning, 2011.
22. Morahan-Martin, J. Internet Abuse: Addiction?Disorder? Symptom? Alternative Explanations? SocialScience Computer Review (2005).
23. Morahan-Martin, J., and Schumacher, P. Loneliness andSocial Uses of the Internet. Computers in HumanBehavior (2003).
24. Murdock, K. K. Texting While Stressed: Implicationsfor Students’ Burnout, Sleep, and Well-Being.Psychology of Popular Media Culture (2013).
25. Oulasvirta, A., Rattenbury, T., Ma, L., and Raita, E.Habits Make Smartphone Use More Pervasive. PersonalUbiquitous Computing (2012).
26. Seay, A. F., and Kraut, R. E. Project Massive:Self-regulation and Problematic Use of Online Gaming.In CHI (2007).
27. Tossell, C. C., Kortum, P., Shepard, C. W., Rahmati, A.,and Zhong, L. Getting Real: A NaturalisticMethodology for Using Smartphones to CollectMediated Communications. Advances inHuman-Computer Interaction (2012).
28. van den Eijnden, R. J., Meerkerk, G.-J., Vermulst, A. A.,Spijkerman, R., and Engels, R. C. M. E. OnlineCommunication, Compulsive Internet Use, andPsychosocial Well-Being Among Adolescents: ALongitudinal Study. Developmental Psychology 44(2008), 655–665.
29. Wang, K.-C., Hong, M.-T., Kao, C. H.-L., Lin, A. C.,Wang, C.-A., You, C.-W., Pan, C.-H., Huang, M.-C.,Liang, C.-M., and Chu, H.-H. A Phone-based SupportSystem to Assist Alcohol Recovery. In CHI EA (2013).
30. Yarosh, S. Shifting Dynamics or Breaking SacredTraditions?: the Role of Technology in Twelve-stepFellowships. In CHI (2013).

$33(1',;�
:H� EHJLQ� ZLWK� VXPPDUL]LQJ� WKH� XVDJH� IHDWXUHV� WKDW� ZHUH�
XVHG�LQ�WKLV�ZRUN��:H�WKHQ�GHWDLO�WKH�GHVFULSWLYH�VWDWLVWLFV�RI�
YDULRXV�XVDJH�IHDWXUHV�WKDW�DUH� LPSRUWDQW� WR�XQGHUVWDQG�WKH�
XVDJH� GLIIHUHQFHV� DQG� VLPLODULWLHV�� )LUVW�� ZH� UHSRUW� WKH�
VHVVLRQ� GXUDWLRQ� DQG� LQWHU�VHVVLRQ� GXUDWLRQ� GLVWULEXWLRQV��
DQG� VKRZ� WKH� GLXUQDO� SDWWHUQV� RI� XVDJH� VHVVLRQV�� :H�
LOOXVWUDWH�PRUH� GHWDLOHG� LQIRUPDWLRQ� DERXW� WRS�UDQNHG� DSSV�
�L�H���WRS����WRS����DQG�UHSRUW�WKH�GLVWULEXWLRQ�RI�WKH�QXPEHU�
RI�XQLTXH�DSSV��6HFRQG��ZH�SORW� WKH�GLXUQDO�XVDJH�SDWWHUQV�
RI� 0,0� DQG� ZHE� EURZVLQJ�� 7KLUG�� ZH� UHSRUW� GHWDLOHG�
LQIRUPDWLRQ�DERXW�LQWHUQDO�DQG�H[WHUQDO�VHVVLRQV�VXFK�DV�&,�
DQG�p�YDOXHV����
Usage feature summary�� 7DEOH� �� VXPPDUL]HV� DOO� RI� WKH�
IHDWXUHV�XVHG�LQ�WKLV�SDSHU��7KH�IHDWXUHV�FDQ�EH�GLYLGHG�LQWR�
WZR�JURXSV�� � WKH�RYHUDOO�XVDJH�DQG�FDWHJRU\�VSHFLILF�XVDJH�
IHDWXUHV�� ,Q� WKH�RYHUDOO�XVDJH� DQDO\VLV��ZH� LQYHVWLJDWHG� WKH�
DJJUHJDWHG� XVDJH� �H�J��� XVDJH� WLPH�� VHVVLRQ� IUHTXHQF\���
VHVVLRQ� OHYHO� XVDJH� �H�J��� VHVVLRQ� WLPH�� LQWHU�VHVVLRQ� WLPH���
DQG� GLXUQDO� XVDJH� SDWWHUQV�� ,Q� WKH� FDWHJRU\�VSHFLILF� XVDJH�
DQDO\VLV��ZH�PDLQO\�FRQVLGHUHG�WKH�FRPPXQLFDWLRQ�DQG�ZHE�
EURZVLQJ�DSSV��1RWH�WKDW�LQ�RXU�PDFKLQH�OHDUQLQJ�DQDO\VLV��
DOO�RI�WKH�FDWHJRULHV�ZHUH�XVHG��WKH�IHDWXUHV�IURP�WKH�UHVW�RI�
FDWHJRULHV� DUH� YHU\� VLPLODU� WR� WKRVH� RI�ZHE�EURZVLQJ�� L�H���
XVDJH�WLPH�IUHTXHQF\��DQG�GLXUQDO�XVDJH�SDWWHUQV���
6XE�JURXSV� )HDWXUHV�
2YHUDOO�
8VDJH�
3DWWHUQV�
$JJUHJDWHG�
8VDJH�
8VDJH�WLPH�SHU�GD\�
6HVVLRQ�IUHTXHQF\�SHU�GD\�
6HVVLRQ�OHYHO�
8VDJH�
6HVVLRQ�WLPH��XVDJH�WLPH�SHU�VHVVLRQ��
,QWHU�VHVVLRQ�WLPH��
1XPEHU�RI�DSSV�XVHG�SHU�VHVVLRQ�
(QWURS\�RI�WRS�k�DSSV¶�XVDJH�
WLPH�IUHTXHQF\�GLVWULEXWLRQV��
�k� ������������
8VDJH�WLPH�DQG�IUHTXHQF\�RI�WRS�����DSSV
'LXUQDO��
8VDJH�
8VDJH�WLPH��VHVVLRQ�IUHTXHQF\��DQG�VHVVLRQ�
WLPH��QLJKW���a�����
PRUQLQJ���a�����DIWHUQRRQ����a�����DQG�
HYHQLQJ����a����
&DWHJRU\�
6SHFLILF�
8VDJH�
3DWWHUQV�
&RPP��
8VDJH�WLPH�DQG�DSS�IUHTXHQF\�RI�
FRPPXQLFDWLRQ��XVDJH�WLPH�DQG�IUHTXHQF\�
RI�^0,0��606��HPDLO��FDOO`��LQWHU�0,0�
WLPH�
'LXUQDO�XVDJH��XVDJH�WLPH��DSS�IUHTXHQF\��
DQG�VHVVLRQ�WLPH�RI�FRPPXQLFDWLRQ�DSSV��
QLJKW���a����PRUQLQJ���a�����DIWHUQRRQ�
���a�����DQG�HYHQLQJ����a����
,QWHUQDO�vs��H[WHUQDO�VHVVLRQV���
QXPEHU�RI�VHVVLRQV�SHU�GD\���
DSS�VHTXHQFH�OHQJWK�SHU�GD\���
VHVVLRQ�GXUDWLRQ�SHU�GD\��VHVVLRQ���
DSS�VHTXHQFH�OHQJWK�SHU�VHVVLRQ�
:HE��
%URZVHU�
8VDJH�WLPH�DQG�DSS�IUHTXHQF\�RI�ZHE��ZHE�
FRQWHQW��LQWHU�ZHE�WLPH�
'LXUQDO�XVDJH��XVDJH�WLPH��DSS�IUHTXHQF\��
DQG�VHVVLRQ�WLPH�RI�ZHE�EURZVLQJ�DSSV��
QLJKW���a�����
PRUQLQJ���a�����DIWHUQRRQ����a�����DQG�
HYHQLQJ����a����
7DEOH����6XPPDU\�RI�XVDJH�IHDWXUHV�
�
Session-level usage�� :H� FRQVWUXFWHG� WKH� JURXS�OHYHO� �RU�
³DYHUDJH´�� GLVWULEXWLRQV� RQ� VHVVLRQ�GXUDWLRQV� �)LJXUH� ��� ���
DQG� LQWHU�VHVVLRQ� GXUDWLRQV� �)LJXUH� ���� ���� E\� DYHUDJLQJ�
XVHUV¶� VDPSOH� SHUFHQWLOHV�� ZKLFK� LV� FDOOHG� 9LQFHQWL]LQJ�� D�
QRQSDUDPHWULF� PHWKRG�� � :H� SORW� WKH� FRPSOHPHQWDU\�
FXPXODWLYH� GLVWULEXWLRQ� IXQFWLRQ� �&&')�� DQG� WKH�
FXPXODWLYH� GLVWULEXWLRQ� IXQFWLRQ� �&')��� $V� VKRZQ� LQ� WKH�
HDUOLHU�ZRUN�>�@��PRVW�VHVVLRQV�DUH�VKRUW��PHGLDQ� ������V���
7KH�IUHTXHQF\�GURSV�H[SRQHQWLDOO\�DV� WKH� OHQJWK� LQFUHDVHV��
ZKLFK� LV� V� E\� D� QHDU� OLQHDU� VORSH� LQ� WKH� ORJ�OLQHDU� SORW� RI�
&&')�LQ�)LJXUH�����
10−3
10−2
10−1
100
0 1800 3600 5400Session length (s)
CC
DF
(lo
g)
group
riskallnon−risk
�
)LJXUH����6HVVLRQ�GXUDWLRQ�
GLVWULEXWLRQ��&&')��
0.0
0.5
1.0
0 1800 3600 5400Session length (s)
CD
F
group
riskallnon−risk
0.0
0.5
1.0
0 90 180
)LJXUH����6HVVLRQ�GXUDWLRQ�
GLVWULEXWLRQ��&')��
10−3
10−2
10−1
100
0 3600 7200 10800 14400Inter−session length (s)
CC
DF
(lo
g)
group
riskallnon−risk
�
)LJXUH�����,QWHU�VHVVLRQ��
GXUDWLRQ��&&')��
0.0
0.5
1.0
0 3600 7200 10800 14400Inter−session length (s)
CD
Fgroup
riskallnon−risk
0.0
0.5
1.0
0 240 480
)LJXUH�����,QWHU�VHVVLRQ��
GXUDWLRQ��&')���
7KH�ULVN�JURXS�WHQGHG�WR�KDYH�ORQJHU�VHVVLRQ�GXUDWLRQ��ULVN��
PHDQ� �������V��6'� �������vs��QRQ�ULVN��PHDQ� �������V��
6'� �������DQG�VKRUWHU�LQWHU�VHVVLRQ�GXUDWLRQ��ULVN��PHDQ� �
������ V�� 6'� � ������ vs�� QRQ�ULVN�� PHDQ� � ������ V�� 6'� �
�������� EXW� ZH� GLG� QRW� ILQG� VLJQLILFDQW� GLIIHUHQFHV� �VHH�
7DEOH�����&&')�VKRZV�WKDW�XVDJH�RI�VKRUW�VHVVLRQV�DSSHDUV�
WR� EH� VLPLODU�� EXW� WKH� ULVN� JURXS� WHQGHG� WR� KDYH� PRUH�
QXPEHU� RI� ORQJHU� VHVVLRQV��:H� WHVWHG� LI� WKH� IUHTXHQF\� RI�
ORQJ�VHVVLRQV�GLIIHUHG�EHWZHHQ�WKH�JURXSV��+HUH��ZH�VLPSO\�
DVVXPHG� WKDW� D� VHVVLRQ�ZDV�FRQVLGHUHG� ORQJ� LI� LWV� GXUDWLRQ�
ZDV�JUHDWHU�WKDQ����PLQXWHV��1R�GLIIHUHQFHV�ZHUH�IRXQG�LQ�
WKH�DJJUHJDWHG�XVDJH�GXUDWLRQ�RI� ORQJ�VHVVLRQV��ULVN��PHDQ�
������PLQ��6'� ������vs��QRQ�ULVN��PHDQ� ������PLQ��6'� �
�����p� ���������
:H� FDOFXODWH� WKH� PHDQ� VHVVLRQ� WLPH� GXULQJ� GLIIHUHQW� WLPH�
EORFNV��EXW�WKHUH�ZHUH�QR�VLJQLILFDQW�GLIIHUHQFHV��VHH�)LJXUH�
����� 0RVW� VHVVLRQV� DUH� YHU\� VKRUW� LQ� ERWK� JURXSV�� DQG�
VHVVLRQ�GXUDWLRQV�DUH�PXFK�ORQJHU�GXULQJ�QLJKW�DQG�PRUQLQJ�

WLPH� EORFNV�� ZKHQ� FRPSDUHG� ZLWK� WKRVH� RI� WKH� DIWHUQRRQ�
DQG�HYHQLQJ�WLPH�EORFNV��7DEOH���VXPPDUL]HV�WKH�SDLUHG�t�
WHVW� UHVXOWV� RQ� WKH� VHVVLRQ� GXUDWLRQV� EHWZHHQ� WZR� WLPH�
EORFNV����
0
100
200
300
[0,6)(p=.658/d=0.20)
[6,12)(p=.404/d=0.29)
[12,18)(p=.712/d=0.21)
[18,24)(p=.316/d=0.29)
Time of day (p−value/Cohen’s d)
Ave
rag
e s
ess
ion
du
rati
on
(s) risk non−risk
�)LJXUH�����'LXUQDO�XVDJH�VHVVLRQ�GXUDWLRQ��
�
7DEOH����5HVXOWV�RI�SDLUHG�t�WHVWV�RI�WKH�VHVVLRQ�GXUDWLRQV��
EHWZHHQ�WZR�WLPH�EORFNV��
:H�SORW�WKH�QXPEHU�RI�XQLTXH�DSSV�XVHG�E\�WKH�SDUWLFLSDQWV�
LQ� )LJXUH� ���� $V� VKRZQ� HDUOLHU�� QR� VLJQLILFDQW� GLIIHUHQFHV�
ZHUH�IRXQG��ULVN��PHDQ� ������6'� �����vs.�QRQ�ULVN��PHDQ�
�������6'� �������p� �������&RKHQ¶V�d� ���������
50
75
100
125
All Risk Non-risk
Group
Nu
mb
er
of u
niq
ue
ap
ps
�)LJXUH�����$YHUDJH�QXPEHU�RI�XQLTXH�DSSV�
Usage of top-ranked apps�� :H� PHDVXUHG� WKH� GHJUHH� RI�
XVDJH� RQ� WRS�k� DSSV�� E\� XVLQJ� WKH� HQWURS\� PHDVXUH�� %\�
YDU\LQJ�WKH�QXPEHU�RI� WRS�k�DSSV�DV�k� ��������DQG�����ZH�
SORWWHG�WKH�HQWURS\�YDOXHV�LQ�)LJXUH�����$V�VKRZQ�HDUOLHU��D�
VLJQLILFDQW�GLIIHUHQFH�ZDV�IRXQG�RQO\�LQ�WRS���DSS�XVDJH��p�
� ������ &RKHQ¶V� d� � ������� VKRZLQJ� WKDW� WKH� ULVN� JURXS¶V�
XVDJH�SDWWHUQV�ZHUH�KLJKO\�VNHZHG���
0.00
0.25
0.50
0.75
1.00
1 2 3 4Entropy of user
Cu
mu
lati
ve f
ract
ion
of
use
rs
Top
Top 5Top 10Top 50
Group
risknon−risk
�)LJXUH�����8VHU�HQWURS\�GLVWULEXWLRQ��
�IRU�WRS�k�DSS�XVDJH�GLVWULEXWLRQ���
:H�DOVR�UHSRUWHG�WKDW�WKH�ULVN�JURXS�VSHQW�PRUH�WLPH�RQ�WKH�
WRS�k� DSSV�� 7DEOH� ��� VXPPDUL]HV� WKH� FDWHJRU\�VSHFLILF�
GLVWULEXWLRQ�RI�WRS���DQG���DSSV��7RS�UDQNHG�DSSV�EHORQJ�WR�
0,0�� :HE�� DQG� 616�� SRSXODU� DSSV� LQFOXGH� .DNDR7DON��
$QGURLG¶V�GHIDXOW�ZHE�EURZVHU��DQG�)DFHERRN�� ,Q� WKH�FDVH�
RI�RWKHU�FDWHJRULHV� VXFK�DV�PRELOH�JDPHV� DQG�PXOWLPHGLD��
WKH�DSSV�DUH�YHU\�GLYHUVH��7KH�SURSRUWLRQV�RI�WRS�����DSSV¶�
FDWHJRU\�EHWZHHQ�WKH�ULVN�DQG�QRQ�ULVN�JURXSV�GLG�QRW�VKRZ�
D�VLJQLILFDQW�GLIIHUHQFH��7RS���DSSV��X�����N ���� ��������p�
�������7RS���DSSV��X�����N ���� ��������p� ��������
7DEOH�����&DWHJRU\�VSHFLILF�GLVWULEXWLRQ�RI�WRS�����DSSV�
Diurnal usage of MIM and Web apps��:H�SORW� WKH�GLXUQDO�
XVDJH�WLPH�DQG�IUHTXHQF\�RI�0,0�DQG�:HE�DSSV�LQ�)LJXUH�
���DQG�)LJXUH�����UHVSHFWLYHO\��6LPLODU�WR�WKH�RYHUDOO�XVDJH�
SDWWHUQV� �DV� VKRZQ� LQ� )LJXUH� ���� WKHUH� ZHUH� VLJQLILFDQW�
GLIIHUHQFHV�LQ�WKH�PRUQLQJ��p� �������&RKHQ¶V�d� �������DQG�
HYHQLQJ��p� �������&RKHQ¶V�d� ��������,Q�WKH�FDVH�RI�0,0��
KRZHYHU�� ZH� GLG� QRW� ILQG� VLJQLILFDQW� GLIIHUHQFHV� RQ� WKH�
GLXUQDO� XVDJH� SDWWHUQV�� *LYHQ� WKDW� WKH� HIIHFW� VL]HV� RI�
GLIIHUHQW� WLPH� EORFNV� DUH� JUHDWHU� WKDQ� ������ WKHUH� DUH� VWLOO�
SRVVLELOLWLHV� RI� GLXUQDO� XVDJH� GLIIHUHQFHV�� DQG� ZH� VXJJHVW�
IXUWKHU�VWXGLHV�RQ�GLIIHUHQW�GDWDVHWV��2QH�QRWDEOH�GLIIHUHQFH�
EHWZHHQ�0,0�DQG�ZHE� EURZVLQJ�ZDV� IRXQG� RQ� WKH� XVDJH�
WLPH� LQ� WKH�PRUQLQJ��ZKHQ� FRPSDUHG�ZLWK�0,0� DQG�ZHE�
XVDJH�DW�QLJKW��WKH�SDUWLFLSDQWV�KDG�PXFK�OHVV�WLPH�RQ�0,0�
XVDJH� LQ� WKH� PRUQLQJ�� ZKHUHDV� ZHE� XVDJH� ZDV� DERXW� WKH�
VDPH�RU�VOLJKWO\�LQFUHDVHG�����
Detailed information about cued sessions�� ,Q� 7DEOH� ���ZH�
VXPPDUL]HG� WKH� XVDJH� GLIIHUHQFHV� RI� LQWHUQDO� DQG� H[WHUQDO�
VHVVLRQV��,Q�7DEOH����DQG�7DEOH�����ZH�UHSRUWHG�WKH�GHWDLOHG�
VWDWLVWLFV��LQFOXGLQJ�&,��p�YDOXH��DQG�&RKHQ¶V�d���
7LPH�
%ORFNV�>����� >������ >������� >�������
0HDQ�
>����&,@�
����
>��������@�
����
>��������@�
����
>��������@�
����
>��������@�
>������
S ������
G �����
S ������
G �����
S ������
G �����
>������� �
S ������
G �����
S ������
G �����
>�������� � �
S ������
G �����
� 7RS���$SSV� 7RS���$SSV�
� 2YHUDOO 5LVN�1RQ�
5LVN�2YHUDOO� 5LVN�
1RQ�
5LVN�
0,0� ������� ������ ������� ������� ������ ������
:HE� ������� ������ ������� ������� ������ ������
%RRN� ������ ������ ������ ������ ������ ������
*DPH� ������ ������ ������ ������� ������ ������
616� ������ ������ ������ ������� ������ ������
3URGXFWLYLW\ ������ ������ ������ ������ ������ ������
0XOWLPHGLD ������ ������ ������ ������ ������ ������

0
10
20
30
[0,6)(p=.290/d=0.35)
[6,12)(p=.296/d=0.30)
[12,18)(p=.690/d=0.20)
[18,24)(p=.461/d=0.27)
Time of day (p−value/Cohen’s d)
Ave
rag
e u
sag
e a
mo
un
t (m
) risk non−risk
0
10
20
30
[0,6)(p=.090/d=0.48)
[6,12)(p=.270/d=0.31)
[12,18)(p=.402/d=0.27)
[18,24)(p=.181/d=0.39)
Time of day (p−value/Cohen’s d)
Ave
rag
e u
sag
e f
req
ue
ncy risk non−risk
�)LJXUH�����0,0�GLXUQDO�XVDJH�WLPH�DQG�IUHTXHQF\�
0
10
20
30
[0,6)(p=.130/d=0.43)
[6,12)(p=.017/d=0.64)
[12,18)(p=.092/d=0.48)
[18,24)(p=.028/d=0.59)
Time of day (p−value/Cohen’s d)
Ave
rag
e u
sag
e a
mo
un
t (m
) risk non−risk
0
10
20
30
[0,6)(p=.091/d=0.50)
[6,12)(p=.043/d=0.57)
[12,18)(p=.072/d=0.53)
[18,24)(p=.026/d=0.62)
Time of day (p−value/Cohen’s d)
Ave
rag
e u
sag
e f
req
ue
ncy risk non−risk
�)LJXUH�����:HE�EURZVLQJ�GLXUQDO�XVDJH�WLPH�DQG�IUHTXHQF\��
�
7DEOH�����([WHUQDO�VHVVLRQV�
7DEOH�����,QWHUQDO�VHVVLRQV�
�
�
.DNDR7DON� )DFHERRN� (PDLO� 9RLFH� 7RWDO�
5LVN� 1RQ�5LVN� 5LVN� 1RQ�5LVN 5LVN� 1RQ�5LVN 5LVN� 1RQ�5LVN� 5LVN� 1RQ�5LVN
1XPEHU�RI�VHVVLRQ�
SHU�GD\�
0HDQ� ����� ����� ��� ��� ��� ��� ���� ���� ���� ����
&,�������������
�����
������
�����
�����
���
�����
���
�����
���
�����
���
�����
����
�����
����
������
����
������
����
S�G�YDOXH� ����� ����� ���� ���� ���� ���� ����� ����� ���� ����
$JJUHJDWHG�DSS�
VHT��OHQJWK�SHU�GD\�
0HDQ� ������ ������ ���� ���� ��� ��� ����� ����� ����� �����
&,�������������
������
������
�����
������
����
������
����
�����
���
�����
���
�����
�����
�����
������������
�����
�������
�����
S�G�YDOXH� ����� ����� ���� ���� ���� ���� ����� ����� ���� ����
$JJUHJDWHG�
VHVVLRQ�WLPH��
SHU�GD\��V��
0HDQ� ������� ������� ������ ������ ����� ����� ������ ������ ������� ������
&,���������������
�������
��������
�������
�������
������
�������
������
������
�����
������
�����
�������
������
�������
��������������
�������
���������
�������
S�G�YDOXH� ����� ����� ���� ���� ���� ���� ����� ����� ���� ����
6HVVLRQ��
GXUDWLRQ��V��
0HDQ� ������ ������ ����� ����� ����� ����� ����� ����� ����� �����
&,��������������
������
�������
������
�������
�����
�������
�����
�������
�����
�������
�����
������
�����
������
�����
�������
�����
�������
�����
S�G�YDOXH� ����� ����� ���� ���� ���� ���� ����� ����� ���� ����
$SS�VHTXHQFH�
OHQJWK�SHU�VHVVLRQ�
0HDQ� ���� ���� ��� ��� ��� ��� ���� ����
&,������������
����
�����
����
�����
���
�����
���
�����
���
�����
���
�����
����
�����
����
S�G�YDOXH� ����� ����� ���� ���� ���� ���� ����� �����
�
.DNDR7DON� )DFHERRN� (PDLO� 9RLFH� 7RWDO�
5LVN� 1RQ�5LVN� 5LVN� 1RQ�5LVN 5LVN� 1RQ�5LVN 5LVN� 1RQ�5LVN� 5LVN� 1RQ�5LVN
1XPEHU�RI�VHVVLRQ�
SHU�GD\�
0HDQ� ����� ���� ��� ��� ��� ��� ���� ���� ���� ����
&,������������
�����
�����
����
�����
���
�����
���
�����
���
�����
���
�����
����
�����
����
������
����
������
����
S�G�YDOXH� ����� ����� ���� ���� ���� ���� ����� ����� ���� ����
$JJUHJDWHG�DSS�
VHT��OHQJWK�SHU�GD\�
0HDQ� ����� ����� ��� ��� ��� ��� ���� ���� ���� ����
&,�������������
�����
�����
�����
�����
���
�����
���
�����
���
�����
���
�����
����
�����
����
������
����
������
����
S�G�YDOXH� ����� ����� ���� ���� ���� ���� ����� ����� ���� ����
$JJUHJDWHG�
VHVVLRQ�WLPH��
SHU�GD\��V��
0HDQ� ������ ������ ����� ����� ��� ���� ����� ����� ������ ������
&,��������������
������
�������
������
�������
�����
������
�����
�����
���
�����
����
������
�����
�����
�����
������
�������
������
��������
S�G�YDOXH� ����� ����� ���� ���� ���� ���� ����� ����� ���� ����
6HVVLRQ��
GXUDWLRQ��V��
0HDQ� ����� ����� ���� ���� ��� ���� ����� ����� ���� ����
&,�������������
�����
������
�����
������
����
������
����
�����
���
������
����
������
�����
������
�����
������
����
������
����
S�G�YDOXH� ����� ����� ���� ���� ���� ���� ����� ����� ���� ����
$SS�VHTXHQFH�
OHQJWK�SHU�VHVVLRQ�
0HDQ� ���� ���� ��� ��� ��� ��� ���� ����
&,������������
����
�����
����
�����
���
�����
���
�����
���
�����
���
�����
����
�����
����
S�G�YDOXH� ����� ����� ���� ���� ���� ���� ����� �����