Embed Size (px)
Citation preview

TASK 4 – PARKING MARKET & FINANCIAL ANALYSIS
HONOLULU URBAN CORE PARKING MASTER PLAN HONOLULU, HI Prepared for: The City & County of Honolulu October 21, 2010

October 21, 2010 Mr. Wayne Yoshioka Department of Transportation Services City & County of Honolulu Frank F. Fasi Municipal Building 650 South King Street, Third Floor Honolulu, Hawaii 96813-3017 Re: Task 4 – Parking Market and Financial Analysis Dear Mr. Yoshioka: The following document highlights Walker’s work related to the Honolulu Urban Core Parking Master Plan. We summarize data collected within the study area relating to the parking market in the urban core. We also summarize our review of existing policies, pricing, equipment, structural systems, etc. The financial analysis provides projections that take into account Walker’s recommendations for enhancing revenues and/or reducing expenses. Should you have any immediate questions or concerns we remain available to answer any questions. Thank you in advance for your valued feedback; we look forward to hearing from you soon. Sincerely, WALKER PARKING CONSULTANTS
John W. Dorsett, AICP, CPP Ezra D. Kramer, AICP, CPP Senior Vice President Project Manager/Parking Consultant EDK:edk Enclosure: Parking Market and Financial Analysis
Walker Parking Consultants 606 S. Olive Street, Suite 1100 Los Angeles, CA 90014 Voice: 213.488.4911 Fax: 213.488.4983 www.walkerparking.com

TASK 4 – PARKING MARKET & FINANCIAL ANALYSIS
HONOLULU URBAN CORE PARKING MASTER PLAN HONOLULU, HI Prepared for: THE CITY & COUNTY OF HONOLULU Walker Project No.: 37-8151.00 October 21, 2010
“This report was funded in part through grants from the Federal Highway Administration and Federal Transit Administration, U.S. Department of Transportation. The views and opinions of the agency expressed herein do not necessarily state or reflect those of the U. S. Department of Transportation.”

HONOLULU URBAN CORE PARKING MASTER PLAN TASK 4 – PARKING MARKET & FINANCIAL ANALYSIS OCTOBER 21, 2010 37-8151.00
i
EXECUTIVE SUMMARY II City & County Parking System ......................................................... ii Market Analysis ............................................................................ iii Financial Analysis .......................................................................... vi
INTRODUCTION 1 Federal Grant Work Element ........................................................... 1 City and County Scope of Services .................................................. 2 Objective of Market and Financial Analysis ...................................... 2 Methodology and Report Organization ............................................ 3
City and County Parking System ................................................... 3 Parking Market Analysis ............................................................... 3 Parking Financial Analysis ............................................................ 3
Dates of Fieldwork ......................................................................... 3 Study Area .................................................................................... 4
CITY & COUNTY PARKING SYSTEM 6 Organizational Structure ................................................................ 6 Parking System Supply ................................................................... 8
Parking Garages ......................................................................... 8 Parking Lots ................................................................................ 9 On-Street Metered Parking ......................................................... 11
Flow of Funds .............................................................................. 11 General Condition of Parking Resources ......................................... 12 Existing Debt Service .................................................................... 13 Fieldwork .................................................................................... 14 Current Conditions – Overall Study Area ........................................ 15
Parking Inventory ....................................................................... 16 Parking Occupancy ................................................................... 17 Parking Turnover and Duration .................................................... 18 Parking Rates ............................................................................ 21
Proposed Changes in the Market ................................................... 22 Development/Redevelopment ..................................................... 22 Rapid Transit............................................................................. 24
FINANCIAL ANALYSIS 27 Parking Rates .............................................................................. 27
Historic Rates ............................................................................ 27 Current System Parking Rates ...................................................... 28
Historical Distribution of Revenue by Source ................................... 30 Anticipated Changes to Parking System .......................................... 32
Create a Parking Enterprise ........................................................ 32 Modify Parking Rates ................................................................. 34 Modify Employee Parking Policy ................................................. 37 Bundle and Renegotiate Operator Agreements ............................. 39 Increase Hours of Operation ....................................................... 40 Enhance Technology .................................................................. 41 Automate Revenue Collection ...................................................... 42 Obtain Control of Parking Enforcement Citations ........................... 43
Pro Forma Operating Statement ..................................................... 44 Statement of General Assumptions and Limiting Conditions ............... 49
LIST OF TABLES AND FIGURES
Table 1: City and County Parking
Garages ................................................ 9 Table 2: City and County Surface Parking
Lots ....................................................... 9 Table 3: Flow of Funds – Off-Street
Parking ................................................ 12 Table 4: Structural Maintenance Budget ..... 13 Table 7: Parking Supply – Study Area ........ 17 Table 8: Parking Occupancy – Study
Area ................................................... 17 Table 9: On-street Duration –
Downtown/Chinatown District ................ 18 Table 10: On-street Space Utilization –
Downtown/Chinatown District ................ 19 Table 11: Duration – Off-street Parking....... 20 Table 12: Space Utilization – Off-street
Parking ................................................ 21 Table 13: Parking Rates – Study Area ........ 22 Table 14: Current System Parking Rates –
Off-street .............................................. 29 Table 15: City & County Employee
Parking Rates ....................................... 30 Table 16: City and County of Honolulu
Parking Revenue Summary ..................... 31 Table 17: Monthly Rate Increase ............... 36 Table 18: City and County Facility
Operators ............................................ 39 Table 19: Existing Management Fees ......... 39 Table 20: Pro Forma - Baseline .................. 45 Table 21: Pro Forma - Walker ................... 47
Figure 1: Study Area .................................. 5 Figure 2: City & County Parking Supply ..... 10 Figure 3: City & County Rates vs. Market
Rates ................................................... 35 Figure 4: Median Monthly Rate in U.S. ...... 35 Figure 5: Monthly Parking Rate in U.S. ....... 37
APPENDIX A: SCOPE OF SERVICES
APPENDIX B: ON-STREET METER DETAIL
APPENDIX C: MARKET AREA PARKING INVENTORY, OCCUPANCY & RATE DETAIL
TABLE OF CONTENTS

HONOLULU URBAN CORE PARKING MASTER PLAN TASK 4 – PARKING MARKET & FINANCIAL ANALYSIS OCTOBER 21, 2010 37-8151.00
ii
Walker Parking Consultants (“Walker”) has been engaged by the City and County of Honolulu (“City and County”) to perform a comprehensive parking study (“Project”) for the Honolulu Downtown Urban Core. The Project consists of several studies based on the work element for federal grant 203.79-10. Included in the scope of services for the Project is Task 4 - Parking Market and Financial Analysis, which is the subject of this report. The objective of this task of the Project is specifically to study and document the characteristics of the parking market for the purposes of identifying the upside financial potential of the City and County of Honolulu-owned parking assets. As defined within the federal grant work element, the study area is bounded by River Street to Keeaumoku Street between Beretania Street and Nimitz Highway/Ala Moana Boulevard. The majority of the structured parking facilities owned by the City and County are located in Downtown and Chinatown, within the study area. Walker also provided projections for City and County facilities and on-street meters outside of this study area; these projections are based on the historical data provided by the City and County or parking management companies operating City and County facilities. CITY & COUNTY PARKING SYSTEM Walker worked with City and County staff to identify the City and County parking system assets, how they operate, and how the system operates on the whole. A brief description of the system is provided in the following bullets.
The organizational structure of the City and County parking system is segmented; various departments perform management and oversight of the many parking-related assets and functions (on-street meter maintenance, collections, citations, off-street facilities operations and maintenance)
The City and County parking system includes the following: o 5,654 structured spaces, o 709 surface lot spaces, and o 2,936 on-street meter spaces.
The majority of net operating income for the City and County- owned parking supply flows into the Highway Fund.
EXECUTIVE SUMMARY

HONOLULU URBAN CORE PARKING MASTER PLAN TASK 4 – PARKING MARKET & FINANCIAL ANALYSIS OCTOBER 21, 2010 37-8151.00
iii
Walker performed a conditions assessment of the structural components of each of the structured parking supply; results indicate that the City and County should expend roughly:
o $1,772,000 per year in 2011 through 2015,
o $1,700,000 per year in 2016 through 2020,
o $1,084,000 per year in 2021 through 2025, and
o $696,000 per year in 2026 through 2030.
Debt Service for the parking system is comingled with other City and County debt because several projects were funded through a single bond issuance, and over the course of several years refinancing of these bonds has occurred. Therefore, we do not believe that they could be separated due to refinancing, etc.
MARKET ANALYSIS Walker performed fieldwork within the study area to gauge current parking market conditions related to parking supply, demand, and rates. Walker also analyzed turnover and duration data for on-street meters in downtown and entry/exit data for three City and County structured parking facilities. The current conditions are provided below. The parking supply within the study area consists of on-street and off-street parking. Walker documented all on-street spaces, and all off-street spaces that are publicly available. Some publicly available spaces are found adjacent to businesses and are open to the public, but intended for use by patrons and employees of those businesses (Public/Private); other publicly available supply is owned by the City and County or operated by a private owner as public parking (Public/Public); still other parking is set aside using access control or signage and intended only for specific private users (Private/Private). Parking Supply – Study Area
Inventory Publi
c/Pu
blic
Publi
c/Pri
vate
Priva
te/Pri
vate
Meter
Time/
Other
Loadin
g
Total
Off-Street On-StreetBlock DescriptionALL On-Street 0 0 0 1,242 288 232 1,762ALL Surface Lot 1,839 1,662 6,674 79 7 0 10,261ALL Garage 5,313 10,251 18,297 0 0 0 33,861ALL Total 7,152 11,913 24,971 1,321 295 232 45,884
Off-Street On-Street
Source: Walker Parking Consultants, 2010.

HONOLULU URBAN CORE PARKING MASTER PLAN TASK 4 – PARKING MARKET & FINANCIAL ANALYSIS OCTOBER 21, 2010 37-8151.00
iv
Walker performed parking occupancy counts of the parking supply quantified in the table above. The results of those parking occupancy counts are found in the following table. Parking Occupancy – Study Area
Occupancy Publi
c/Pu
blic
Publi
c/Pri
vate
Priva
te/Pri
vate
Mete
rTim
e/Othe
r
Load
ing
Total
Off-Street On-StreetBlock DescriptionALL On-Street 0 0 0 915 249 188 1,352ALL Surface Lot 1,034 1,258 4,443 69 5 0 6,809ALL Garage 4,091 7,223 13,066 0 0 0 24,380ALL Total 5,125 8,481 17,509 984 254 188 32,541
Off-Street On-Street
Source: Walker Parking Consultants, 2010.
The parking supply in the study area was occupied as follows during the peak weekday period:
On-street 77% Surface Lots 66% Parking Structures 72% OVERALL 71%
Walker performed license plate inventories for on-street metered spaces every half-hour along several streets in Downtown and Chinatown. The following table presents how those spaces were utilized throughout the day. The results indicate that most spaces do have reasonably high turnover, which is desirable. Nonetheless there is a spike in utilization around both 4 hours and 8 hours, which suggests that employees (long-term parkers) have been utilizing these spaces. The spaces that Walker surveyed were all signed with a one-hour time limit. Therefore, the time limits are not always being observed, and may not be actively enforced. On-street Parking Utilization
Space UtilizationLength of Stay 0.5 1 1.5 2 2.5 3 3.5 4 4.5Space-Hours Utilized 244 216 117 62 50 39 52.5 40 13.5% of Total 25% 22% 12% 6% 5% 4% 5% 4% 1%
Length of Stay 5 5.5 6 6.5 7 7.5 8 8.5 9Space-Hours Utilized 5 17 12 19.5 14 52.5 16 0 0% of Total 1% 2% 1% 2% 1% 5% 2% 0% 0%
Source: Walker Parking Consultants, 2010.

HONOLULU URBAN CORE PARKING MASTER PLAN TASK 4 – PARKING MARKET & FINANCIAL ANALYSIS OCTOBER 21, 2010 37-8151.00
v
The utilization study for off-street parking relates to only three of the City and County’s off-street parking facilities. Each facility had a distinct utilization pattern based on how the parking supply is managed (long-term versus short-term parkers). Off-Street Parking Utilization
Space UtilizationLength of Stay <0:30 <1:00 <1:30 <2:00 <2:30 <3:00 <3:30 <4:00 <4:30 <5:00Hale Pauahi 12 45 43.5 32 15 12 3.5 4 4.5 5Kekaulike 60 154 103.5 74 25 15 14 8 0 0Marin Tower 18 50 54 50 40 24 10.5 20 9 5TOTAL 90 249 201 156 80 51 28 32 13.5 10
Length of Stay <5:30 <6:00 <6:30 <7:00 <7:30 <8:00 <8:30 <9:00 <9:30 <10:00Hale Pauahi 0 0 0 0 0 0 0 0 9.5 0Kekaulike 0 0 6.5 0 0 0 0 0 0 0Marin Tower 0 18 19.5 7 22.5 24 17 63 123.5 130TOTAL 0 18 26 7 22.5 24 17 63 133 130
Length of Stay <10:30 <11:00 <11:30 <12:00 <12:30 <13:00 <13:30 <14:00 <14:30 <15:00Hale Pauahi 0 0 0 0 0 0 0 14 0 0Kekaulike 0 0 0 0 0 0 0 0 0 0Marin Tower 105 44 92 12 12.5 0 0 0 14.5 0TOTAL 105 44 92 12 12.5 0 0 14 14.5 0
Source: Walker Parking Consultants, 2010.
Walker collected parking rate information for the study area. The results below are an average of the price per hour, daily maximum and monthly permit rate. These rates also include rates for City and County owned parking facilities (which bring down the average rate). Market Area Average Parking Rates
Location Hourly Max MonthlyDowntown/Chinatown $4.49 $35.58 $176.88Kaka' Ako Mauka $2.89 $17.89 $149.00Ala Moana $1.75 $4.00 $120.00Makiki $2.25 $16.00 N/A
Source: Walker Parking Consultants, 2010.
Walker attempted to collect data regarding projected future conditions for the study area that would likely impact the parking market through expansion or contraction of the parking supply or parking demand. The two identified catalysts for significant change are:
Development/Redevelopment, and
Rapid Transit.
The Department of Planning and Permitting was contacted in hopes of obtaining development/redevelopment data. To date we have no data from the Department of Planning and Permitting. Therefore,

HONOLULU URBAN CORE PARKING MASTER PLAN TASK 4 – PARKING MARKET & FINANCIAL ANALYSIS OCTOBER 21, 2010 37-8151.00
vi
Walker provided policy suggestions and summarized planning documents for areas within our study area including Kaka’ako Mauka. Walker also provides a narrative on the proposed rapid transit for greater Honolulu. The planned routes would run through the study area and likely impact parking demand when completed. The rail project is noted in the Downtown Honolulu Comprehensive Parking Study (issued in 1973), and again in the Honolulu Parking Management Study (issued in 1981). Both studies give the impression that the rapid transit system would be coming online within the next ten years (or each study). The project does seem to be gaining acceptance and may be funded over the next few years, which would result in the project coming online in no sooner than five years if only in a limited capacity. Although the impacts will likely be delayed, the greatest impact would likely be in the downtown core, from employees. FINANCIAL ANALYSIS Walker reviewed the City and County parking system operating revenues and expenses. The financial analysis utilizes findings from Walker’s prior tasks within the Project to generate assumptions that impact the financial performance for the parking system. A key component of a financial analysis is revenue generation. Revenue generation is a function of a rate structure being applied to a volume of demand (at various lengths of stay). Therefore, an analysis of parking rates is essential to the financial analysis. Our initial findings indicate that the current rate structures charged within the City and County parking facilities are below those charged at other publicly-available facilities in the study area. Parking rates for City and County owned supply have not been increased on a regular basis. Operating expenses increase regularly based on inflationary effects on labor costs, benefit costs, maintenance costs, and costs for structural repairs. Net proceeds to the City and County therefore decrease regularly; this trend is not sustainable and could over time result in a net loss when capital expenses for structural maintenance and ever-increasing operating costs are taken into account. Therefore, rates must be increased on a regular basis in order to sustain the parking supply. Walker suggests the following changes to the City and County of Honolulu parking system in an effort to aid in the following: 1) moving

HONOLULU URBAN CORE PARKING MASTER PLAN TASK 4 – PARKING MARKET & FINANCIAL ANALYSIS OCTOBER 21, 2010 37-8151.00
vii
the City and County-owned parking system toward being a more effective and efficient contributor to the public good, 2) implementing regional transportation policy, and 3) contributing to the financial wellbeing of the City and County of Honolulu.
Anticipated Changes to Parking System Form a Parking Enterprise Modify Rates Modify Employee Parking Policy Bundle/Renegotiate Operator Agreements Increase Hours of Operation Enhance Technology Automate Revenue Collection Obtain Control of Parking Citations
Walker projected net contribution to the City and County based on a status quo operation and based on the changes suggested by Walker to improve the system from both a management standpoint and a financial standpoint. Net contribution considers operating revenue and expense as well as management fees for parking operator contracts, and capital expenditures related to structural maintenance and purchase of new (up-to-date) equipment. The findings are provided in the following table. Net Contribution to City and County
Year Status Quo Walker Recommendations VarianceFY11 $3,720,000 $6,930,000 $3,210,000FY12 $3,600,000 $9,420,000 $5,820,000FY13 $3,480,000 $10,160,000 $6,680,000FY14 $3,360,000 $11,770,000 $8,410,000FY15 $3,230,000 $11,920,000 $8,690,000FY16 $3,170,000 $11,430,000 $8,260,000FY17 $3,040,000 $12,730,000 $9,690,000FY18 $2,900,000 $13,580,000 $10,680,000FY19 $2,760,000 $13,840,000 $11,080,000FY20 $2,610,000 $15,180,000 $12,570,000FY21 $3,080,000 $16,720,000 $13,640,000FY22 $2,920,000 $17,430,000 $14,510,000FY23 $2,760,000 $18,260,000 $15,500,000FY24 $2,600,000 $18,540,000 $15,940,000FY25 $2,430,000 $19,320,000 $16,890,000FY26 $2,640,000 $21,670,000 $19,030,000FY27 $2,460,000 $21,910,000 $19,450,000FY28 $2,270,000 $21,320,000 $19,050,000FY29 $2,080,000 $23,440,000 $21,360,000FY30 $1,880,000 $24,920,000 $23,040,000
$263,500,000
Source: Walker Parking Consultants, 2010.

HONOLULU URBAN CORE PARKING MASTER PLAN TASK 4 – PARKING MARKET & FINANCIAL ANALYSIS OCTOBER 21, 2010 37-8151.00
1
Walker Parking Consultants (“Walker”) has been engaged to prepare a Honolulu Comprehensive Study (“Project”). The Project tasks and deliverables that Walker has agreed to perform are based roughly upon the work element of an awarded federal grant. The scope of work within the signed agreement between Walker and the City and County of Honolulu was expanded from the summary work element of the grant to a broader range of services that will aid in the following: 1) moving the City and County-owned parking system toward being a more effective and efficient contributor to the public good, 2) implementing regional transportation policy, and 3) contributing to the financial wellbeing of the City and County of Honolulu. FEDERAL GRANT WORK ELEMENT The genesis of the Project lies within federal grant 203.79-10. The grant was approved based on a work element which has been provided in full within Appendix A of this document. The objectives and tasks are laid out below. Objectives: To conduct an on-street and off-street “public parking” survey in the Honolulu urban core for the purpose of assessing existing and future parking supply and demand. The urban core is defined as River Street to Keeaumoku Street between Beretania Street and Nimitz Highway/Ala Moana Boulevard. Impact of Work Element: This planning study will identify and assess potential locations and methods for the potential expansion and/or contraction of parking capacity including strategies for managing parking within the development of a new rapid transit system. Tasks:
1. Review and evaluate existing parking policies, procedures, standards, and pricing (Includes specifically: rates, duration, time limits, location, new equipment/technologies, and enforcement).
2. Conduct on-street and off-street parking surveys to determine the current inventory of parking spaces available for “public parking”.
3. Convene an advisory task force comprised of stakeholders and community representatives to discuss parking demand, supply, and management issues.
INTRODUCTION

HONOLULU URBAN CORE PARKING MASTER PLAN TASK 4 – PARKING MARKET & FINANCIAL ANALYSIS OCTOBER 21, 2010 37-8151.00
2
4. Prepare a parking master plan report that would incorporate the study objectives cited above.
The fact that majority funding for the Project is based on this work element, Walker will ensure that these specific tasks are addressed as priority items through the course of study. CITY AND COUNTY SCOPE OF SERVICES The scope of services defined within the contract between Walker and the City and County of Honolulu describes the following six (6) tasks:
1. Project Management, 2. Project Advisory Committee, 3. Feasibility Analysis of Monetization, 4. Parking Market and Financial Analysis, 5. Update Honolulu Comprehensive Parking Study (1973), and 6. Condition Appraisal.
The two tasks specifically called out within the federal grant work element are the Project Advisory Committee and Update Honolulu Comprehensive Parking Study (1973). The Condition Appraisal for the City and County owned parking structures feeds into both the Market and Financial Analysis and the Feasibility Analysis of Monetization. The Market and Financial Analysis and Feasibility Analysis of Monetization will aid in evaluating the existing parking policies, procedures, standards, and pricing. When combined, these tasks reflect a comprehensive parking master plan. OBJECTIVE OF MARKET AND FINANCIAL ANALYSIS As part of the expanded scope of services, Walker was asked to utilize data from their market analysis and policy recommendations to project future cash flows. The objective of this task of the Project is specifically to study and document the characteristics of the parking market for the purposes of identifying the upside financial potential of the City and County of Honolulu owned parking assets. The full scope of services for this task is provided in Appendix A of this document.

HONOLULU URBAN CORE PARKING MASTER PLAN TASK 4 – PARKING MARKET & FINANCIAL ANALYSIS OCTOBER 21, 2010 37-8151.00
3
METHODOLOGY AND REPORT ORGANIZATION This report includes three main sections: City and County Parking System, Parking Market Analysis, and Parking Financial Analysis. The report is organized in a way to lead the reader through the existing system, describe the market which the system serves from a historical, current and future perspective, and finally project likely financial results based on future demand and rate assumptions. CITY AND COUNTY PARKING SYSTEM The City and County Parking System section provides background information related to the current structure and assets that comprise the system. We discuss the organizational structure of the system, the parking system supply, the flow of funds, and the general condition of the system supply. PARKING MARKET ANALYSIS The Parking Market Analysis delves into the markets served by the City and County owned parking system. Fieldwork performed by Walker provides the majority of data required for the market analysis. We also utilize recent financial results and entry/exit data to generate assumptions related to parking demand characteristics such as length of stay and average ticket (for City and County owned facilities). Anecdotal information from the parking operators also yields insight relating to how these facilities have been operated historically (hours of operation, monthly/transient usage, etc.). These sets of information pave the way for market projections of parking demand and parking rates assumed to be used in the future. PARKING FINANCIAL ANALYSIS The Parking Financial Analysis section brings projected parking demand together with assumed parking rate structures to generate parking revenue. Parking operating expenses are also evaluated with policy changes and the operating agreement with a parking management company impacting how each facility is managed. The result is a net operating income for the entire parking system. DATES OF FIELDWORK Fieldwork for this analysis consisted of site visits to become acquainted with the parking market in Honolulu, as well as parking inventory and occupancy counts, parking rate surveys and license plate inventories (“LPIs”). This fieldwork was performed on the week of April 19, 2010 through April 23, 2010. Walker also performed condition

HONOLULU URBAN CORE PARKING MASTER PLAN TASK 4 – PARKING MARKET & FINANCIAL ANALYSIS OCTOBER 21, 2010 37-8151.00
4
assessments for the structural elements of the parking supply owned by the City and County. This fieldwork was performed during the week of May 17, 2010 through May 21, 2010. STUDY AREA The study area defined within the federal grant work element considers a significant portion of the City and County owned parking supply. This supply includes several off-street parking structures, off-street lots, and on-street metered and unmetered parking spaces. Although the study area considers the majority of this parking supply, it does not cover the entire City and County owned supply as some lots and metered streets can be found in Waikiki, other areas of Makiki, Kaimuki, and Kailua. For the market and financial analysis presented herein, we also consider the same study area (which may be amended upon further study if requested). Therefore the study area is bounded by River Street to Keeaumoku Street between Beretania Street and Nimitz Highway/Ala Moana Boulevard as defined within the federal grant work element. Walker has identified the following four (4) districts for detailed study: Downtown/Chinatown, Kaka’ako Mauka, Ala Moana, and Makiki. The study area is depicted on the aerial photograph in Figure 1 on the following page. The majority of City and County owned structured parking supply is found in Downtown/Chinatown.

HONOLULU COMPREHENSIVE PARKING STUDY TASK 4 – PARKING MARKET & FINANCIAL ANALYSIS OCTOBER 21, 2010 37-8151.00
5
Figure 1: Study Area
LEGEND:
Downtown/Chinatown
Kaka’ako Mauka
Ala Moana
Makiki

HONOLULU COMPREHENSIVE PARKING STUDY TASK 4 – PARKING MARKET & FINANCIAL ANALYSIS OCTOBER 21, 2010 37-8151.00
6
A parking system consist of physical assets and the organizational structure utilized to manage and maintain those assets; it considers physical assets such as parking structures, parking lots, and on-street spaces, as well as the organizational structure within government which guides parking demand management techniques (free/grace periods, validations, parker mix, time limits, rate structures, warnings and tickets, fines, etc.), and how the cost to operate is off-set (flow of funds). ORGANIZATIONAL STRUCTURE Although we refer to the City and County parking supply and its management as a system, it is somewhat segmented under current operation. Organizational changes took place several years ago within the City and County departments; one outcome was the fragmentation of the City and County parking assets. Today, City and County parking assets are controlled by several different departments and there is no parking enterprise fund. Following is a brief identification of those City and County departments that have parking-related responsibilities and a short description of these responsibilities:
Honolulu Police Department (“HPD”) – The Parking Enforcement and Collection Section of the HPD’s Traffic Division installs parking meters, carries out meter maintenance, and has a cadre of parking enforcement officers who issue parking citations. HPD also performs collection duties for all metered on- and off-street parking supply owned by the City and County of Honolulu.
Department of Facility Maintenance (“DFM”) – This department is responsible for the maintenance of surface parking lots and parking garages. It also manages third-party parking operator contracts, manages the City and County employee parking permit program, installs and maintains parking meter poles, and performs parking space line striping. Meter maintenance, however, is handled by the HPD.
Department of Transportation Services (“DTS”) – This department is generally not responsible for parking. However in recent years, DTS assumed responsibility for the maintenance and care of the Kaimuki Lot which had fallen into disrepair and required restoration to bring it to its current state of condition and operation. DTS manages the third-party concessionaire agreement associated with this property.
Department of Parks and Recreation (“DPR”) – There are approximately 16,000 parking spaces that are controlled by
CITY & COUNTY PARKING SYSTEM

HONOLULU COMPREHENSIVE PARKING STUDY TASK 4 – PARKING MARKET & FINANCIAL ANALYSIS OCTOBER 21, 2010 37-8151.00
7
DPR. With the exception of the parking supply at Hanauma Bay Nature Preserve, the DPR-controlled parking is provided free of charge.
Department of Enterprise Services (“DES”) – As part of its enterprise fund, DES receives revenue from the Honolulu Zoo and Neil Blaisdell Center parking operations. Blaisdell Center parking is contracted by DES through Diamond Parking, a third-party parking operator.
State of Hawaii – The state receives all parking violation citations income. HPD issues all parking citations and is not reimbursed for any costs that it incurs by enforcing parking regulations.
Given that these responsibilities have been divvied out to various departments, there is no clear organizational structure or hierarchy that impacts policy and management of the parking supply as a cogent system. Despite the efforts of some experienced and well-intentioned City and County employees, this makes it very difficult for the City and County to effectively manage its parking assets. Following is a summary of some of the challenges that are inherent with the existing fragmented organizational structure:
No single manager or department head identifies and contemplates a parking strategy for the City and County in support of reaching local goals for public transportation ridership.
On- and off-street parking rates are not coordinated as well as possible. On-street parking should be priced at or above the market rate off-street parking.
Regular rate increases are not implemented to fully keep pace with inflationary costs (operations and structural maintenance).
The City and County have contracts with four different parking operators. These could be consolidated and more favorable terms could be negotiated.
Most of the parking operator contracts have long expired. In some cases, extensions have expired, yet operators maintain control of their operations.
There are inconsistent management fees from one contract to the next contract. In our opinion, some of the management fees appear to be above market rate.
Reserve or condition appraisal studies have been conducted for some, but not all facilities.
Audit procedures are inconsistent from one facility to the next. The implementation of best practices and standardized procedures could improve revenue controls.

HONOLULU COMPREHENSIVE PARKING STUDY TASK 4 – PARKING MARKET & FINANCIAL ANALYSIS OCTOBER 21, 2010 37-8151.00
8
There is no single clearinghouse or source of parking-related information available to City and County administrators and elected officials.
Parking access and revenue control equipment and reporting practices are not up-to-date in some cases. One facility, Harbor Court, still uses hole-punch tickets. Credit cards are not accepted at any City and County-owned parking facilities or any on-street meters.
Parking debt is co-mingled with other City and County debt and parking revenues do not directly service this debt.
No one is actively lobbying state government to improve its parking violation citations collection process and to coordinate local goals with state goals.
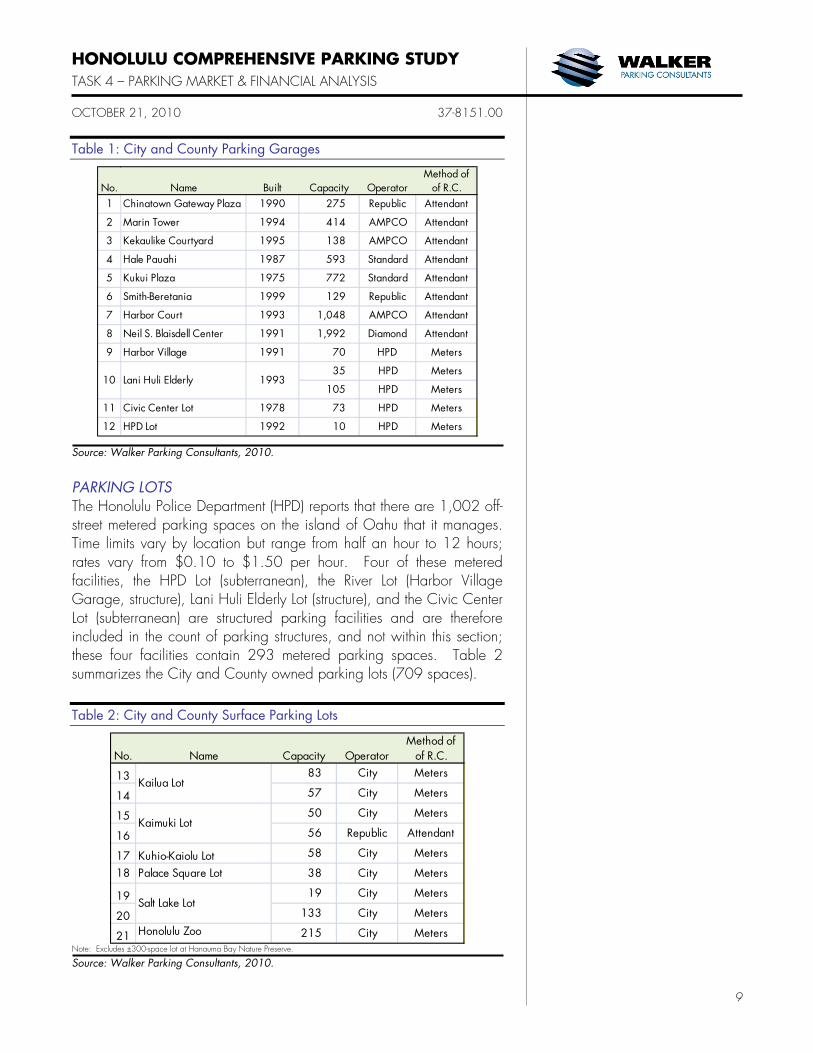
PARKING SYSTEM SUPPLY The City and County own on-street spaces – both metered and unmetered, surface parking lots (defined as one level of at grade parking), and parking garages (defined as a parking facility with at least one level of subterranean, supported parking, or a landscaped plaza). The City and County has over 9,000 total parking spaces that require a charge for public parking. With the exception of two facilities, all surface parking lots requiring a parking fee are metered. Parking meters or exit cashiers are used to collect revenue at the 12 City and County parking garages. This section details the revenue-producing parking assets that are owned by the City and County. Figure 2 illustrates the location of off-street parking supplies within the study area. PARKING GARAGES Twelve City and County-owned parking structures or parking garages have been identified. These facilities contain an estimated 5,654 parking spaces. Eight of these facilities are operated by third-party parking operators and four of these facilities are operated by the City and County and contain parking meters for the purposes of collecting revenues. Table 1 provides a summary of these parking garages.
HONOLULU COMPREHENSIVE PARKING STUDY TASK 4 – PARKING MARKET & FINANCIAL ANALYSIS OCTOBER 21, 2010 37-8151.00
9
Table 1: City and County Parking Garages
Method ofNo. Name Built Capacity Operator of R.C.1 Chinatown Gateway Plaza 1990 275 Republic Attendant
2 Marin Tower 1994 414 AMPCO Attendant
3 Kekaulike Courtyard 1995 138 AMPCO Attendant
4 Hale Pauahi 1987 593 Standard Attendant
5 Kukui Plaza 1975 772 Standard Attendant
6 Smith-Beretania 1999 129 Republic Attendant
7 Harbor Court 1993 1,048 AMPCO Attendant
8 Neil S. Blaisdell Center 1991 1,992 Diamond Attendant
9 Harbor Village 1991 70 HPD Meters
35 HPD Meters
105 HPD Meters
11 Civic Center Lot 1978 73 HPD Meters
12 HPD Lot 1992 10 HPD Meters
10 Lani Huli Elderly 1993
Source: Walker Parking Consultants, 2010.
PARKING LOTS The Honolulu Police Department (HPD) reports that there are 1,002 off-street metered parking spaces on the island of Oahu that it manages. Time limits vary by location but range from half an hour to 12 hours; rates vary from $0.10 to $1.50 per hour. Four of these metered facilities, the HPD Lot (subterranean), the River Lot (Harbor Village Garage, structure), Lani Huli Elderly Lot (structure), and the Civic Center Lot (subterranean) are structured parking facilities and are therefore included in the count of parking structures, and not within this section; these four facilities contain 293 metered parking spaces. Table 2 summarizes the City and County owned parking lots (709 spaces). Table 2: City and County Surface Parking Lots
Method ofNo. Name Capacity Operator of R.C.
13 83 City Meters
14 57 City Meters
15 50 City Meters
16 56 Republic Attendant
17 Kuhio-Kaiolu Lot 58 City Meters
18 Palace Square Lot 38 City Meters
19 19 City Meters
20 133 City Meters
21 Honolulu Zoo 215 City Meters
Kailua Lot
Salt Lake Lot
Kaimuki Lot
Note: Excludes ±300-space lot at Hanauma Bay Nature Preserve.
Source: Walker Parking Consultants, 2010.

HONOLULU COMPREHENSIVE PARKING STUDY TASK 4 – PARKING MARKET & FINANCIAL ANALYSIS OCTOBER 21, 2010 37-8151.00
10
Figure 2: City & County ParkingSupply
LEGEND:
Downtown/Chinatown
Kaka’ako Mauka
Ala Moana
Makiki
4
$1.50/Hr Meter Zone
3
5
2
1
6
7
8
9
11
12
18

HONOLULU URBAN CORE PARKING MASTER PLAN TASK 4 – PARKING MARKET & FINANCIAL ANALYSIS OCTOBER 21, 2010 37-8151.00
11
ON-STREET METERED PARKING The HPD reports the existence of 2,936 on-street metered parking spaces located the island of Oahu. These meters accept quarters, dimes, and nickels but not dollars, half dollars, pennies, currency, credit cards, or smart cards. Time limits vary by location but range from one to three hours; and rates are either $0.75 or $1.50 per hour. A table within Appendix B lists these on-street meters. The $1.50 per hour parking meter zone consists of those meters located in Waikiki, City Hall, and designated space in downtown and civic center area. As defined by ordinance, the downtown and civic center area is bounded by River Street to Vineyard Boulevard, then along Vineyard Boulevard to Punchbowl Street, then along Punchbowl Street to Beretania Street, then along Beretania Street to Alapai Street, then along Alapai Street to King Street, then along King Street to Punchbowl Street, and along Punchbowl Street to the waterfront. Figure 2 on the previous page outlines the area described above. FLOW OF FUNDS Given the decentralized nature of this parking “system”, it is important to identify the current flow of funds. Because there is no single parking fund into which parking profits (or losses) are funneled, it is difficult to measure the actual financial performance of the system and generate policy decisions. Financial incentive (i.e. revenue; even as an expense offset) is also an issue for on-street parking and parking citations. As policy currently stands there is no financial incentive for staffing parking enforcement officers. Parking citations income flows to the State of Hawaii per ordinance. In the past, the City and County have unsuccessfully tried to reverse State law to allow all and/or a portion of these parking citation revenues to flow to the City and County’s operating budget. The City and County are reportedly not highly motivated to issue large numbers of parking citations because all of the parking citations income flows to the State of Hawaii while the City incurs supply, labor, and processing expenses. Parking lot and parking garage revenues typically flow to the City and County Highway Fund or the building fund associated with the building that the parking garage serves. Specifically, the list within Table 3 identifies the flow of revenues from various City and County-owned off-street parking facilities.

HONOLULU URBAN CORE PARKING MASTER PLAN TASK 4 – PARKING MARKET & FINANCIAL ANALYSIS OCTOBER 21, 2010 37-8151.00
12
Table 3: Flow of Funds – Off-Street Parking
Method of RevenueName Address Capacity Operator of R.C. Recipient
Chinatown Gateway Plaza1031 Nuuanu;
Bethel St. bet. King & Hotel
275 Republic Attendant Housing Developer Fund
Marin Tower60 N. Nimitz Hwy.; Smith St. bet. Nimitz
& Marin414 AMPCO Attendant Highway Fund
Kekaulike Courtyard1016 Maunakea St.; Maunakea St. bet. Nimitz & King
138 AMPCO Attendant Highway Fund
Hale Pauahi155 N. Beretania; Beretania St. bet.
Maunakea & River593 Standard Attendant Rental Assistance Fund
Kukui Plaza1255 Nuuanu Ave;.
Kukui Street bet. Fort & Nuuanu
772 Standard Attendant Highway Fund
Smith-Beretania1170 Nuuanu St.; Beretania St. bet. Nuuanu & Smith
129 Republic Attendant Highway Fund
Harbor Court55 Merchant St.;
Bethel St. bet. Nimitz & King
1,048 AMPCO Attendant Highway Fund
Neil S. Blaisdell Center777 Ward Ave.; Ward Ave bet.
Kapiolani & King1,992 Diamond Attendant Special Events Fund
Harbor Village901 River St.;
Nimitz Hwy. bet. River & Kekaulike
70 HPD Meters Housing Developer Fund
35 HPD Meters Highway Fund
105 HPD Meters
Civic Center Lot650 S. King St.; Alapai St. bet.
Beretania & King73 HPD Meters Highway Fund
HPD Lot
801 S. Beretania; Hotel St. bet.
Realamakai & Hale-Makai
10 HPD Meters Highway Fund
Lani Huli Elderly45 Aulike St.; Aulike St. bet.
Uluniu & Kuulei
Source: City and County of Honolulu, 2010.
GENERAL CONDITION OF PARKING RESOURCES Walker performed a conditions assessment of eleven City and County owned parking facilities. The assessment contains our initial findings as well as a preliminary opinion of capital expenditures recommended over a 50-year planning horizon to complete structural repairs and maintenance on the structures that comprise the System. Maintenance requirements based on our assessment of the facilities is limited to nondestructive testing to qualify construction materials and as-built conditions. The assessment review assisted in developing the conceptual maintenance program based on factors such as:
Age and geographic location; Structural system and the design details involved; Quality of construction material specified;

HONOLULU URBAN CORE PARKING MASTER PLAN TASK 4 – PARKING MARKET & FINANCIAL ANALYSIS OCTOBER 21, 2010 37-8151.00
13
Construction quality or deficiencies; Existing distress in structural elements, such as spalling,
cracking, scaling, or excessive deformations; Corrosion-protection system specified or implemented; and Operational elements.
The table below summarizes our opinion of cost for relevant maintenance elements, procedures and schedules for maintaining the structure. Table 4 includes cost totals for five-year increments for preventative restoration and replacement. Routine maintenance (defined within Condition Assessment) is not included because these items involve details of the daily operation that are beyond the scope of the overall maintenance evaluation. We have provided the amounts relevant to this financial analysis (twenty years) in 2010 dollars. Further detail is available in the Task 6 report. Table 4: Structural Maintenance Budget
2011 to 2016 to 2021 to 2026 toName Capacity 2015 2020 2025 2030
Chinatown Gateway Plaza 275 $430,000 $300,000 $280,000 $270,000
Marin Tower 414 $610,000 $850,000 $300,000 $490,000
Kekaulike Courtyard 138 $208,006 $680,213 $130,663 $367,744
Hale Pauahi 593 $650,000 $920,000 $320,000 $290,000
Kukui Plaza 772 $400,000 $2,840,000 $860,000 $150,000
Smith-Beretania 129 $20,000 $190,000 $140,000 $40,000
Harbor Court 1,048 $830,000 $720,000 $1,070,000 $540,000
Neil S. Blaisdell Center 1,992 $4,680,000 $900,000 $1,170,000 $650,000
Harbor Village 70 $90,000 $180,000 $80,000 $40,000
35
105
Civic Center Lot 73 $700,000 $720,000 $870,000 $580,000
$60,000$200,000$240,000 $200,000Lani Huli Elderly
Source: City and County of Honolulu, 2010.
EXISTING DEBT SERVICE There is outstanding debt service associated with the City and County-owned parking assets. However, because there is no parking enterprise fund and because parking-related debt has been refinanced over the years and the debt is co-mingled with other assets that are not parking-related, this analysis does not recognize any specific parking-related debt.

HONOLULU URBAN CORE PARKING MASTER PLAN TASK 4 – PARKING MARKET & FINANCIAL ANALYSIS OCTOBER 21, 2010 37-8151.00
14
The market analysis delves into the markets served by the City and County owned parking system. Walker performed fieldwork within the study area and requested historical operating data for all City and County owned parking facilities. The fieldwork provides overall market information related to the total number of parking spaces within the study area, whether those spaces are highly utilized, and the posted rate structures for each parking supply. We utilize recent financial results and entry/exit data from City and County facilities to generate assumptions related to parking demand characteristics specific to those facilities. Anecdotal information from the parking operators also yields insight relating to how these facilities have been operated historically (hours of operation, monthly/transient usage, etc.). These sets of information pave the way for market projections of parking demand and establishing market-dominant parking rates under current conditions. FIELDWORK To analyze the current conditions within the study area, Walker performed several field surveys to gauge parking supply, demand, turnover, and rates. The following list of surveys details how each survey was performed within the study area. License Plate Inventory – Walker performed License Plate Inventories (“LPIs”) for a sampling of on-street meters in the Downtown sub-area. On-street LPIs began at 8:30AM and were performed every half hour until the last set of counts beginning at 5:00PM. Walker staff recorded the last four (4) characters on each license plate for every metered space within their route. Walker followed the same census routes used to determine turnover in the 1973 study for on-street parking. These routes are defined as follows:
1. Alakea Street and Bishop Street between Beretania and Nimitz Highway.
2. Bethel Street and Nuuanu Avenue between Beretania and Nimitz Highway.
3. Maunakea Street between Beretania and Nimitz Highway and Pauahi Street between River Street and Fort Street Mall.
Inventory Counts – Walker attempted to obtain a parking inventory for every publicly available parking facility within the study area. Generally, private operators consider inventory counts to be proprietary information, which is protected to remain competitive. Any privately owned/publicly available facility may not allow access;

HONOLULU URBAN CORE PARKING MASTER PLAN TASK 4 – PARKING MARKET & FINANCIAL ANALYSIS OCTOBER 21, 2010 37-8151.00
15
Walker staff was discreet while performing these observations to avoid confrontation and gain as much insight into the market as possible. Occupancy Counts – Walker attempted to perform parking occupancy counts for every publicly available parking facility within the study area. Generally, private operators consider occupancy counts to be proprietary information, which is protected to remain competitive. Any privately owned/publicly available facility may not allow access; Walker staff was discreet while performing these observations to avoid confrontation and gain as much insight into the market as possible. Turnover/Duration Study – Walker requested entry/exit data for transient and monthly transactions for each of the City and County owned facilities. We were provided with data from three attended facilities. These data were utilized to determine hourly occupancy as well as duration. Duration studies for privately-owned facilities were not possible because the nature of the parking business has changed; this information is now protected by private operators. Rate Survey – Walker attempted to obtain parking rates for every publicly--available parking facility within the study area. Private operators often guard their parking rates, although with the exception of monthly rates, these are generally posted at the facility entrance. Rate information was recorded through the use of a digital camera. A photo was taken of the posted rates at the entry of the facility. Walker also followed up with phone calls to inquire about monthly parking rates. CURRENT CONDITIONS – OVERALL STUDY AREA The study area includes a very diverse set of land uses, but all urban. The city of Honolulu grew and expanded from the initial core with historic churches and the Iolani Palace, Chinatown, and later added City and County, and also State and Federal buildings. Light industrial land uses developed to support the growing city near the port, and residential neighborhoods stretched from downtown toward Diamondhead. With the advent of the automobile, the urban landscape was altered and development began to scale accordingly. New developments and redevelopments were planned to include minimum parking requirements for automobiles as their use became a prevalent part of society. The parking studies performed in 1973 and 1981 captured some of the issues related to automobile transportation, especially the single-

HONOLULU URBAN CORE PARKING MASTER PLAN TASK 4 – PARKING MARKET & FINANCIAL ANALYSIS OCTOBER 21, 2010 37-8151.00
16
occupant vehicle. Both studies highlighted the fact that additional parking spaces would be needed to serve a growing work population in the urban core, but also encouraged the birth and growth of a transit program to mitigate the impacts (congestion, air quality, and infrastructure costs) associated with increased employment in downtown. The character of Honolulu varies from one district to the next and within each district. Much of the study area reflects Euclidean zoning with parking provided on a parcel-by-parcel basis, which has inherent inefficiencies. Many nearby land uses could share parking based on differing hours of activity or operation. On-street parking has been provided throughout the urban core. Many of the spaces are impacted by time restrictions related to peak commute times and must be vacated to allow for increased traffic volumes. Other on-street spaces serve almost as long-term vehicle storage as the study area moves away from the CBD. There are several bus routes running to and through the study area linking the population of Honolulu to the jobs, government services, medical care, recreational opportunities, entertainment and shopping venues located in the urban core. Both local and express bus lines service the urban core, making transit a reasonable option for employees, visitors, and residents. The study area as a whole is fairly pedestrian-friendly. The scale of some blocks may be a barrier for visitors, but based on commute statistics, workers in Honolulu are not daunted by the scale. Biking is a largely unrealized form of transportation in Honolulu. The moderate temperatures, relatively low rainfall and flat topography of the coastal plain make biking a great option for commuters and visitors alike. Currently, the network of bicycle routes, lanes and paths is somewhat lacking, but have been identified for improvement in the Oahu Bike Plan. PARKING INVENTORY There are various types of parking supply found within the study area ranging from small unmarked spaces along an uncurbed street to behemoth parking structures. The majority of parking spaces in the study area are set aside for the use of employees, visitors, or residents of an associated land use. The City and County provide public off-street parking in the CBD and Chinatown, and on-street parking for the remainder of areas. The City and County also provides public parking at the Neil S. Blaisdell Center, which is utilized by nearby employees

HONOLULU URBAN CORE PARKING MASTER PLAN TASK 4 – PARKING MARKET & FINANCIAL ANALYSIS OCTOBER 21, 2010 37-8151.00
17
and employees of businesses (and government) located in downtown who ride TheBus shuttle from the center. Walker compiled the detailed inventory of the parking supply from each of the four districts; the following table provides a summary of the inventory broken down by type. Table 5: Parking Supply – Study Area
Inventory Publi
c/Pu
blic
Publi
c/Pri
vate
Priva
te/Pri
vate
Mete
rTim
e/Othe
r
Load
ing
Total
Off-Street On-StreetBlock DescriptionALL On-Street 0 0 0 1,242 288 232 1,762ALL Surface Lot 1,839 1,662 6,674 79 7 0 10,261ALL Garage 5,313 10,251 18,297 0 0 0 33,861ALL Total 7,152 11,913 24,971 1,321 295 232 45,884
Off-Street On-Street
Source: Walker Parking Consultants, 2010.
On-street parking represents only 4% of the total parking supply. Surface lots represent 22% of the total supply. Parking structures, both below and above grade, account for 74% of the parking supply in the study area. Detail for each of the four districts can be found within the Appendix C of this report or within the Task 5 report. PARKING OCCUPANCY Walker also compiled the parking occupancy counts from the four districts, which has been summarized in the following table. Table 6: Parking Occupancy – Study Area
Occupancy Publi
c/Pu
blic
Publi
c/Pri
vate
Priva
te/Pri
vate
Mete
rTim
e/Othe
r
Load
ing
Total
Off-Street On-StreetBlock DescriptionALL On-Street 0 0 0 915 249 188 1,352ALL Surface Lot 1,034 1,258 4,443 69 5 0 6,809ALL Garage 4,091 7,223 13,066 0 0 0 24,380ALL Total 5,125 8,481 17,509 984 254 188 32,541
Off-Street On-Street
Source: Walker Parking Consultants, 2010.
The parking supply in the study area was occupied as follows during the peak weekday period:
On-street : Overall – 77%

HONOLULU URBAN CORE PARKING MASTER PLAN TASK 4 – PARKING MARKET & FINANCIAL ANALYSIS OCTOBER 21, 2010 37-8151.00
18
o Meter – 75% o Time/Other – 86% o Loading – 81%
Surface Lots: Overall – 66% o Public/Public – 56% o Public/Private – 76% o Private/Private – 67%
Parking Structures: Overall – 72% o Public/Public – 77% o Public/Private – 70% o Private/Private – 71%
TOTAL MARKET – 71%
The observed parking occupancy illustrates that there were over 13,000 vacant spaces during the peak weekday period. Further detail can be found within Appendix C or the Task 5 report. PARKING TURNOVER AND DURATION Walker performed license plate inventories each half hour for a sample of on-street spaces within the Downtown/Chinatown District. The following table summarizes our findings: Table 7: On-Street Duration – Downtown/Chinatown District
DurationLength of Stay (Hrs) 0.5 1 1.5 2 2.5 3 3.5 4 4.5Route 1 62 23 9 6 4 1 5 3 0Route 2 184 102 35 13 6 9 5 2 2Route 3 241 91 34 12 10 3 5 5 1TOTAL 487 216 78 31 20 13 15 10 3% of Total 55% 24% 9% 3% 2% 1% 2% 1% 0%
Length of Stay (Hrs) 5 5.5 6 6.5 7 7.5 8 8.5 9Route 1 0 0 0 0 0 3 0 0 0Route 2 0 2 0 0 0 0 1 0 0Route 3 1 1 2 3 2 4 1 0 0TOTAL 1 3 2 3 2 7 2 0 0% of Total 0% 0% 0% 0% 0% 1% 0% 0% 0%
703
109
33 25
23
<1
<2
<3
<4
<8
Source: Walker Parking Consultants, 2010.
HONOLULU URBAN CORE PARKING MASTER PLAN TASK 4 – PARKING MARKET & FINANCIAL ANALYSIS OCTOBER 21, 2010 37-8151.00
19
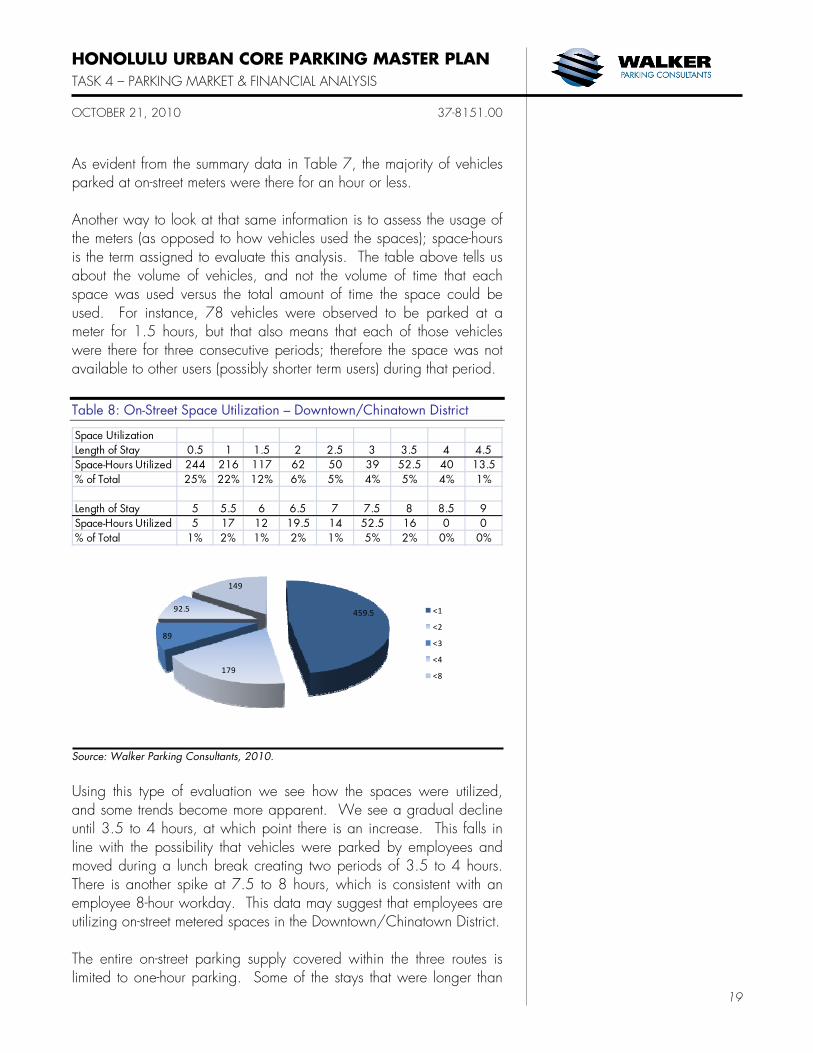
As evident from the summary data in Table 7, the majority of vehicles parked at on-street meters were there for an hour or less. Another way to look at that same information is to assess the usage of the meters (as opposed to how vehicles used the spaces); space-hours is the term assigned to evaluate this analysis. The table above tells us about the volume of vehicles, and not the volume of time that each space was used versus the total amount of time the space could be used. For instance, 78 vehicles were observed to be parked at a meter for 1.5 hours, but that also means that each of those vehicles were there for three consecutive periods; therefore the space was not available to other users (possibly shorter term users) during that period. Table 8: On-Street Space Utilization – Downtown/Chinatown District
Space UtilizationLength of Stay 0.5 1 1.5 2 2.5 3 3.5 4 4.5Space-Hours Utilized 244 216 117 62 50 39 52.5 40 13.5% of Total 25% 22% 12% 6% 5% 4% 5% 4% 1%
Length of Stay 5 5.5 6 6.5 7 7.5 8 8.5 9Space-Hours Utilized 5 17 12 19.5 14 52.5 16 0 0% of Total 1% 2% 1% 2% 1% 5% 2% 0% 0%
459.5
179
89
92.5
149
<1
<2
<3
<4
<8
Source: Walker Parking Consultants, 2010.
Using this type of evaluation we see how the spaces were utilized, and some trends become more apparent. We see a gradual decline until 3.5 to 4 hours, at which point there is an increase. This falls in line with the possibility that vehicles were parked by employees and moved during a lunch break creating two periods of 3.5 to 4 hours. There is another spike at 7.5 to 8 hours, which is consistent with an employee 8-hour workday. This data may suggest that employees are utilizing on-street metered spaces in the Downtown/Chinatown District. The entire on-street parking supply covered within the three routes is limited to one-hour parking. Some of the stays that were longer than

HONOLULU URBAN CORE PARKING MASTER PLAN TASK 4 – PARKING MARKET & FINANCIAL ANALYSIS OCTOBER 21, 2010 37-8151.00
20
an hour were due to construction traffic and permits to park on-street. Although duration shows that a significant number of vehicles were able to utilize these on-street spaces for short-term parking, the space turnover also accounts for the length of time that a space is taken by a vehicle. We estimate that roughly 25% of the space-hours that we observed were utilized by vehicles staying 3.5 hours or longer. Given the limited on-street parking supply available in Downtown/ Chinatown, fewer construction permits should be granted (moving construction employee vehicles off-street) and/or more length of stay violations should be written. These two policy shifts would encourage appropriate usership of the scarce on-street parking supply. Walker requested entry and exit data for the City- and County-owned facilities to gauge turnover and duration. Data for three facilities were provided by the parking operators; Hale Pauahi, Kekaulike, and Marin Tower. The average length of stay for Hale Pauahi was one hour and sixteen minutes (1:16). The average length of stay for Kekaulike was fifty-three minutes (0:53). The average length of stay for Marin Tower was three hours and thirty-five minutes (3:35). Table 9: Duration – Off-Street Parking
DurationLength of Stay <0:30 <1:00 <1:30 <2:00 <2:30 <3:00 <3:30 <4:00 <4:30 <5:00Hale Pauahi 24 45 29 16 6 4 1 1 1 1Kekaulike 120 154 69 37 10 5 4 2 0 0Marin Tower 36 50 36 25 16 8 3 5 2 1TOTAL 180 249 134 78 32 17 8 8 3 2
Length of Stay <5:30 <6:00 <6:30 <7:00 <7:30 <8:00 <8:30 <9:00 <9:30 <10:00Hale Pauahi 0 0 0 0 0 0 0 0 1 0Kekaulike 0 0 1 0 0 0 0 0 0 0Marin Tower 0 3 3 1 3 3 2 7 13 13TOTAL 0 3 4 1 3 3 2 7 14 13
Length of Stay <10:30 <11:00 <11:30 <12:00 <12:30 <13:00 <13:30 <14:00 <14:30 <15:00Hale Pauahi 0 0 0 0 0 0 0 1 0 0Kekaulike 0 0 0 0 0 0 0 0 0 0Marin Tower 10 4 8 1 1 0 0 0 1 0TOTAL 10 4 8 1 1 0 0 1 1 0
Source: Walker Parking Consultants, 2010.

HONOLULU URBAN CORE PARKING MASTER PLAN TASK 4 – PARKING MARKET & FINANCIAL ANALYSIS OCTOBER 21, 2010 37-8151.00
21
The three facilities for which data was provided differ in patron type based on length of stay (duration). Hale Pauahi and Kekaulike both cater to short-term visitors while Marin Tower is available to long-term parkers as well as short-term parkers. This disparity in transient use reinforces that further study should be undertaken regarding the remainder of the City and County owned off-street facilities once data is made available. Table 10: Space Utilization – Off-Street Parking
Space UtilizationLength of Stay <0:30 <1:00 <1:30 <2:00 <2:30 <3:00 <3:30 <4:00 <4:30 <5:00Hale Pauahi 12 45 43.5 32 15 12 3.5 4 4.5 5Kekaulike 60 154 103.5 74 25 15 14 8 0 0Marin Tower 18 50 54 50 40 24 10.5 20 9 5TOTAL 90 249 201 156 80 51 28 32 13.5 10
Length of Stay <5:30 <6:00 <6:30 <7:00 <7:30 <8:00 <8:30 <9:00 <9:30 <10:00Hale Pauahi 0 0 0 0 0 0 0 0 9.5 0Kekaulike 0 0 6.5 0 0 0 0 0 0 0Marin Tower 0 18 19.5 7 22.5 24 17 63 123.5 130TOTAL 0 18 26 7 22.5 24 17 63 133 130
Length of Stay <10:30 <11:00 <11:30 <12:00 <12:30 <13:00 <13:30 <14:00 <14:30 <15:00Hale Pauahi 0 0 0 0 0 0 0 14 0 0Kekaulike 0 0 0 0 0 0 0 0 0 0Marin Tower 105 44 92 12 12.5 0 0 0 14.5 0TOTAL 105 44 92 12 12.5 0 0 14 14.5 0
Source: Walker Parking Consultants, 2010.
PARKING RATES Walker compiled the average rates within each of the four districts within the study area in Table 11. As expected, the parking rates are highest in the Downtown core and decrease moving from ewa to diamondhead and away from major corridors. The individual maps in Appendix C (for each district) illustrate how rate drops from one end of a district to the next while Table 11 provide a comparison from one district to another. Detailed rate information for each of the four districts can be found within Appendix C.

HONOLULU URBAN CORE PARKING MASTER PLAN TASK 4 – PARKING MARKET & FINANCIAL ANALYSIS OCTOBER 21, 2010 37-8151.00
22
Table 11: Average Parking Rates – Study Area
Location Hourly Max MonthlyDowntown/Chinatown $4.49 $35.58 $176.88Kaka' Ako Mauka $2.89 $17.89 $149.00Ala Moana $1.75 $4.00 $120.00Makiki $2.25 $16.00 N/A
Source: Walker Parking Consultants, 2010.
PROPOSED CHANGES IN THE MARKET Conversations with City and County staff revealed two general trends that will likely impact parking demand within the study area in the future. The first trend is additional development specifically projected to occur in areas slated for redevelopment, which will increase land use density and therefore parking demand. The second trend relates to improved access to the study area via new transit facilities and service, which has the potential to reduce parking demand (perhaps significantly), in part based on parking and transportation management policies that the City and County chooses to implement. The potential impacts of these two trends are presented below. DEVELOPMENT/REDEVELOPMENT Because the study area encompasses the downtown urban core, the majority of parcels in the study area have been developed in one way or another. Although this may be the case, there are redevelopment initiatives aimed at converting some districts into more up-to-date and vibrant neighborhoods (including both commercial and residential land uses). Following is a brief description of the study area district-by-district. The Downtown/Chinatown District of the study area is a fairly mature market with most blocks consisting of high-rise and mid-rise development. The Chinatown area has been preserved as low-rise to maintain the character of that neighborhood. Some municipal and institutional blocks are less intensively developed to promote an open feel and bonus green space near the urban core. No specific developments have been identified with the Downtown/Chinatown District although surface lots do exist throughout Chinatown, east of the urban core which may be developed. The Kaka’ako Mauka District is slated for large-scale redevelopment. The document Supplemental Environmental Impact Statement Preparation Notice – Revisions to the Kaka’ako Community Development District Mauka Area Plan and Rules, December 2007

HONOLULU URBAN CORE PARKING MASTER PLAN TASK 4 – PARKING MARKET & FINANCIAL ANALYSIS OCTOBER 21, 2010 37-8151.00
23
calls for shared parking structures within Kaka’ako to minimize the amount of land devoted to parking and create a more walkable district. In the same vein, on-street parking spaces are encouraged as a buffer between pedestrians and traffic to encourage walking. Additional policies within the document will also have a positive benefit in this regard. We believe that such measures ultimately improve the efficiency of the entire transportation system as they encourage alternatives to driving and parking. The Ala Moana District of the study area contains a myriad of land uses ranging from a regional retail center – to a community event center – to single-family residences. For the most part, the ewa bounds of Ala Moana take on the characteristics of Kaka’ako Mauka with light industrial land uses initially serving the nearby waterfront. Areas farther diamondhead have been redeveloped as high-rise residential and retail. Mauka within Ala Moana is a small residential enclave that may at some point be redeveloped, but no known plans have been submitted. The Makiki District of the study area contains several low- to mid-rise buildings which include medical office, retail, office, and some institutional land uses. One project that has been identified within the district is the development of a courthouse complex; the complex is proposed to provide parking supply on-site within a subterranean parking facility. Surface lots are not uncommon in Makiki, which according to land use planning are merely placeholders for future development with greater density. But based on the apparent vacancy rate of commercial space within this district it may be several years before increased density impacts the parking market within the study area. Our contact within the Department of Transportation Services attempted to provide an appropriate party to contact within the Department of Planning and Permitting, but to date, no contact or information from this department has been provided. Therefore, no specific projects were identified for projecting the impacts of future development; as an alternative Walker has provided the following policy discussion. Given the continued redevelopment of the urban core it is important to discuss how this redevelopment will impact the parking market (supply/demand/rate) in the future. While an increased supply of parking results in more convenient access to a destination by automobile, it may reduce the concentration of destinations or housing in a given area by displacing usable square footage with parking. While this is certainly the case when parking is provided in surface

HONOLULU URBAN CORE PARKING MASTER PLAN TASK 4 – PARKING MARKET & FINANCIAL ANALYSIS OCTOBER 21, 2010 37-8151.00
24
lots, it can even be the case when structured parking is built into building podiums as well. Podium parking tends to reduce an area’s pedestrian friendliness (including those pedestrians using public transportation) as well. We have noted a trend in City and County policies related to the Land Use Ordinance to move specifically toward parking policies that encourage more pedestrian friendly environments. These environments provide a walkable scale, active streetscape, traffic/pedestrian buffer (on-street parallel or angled parking), and shared parking facilities serving several land uses. RAPID TRANSIT Both the 1973 Downtown Honolulu Comprehensive Parking Study and the subsequent 1981 Honolulu Parking Management Study suggest that improved transit options within the areas under study would reduce parking demand. The transit improvements considered in these reports have not yet materialized, but within the next decade the likelihood of the introduction of significant additional transit service within the area studied is great. Existing transit service, though heavily utilized, already provides an alternative to driving alone and parking for many commuters to the study area. The City’s TheBus transit system had more than 70 million riders and 107 routes in 2008.1 The Oahu Regional Transportation Plan of 2030 highlights several planned transit improvements including the Fixed Guideway system that calls for up to three stations within the study area and the expansion of TheBus service in Central Oahu. In a presentation at the University of Hawai’i, Manoa, visiting Urban Planning professor Dr. Brian Taylor of the University of California’s Institute of Transportation Studies suggested that “the physical boundaries and high densities make Honolulu a transit friendly city,” but cautioned that “. . . complementary policies to limit auto access and market price parking would be required” to encourage the use of rail service in Honolulu.”2 The EIS for the planned light rail system, released in June 2010, projects daily ridership of 116,000 passengers. We therefore note that commuters will have an increasing number of cost effective alternatives to driving and parking to access the study area and are even more likely to do so if parking pricing is used to manage the demand for parking in the area.
1 http://en.wikipedia.org/wiki/TheBus_(Honolulu) 2 http://www.hhua.org/BrianTaylor4-06.pdf

HONOLULU URBAN CORE PARKING MASTER PLAN TASK 4 – PARKING MARKET & FINANCIAL ANALYSIS OCTOBER 21, 2010 37-8151.00
25
Congested traffic conditions are often cited in Honolulu planning documents, discussions and the local media as a major concern, a threat to the island’s quality of life, the growth of its economy and the major impetus for the implementation of the planned Honolulu Rail Transit Project, which will serve the Primary Urban Center. Research regarding traffic has demonstrated a strong link between underpriced parking and impacted traffic conditions. We note that a transportation system generally consists of three components: the vehicles, the right of way and the terminal capacity. In the case of an automobile-based transportation system, these components are the car, the road network and the parking facilities (which represent the terminal capacity for the road network). By constructing additional parking, the terminal capacity of the system is increased while leaving the capacity of the road network unchanged; the latter becomes increasingly overburdened. In the case of Honolulu in general and our study area in particular, by all accounts, the roadway capacity is often heavily congested. A number of studies, including a 2008 study conducted by the policy think tank Rand Corporation, found properly pricing “underpriced curb parking” to be one of the most immediate and effective measures that local governments can take to reduce traffic.3 We therefore consider the impact of parking policy with regard to traffic. The flip side of increased traffic congestion, or rather one of the causes, is a less than desired use of the public transportation system. The recently released Honolulu High-Capacity Transit Corridor Project Environmental Impact Statement notes that “current transit service in the corridor is heavily used resulting in bus service productivity that is among the highest in the U.S.”4 Conversely, the Mauka Area Plan for the Kaka’ako Community Development District produced in 2005 notes that the level of transit ridership in Kaka’ako specifically is “inadequate to encourage non-automobile travel and to serve future transportation needs.”5 The introduction of the planned rail service should offer commuters increased transit capacity incentives to take
3 Moving Los Angeles: Short-Term Policy Options for Improving Transportation. Sorensen, Rand Corporation, 2008. 4 Honolulu High-Capacity Transit Corridor Project Environmental Impact Statement. June 2010. 5 Mauka Area Plan, Kaka’ako Community Development District. Unofficial Compilation. Hawai’i Community Development Authority, 2005.

HONOLULU URBAN CORE PARKING MASTER PLAN TASK 4 – PARKING MARKET & FINANCIAL ANALYSIS OCTOBER 21, 2010 37-8151.00
26
public transportation – and therefore a reasonable alternative to driving to the primary urban center. In short, underpriced and oversupplied parking is a significant subsidy offered to those who choose to drive and arguably a perk which those who do not or cannot drive are unable to enjoy. The result is significant cost to the parking provider, whether it is the City or a private developer and an overburdened road system.

HONOLULU URBAN CORE PARKING MASTER PLAN TASK 4 – PARKING MARKET & FINANCIAL ANALYSIS OCTOBER 21, 2010 37-8151.00
27
Financial analysis is a way to test assumptions within a model and project the impact of those assumptions. The financial analysis section brings projected parking demand together with assumed parking rate structures to generate parking revenue. Parking operating expenses are also evaluated with assumptions regarding policy changes and the operating agreement with a parking management company impacting how each facility is managed. The result is the projected net operating income for the entire parking system. Walker will also include the capital expenditures required to perform structural maintenance in accord with Walker’s condition assessment of structured parking. The following section details the assumptions utilized within our model and the resulting financial impact on the City and County parking system. PARKING RATES A key driver to any financial analysis is revenue. Revenue is the result of a fee (rate) applied to a quantity of product or service delivered. Parking rates and rate structure impact not only financial outcomes within a parking system, but also manage supply and demand through the market force of competitive pricing. A rate structure may also encourage use by a specific group and discourage use by another group (short-term versus long-term parkers, tenants versus non-tenants). The most important question regarding rate is the intended result of rate policy; revenue generation, system management, or both (without maximizing either). HISTORIC RATES Walker requested historic rate information for the City- and County- owned parking facilities. Rate increases occurred for metered on-street, surface lot, and structured parking in 2004, and prior to that in 1989. The details of those rate changes are provided below: 1989 Rate Change – The City and County on-street parking ordinance was modified to reflect the following parking rate increases in the Downtown, Civic Center, City Hall, and Waikiki areas:
Increase one-hour zone rate from $0.60 to $1.00 A nickel buys three minutes instead of five minutes A dime buys six minutes instead of ten minutes A quarter buys 15 minutes instead of 25 minutes
Rates outside of the aforementioned areas were changed as follows:
$0.50 per hour;
FINANCIAL ANALYSIS

HONOLULU URBAN CORE PARKING MASTER PLAN TASK 4 – PARKING MARKET & FINANCIAL ANALYSIS OCTOBER 21, 2010 37-8151.00
28
A nickel buys six minutes; A dime buys 12 minutes; and A quarter buys 30 minutes
2004 Rate Change – The City and County on-street parking ordinance was modified to reflect the following parking rate increases in the Downtown, Civic Center, City Hall, and Waikiki areas:
Increase one-hour zone rate from $1.00 to $1.50; and A quarter buys 10 minutes instead of 15 minutes.
Rates outside of the aforementioned areas were changed as follows:
Increase one-hour rate from $0.50 to $0.75; and A quarter buys 20 minutes instead of 30 minutes.
Off-street attended parking facilities had rate increases in 2004 and 1990. The 2004 rate change impacted only monthly parking rates; these increases were rolled back later that year. Walker was not provided with rate information dating back to 1990 or prior to the rate increase that occurred that year. Regardless, based on the rollback of the 2004 monthly rate increase, we know that parking rates associated with City- and County-owned facilities have not increased for short-term or monthly parking since at least 1990 (20 years). CURRENT SYSTEM PARKING RATES On-street rates were adjusted last in 2004 raising those meters that had previously required $1.00 per hour to $1.50 per hour, and $.50 per hour to $.75 per hour. Figure 2 provides the boundaries of the higher rate zone. In addition to this area, both Waikiki and the Civic Center also require payment at the higher $1.50 per hour rate. Parking rates for surface lots (and metered structures) are provided within Table 12, but generally follow the same two-tiered rate structure as on-street metered parking. Attended parking facilities utilize a rate structure that encourages short-term parking (up to 2-hours) through a stepped rate structure whereby the hourly rate is lower for the first two hours, then increases to a higher hourly rate. This form of rate structure aids in managing the available supply as it introduces economic forces to a supply and demand model. Long-term parkers either purchase monthly parking passes to avoid the increased rate or utilize early bird rates at those facilities offering them. Table 12 provides detailed information regarding parking rates for City and County owned facilities.

HONOLULU URBAN CORE PARKING MASTER PLAN TASK 4 – PARKING MARKET & FINANCIAL ANALYSIS OCTOBER 21, 2010 37-8151.00
29
Table 12: Current System Parking Rates – Off-street
Primary Period Secondary Period Public Monthly Lost Ticket BusinessFacility Hours/Rates Hours/Rates Rate Charge Validation
Chinatown Gateway PlazaMonday-Friday (except holidays), 6AM-
5PM; $.75/half-hour first 2 hours, $1.50/half-hour thereafter
Monday-Friday, 5PM-Midnight; Sat/Sun/Holidays, 6AM-Midnight; $.50/half-hour,
maximum $3.00
$150.00 $21.00 At primary rates, as may
be adjusted.
Carpool parking program authorized. Early bird all-day parking authorized. Commercial tenant rate: $150/month; Low-moderate income resident rate: $40/month; Gap group income resident rate: $60/month; Market unit resident rate:
$80/month.
Marin TowerMonday-Friday (except holidays), 6AM-
5PM; $.75/half-hour first 2 hours, $1.50/half-hour thereafter
Monday-Friday, 5PM-Midnight; Sat/Sun/Holidays, 6AM-Midnight; $.50/half-hour,
maximum $3.00
$125.00 $21.00 At primary rates, as may
be adjusted.
Carpool parking program authorized. Early bird all-day parking authorized. Commercial tenant rate: $125/month. Low-moderate income residential rate: $40/month. Gap
group income residential rate: $60/month. Market residential rate: $80/month.
Kekaulike CourtyardsMonday-Friday (except holidays), 6AM-
5PM; $.75/half-hour first 2 hours, $1.50/half-hour thereafter
Monday-Friday, 5PM-Midnight; Sat/Sun/Holidays, 6AM-Midnight; $.50/half-hour,
maximum $3.00
$125.00 $21.00 At primary rates, as may
be adjusted.
Carpool parking program authorized. Early bird all-day parking authorized. Commercial tenant rate: $125/month; Low-moderate income resident rate: $40/month; Gap group income resident rate: $60/month; Market unit resident rate:
$80/month.
Hale PauahiMonday-Friday (except holidays), 6AM-
5PM; $.75/half-hour first 2 hours, $1.50/half-hour thereafter
Monday-Friday, 5PM-Midnight; Sat/Sun/Holidays, 6AM-Midnight; $.50/half-hour,
maximum $3.00
$90.00 $21.00 At primary rates, as may be adjusted.
Carpool parking program authorized. Early bird all-day parking authorized. Commercial tenant rate: $90/month; Below-market unit resident rate: $40/month; Market unit
resident rate: $60/month; River-Pauahi resident rate: $40/month; Pauahi Kupuna Hale resident rate: $10/month.
Kukui PlazaMonday-Friday (except holidays), 6AM-
5PM; $.75/half-hour first 2 hours, $1.50/half-hour thereafter
Monday-Friday, 5PM-Midnight; Sat/Sun/Holidays, 6AM-Midnight; $.50/half-hour,
maximum $3.00
$100.00 $21.00 At primary rates, as may be adjusted.
Carpool parking program authorized. Early bird all-day parking authorized. Low-moderate income resident rate:
$40/month.
Smith-BeretaniaMonday-Friday (except holidays), 6AM-
5PM; $.75/half-hour first 2 hours, $1.50/half-hour thereafter
Monday-Friday, 5PM-Midnight; Sat/Sun/Holidays, 6AM-Midnight; $.50/half-hour,
maximum $3.00
$125.00 $21.00 At primary rates, as may be adjusted.
Carpool parking program authorized. Early bird all-day parking authorized.
Harbor CourtMonday-Friday (except holidays), 6AM-
5PM; $.75/half-hour first 2 hours, $1.50/half-hour thereafter
Monday-Friday, 5PM-Midnight; Sat/Sun/Holidays, 6AM-Midnight; $.50/half-hour,
maximum $3.00
$140.00 $21.00 At primary rates, as may be adjusted.
Carpool parking program authorized. Early bird all-day parking authorized.
Harbor VillageDaily (except Sunday & holidays), 7AM-6PM; $1.50/hr. - 2 hr. limit N/A N/A N/A N/A
Commercial tenant rate: $150/month; Low-moderate income resident rate: $40/month; Gap group income resident rate:
$60/month; Market unit resident rate: $80/month; Residential stalls may be reallocated to other residential tenants
at the specified rates.Daily (except Sunday & holidays), 7AM-6PM; '$0.75/hr. - 3 hr. limit
N/A N/A N/A N/A N/A
Daily (except Sunday & holidays), 7AM-6PM; '$0.75/hr. - 5-hr. limit
N/A N/A N/A N/A N/A
Civic Center Lot Daily (except Sunday & holidays), 7AM-6PM; $1.50/hr. - 5hr. limit
N/A N/A N/A N/A N/A
HPD Lot Daily (except Sunday & holidays), 7AM-6PM; $1.50/hr. - 2 hr. limit
N/A N/A N/A N/A N/A
Daily (except Sunday & holidays), 7AM-6PM; $0.75/hr. - 3-hr. limit
N/A N/A N/A N/A N/A
Daily (except Sunday & holidays), 7AM-6PM; $0.75/hr. - 5-hr. limit
N/A N/A N/A N/A N/A
Daily (except Sunday & holidays), 7AM-6PM; '$0.75/hr. - 2-hr. limit
N/A N/A N/A N/A N/A
Daily (except Sunday & holidays), 7AM-6PM; '$0.75/hr. - 2-hr. limit
N/A N/A N/A N/A N/A
Kuhio-Kaiolu Lot Daily (except Sunday & holidays), 7AM-6PM; $1.50/hr. - 5hr. limit
N/A N/A N/A N/A N/A
Palace Square LotDaily (except Sunday & holidays),
7AM-6PM; '$0.75/ 1/2-hr. - 1/2 hr. limit
N/A N/A N/A N/A N/A
Daily (except Sunday & holidays), 7AM-6PM; $0.25/hr. - 2 hr. limit
N/A N/A N/A N/A N/A
Daily (except Sunday & holidays), 7AM-6PM; '$0.10/hr. - 12-hr. limit
N/A N/A N/A N/A N/A
Honolulu Zoo Daily (except Sunday & holidays), 7AM-6PM; '$1/hr. - 4-hr. limit 24/7
N/A N/A N/A N/A N/A
Lani Huli Elderly
Kailua Lot
Kaimuki Lot
Salt Lake Lot
Other
Source: City and County of Honolulu, 2010.

HONOLULU URBAN CORE PARKING MASTER PLAN TASK 4 – PARKING MARKET & FINANCIAL ANALYSIS OCTOBER 21, 2010 37-8151.00
30
The City and County also provides parking for its employees. Employees of the City and County of Honolulu enjoy a significant parking subsidy compared to the market rates in and around Honolulu. Table 13 provides current City and County employee parking rates. Table 13: City & County Employee Parking Rates
User Group RatesReserved $75.00Unreserved $35.00Carpool $26.25Tandem $25.00Hybrid $35.00
Civic Center Parking Structure
Source: City and County of Honolulu, 2010.
HISTORICAL DISTRIBUTION OF REVENUE BY SOURCE The Budget and Fiscal Services Department provided the City of Honolulu Parking Revenue Summary (FYE 6/30) for 2008 and 2009, and for 2010 through 4/22. This summary is presented in Table 14 and indicates that the City and County reportedly collected $8,674,446.89 in parking revenues during FY 2009 (net of paying any third-party operator expenses), a 3.2% reduction from FY 2008. FY 2010 parking revenues are lagging behind those in FY 2009 by an estimated 5.7%. The receding parking revenues over the FY 2008 through FY 2010 time frame appear to be normal, given the most recent recessionary environment. Other cities are reportedly experiencing higher decreases than the ones shown herein.

HONOLULU COMPREHENSIVE PARKING STUDY TASK 4 – PARKING MARKET & FINANCIAL ANALYSIS OCTOBER 21, 2010 37-8151.00
31
Table 14: City and County of Honolulu Parking Revenue Summary
Revenue FY 2010Fund Code Description FY 2008 FY 2009 (YTD 04/22/10)
METERED PARKING (Gross Receipts)120 7141 Street Parking Meter 3,113,524.72 3,075,325.24 2,436,675.90120 7146 Kuhio-Kaiolu Parking Lot 0.00 8,666.69 51,321.82120 7154 Kaimuki Parking Lot 319,815.36 259,585.58 206,630.62120 7155 Kailua Parking Lot 202,252.14 197,379.72 145,035.52120 7158 Kalakaua Parking Lot 150,004.07 150,936.98 186,368.85120 7159 Zoo Parking Lot 263,622.00 257,074.76 459,355.26120 7160 Civic Center Parking Lot 119,320.76 111,359.24 87,116.00120 7163 Parking Chgs - Salt Lake 43,772.98 42,601.76 27,530.71120 7164 Parking Chgs - Palace Sq 87,251.04 87,927.48 65,617.55120 7167 HPD Parking Lot 16,328.99 18,523.56 13,857.56120 7168 Kailua Elderly Hsg P/Lot (Lani Huli) 109,221.57 94,917.18 72,369.87655 7162 River-Nimitz Parking 126,032.07 125,826.64 86,715.71
Subtotal 4,551,145.70 4,430,124.83 3,838,595.37
CONCESSION PARKING LOT RENT120 7171 Kaimuki Parking Lot Concession 23,596.12 24,005.27 20,007.19360 7595 Parking Auditoriums (NBC) 2,042,805.33 1,909,320.33 1,269,810.12
Subtotal 2,066,401.45 1,933,325.60 1,289,817.31
ATTENDANT PARKING- MGT CO (Net Receipts)120 7153 Kekaulike Dia Hd Blk Pkg 5,896.30 18,061.52 0.00120 7169 Marin Tower Pkg Garage 410,875.19 435,740.18 332,179.19120 7170 Harbor Court Garage 378,589.37 371,717.83 244,408.06120 7638 Kukui Plaza Garage 758,375.03 818,146.37 687,000.00120 7639 Smith-Beretania Parking 86,785.18 96,394.25 66,836.49203 7581 Hale Pauahi Parking 303,418.89 137,901.86 40,197.73 Note A655 7161 Chinatown Gateway Parking 189,783.92 252,677.45 151,039.23
Subtotal 2,133,723.88 2,130,639.46 1,521,660.70
ATTENDANT PARKING-CITY OPERATED (Gross Receipts)230 7134 Hanuama Bay 206,654.00 180,357.00 136,100.00
Total 8,957,925.03 8,674,446.89 6,786,173.38
Note A: The parking rent check is sometimes deposited into the property management company's reserve account.The deposit is approved by Glen Maeda, DFM. The city receives a parking revenue report and a copy of the bank statement.
Source: City and County of Honolulu, 2010.

HONOLULU COMPREHENSIVE PARKING STUDY TASK 4 – PARKING MARKET & FINANCIAL ANALYSIS OCTOBER 21, 2010 37-8151.00
32
ANTICIPATED CHANGES TO PARKING SYSTEM Walker Parking Consultants conducted internal brainstorming sessions aimed at identifying potential opportunities for increasing parking revenues and reducing parking expenses. This exercise was performed with an “eye” toward both the cost to provide parking and the identification of opportunities that are consistent with sound parking planning practices. Parking fees are often in place to encourage and/or discourage certain behavioral patterns and not necessarily to generate income. Stated in order of priority in terms of their potential impact on the City and County budget in the shorter-term, following are the opportunities that the City and County may want to consider: SHORTER-TERM 1. Create a parking enterprise. 2. Modify parking rates.
a. Increase parking rates, both on- and off-street. b. Modify City and County employee parking policy and
increase employee parking rates. 3. Bundle and renegotiate operator agreements. 4. Expand on-street hours of operation – currently enforcing from 7
AM until 6 PM, Monday through Saturday. LONGER-TERM 5. Enhance technology.
a. Upgrade on-street technology to multi-space meters and single space meters, both which should have the capability to accept credit cards.
b. Automate revenue collection and tighten revenue controls. 6. Increase revenues through parking citations.
a. Obtain control of parking enforcement citations income or a portion thereof, increase citations rates, and/or write more parking citations.
b. Increase hours of enforcement. 7. Sell lots. 8. Implement a parking tax. CREATE A PARKING ENTERPRISE We recommend that the City and County consolidate the management of its parking assets to promote a coordination of all parking-related activities, an identification of and consistent implementation of parking management practices, and a focus on parking-related improvements. Non-profits such as universities and municipalities often create auxiliary enterprise funds. These resources are then used to fund parking project capital improvements. By definition, an auxiliary enterprise fund is self-

HONOLULU COMPREHENSIVE PARKING STUDY TASK 4 – PARKING MARKET & FINANCIAL ANALYSIS OCTOBER 21, 2010 37-8151.00
33
sustaining. This means that the auxiliary enterprise fund generates a revenue stream that is sufficient to cover ongoing operating expenses and outstanding debt service obligations. Auxiliary enterprise funds have their own operating budgets. This operating budget is separate from the municipality’s or university’s general fund. These operating budgets include a stream of revenues collected from a variety of sources, including the following:
Municipalities Universities Monthly leases Permit sales Parking meter revenues Parking meter revenues Parking violation revenues Parking violation revenues Transient revenues Transient revenues Transportation fees Reserved parking spaces
Although revenues generated by a new structured parking facility may not be sufficient to fund both the operating expenses and debt service of that particular improvement, revenues from other facilities and sources are pooled together. This revenue pool is sufficient to generate an income stream that permits the solvency of the auxiliary enterprise. Budgeted expenses include the operating costs associated with ongoing parking operations. This may include the labor costs associated with maintenance, security, parking enforcement, revenue collection, management, and administration. Other operating costs may include utilities, supplies, and equipment. The lifespan of a parking structure can often range from 40-50 years or more. However, because the development costs for such a structure are capitalized over a 20-30-year period, there is significant useful life remaining after all debt is retired. This remaining life means that revenues may still be generated by this debt-free facility and that these revenues may be available to offset any new debt service payments that are required to fund new parking projects. There are many parking system auxiliary enterprise funds in operation throughout the U.S. Following are some of the non-profits that operate these funds:
Municipalities Universities City of Cedar Rapids, Iowa Florida State University City of Lincoln, Nebraska University of South Florida City of Detroit, Michigan Penn State University

HONOLULU COMPREHENSIVE PARKING STUDY TASK 4 – PARKING MARKET & FINANCIAL ANALYSIS OCTOBER 21, 2010 37-8151.00
34
City of Tampa, Florida University of Oklahoma City of Denver, Colorado University of New Mexico
ASSUMPTIONS AND IMPACT: It is difficult to place a dollar value on this particular initiative. However, we strongly believe that this change would benefit each of the remaining opportunities. In other words, this particular initiative has some overriding benefits. Without making this single change, it will be more difficult to realize the full benefits of the other opportunities. MODIFY PARKING RATES It is often difficult to gain political acceptance of a parking rate increase at any time, particularly during an economic downturn. People frequently get very emotional about parking, including the rates that they must pay for parking. However, it is instructive to recognize that these emotional responses are typically a product of nothing more than change. Few laypeople understand the true value and cost of parking. With some education and promotion, we believe that a compelling case can be made for a parking rate increase. Following are several legitimate reasons for implementing a rate increase:
1. The City and County is planning the addition of rail transit. To encourage use of public transportation, including the existing City and County bus service and the proposed rail transit service, and to discourage the use of single occupancy vehicles, it behooves the City and County to set parking rates closer to market rates and closer to the cost of providing parking. Parking subsidies serve to encourage more parking and reduce the numbers of people who use public transportation. Therefore, to achieve the City and County transportation goals of mitigating roadway congestion, reducing commute times, and providing cost effective transportation services, parking rate and public transportation rate policies and programs should be coordinated. Parking should not be considered in a vacuum.
2. The City and County have not increased parking rates since 2004 and before 2004, rates had not been increased since 1989. Rates approved in 2004 have not kept pace with inflation which is inconsistent with the inflationary parking system operating costs that the City and County has borne over the 2004-2010 timeframe.
3. As shown in Figure 3, City and County parking rates are priced well below market rates.

HONOLULU COMPREHENSIVE PARKING STUDY TASK 4 – PARKING MARKET & FINANCIAL ANALYSIS OCTOBER 21, 2010 37-8151.00
35
Figure 3: City & County Rates vs. Market Rates
$0
$50
$100
$150
$200
$250
Market Harbor Ct C'town Kekaulike Kukui Hale
Monthly Rate $212 $200 $150 $125 $100 $90
$212$200
$150
$125
$100$90
Source: Walker Parking Consultants, 2010.
4. As shown below, City and County parking rates are priced below several key peer cities.
Figure 4: Median Monthly Rate in U.S.
$0
$50
$100
$150
$200
$250
$300
$350
$400
$450
$500
NYC BOS SF SEA HON LA POR SD U.S. MIA
Monthly Rate $500 $403 $350 $290 $212 $205 $185 $180 $154 $134
$500
$403
$350
$290
$212 $205$185 $180
$154$134
Source: Walker Parking Consultants, 2010.
5. City and County parking garage rates are priced significantly below the cost to provide this parking. A parking space located in a multi-story garage costs well over $250 per month to provide; this includes an amortized cost of the building, amortized real estate costs, and operating expenses.
6. On-street parking has not been priced at rates higher than off-street parking, as argued by sound parking planning principles. Most on-street parking, especially within the City’s Urban Core, is intended to provide short-term parking, while

HONOLULU COMPREHENSIVE PARKING STUDY TASK 4 – PARKING MARKET & FINANCIAL ANALYSIS OCTOBER 21, 2010 37-8151.00
36
many off-street parking spaces are intended to provide long-term parking. The goal is to move long-term parking patrons off-street, to make room for short-term patrons. Short-term patrons are more willing to pay higher rates for more convenient and less frequent and shorter-term parking privileges.
The current City and County off-street parking facilities are priced to provide low cost parking for the first two hours and then charge higher incremental rates for longer-term stays. This is a strategy that is commonly used in retail shopping districts to promote retail trade. We believe that while this may be appropriate for the Chinatown area, it is not an appropriate strategy for the entire downtown.
ASSUMPTIONS AND IMPACT: On-Street Meters – Increase rates by 100%, which is estimated
to yield $2.8 million per year. Average utilization reduced by 25% based on higher price, but rebounds by 12% in the following 2 years (-20%,+10%,+10% for later rate increases).
Metered Lots – Increase rates by 100%, which is estimated to yield $1.24 million per year. Average utilization reduced by 25% based on higher price, but rebounds by 12% in the following 2 years (-20%,+10%,+10% for later rate increases).
Cashiered Facilities – Increase transient rates to $1.25/30 minutes and a $20 daily maximum, which is estimated to move annual transient revenues from $1,692,000 to $2,286,000 (a $594,000 increase). If rates are changed to $1.25/30 minutes for that first 2 hours and $1.50/30 minutes thereafter, up to a $23 daily maximum, transient revenues are estimated to increase from $1,692,000 to $2,351,000 annually (a $659,000 increase).
Monthly Rates. See following table: Table 15: Monthly Rate Increase
Monthly Parking IncrementalCategory Rate Annual Revenue Rate Annual Revenue Revenue Increase
VIP (Police, Etc.) $0 $16 $0 $16 $0$10 Tenant $10 $120 $10 $120 $0$40 Tenant $40 $200,640 $50 $250,800 $50,160$60 Tenant $60 $179,280 $75 $224,100 $44,820$80 Tenant $80 $62,400 $110 $85,800 $23,400$90 Tenant $90 $102,600 $110 $125,400 $22,800$120 Tenant $120 $20,160 $120 $20,160 $0$90 Non-tenant $90 $842,400 $200 $1,872,000 $1,029,600$100 Non-tenant $100 $777,600 $200 $1,555,200 $777,600$125 Non-tenant $125 $438,000 $200 $700,800 $262,800$150 Non-tenant $150 $167,400 $200 $223,200 $55,800$190 Non-tenant $190 $18,240 $200 $19,200 $960TOTALS $2,808,840 $5,076,780 $2,267,940
Current Rate Proposed Rate
Source: Walker Parking Consultants, 2010.

HONOLULU COMPREHENSIVE PARKING STUDY TASK 4 – PARKING MARKET & FINANCIAL ANALYSIS OCTOBER 21, 2010 37-8151.00
37
MODIFY EMPLOYEE PARKING POLICY As shown in Figure 5, City and County employees are parking at rates that are significantly below market and the cost to provide parking. In effect, by allowing City and County employees to park in facilities that the City and County owns, the City and County has chosen to subsidize parking. This conflicts with a goal of increasing the use of public transportation while depleting the general fund. Figure 5: Monthly Parking Rate in U.S.
$0
$50
$100
$150
$200
$250
Market Harbor Ct C'town Kekaulike Kukui Hale C/C Offcls.
C.S. Empl.
Monthly Rate $212 $200 $150 $125 $100 $90 $75 $35
$212$200
$150
$125
$100$90
$75
$35
Source: Walker Parking Consultants, 2010.
Section 15-16.5 of the City and County of Honolulu Ordinance, entitled “City Hall and satellite off-street parking,” states the following:
“Any city official or employee, including any elective or appointive official, and any employee of the civic center child care facility, who applies for and receives a parking permit under this section shall pay a fee for parking in accordance with the following schedule:
Parking Permit Type RateAssigned covered stall $50.00 per monthAssigned covered stall assign to an elected/appointed official or employee of the City and County
$75.00 per month
Unassigned covered stall $35.00 per monthAssigned tandem covered stall $25.00 per monthAssigned uncovered stall $40.00 per monthUnassigned uncovered stall $25.00 per monthUnassigned uncovered satellite stall w/ bus pass for commuting to workplace no less than 3/8 mile away
$20.00 per month
Assigned tandem uncovered stall $15.00 per monthCarpool unassigned covered or uncovered stalls:
Two occupants 75% of specified rateThree occupants 50% of specified rateFour or more occupancys No Charge

HONOLULU COMPREHENSIVE PARKING STUDY TASK 4 – PARKING MARKET & FINANCIAL ANALYSIS OCTOBER 21, 2010 37-8151.00
38
City and County employee parking rates are part of various collective bargaining agreements between the City and County and labor unions including but not necessarily limited to the Hawaii Government Employees Association and United Public Workers. The parking element of the following three union contracts were reviewed:
HGEA, Unit 4 Contract, AFSCME Local 152, AFL-CIO, July 1, 2007 – June 30, 2009: This contract covers City and County white-collar supervisors.
HGEA, Unit 3 Contract, AFSCME Local 152, AFL-CIO, July 1, 2007 – June 30, 2009: This contract covers City and County white-collar employees.
UPW, AFSCME Local 646, AFL-CIO, July 1, 2007 – June 30, 2009: This contract covers City and County non-supervisory, blue collar workers.
The parking provision contained within the two HGEA contracts pertain only to employees who are required to provide a personal vehicle for work purposes as a condition of their employment as determined by the employer. For these employees, the City and County must provide parking for $7.50 per month. The UPW contract contains the following single sentence relating to parking: “Discussions shall be initiated and continued to attempt to improve the severe problems caused by lack of parking spaces for Employees.” We did not find any mention of parking rates in this latter contract. ASSUMPTIONS AND IMPACT: Based on our findings, we are assuming that city council approval is required prior to the implementation of a City and County employee parking rate increase. This analysis assumes that current City and County employee parking rates are doubled from $35 to $70 per month for unreserved parking and from $75 to $150 per month for reserved parking. Even with this 100% increase, these rates are far below market parking rates. This 100% rate increase would yield a net increase of about $400,000 annually (includes Civic Center, Capitol Place, and Pacific Park Plaza).
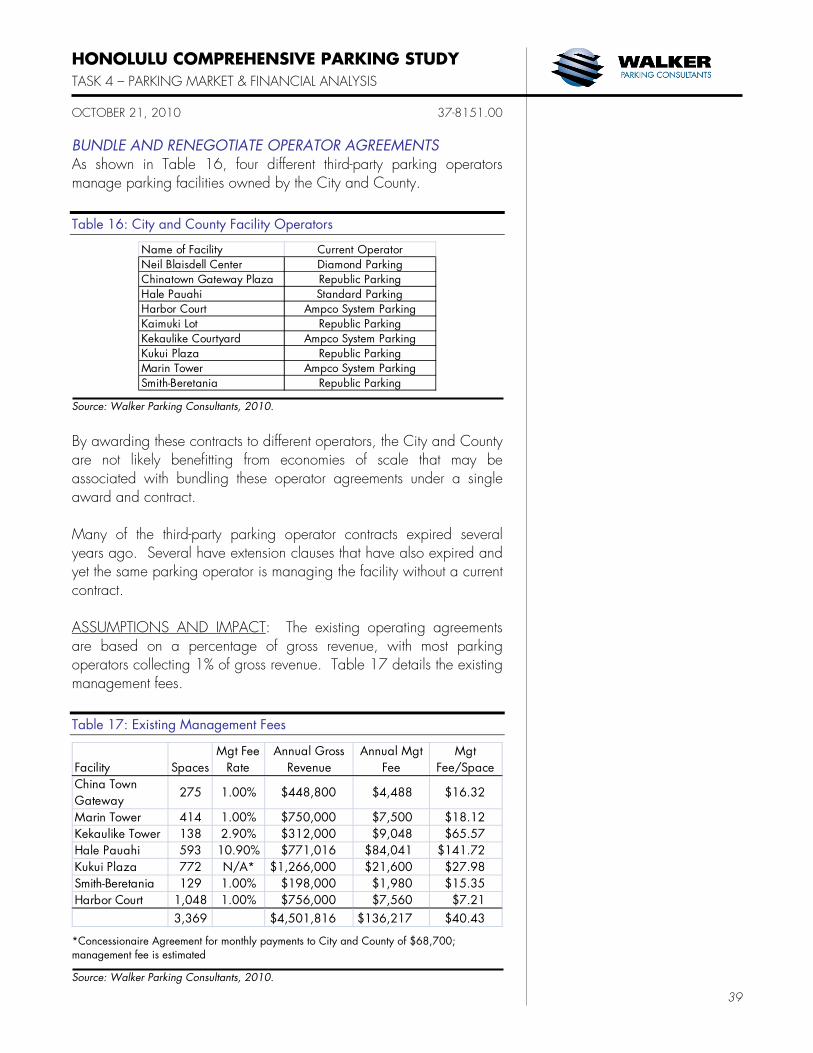
HONOLULU COMPREHENSIVE PARKING STUDY TASK 4 – PARKING MARKET & FINANCIAL ANALYSIS OCTOBER 21, 2010 37-8151.00
39
BUNDLE AND RENEGOTIATE OPERATOR AGREEMENTS As shown in Table 16, four different third-party parking operators manage parking facilities owned by the City and County. Table 16: City and County Facility Operators
Name of Facility Current OperatorNeil Blaisdell Center Diamond ParkingChinatown Gateway Plaza Republic ParkingHale Pauahi Standard ParkingHarbor Court Ampco System ParkingKaimuki Lot Republic ParkingKekaulike Courtyard Ampco System ParkingKukui Plaza Republic ParkingMarin Tower Ampco System ParkingSmith-Beretania Republic Parking
Source: Walker Parking Consultants, 2010.
By awarding these contracts to different operators, the City and County are not likely benefitting from economies of scale that may be associated with bundling these operator agreements under a single award and contract. Many of the third-party parking operator contracts expired several years ago. Several have extension clauses that have also expired and yet the same parking operator is managing the facility without a current contract. ASSUMPTIONS AND IMPACT: The existing operating agreements are based on a percentage of gross revenue, with most parking operators collecting 1% of gross revenue. Table 17 details the existing management fees. Table 17: Existing Management Fees
Facility SpacesMgt Fee
RateAnnual Gross
RevenueAnnual Mgt
FeeMgt
Fee/SpaceChina Town Gateway
275 1.00% $448,800 $4,488 $16.32
Marin Tower 414 1.00% $750,000 $7,500 $18.12Kekaulike Tower 138 2.90% $312,000 $9,048 $65.57Hale Pauahi 593 10.90% $771,016 $84,041 $141.72Kukui Plaza 772 N/A* $1,266,000 $21,600 $27.98Smith-Beretania 129 1.00% $198,000 $1,980 $15.35Harbor Court 1,048 1.00% $756,000 $7,560 $7.21
3,369 $4,501,816 $136,217 $40.43
*Concessionaire Agreement for monthly payments to City and County of $68,700; management fee is estimated
Source: Walker Parking Consultants, 2010.
HONOLULU COMPREHENSIVE PARKING STUDY TASK 4 – PARKING MARKET & FINANCIAL ANALYSIS OCTOBER 21, 2010 37-8151.00
40
If we remove the outliers (Hale Pauahi, Kukui Plaza concessionaire agreement), we find a management fee per space of $15.26/space. According to Walker’s database, this amount is lower than the national average, but the overall $40.43 is well above the national average. We must also take into consideration the transient versus monthly volumes in these facilities; monthly parking is much less labor intensive and therefore demands a lower management fee. Many of these facilities are heavy on the monthly side, so a lower management fee is warranted. We have also suggested that once automated, labor can be pooled further to reduce costs and the need for active management. We suggest that a single management contract be assembled for the entire system, and that the management fee be based on the number of spaces being managed, not the amount of revenue. The rate that we propose is $20.00/space annually with an annual increase based on the rate of inflation. We also suggest that this agreement be put out to bid every three (3) years to maintain some consistency in the operation, but also allow for a competitive process. The change in format may yield approximately $69,000 in additional annual receipts to the City and County (based on no rate increase). INCREASE HOURS OF OPERATION The City and County hours of parking meter enforcement begin at 7 AM and conclude at 6 PM, Monday through Saturday. On Sundays and public holidays, metered parking is available free of charge. We considered expanding meter hours to include Sundays and public holidays, but did not complete this analysis because we do not believe that there is a precedent that would support this change. We are unaware of any major U.S. city that enforces parking meter payments on Sundays and holidays. The City of San Francisco, one of the more progressive cities when it comes to on-street meter policies, has recently discussed charging on Sundays. This concept has not yet gained widespread acceptance and at this point, it appears unlikely that this initiative will move forward in the near future. We do believe that there may be an opportunity to charge for on-street parking during evenings in the Waikiki area only. There are many retail shops and restaurants in this area that drive high volumes of evening parking demand. To encourage parking space turnover in this area, while at the same time creating an additional revenue source for the City and County, we believe that meter operating hours and enforcement in this area may be extended to 10 PM.

HONOLULU COMPREHENSIVE PARKING STUDY TASK 4 – PARKING MARKET & FINANCIAL ANALYSIS OCTOBER 21, 2010 37-8151.00
41
ASSUMPTIONS AND IMPACT: We project that by extending on-street enforcement hours in the Waikiki zone from 7 AM to 10 PM, Monday through Saturday, the City and County may realize about $300,000 (with no rate increase) or $470,000 annually (with rate increase). The added manpower would cost an estimated $40,000 annually. An annual net increase of $260,000 to $430,000 is estimated. ENHANCE TECHNOLOGY To our knowledge, no City and County parking facilities, including lots, garages, and on-street meters, accept credit cards as a method of payment. In this sense, the City and County parking facilities lag behind up-to-date technology. Other key peer cities, including Los Angeles, Portland, San Francisco, and Seattle accept credit cards. Our study of seven cities that accept credit cards for on-street parking demonstrates that the introduction of credit cards has increased parking revenues by anywhere from 17 to 93%, with the typical increase being a 32% increase in parking revenues. There are several reasons that credit card holders fuel higher parking revenues: 1) studies have shown that people often spend more when using their credit card than when paying for cash, regardless of the good or service purchased; 2) parking patrons will often charge the maximum allowable rate on their credit card; when paying by cash, this occurs less often because patrons do not always have sufficient coinage available to feed a parking meter; and 3) parking operations that accept credit cards often attract patrons from other parking operations where credit cards are not accepted. Credit cards also reduce the amount of cash handling that is required of parking attendants, parking facility managers, and accounting staff. This reduction in cash handling improves revenue controls, thereby, reducing the amount of shrinkage. If the City and County decides to accept credit cards for parking fees, it can expect its operating expenses to increase. There will be fees associated with hardware and software upgrades, plus credit card processing fees. However, the revenue upside exceeds this increase in expenses. Also, labor costs may decrease because the parking meters will need to be emptied less frequently. We recommend that City and County parking facilities be modified to accept credit cards as a method of payment. This is a win-win for both the City and County and the parking patron.

HONOLULU COMPREHENSIVE PARKING STUDY TASK 4 – PARKING MARKET & FINANCIAL ANALYSIS OCTOBER 21, 2010 37-8151.00
42
ASSUMPTIONS AND IMPACT: Current annual revenue from metered parking is roughly $4.5 million. A technology upgrade to allow for credit card acceptance would increase that sum by an estimated $1.44 million annually. Based on the Parking Meter System Definition provided to the City and County by Walker, the capital expense to upgrade would be roughly $2.13 million (Option 2B), which would be spread over 8 years (roughly $380,000 annually). The annual net increase is estimated to be about $1.4 million. AUTOMATE REVENUE COLLECTION Parking operators worldwide have discovered opportunities for expense control through the installation and use of pay on foot and auto-cashiering systems. Pay-on-foot (POF) systems require the patron to take their ticket to a pay-station to pay for their parking before exiting. This saves on cashier wages and provides 24-hour revenue collection. Specialized equipment includes the following: On-line magnetically encoded ticket dispensers Pay stations at logical pedestrian points Signage explaining directions for payment at pay stations and
posted at the entrance, ticket spitters, elevators, and stairwells Exit verifiers with credit card acceptance in the exit lanes Equipment connected to the main parking computer to track
revenue and equipment status
Auto-cashiering systems require payment from the vehicle at the exit lane. These work well in low traffic situations. However, in cases where traffic volumes are heavy, pay-on-foot systems work much better as these have higher throughput rates. Benefits to this type of system are the reduced payroll costs, and management requirements that accompany the additional employees, as well as the increased security of the parking revenue. The disadvantage is the initial cost of the equipment, future maintenance costs, and acceptance issues of the equipment by the public. However, automation of collecting parking revenues is no longer a new technology. Many parking operators, including public parking operators, have embraced the installation and use of this technology. ASSUMPTIONS AND IMPACT: Annual revenues collected from cashiered parking are roughly $2.13 million. Automation increases revenue control, which is estimated to increase gross revenue by roughly 10%, or $213,000 annually. Automation would also allow for pooled staffing. Personnel expenses total $70,000 per month for

HONOLULU COMPREHENSIVE PARKING STUDY TASK 4 – PARKING MARKET & FINANCIAL ANALYSIS OCTOBER 21, 2010 37-8151.00
43
the cashiered parking facilities. Therefore, pooling resources would allow for a reduction in cost of 2.5 times, or $42,000 monthly, which equates to $504,000 annually. The equipment upgrade would cost an estimated $625,000, which would be spread over 7 years (roughly $90,000 annually). The annual net revenue increase is estimated to be about $627,000. OBTAIN CONTROL OF PARKING ENFORCEMENT CITATIONS The State of Hawaii collects 100% of income associated with parking violation citations issued by the City and County. The genesis of this policy decision is rooted in the State’s cost of adjudicating all cases involving parking violations. In other words, the State successfully made the case to the City and County that since it was paying court costs to adjudicate parking tickets, then it should receive the parking violation citations income. One potential opportunity that could generate significant dollars for the State and/or the City and County is to evaluate and modify the existing parking violation citations program. It is possible that parking violation citation rates have not been increased in some time and it could be time to increase citation rates. Moreover, through improvements in revenue collection procedures and improvements in productivity, there may be upside potential. This upside could be significant. Although it appears unlikely that the State would willingly forego this existing revenue source, we suggest that the State be contacted to inquire about the possibility of a jointly-sponsored State/City and County study. The purpose of such study is to explore the upside potential and a potential revenue sharing agreement between the two parties. Although the State may be unwilling to forego any of its existing parking violation citations revenue stream, it may be willing to part with all or a portion of any incremental net operating income generated through changes to this program. One key argument for eliciting the State’s support for a joint study is the fact that the City and County have reported that its HPD is not duly motivated to issue many parking tickets because it does not earn revenues (or offset expenses) from parking tickets. Combining this knowledge with the tendency of police officers to focus on more serious crimes other than parking violations, and it is highly probable that significant improvements and increased net incomes could be realized through some changes. More parking citations can lead to more income. It is highly probable that an insufficient number of citations are being issued for at least two reasons; 1) the HPD prefers to focus on crimes more serious than
HONOLULU COMPREHENSIVE PARKING STUDY TASK 4 – PARKING MARKET & FINANCIAL ANALYSIS OCTOBER 21, 2010 37-8151.00
44
parking and 2) the State collects all of the parking violation citations income. ASSUMPTIONS AND IMPACT: At this time, our analysis assumes no changes to the status quo. This analysis assumes that the revenue collected from parking violation citations continues to flow to the State of Hawaii. We recommend that this issue be further studied. There could be significant potential for increased revenues if the State is willing to negotiate a revenue sharing agreement with the City and County. To avoid a scenario where the State gives up revenues, we suggest a win-win type of negotiation. PRO FORMA OPERATING STATEMENT Walker prepared pro forma operating statements for two scenarios; 1) Maintain Current Operation (Table 18), and 2) Apply Walker-Suggested Changes (Table 19). These operating statements both consider:
1. 3% annual increase in operating expenses (after any changes in staffing or capital expenditures for equipment are applied)
2. The City and County will maintain the structural system of the structured parking based on the schedule provided in Walker’s conditions assessment, extending the useful life of the structured parking.
3. The physical parking supply with neither expand nor contract during the pro forma period. Changes in operating revenue or operating expense will only reflect differing rate structure, management, or form of rate collection.
Aside from the three base assumptions above, rates, management, technology, etc. have all been adjusted from Table 18 to Table 19 based on the discussions throughout this section and provided within the “ASSUMPTIONS AND IMPACT” for each recommended change.
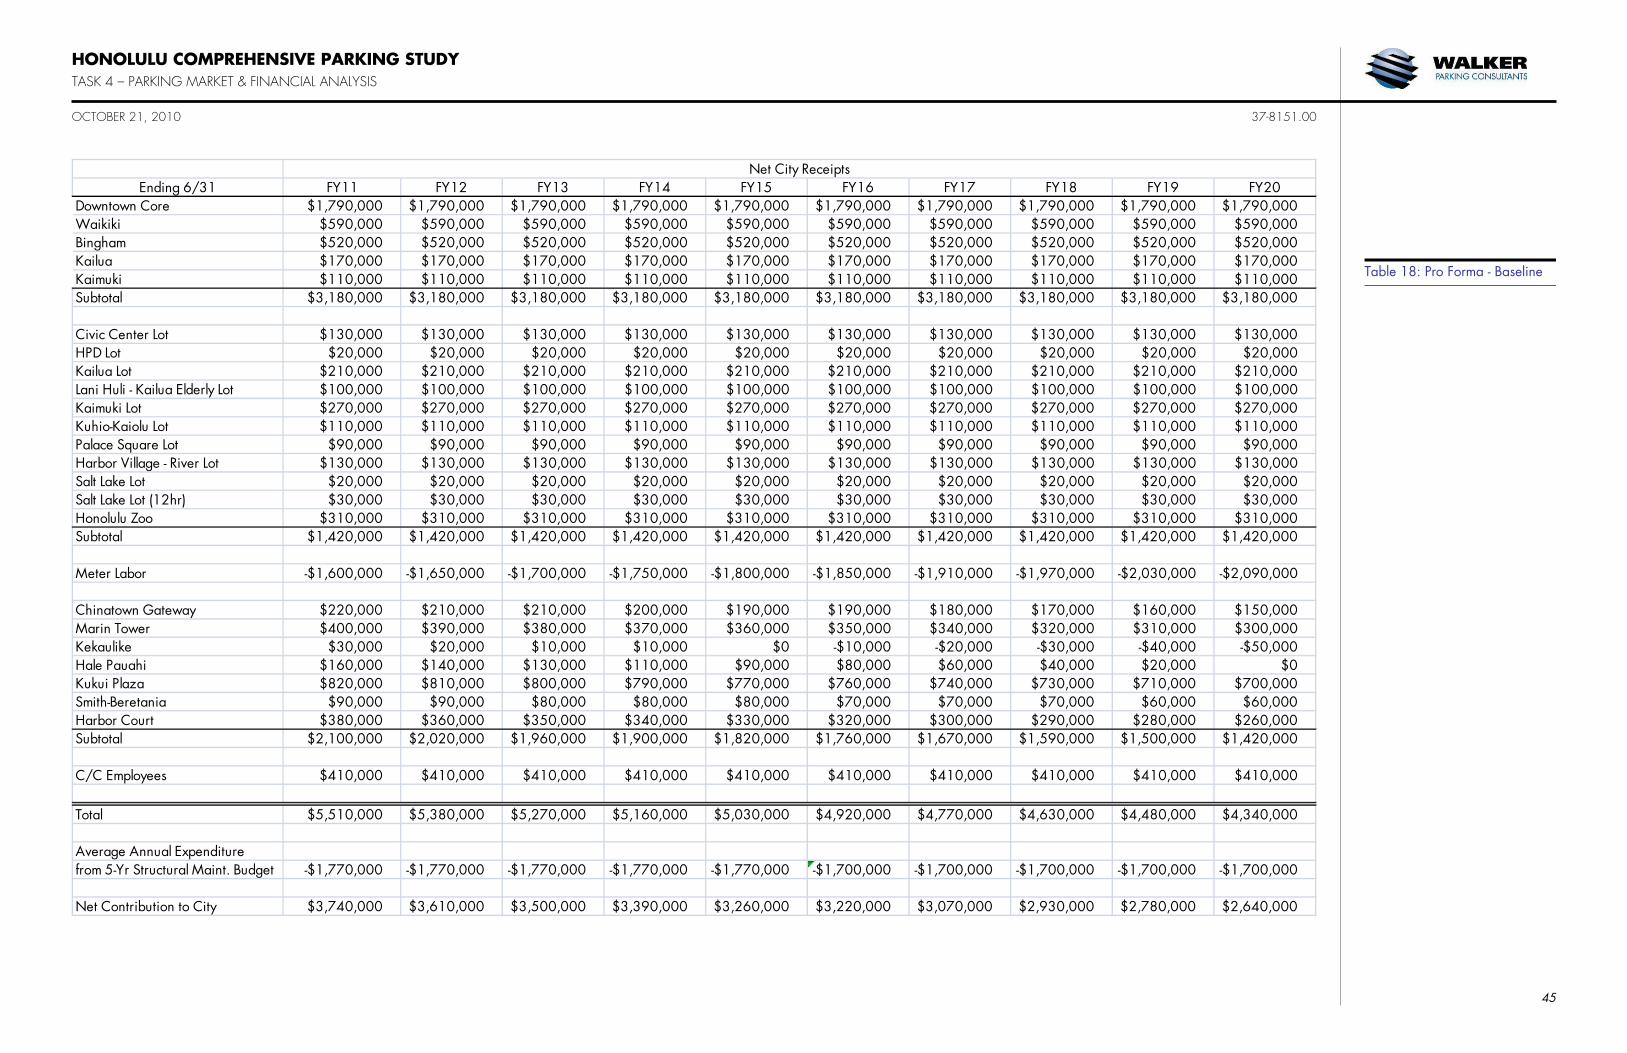
HONOLULU COMPREHENSIVE PARKING STUDY TASK 4 – PARKING MARKET & FINANCIAL ANALYSIS OCTOBER 21, 2010 37-8151.00
45
Ending 6/31 FY11 FY12 FY13 FY14 FY15 FY16 FY17 FY18 FY19 FY20Downtown Core $1,790,000 $1,790,000 $1,790,000 $1,790,000 $1,790,000 $1,790,000 $1,790,000 $1,790,000 $1,790,000 $1,790,000Waikiki $590,000 $590,000 $590,000 $590,000 $590,000 $590,000 $590,000 $590,000 $590,000 $590,000Bingham $520,000 $520,000 $520,000 $520,000 $520,000 $520,000 $520,000 $520,000 $520,000 $520,000Kailua $170,000 $170,000 $170,000 $170,000 $170,000 $170,000 $170,000 $170,000 $170,000 $170,000Kaimuki $110,000 $110,000 $110,000 $110,000 $110,000 $110,000 $110,000 $110,000 $110,000 $110,000Subtotal $3,180,000 $3,180,000 $3,180,000 $3,180,000 $3,180,000 $3,180,000 $3,180,000 $3,180,000 $3,180,000 $3,180,000
Civic Center Lot $130,000 $130,000 $130,000 $130,000 $130,000 $130,000 $130,000 $130,000 $130,000 $130,000HPD Lot $20,000 $20,000 $20,000 $20,000 $20,000 $20,000 $20,000 $20,000 $20,000 $20,000Kailua Lot $210,000 $210,000 $210,000 $210,000 $210,000 $210,000 $210,000 $210,000 $210,000 $210,000Lani Huli - Kailua Elderly Lot $100,000 $100,000 $100,000 $100,000 $100,000 $100,000 $100,000 $100,000 $100,000 $100,000Kaimuki Lot $270,000 $270,000 $270,000 $270,000 $270,000 $270,000 $270,000 $270,000 $270,000 $270,000Kuhio-Kaiolu Lot $110,000 $110,000 $110,000 $110,000 $110,000 $110,000 $110,000 $110,000 $110,000 $110,000Palace Square Lot $90,000 $90,000 $90,000 $90,000 $90,000 $90,000 $90,000 $90,000 $90,000 $90,000Harbor Village - River Lot $130,000 $130,000 $130,000 $130,000 $130,000 $130,000 $130,000 $130,000 $130,000 $130,000Salt Lake Lot $20,000 $20,000 $20,000 $20,000 $20,000 $20,000 $20,000 $20,000 $20,000 $20,000Salt Lake Lot (12hr) $30,000 $30,000 $30,000 $30,000 $30,000 $30,000 $30,000 $30,000 $30,000 $30,000Honolulu Zoo $310,000 $310,000 $310,000 $310,000 $310,000 $310,000 $310,000 $310,000 $310,000 $310,000Subtotal $1,420,000 $1,420,000 $1,420,000 $1,420,000 $1,420,000 $1,420,000 $1,420,000 $1,420,000 $1,420,000 $1,420,000
Meter Labor -$1,600,000 -$1,650,000 -$1,700,000 -$1,750,000 -$1,800,000 -$1,850,000 -$1,910,000 -$1,970,000 -$2,030,000 -$2,090,000
Chinatown Gateway $220,000 $210,000 $210,000 $200,000 $190,000 $190,000 $180,000 $170,000 $160,000 $150,000Marin Tower $400,000 $390,000 $380,000 $370,000 $360,000 $350,000 $340,000 $320,000 $310,000 $300,000Kekaulike $30,000 $20,000 $10,000 $10,000 $0 -$10,000 -$20,000 -$30,000 -$40,000 -$50,000Hale Pauahi $160,000 $140,000 $130,000 $110,000 $90,000 $80,000 $60,000 $40,000 $20,000 $0Kukui Plaza $820,000 $810,000 $800,000 $790,000 $770,000 $760,000 $740,000 $730,000 $710,000 $700,000Smith-Beretania $90,000 $90,000 $80,000 $80,000 $80,000 $70,000 $70,000 $70,000 $60,000 $60,000Harbor Court $380,000 $360,000 $350,000 $340,000 $330,000 $320,000 $300,000 $290,000 $280,000 $260,000Subtotal $2,100,000 $2,020,000 $1,960,000 $1,900,000 $1,820,000 $1,760,000 $1,670,000 $1,590,000 $1,500,000 $1,420,000
C/C Employees $410,000 $410,000 $410,000 $410,000 $410,000 $410,000 $410,000 $410,000 $410,000 $410,000
Total $5,510,000 $5,380,000 $5,270,000 $5,160,000 $5,030,000 $4,920,000 $4,770,000 $4,630,000 $4,480,000 $4,340,000
Average Annual Expenditure from 5-Yr Structural Maint. Budget -$1,770,000 -$1,770,000 -$1,770,000 -$1,770,000 -$1,770,000 -$1,700,000 -$1,700,000 -$1,700,000 -$1,700,000 -$1,700,000
Net Contribution to City $3,740,000 $3,610,000 $3,500,000 $3,390,000 $3,260,000 $3,220,000 $3,070,000 $2,930,000 $2,780,000 $2,640,000
Net City Receipts
Table 18: Pro Forma - Baseline

HONOLULU COMPREHENSIVE PARKING STUDY TASK 4 – PARKING MARKET & FINANCIAL ANALYSIS OCTOBER 21, 2010 37-8151.00
46
Ending 6/31 FY21 FY22 FY23 FY24 FY25 FY26 FY27 FY28 FY29 FY30Downtown Core $1,790,000 $1,790,000 $1,790,000 $1,790,000 $1,790,000 $1,790,000 $1,790,000 $1,790,000 $1,790,000 $1,790,000Waikiki $590,000 $590,000 $590,000 $590,000 $590,000 $590,000 $590,000 $590,000 $590,000 $590,000Bingham $520,000 $520,000 $520,000 $520,000 $520,000 $520,000 $520,000 $520,000 $520,000 $520,000Kailua $170,000 $170,000 $170,000 $170,000 $170,000 $170,000 $170,000 $170,000 $170,000 $170,000Kaimuki $110,000 $110,000 $110,000 $110,000 $110,000 $110,000 $110,000 $110,000 $110,000 $110,000Subtotal $3,180,000 $3,180,000 $3,180,000 $3,180,000 $3,180,000 $3,180,000 $3,180,000 $3,180,000 $3,180,000 $3,180,000
Civic Center Lot $130,000 $130,000 $130,000 $130,000 $130,000 $130,000 $130,000 $130,000 $130,000 $130,000HPD Lot $20,000 $20,000 $20,000 $20,000 $20,000 $20,000 $20,000 $20,000 $20,000 $20,000Kailua Lot $210,000 $210,000 $210,000 $210,000 $210,000 $210,000 $210,000 $210,000 $210,000 $210,000Lani Huli - Kailua Elderly Lot $100,000 $100,000 $100,000 $100,000 $100,000 $100,000 $100,000 $100,000 $100,000 $100,000Kaimuki Lot $270,000 $270,000 $270,000 $270,000 $270,000 $270,000 $270,000 $270,000 $270,000 $270,000Kuhio-Kaiolu Lot $110,000 $110,000 $110,000 $110,000 $110,000 $110,000 $110,000 $110,000 $110,000 $110,000Palace Square Lot $90,000 $90,000 $90,000 $90,000 $90,000 $90,000 $90,000 $90,000 $90,000 $90,000Harbor Village - River Lot $130,000 $130,000 $130,000 $130,000 $130,000 $130,000 $130,000 $130,000 $130,000 $130,000Salt Lake Lot $20,000 $20,000 $20,000 $20,000 $20,000 $20,000 $20,000 $20,000 $20,000 $20,000Salt Lake Lot (12hr) $30,000 $30,000 $30,000 $30,000 $30,000 $30,000 $30,000 $30,000 $30,000 $30,000Honolulu Zoo $310,000 $310,000 $310,000 $310,000 $310,000 $310,000 $310,000 $310,000 $310,000 $310,000Subtotal $1,420,000 $1,420,000 $1,420,000 $1,420,000 $1,420,000 $1,420,000 $1,420,000 $1,420,000 $1,420,000 $1,420,000
Meter Labor -$2,150,000 -$2,210,000 -$2,280,000 -$2,350,000 -$2,420,000 -$2,490,000 -$2,570,000 -$2,640,000 -$2,720,000 -$2,810,000
Chinatown Gateway $140,000 $130,000 $130,000 $120,000 $110,000 $100,000 $90,000 $70,000 $60,000 $50,000Marin Tower $290,000 $270,000 $260,000 $240,000 $230,000 $210,000 $200,000 $180,000 $160,000 $150,000Kekaulike -$60,000 -$70,000 -$90,000 -$100,000 -$110,000 -$120,000 -$130,000 -$150,000 -$160,000 -$170,000Hale Pauahi -$20,000 -$40,000 -$60,000 -$90,000 -$110,000 -$130,000 -$160,000 -$180,000 -$210,000 -$240,000Kukui Plaza $680,000 $660,000 $650,000 $630,000 $610,000 $590,000 $570,000 $550,000 $530,000 $510,000Smith-Beretania $60,000 $50,000 $50,000 $40,000 $40,000 $30,000 $30,000 $20,000 $20,000 $10,000Harbor Court $250,000 $230,000 $220,000 $200,000 $190,000 $170,000 $150,000 $130,000 $110,000 $100,000Subtotal $1,340,000 $1,230,000 $1,160,000 $1,040,000 $960,000 $850,000 $750,000 $620,000 $510,000 $410,000
C/C Employees $410,000 $410,000 $410,000 $410,000 $410,000 $410,000 $410,000 $410,000 $410,000 $410,000
Total $4,200,000 $4,030,000 $3,890,000 $3,700,000 $3,550,000 $3,370,000 $3,190,000 $2,990,000 $2,800,000 $2,610,000
Average Annual Expenditure from 5-Yr Structural Maint. Budget -$1,080,000 -$1,080,000 -$1,080,000 -$1,080,000 -$1,080,000 -$700,000 -$700,000 -$700,000 -$700,000 -$700,000
Net Contribution to City $3,120,000 $2,950,000 $2,810,000 $2,620,000 $2,470,000 $2,670,000 $2,490,000 $2,290,000 $2,100,000 $1,910,000
Net City Receipts

HONOLULU COMPREHENSIVE PARKING STUDY TASK 4 – PARKING MARKET & FINANCIAL ANALYSIS OCTOBER 21, 2010 37-8151.00
47
Ending 6/31 FY11 FY12 FY13 FY14 FY15 FY16 FY17 FY18 FY19 FY20Downtown Core $1,790,000 $2,680,000 $3,010,000 $3,370,000 $3,370,000 $3,140,000 $3,460,000 $3,800,000 $3,800,000 $3,910,000Waikiki $590,000 $1,270,000 $1,420,000 $1,590,000 $1,590,000 $1,490,000 $1,630,000 $1,800,000 $1,800,000 $1,850,000Bingham $520,000 $770,000 $870,000 $970,000 $970,000 $910,000 $1,000,000 $1,100,000 $1,100,000 $1,380,000Kailua $170,000 $250,000 $280,000 $320,000 $320,000 $300,000 $330,000 $360,000 $360,000 $450,000Kaimuki $110,000 $160,000 $180,000 $200,000 $200,000 $190,000 $210,000 $230,000 $230,000 $290,000Subtotal $3,180,000 $5,130,000 $5,760,000 $6,450,000 $6,450,000 $6,030,000 $6,630,000 $7,290,000 $7,290,000 $7,880,000
Civic Center Lot $130,000 $190,000 $210,000 $240,000 $260,000 $260,000 $260,000 $280,000 $280,000 $280,000HPD Lot $20,000 $30,000 $30,000 $30,000 $40,000 $40,000 $40,000 $40,000 $40,000 $40,000Kailua Lot $210,000 $320,000 $350,000 $400,000 $440,000 $440,000 $440,000 $470,000 $470,000 $470,000Lani Huli - Kailua Elderly Lot $100,000 $150,000 $170,000 $190,000 $210,000 $210,000 $210,000 $230,000 $230,000 $230,000Kaimuki Lot $270,000 $410,000 $450,000 $510,000 $560,000 $560,000 $560,000 $610,000 $610,000 $610,000Kuhio-Kaiolu Lot $110,000 $160,000 $180,000 $200,000 $220,000 $220,000 $220,000 $240,000 $240,000 $240,000Palace Square Lot $90,000 $140,000 $150,000 $170,000 $190,000 $190,000 $190,000 $210,000 $210,000 $210,000Harbor Village - River Lot $130,000 $190,000 $210,000 $240,000 $260,000 $260,000 $260,000 $290,000 $290,000 $290,000Salt Lake Lot $20,000 $30,000 $40,000 $40,000 $40,000 $40,000 $40,000 $50,000 $50,000 $50,000Salt Lake Lot (12hr) $30,000 $50,000 $50,000 $60,000 $60,000 $60,000 $60,000 $60,000 $60,000 $60,000Honolulu Zoo $310,000 $460,000 $510,000 $570,000 $630,000 $630,000 $630,000 $690,000 $690,000 $690,000Subtotal $1,420,000 $2,130,000 $2,350,000 $2,650,000 $2,910,000 $2,910,000 $2,910,000 $3,170,000 $3,170,000 $3,170,000
New Meter CapEx -$380,000 -$380,000 -$380,000 -$380,000 -$380,000 -$380,000 -$380,000 -$380,000 $0 $0Meter Labor -$1,600,000 -$1,690,000 -$1,740,000 -$1,790,000 -$1,850,000 -$1,900,000 -$1,960,000 -$2,020,000 -$2,080,000 -$2,140,000
Chinatown Gateway $440,000 $430,000 $430,000 $480,000 $480,000 $470,000 $530,000 $520,000 $520,000 $590,000Marin Tower $740,000 $730,000 $720,000 $820,000 $810,000 $800,000 $910,000 $890,000 $880,000 $1,000,000Kekaulike $160,000 $150,000 $140,000 $180,000 $170,000 $160,000 $200,000 $190,000 $180,000 $220,000Hale Pauahi $790,000 $770,000 $760,000 $870,000 $860,000 $840,000 $970,000 $950,000 $930,000 $1,070,000Kukui Plaza $1,820,000 $1,810,000 $1,790,000 $2,000,000 $1,990,000 $1,970,000 $2,210,000 $2,190,000 $2,180,000 $2,430,000Smith-Beretania $210,000 $200,000 $200,000 $230,000 $230,000 $220,000 $250,000 $250,000 $250,000 $280,000Harbor Court $1,100,000 $1,090,000 $1,080,000 $1,210,000 $1,200,000 $1,190,000 $1,340,000 $1,320,000 $1,310,000 $1,470,000Subtotal $5,260,000 $5,180,000 $5,120,000 $5,790,000 $5,740,000 $5,650,000 $6,410,000 $6,310,000 $6,250,000 $7,060,000
Automation CapEx -$90,000 -$90,000 -$90,000 -$90,000 -$90,000 -$90,000 -$90,000 $0 $0 $0Decrease in Labor Expense $500,000 $500,000 $500,000 $500,000 $500,000 $500,000 $500,000 $500,000 $500,000 $500,000
C/C Employees $410,000 $410,000 $410,000 $410,000 $410,000 $410,000 $410,000 $410,000 $410,000 $410,000
Total Net Operating Income $8,700,000 $11,190,000 $11,930,000 $13,540,000 $13,690,000 $13,130,000 $14,430,000 $15,280,000 $15,540,000 $16,880,000
Average Annual Expenditure from 5-Yr Structural Maint. Budget -$1,770,000 -$1,770,000 -$1,770,000 -$1,770,000 -$1,770,000 -$1,700,000 -$1,700,000 -$1,700,000 -$1,700,000 -$1,700,000
Net Contribution to City $6,930,000 $9,420,000 $10,160,000 $11,770,000 $11,920,000 $11,430,000 $12,730,000 $13,580,000 $13,840,000 $15,180,000
Net City Receipts
Table 19: Pro Forma - Walker

HONOLULU COMPREHENSIVE PARKING STUDY TASK 4 – PARKING MARKET & FINANCIAL ANALYSIS OCTOBER 21, 2010 37-8151.00
48
Ending 6/31 FY21 FY22 FY23 FY24 FY25 FY26 FY27 FY28 FY29 FY30Downtown Core $4,300,000 $4,730,000 $4,730,000 $4,630,000 $5,090,000 $5,600,000 $5,600,000 $5,290,000 $5,820,000 $6,400,000Waikiki $2,030,000 $2,240,000 $2,240,000 $2,190,000 $2,410,000 $2,650,000 $2,650,000 $2,500,000 $2,750,000 $3,030,000Bingham $1,520,000 $1,670,000 $1,670,000 $1,820,000 $2,000,000 $2,200,000 $2,200,000 $2,230,000 $2,450,000 $2,700,000Kailua $500,000 $550,000 $550,000 $600,000 $660,000 $720,000 $720,000 $730,000 $800,000 $880,000Kaimuki $320,000 $350,000 $350,000 $380,000 $420,000 $460,000 $460,000 $470,000 $510,000 $560,000Subtotal $8,670,000 $9,540,000 $9,540,000 $9,620,000 $10,580,000 $11,630,000 $11,630,000 $11,220,000 $12,330,000 $13,570,000
Civic Center Lot $310,000 $310,000 $310,000 $340,000 $340,000 $340,000 $380,000 $380,000 $380,000 $420,000HPD Lot $40,000 $40,000 $40,000 $50,000 $50,000 $50,000 $50,000 $50,000 $50,000 $60,000Kailua Lot $510,000 $510,000 $510,000 $570,000 $570,000 $570,000 $630,000 $630,000 $630,000 $700,000Lani Huli - Kailua Elderly Lot $250,000 $250,000 $250,000 $270,000 $270,000 $270,000 $300,000 $300,000 $300,000 $330,000Kaimuki Lot $660,000 $660,000 $660,000 $730,000 $730,000 $730,000 $810,000 $810,000 $810,000 $900,000Kuhio-Kaiolu Lot $260,000 $260,000 $260,000 $290,000 $290,000 $290,000 $320,000 $320,000 $320,000 $360,000Palace Square Lot $220,000 $220,000 $220,000 $250,000 $250,000 $250,000 $280,000 $280,000 $280,000 $310,000Harbor Village - River Lot $320,000 $320,000 $320,000 $350,000 $350,000 $350,000 $380,000 $380,000 $380,000 $420,000Salt Lake Lot $50,000 $50,000 $50,000 $60,000 $60,000 $60,000 $70,000 $70,000 $70,000 $70,000Salt Lake Lot (12hr) $70,000 $70,000 $70,000 $70,000 $70,000 $70,000 $90,000 $90,000 $90,000 $100,000Honolulu Zoo $760,000 $760,000 $760,000 $830,000 $830,000 $830,000 $920,000 $920,000 $920,000 $1,000,000Subtotal $3,450,000 $3,450,000 $3,450,000 $3,810,000 $3,810,000 $3,810,000 $4,230,000 $4,230,000 $4,230,000 $4,670,000
$0 $0 $0 $0 $0 $0 $0 $0 $0 $0Meter Labor -$2,200,000 -$2,270,000 -$2,340,000 -$2,410,000 -$2,480,000 -$2,560,000 -$2,630,000 -$2,710,000 -$2,790,000 -$2,880,000
Chinatown Gateway $580,000 $570,000 $650,000 $640,000 $630,000 $710,000 $700,000 $700,000 $790,000 $780,000Marin Tower $980,000 $970,000 $1,100,000 $1,090,000 $1,070,000 $1,220,000 $1,200,000 $1,180,000 $1,340,000 $1,320,000Kekaulike $210,000 $200,000 $240,000 $230,000 $220,000 $270,000 $260,000 $240,000 $300,000 $290,000Hale Pauahi $1,050,000 $1,020,000 $1,180,000 $1,160,000 $1,130,000 $1,300,000 $1,280,000 $1,250,000 $1,440,000 $1,410,000Kukui Plaza $2,410,000 $2,400,000 $2,680,000 $2,660,000 $2,640,000 $2,950,000 $2,930,000 $2,910,000 $3,250,000 $3,230,000Smith-Beretania $280,000 $270,000 $310,000 $300,000 $300,000 $340,000 $330,000 $330,000 $370,000 $370,000Harbor Court $1,460,000 $1,450,000 $1,620,000 $1,610,000 $1,590,000 $1,790,000 $1,770,000 $1,760,000 $1,970,000 $1,950,000Subtotal $6,970,000 $6,880,000 $7,780,000 $7,690,000 $7,580,000 $8,580,000 $8,470,000 $8,370,000 $9,460,000 $9,350,000
Automation CapEx $0 $0 $0 $0 $0 $0 $0 $0 $0 $0Decrease in Labor Expense $500,000 $500,000 $500,000 $500,000 $500,000 $500,000 $500,000 $500,000 $500,000 $500,000
C/C Employees $410,000 $410,000 $410,000 $410,000 $410,000 $410,000 $410,000 $410,000 $410,000 $410,000
Total Net Operating Income $17,800,000 $18,510,000 $19,340,000 $19,620,000 $20,400,000 $22,370,000 $22,610,000 $22,020,000 $24,140,000 $25,620,000
Average Annual Expenditure from 5-Yr Structural Maint. Budget -$1,080,000 -$1,080,000 -$1,080,000 -$1,080,000 -$1,080,000 -$700,000 -$700,000 -$700,000 -$700,000 -$700,000
Net Contribution to City $16,720,000 $17,430,000 $18,260,000 $18,540,000 $19,320,000 $21,670,000 $21,910,000 $21,320,000 $23,440,000 $24,920,000
Net City Receipts

HONOLULU COMPREHENSIVE PARKING STUDY TASK 4 – PARKING MARKET & FINANCIAL ANALYSIS OCTOBER 21, 2010 37-8151.00
49
STATEMENT OF GENERAL ASSUMPTIONS AND LIMITING CONDITIONS
1. This report is to be used in whole and not in part.
2. Walker’s report and recommendations are based on certain assumptions pertaining to the future performance of the local economy and other factors typically related to individual user characteristics that are either outside Walker’s control or that of the client. To the best of Walker’s ability we analyzed available information that was incorporated in projecting future performance of the proposed subject site.
3. The financial projections presented in this report are conceptual estimates in nature and will differ from actual results.
4. Sketches, photographs, maps and other exhibits are included to assist the reader in visualizing the property. It is assumed that the use of the land and improvements is within the boundaries of the property described, and that there is no encroachment or trespass unless noted.
5. All information, estimates, and opinions obtained from parties not employed by Walker Parking Consultants/Engineers, Inc. are assumed to be true and correct. We can assume no liability resulting from misinformation.
6. Unless noted, we assume that there are no encroachments, zoning, violations, or building violations encumbering the subject property.
7. All mortgages, liens, encumbrances, leases, and servitudes have been disregarded unless specified otherwise.
8. None of this material may be reproduced in any form without our written permission, and the report cannot be disseminated to the public through advertising, public relations, news, sales, or other media.
9. We take no responsibility for any events or circumstances that take place subsequent to the date of our field inspections.
10. The quality of a parking facility’s on-site management has a direct effect on a property’s economic viability. The financial projections presented in the analysis assume responsible ownership and competent management. Any departure from this assumption may have a significant impact on the projected operating results.
11. The estimated operating results presented in this report were based on an evaluation of the overall economy, and neither

HONOLULU COMPREHENSIVE PARKING STUDY TASK 4 – PARKING MARKET & FINANCIAL ANALYSIS OCTOBER 21, 2010 37-8151.00
50
take into account nor make provisions for the effect of any sharp rise or decline in local or national economic conditions. We do not warrant that the projections will be attained, but they have been prepared on the basis of information obtained during the course of this study and are intended to reflect the expectations of a typical parking patron.
12. Many of the numeric figures presented in this report were generated using computer models that make calculations based on numbers carried out to three decimal places. In the interest of simplicity, most numbers have been rounded to the nearest thousand. Thus, these figures may be subject to small rounding errors.
13. This report was prepared by Walker Parking Consultants. All opinions, recommendations, and conclusions expressed during the course of this assignment are rendered by the staff of Walker Parking Consultants as employees, rather than as individuals.
14. This report is set forth as a market and financial analysis of the proposed subject property: this is not an appraisal report.
15. The conclusions and recommendations presented in this report were reached based on Walker’s analysis of the information obtained from the client and our own sources. Information furnished by others, upon which portions of this study are based, is believed to be reliable; however, it has not been verified in all cases. No warranty is given to the accuracy of such information. Any significant differences between these assumptions and actual performance may have an impact on the financial projections of the subject parking operation.

APPENDIX A: WORK ELEMENT / SCOPE OF SERVICES

HONOLULU COMPREHENSIVE PARKING STUDY TASK 4 – PARKING MARKET & FINANCIAL ANALYSIS OCTOBER 21, 2010 37-8151.00
FEDERAL GRANT WORK ELEMENT

HONOLULU COMPREHENSIVE PARKING STUDY TASK 4 – PARKING MARKET & FINANCIAL ANALYSIS OCTOBER 21, 2010 37-8151.00

HONOLULU COMPREHENSIVE PARKING STUDY TASK 4 – PARKING MARKET & FINANCIAL ANALYSIS OCTOBER 21, 2010 37-8151.00

HONOLULU COMPREHENSIVE PARKING STUDY TASK 4 – PARKING MARKET & FINANCIAL ANALYSIS OCTOBER 21, 2010 37-8151.00
SCOPE OF SERVICES 1) Develop a preliminary set of goals, project plan, and scope of
work for the Parking Market & Financial Analysis Task. 2) Meet with DTS to discuss goals, project plan, and scope items. 3) Meet with project advisory committee to discuss goals, project
plan, and scope items. Discuss any input or suggestions from the committee regarding modifications to the scope of work.
4) Meet with DTS to reaffirm project goals, project plan, and scope of work.
5) Preliminary Scope Items: a) Collect Data:
i) Visit project site and obtain information necessary for developing a written description of the City owned facilities and parking operations including the following: (1) Location; (2) Names and capacities of parking facilities; (3) Qualitative statement about the management and key
personnel in charge; (4) Hours and days of operation (5) Staffing; and (6) Methods of security.
ii) Visit parking structures owned by the City and perform cursory review of conditions without any investigative testing.
iii) Perform parking rate surveys and peak-hour occupancy counts of all parking facilities located within the Downtown Urban Core. Counts to be conducted during a mid-day on a weekday, during a weekday evening, during a mid-day on a weekend day, and during a weekend evening.
iv) Develop graphics showing the location of all parking facilities, and provide data on parking rates, inventories, and occupancies on a corresponding spreadsheet.
v) Conduct a preliminary physical survey and literature review of local market conditions to determine the possibility of additional parking facilities being constructed.
vi) Research the community master plan to identify prospective development projects and project the impact that these projects could have on parking conditions.
vii) If available, obtain from the City a ten-year history of parking rates for all City-owned parking assets.
b) Analyze Market Data

HONOLULU COMPREHENSIVE PARKING STUDY TASK 4 – PARKING MARKET & FINANCIAL ANALYSIS OCTOBER 21, 2010 37-8151.00
i) Review previous parking study reports for this area. Reports to be provided by others.
ii) Review parking space inventory and usage data collected and determine parking occupancy rates for various time periods.
iii) Review parking rate data and determine market parking rates. Compare rates of assets controlled by the City to competitive facilities.
iv) Compare location, and operating characteristics of the City-owned parking facilities to competitive facilities located within the study area.
v) Review annual operating statements of City-owned parking facilities for the 2000-2009 time periods. (Walker will not audit or verify accuracy of statements but will take them at face value.)
vi) Develop rationale for changes in City-owned parking facilities’ operating revenues and expenses from 2000-2009.
vii) Identify relevant developing parking market trends for the U.S., Honolulu, and the study area.
c) Conduct Financial Analysis i) Identify those factors that could have a significant impact
on parking revenues and expenses and comment on each factor.
ii) Review the operating statement from the latest fiscal year and opine line by line in terms of the reasonableness of the operating expenses. Identify expenses that seem to be lower or higher than typical and comment on typical expenses.
iii) Opine on capital expenditures budget. iv) Utilizing information developed in Task B, identify a market
parking rate structure for the subject facilities. v) Utilizing information developed in Task B, project income
and expenses for the next twenty (20) years, including separate projections for each parking facility.
d) Prepare Report i) Provide data tables in advance of the draft report. ii) Submit a draft report in PDF format to City representatives
for review. iii) Review comments presented by City representatives. iv) Submit final report in PDF format.

APPENDIX B: ON-STREET METER DETAIL

HONOLULU COMPREHENSIVE PARKING STUDY TASK 4 – PARKING MARKET & FINANCIAL ANALYSIS OCTOBER 21, 2010 37-8151.00
Location Total Meters Meter Numbers Rate/Hr Time LimitAala Place 12 1175-1185 $0.75 2 HRSAala St. 73 1101-1173 $0.75 2 HRSAhana St. 28 3100-3127 $0.75 2 HRSAlakea St. 4 401-404 $1.50 1 HRAlapai St. 16 2127-2142 $0.75 2 HRSAloha Drive 19 4601-4620 $1.50 2 HRSAmana St. 25 3070-3094 $0.75 2 HRSAuahi St. 45 3600-3644 $1.75 2 HRSAulike St. 19 5300-5318 $0.75 2 HRSBeachwalk 6 4461-4468 $1.50 2 HRSN. Beretania St. 41 944-984 $0.75 1 HRS. Beretania St. 100 2880-2883 $0.75 1 HRBethel St. 19 1670-1688 $1.50 1 HRBishop St. 14 1631-1644 $1.50 1 HR
Coral St. 10 3700-3709 $0.75 1 HRFort St. 18 1600-1617 $1.50 1 HR
Hale Makai St. 6 4026 $0.75 2 HRSHobron Ln. 35 4401-4435 $1.50 2 HRSHoolai St. 17 5551-5567 $0.75 2 HRSIlalo St. 18 4201-4218 $0.75 2 HRSKaheka St. 51 3128-3178 $0.75 2 HRSKainehe St. 18 5450-5467 $0.75 2 HRSKalaimoku St. 21 4541-4567 $1.50 2 HRSKalakaua Ave. 10 3241-3250 $0.75 1 HRKamakee St. 14 3405-3418 $0.75 2 HRSKanekapolie St. 13 507-525 $1.50 2 HRSKanunu St. 49 2701-2749 $0.75 2 HRS
Cooke St. Ala Moana-Ilalo 21 3788-3892 $0.75 2 HRSCooke St. Pohukaina-S. King St. 1 HR$0.753800-0388384
Halekauwila St. Punchbowl-South 2 HRS$0.754301-4312, 4349-435721Halekauwila St. Punchbowl-South 36 4313-4348 $0.75 1 HR
Kapahulu Ave. Ala Wai-Date 2 HRS$0.75125-14518Kapahulu Ave. Winam-Harding 1 HR$1.50148-1547Kapahulu Ave. Haring-Date 26 155-180 $0.75 HRKapahulu Ave. Date-Alawai 31 181-209 $0.75 2 HRSKapahulu Ave. Ala Wai-Kalakaua 39 387-429 $1.50 2 HRS
Hour-By-Hour Accumulation On-Street Parking Meters Location Total Meters Meter Numbers Rate/Hr Time LimitKawaihao St. 52 2201-2252 $0.75 2 HRSKeawe St. 9 3751-3759 $0.75 2 HRSKeeaumoku St. 29 3020-3048 $0.75 2 HRSKihapai St. 22 5400-5421 $0.75 2 HRS
N. King St. 16 060-1061, 1079-109 $0.75 2 HRSN. King St. 15 063-1067, 1069-107 $0.75 1 HR
Kohou St. 67 301-537 $0.75 2 HRSKokohead Ave. 29 103-131 $0.75 1 HR
Kuulei Rd. 32 5200-5231 $0.75 2 HRSLauhala St. 12 4000-4011 $0.75 2 HRSLewers SR. 8 716, 721-722, 732-736 $1.50 2 HRSLiliha St. 16 1040-1055 $0.75 1 HRLiona St. 9 2801-2809 $0.75 2 HRSLunalilo St. 15 3338-3352 $0.75 3 HRS
Makaloa St. 81 3251-3279 $0.75 2 HRSMakiki St. 7 3353-3359 $0.75 3 HRSMaluniu Ave. 19 5101-5119 $0.75 1 HRMarin St. 3 1650-1652 $1.50 1 HRMaunakea St. 63 1238-1299 $1.50 1 HRMcCully St. 5 796-800 $1.50 2 HRSMerchant St. 11 1655-1665 $1.50 1 HRMetcalf St. 34 1400-1433 $0.75 2 HRSMililani St. 11 1885-1895 $1.50 1 HRMission Ln. 9 700-708 $0.75 2 HRSNahua St. 21 4701-4721 $1.50 2 HRSNohonani St. 13 4671-4686 $1.50 2 HRSNuuanu Ave. 56 1515-1570 $1.50 1 HROhua Ave. 25 4801-4825 $1.50 2 HRSOlohana St. 19 4513-4533 $1.50 2 HRSPali Hwy. 5 1501-1505 $1.50 1 HR
Kinau St. Ward VictoriaKinau St. Keeaumoku-Makiki Kinau St. Makiki-Keeaumoku
2 HRS$0.753314-332411
5 3325-3329 $0.75 1 HR
8 3330-3337 $0.75 3 HRS
S. King St. Mililani-Ward
S. King St. Pensacola-KalakuauS. King St. Kahuna-Kahoaloha
2 HRS$0.75143-22886
78 2501-2578 $0.75 1 HR
20 251-278 $0.75 2 HRS
Kukui St. Aala-College WalkKukui St. Queen Emma St-River
20 600-608, 661-671 $1.50 1 HR
52 609-639, 646-660 $0.75 1 HR
Location Total Meters Meter Numbers Rate/Hr Time LimitPaoakalani Ave. 18 4831-4848 $1.50 2 HRSPauahi St. 37 1701-1737 $1.50 1 HRPensacola St. 20 2351-2370 $0.75 2 HRS
Pohukaina St. 60 3900-3959 $0.75 2 HRSPoni St. 20 3201-3220 $0.75 2 HRSPuncbowl St. 83 2401-2480 $1.50 2 HRSPuniu St. 12 5500-5511 $0.75 2 HRSQueen Emma Sq. 18 450-467 $1.50 2 HRS
Richars St. 32 1815-1846 $1.50 1 HRRiver St. 27 1201-1230 $1.50 1 HRRoyal Hawaiian Ave. 7 4631-4640 $1.50 2 HRSRycroft St. 29 2782-2812 $0.75 2 HRSSaratoga Rd. 19 4441-4459 $1.50 2 HRS
Seaside Ave. 14 4651-4664 $1.50 1 HRSheridan St. 25 3280-3305 $0.75 2 HRSSmith St. 36 1304-1339 $1.50 1 HR
South St. 362142-2144, 2152-2180, 2183-2186 $0.75 2 HRS
South St. 15 145-2151, 2187-2194 1 HR12th Ave. 9 85-93 $0.75 1 HRUluniu Ave. (Waikiki) 4 4771, 4773-4775 $0.75 2 HRSUluniu St. (Kailua) 53 5000-5052 $1.50 2 HRSUniversity Ave. 38 1435-1472 $0.75 2 HRSVisctoria St. 39 $0.75 2 HRSVineyard St. 12 738-749 $1.50 2 HRSWaialae Ave. 67 5-70 $0.75 1 HRWaimanu St. 42 1901-1961 $0.75 2 HRSWalina St. 16 4731-4746 $1.50 2 HRS
Young St. 56 2823-2878 $0.75 2 HRS
N. School St. Nuuanu-Waikahalulu 6 1001-1006 $0.75 1 HR
Piikoi St. Kapiolani-Kamaile
N. School St. Frog Ln-Liliha 7 1007-1013 $0.75 2 HRS
Piikoi St. Hopaka-Waimanu, S.
Queen Emma St. Queen Emma Sq-
Queen Emma St. Cummins-KamakeeQueen Emma St. Coral-Cooke
2 HRS$0.75983-2987, 2997-30016
15 988-2996, 3008-301 $0.75 1 HR
2 HRS$1.50411-42717
7 3550-3556 $0.75 2 HRS
3 3547-3549 $0.75 1 HR
Ward Ave. S. King Kapiolani Ward Ave. Queen-Ala Moana
2 HRS$0.752001-20077
37 2008-2044 $0.75 1 HR

APPENDIX C: MARKET AREA PARKING INVENTORY, OCCUPANCY & RATES DETAIL

HONOLULU COMPREHENSIVE PARKING STUDY TASK 4 – PARKING MARKET & FINANCIAL ANALYSIS OCTOBER 21, 2010 37-8151.00
Block Off-Street On-Street Block Off-Street On-Street Block Off-Street On-Street
1 593 10 16 88 1 31 72 02 0 16 17 308 10 32 0 83 0 9 18 0 14 33 96 04 130 9 19 271 0 34 36 05 119 10 20 65 12 35 907 06 64 18 21 0 2 36 672 07 29 21 22 0 0 37 83 48 28 17 23 0 9 38 564 119 0 15 24 0 7 39 0 010 396 10 25 345 0 40 248 311 114 28 26 365 9 41 0 812 39 17 27 1,025 0 42 341 313 24 20 28 0 0 43 725 1014 98 9 29 1,037 0 44 100 4315 105 0 30 840 0 45 980 18
Block Off-Street On-StreetTOTAL 10,907 381
Downtown/Chinatown District
Block Off-Street On-Street Block Off-Street On-Street Block Off-Street On-Street1 100% 100% 16 100% 100% 31 69% N/A2 N/A 100% 17 70% 70% 32 N/A 88%3 N/A 89% 18 N/A 71% 33 85% N/A4 66% 89% 19 80% N/A 34 75% N/A5 46% 80% 20 62% 92% 35 90% N/A6 39% 94% 21 N/A 100% 36 60% N/A7 41% 81% 22 N/A N/A 37 55% 100%8 46% 82% 23 N/A 100% 38 80% 91%9 N/A 93% 24 N/A 71% 39 N/A N/A10 88% 100% 25 76% N/A 40 73% 100%11 48% 79% 26 69% 89% 41 N/A 100%12 79% 65% 27 80% N/A 42 82% 100%13 63% 60% 28 N/A N/A 43 65% 90%14 69% 89% 29 70% N/A 44 72% 84%15 89% N/A 30 55% N/A 45 90% 83%
Block Off-Street On-StreetAVERAGE 76% 85%
Block Hourly Max Monthly Block Hourly Max Monthly Block Hourly Max Monthly1 $1.50 $21.00 $90.00 16 $6.00 $50.00 N/A 31 N/A N/A N/A2 N/A N/A N/A 17 $6.00 $50.00 $150.00 32 N/A N/A N/A3 N/A N/A N/A 18 N/A N/A N/A 33 $6.50 $45.00 $230.004 $1.50 $21.00 $125.00 19 $1.50 $21.00 $150.00 34 $3.00 $30.00 N/A5 $1.75 N/A N/A 20 N/A N/A N/A 35 $8.00 $64.00 N/A6 $2.00 N/A N/A 21 N/A N/A N/A 36 $6.50 $32.50 $300.007 $2.00 N/A N/A 22 N/A N/A N/A 37 $9.00 $48.00 N/A8 $3.00 N/A N/A 23 N/A N/A N/A 38 $8.00 $64.00 N/A9 N/A N/A N/A 24 N/A N/A N/A 39 N/A N/A N/A
10 $1.50 $21.00 $125.00 25 $6.00 $60.00 N/A 40 $6.50 $42.00 N/A11 $1.50 $21.00 N/A 26 $7.00 $35.00 N/A 41 N/A N/A N/A12 $5.00 $12.00 N/A 27 $1.50 $21.00 N/A 42 $7.00 $42.00 N/A13 $5.00 $5.00 N/A 28 N/A N/A N/A 43 $8.00 $75.00 N/A14 $3.00 $24.00 N/A 29 $6.50 $35.00 N/A 44 $1.00 N/A N/A15 $6.00 $20.00 N/A 30 $6.00 $30.00 $245.00 45 $1.50 N/A N/A
Block Hourly Max MonthlyTOTAL $4.49 $35.58 $176.88
Parking Rates
Parking Inventory Parking Occupancy

HONOLULU COMPREHENSIVE PARKING STUDY TASK 4 – PARKING MARKET & FINANCIAL ANALYSIS OCTOBER 21, 2010 37-8151.00
Block Off-Street On-Street Block Off-Street On-Street Block Off-Street On-Street
1 0 40 16 0 8 31 304 422 15 7 17 160 16 32 0 03 81 55 18 223 10 33 15 34 922 14 19 67 7 34 11 05 182 0 20 785 14 35 38 286 28 38 21 328 65 36 62 37 317 30 22 93 8 37 829 38 53 9 23 184 21 38 78 209 979 27 24 0 33 39 97 2410 637 44 25 195 14 40 174 1211 1,245 5 26 237 23 41 120 1112 188 8 27 13 6 42 264 013 894 25 28 19 0 43 82 1114 0 4 29 496 36 44 181 015 31 15 30 60 0
Block Off-Street On-StreetTOTAL 10,687 739
Kaka’ako Mauka District
Parking Rates
Parking Inventory Parking Occupancy
Block Off-Street On-Street Block Off-Street On-Street Block Off-Street On-Street1 N/A 83% 16 N/A 88% 31 50% 100%2 67% 86% 17 71% 63% 32 N/A N/A3 75% 91% 18 61% 80% 33 75% 67%4 61% 100% 19 60% 71% 34 55% N/A5 70% N/A 20 42% 57% 35 60% 100%6 75% 66% 21 81% 58% 36 72% 33%7 76% 83% 22 65% 100% 37 53% 100%8 32% 111% 23 45% 33% 38 57% 45%9 78% 100% 24 N/A 42% 39 66% 100%
10 52% 100% 25 2% 86% 40 52% 42%11 85% 80% 26 65% 91% 41 57% 20%12 51% 88% 27 38% 67% 42 55% N/A13 82% 100% 28 50% N/A 43 51% 100%14 N/A 100% 29 67% 78% 44 53% N/A15 30% 73% 30 88% N/A
Block Off-Street On-StreetAVERAGE 62% 74%
Block Hourly Daily Max Monthly Block Hourly Daily Max Monthly Block Hourly Daily Max Monthly1 $1.50 N/A N/A 16 N/A N/A N/A 31 N/A N/A N/A2 N/A N/A N/A 17 N/A N/A N/A 32 N/A N/A N/A3 $1.50 N/A N/A 18 $2.50 $10.00 33 N/A N/A N/A4 $3.25 $30.00 N/A 19 N/A N/A N/A 34 N/A N/A N/A5 N/A N/A N/A 20 N/A N/A N/A 35 N/A N/A N/A6 N/A N/A N/A 21 N/A $6.00 $120.00 36 N/A N/A N/A7 $3.00 $20.00 N/A 22 N/A N/A N/A 37 $0.75 N/A N/A8 N/A N/A N/A 23 N/A N/A N/A 38 N/A N/A N/A9 N/A N/A N/A 24 N/A N/A N/A 39 N/A N/A N/A10 $5.00 $10.00 N/A 25 N/A N/A N/A 40 $0.75 $5.00 N/A11 $6.00 $33.00 $178.00 26 N/A N/A N/A 41 N/A N/A N/A12 N/A N/A N/A 27 N/A N/A N/A 42 N/A N/A N/A13 $6.00 $39.00 N/A 28 N/A N/A N/A 43 N/A N/A N/A14 N/A N/A N/A 29 $1.50 $8.00 N/A 44 N/A N/A N/A15 N/A N/A N/A 30 N/A N/A N/A
Block Hourly Daily Max MonthlyAVERAGE $2.89 $17.89 $149.00

HONOLULU COMPREHENSIVE PARKING STUDY TASK 4 – PARKING MARKET & FINANCIAL ANALYSIS OCTOBER 21, 2010 37-8151.00
Block Off-Street On-Street Block Off-Street On-Street Block Off-Street On-Street
1 1,545 51 16 44 0 31 5 122 629 0 17 980 0 32 22 03 145 0 18 15 5 33 54 04 108 0 19 0 30 34 58 05 182 0 20 0 25 35 27 06 50 10 21 76 0 36 0 07 1,139 19 22 0 22 37 28 08 904 18 23 35 21 38 1,250 299 655 3 24 0 0 39 13 0
10 115 45 25 47 2 40 358 1211 105 18 26 37 5 41 403 012 76 18 27 62 1 42 535 013 109 8 28 35 5 43 122 014 92 0 29 0 5 44 7,890 1515 64 48 30 365 0
Block Off-Street On-StreetTOTAL 18,379 427
Ala Moana District
Parking Rates
Parking Inventory Parking Occupancy
Block Off-Street On-Street Block Off-Street On-Street Block Off-Street On-Street1 76% 73% 16 100% N/A 31 60% 67%2 69% N/A 17 66% N/A 32 68% N/A3 79% N/A 18 100% 80% 33 80% N/A4 94% N/A 19 N/A 80% 34 100% N/A5 99% N/A 20 N/A 72% 35 100% N/A6 96% 80% 21 86% N/A 36 N/A N/A7 72% 79% 22 N/A 64% 37 100% N/A8 71% 89% 23 89% 76% 38 68% 48%9 85% 100% 24 N/A N/A 39 92% N/A10 64% 40% 25 81% 100% 40 92% 42%11 84% 67% 26 84% 80% 41 91% N/A12 100% 100% 27 69% 100% 42 99% N/A13 100% 100% 28 77% 100% 43 55% N/A14 100% N/A 29 N/A 80% 44 65% 87%15 100% 100% 30 76% N/A
Block Off-Street On-StreetAVERAGE 72% 74%
Block Hourly Daily Max Monthly Block Hourly Daily Max Monthly Block Hourly Daily Max Monthly1 N/A $6.00 $120.00 16 N/A N/A N/A 31 N/A N/A N/A2 N/A N/A N/A 17 N/A N/A N/A 32 N/A N/A N/A3 N/A N/A N/A 18 N/A N/A N/A 33 N/A N/A N/A4 N/A N/A N/A 19 N/A N/A N/A 34 N/A N/A N/A5 N/A N/A N/A 20 N/A N/A N/A 35 N/A N/A N/A6 N/A N/A N/A 21 N/A N/A N/A 36 N/A N/A N/A7 N/A N/A N/A 22 N/A N/A N/A 37 N/A N/A N/A8 N/A N/A N/A 23 N/A N/A N/A 38 N/A N/A N/A9 N/A N/A N/A 24 N/A N/A N/A 39 N/A N/A N/A
10 N/A N/A N/A 25 N/A N/A N/A 40 $2.00 N/A N/A11 $1.50 $2.00 N/A 26 N/A N/A N/A 41 N/A N/A N/A12 N/A N/A N/A 27 N/A N/A N/A 42 N/A N/A N/A13 N/A N/A N/A 28 N/A N/A N/A 43 N/A N/A N/A14 N/A N/A N/A 29 N/A N/A N/A 44 N/A N/A N/A15 N/A N/A N/A 30 N/A N/A N/A
Block Hourly Daily Max MonthlyAVERAGE $1.75 $4.00 $120.00

HONOLULU COMPREHENSIVE PARKING STUDY TASK 4 – PARKING MARKET & FINANCIAL ANALYSIS OCTOBER 21, 2010 37-8151.00
Makiki District
Parking Rates
Parking Inventory Parking Occupancy
Block Off-Street On-Street1 236 212 619 143 594 94 0 305 206 606 715 307 219 338 233 219 246 4310 995 40
Block Off-Street On-StreetTOTAL 4,063 301
Block Off-Street On-Street1 99% 81%2 80% 93%3 63% 100%4 N/A 67%5 81% 67%6 74% 53%7 73% 61%8 70% 67%9 47% 47%10 55% 93%
Block Off-Street On-StreetTOTAL 69% 68%
Block Hourly Daily Max Monthly1 $1.50 $3.00 N/A2 $5.00 $32.00 N/A3 N/A N/A N/A4 N/A N/A N/A5 $0.75 $10.00 N/A6 $2.00 $10.00 N/A7 N/A N/A N/A8 N/A N/A N/A9 N/A N/A N/A10 $2.00 $25.00 N/A
Block Hourly Daily Max MonthlyAVERAGE $2.25 $16.00 N/A