Embed Size (px)
Citation preview

Hong Kong 2030+
HONG KONG IN THE GLOBAL CONTEXT

Hong Kong 2030+
The long-term vision for Hong Kong to strengthen its position as Asia’s world city was adopted in Hong Kong 2030: Planning Vision and Strategy promulgated in 2007. Since then, dynamic changes have taken place in Hong Kong and elsewhere in the world. In the course of updating the territorial development strategy under “Hong Kong 2030+: Towards a Planning Vision and Strategy Transcending 2030” (“Hong Kong 2030+”),we have examined the performance of Hong Kong in achieving its vision. In Part A, a preliminary examination is conducted on where Hong Kong stands in relation to other major cities, mainly through a review of relevant international benchmarking indexes covering global strength, liveability, health and well-being, sustainability, innovation and city attraction. In Part B, major global megatrends that are shaping the world are identified to assess the implications for future planning. In Part C, a SWOT analysis is carried out to shed light on the planning vision and new development directions for Hong Kong transcending 2030.
i
This topical paper constitutes part of the research series under “Hong Kong 2030+: Towards a Planning Vision and Strategy Transcending
2030” (Hong Kong 2030+). The findings and proposals of the paper form the basis of the draft updated territorial development strategy
which is set out in the Public Engagement Booklet of Hong Kong 2030+.

Hong Kong 2030+
Table of Contents
Preface
Part A: Positioning of Hong Kong 1
Global Strengths 2
Liveability 8
Sustainability 10
Health and Well-being 12
Innovation 14
City Image 17
Overall Assessment 19
Part B: Global Megatrends 20
Individuals and Society 21
Physical Environment 22
Global Economy 23
Part C: SWOT Analysis 24
Strengths 25
Weaknesses 30
Opportunities 33
Threats 37
Conclusion 41
Endnotes 42
i
ii

Hong Kong 2030+
List of Figures Figure 1 Major Aspects covered by the International Benchmarking Indexes Figure 2 Summary of Major Competitive Edges of Hong Kong Figure 3 Global Megatrends Figure 4 SWOT Analysis Diagram Figure 5 Reaching Half of the World’s Population within Five Hours’ Flying Time Figure 6 Belt and Road Figure 7 Land Supply Options and Issues Figure 8 Infrastructure in the Greater PRD Region Figure 9 One-hour Intercity Traffic Circle Figure 10 Trends of Ageing Population Figure 11 SWOT Analysis for Hong Kong (Gist) List of Tables Table 1 Rankings (Globalisation Indexes) Table 2 Evaluation Methods & Criteria (Globalisation Indexes) Table 3 Rankings (Competitiveness Indexes) Table 4 Evaluation Methods & Criteria (Competitiveness Indexes) Table 5 Rankings (Financial Development and Business Opportunities Indexes) Table 6 Evaluation Methods & Criteria (Financial Development and Business Opportunities Indexes) Table 7 Rankings (Liveability Indexes) Table 8 Evaluation Methods & Criteria (Liveability Indexes) Table 9 2010 Rankings in HDI and HSDI Table 10 Rankings (Health and Well-being Indexes) Table 11 Rankings (Innovation Indexes) Table 12 Evaluation Methods & Criteria (Innovation Indexes) Table 13 Rankings (City Image Indexes)
iii

Hong Kong 2030+ 1
Part A: Positioning of Hong Kong This part aims to provide an overall view of the positioning of Hong Kong in the global context with reference to an array of international benchmarking indexes. While acknowledging their potential pitfalls such as data availability, quality, comparability and objectivity and that the indexes are not exhaustive, such indexes are useful pointers for comparing the performance of a city relative to other parts of the world and gauging what could be achieved or improved. These indexes are produced by international organisations, academic and research institutes, media and international corporations, etc. They also cast insights on city strengths and weaknesses, which in turn facilitate informed policy making and formulation of an appropriate city strategy. Among the ever-expanding cluster of benchmarking indexes, this Report will focus on the relevant major ones which have spatial planning implications. These indexes can be broadly categorised into six major aspects, viz. global strength, liveability, health and well-being, sustainability, innovation and city attraction (Figure 1). Figure 1 Major Aspects covered by the International Benchmarking Indexes
A. Global Strengths
Globalisation and World Cities Research Network
Mori Memorial Foundation’s Global Power City Index
A. T. Kearney’s Global Cities Index
Economist Intelligent Unit's (EIU) Hot Spots: Benchmarking Global City Competitiveness
IMD's World Competitiveness Yearbook WEF's Global Competitiveness Report
World Economic Forum's (WEF) Financial Development Report
Z/Yen's Global Financial Centres Index Milken Institute's Global Opportunity Index
B. Liveability C. Sustainability D. Health & Well-being E. Innovation F. City Attraction Mercer’s Quality of Living
Survey EIU’s Liveability Survey Monocle’s Quality of Life
Survey
UN's Human Sustainability Development Index
EIU's Green City Index
United Nations Development Programme’s (UNDP) International Human Development Indicators
London School of Economics’s Metropolitan Well-being Index
UN's World Happiness Report
Institut Européen d'Administration des Affaires’s (INSEAD) Global Innovation Index
WEF's Global Competitiveness Report
2thinknow's Innovation Cities Index
Euromonitor International’s Top 100 City Destinations Ranking
WEF's Travel and Tourism Competitiveness Index
Public Affairs Asia's Location Branding

Hong Kong 2030+ 2
A. Global Strengths
The global strengths of a city are commonly assessed in these broad aspects, viz. globalisation, competitiveness and global financial business opportunities. The positioning of Hong Kong in relation to other major cities is set out below:
1 Globalisation
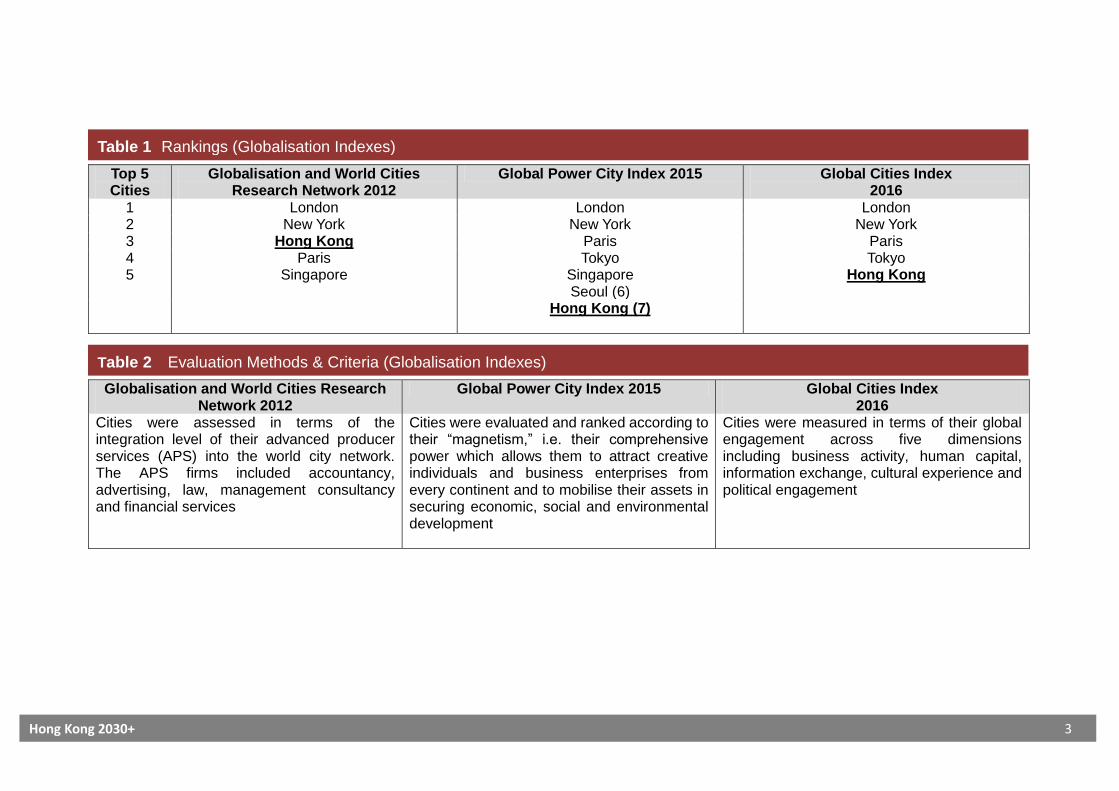
Cities play a key role in the era of globalisation, serving as a significant production point of advanced producer services that integrate into the world city network and make the globalised economy run. As revealed in a number of international benchmarking reports, Hong Kong is a top-tier world city along with London, New York, Paris, Tokyo and Singapore. Hong Kong has a long history of going global including business and trade, human capital, information exchange and cultural exchange. Foreign investments, business enterprises and talents continue to flow into the city. Hong Kong’s strategic location for access to the market in the Pearl River Delta and the wider Mainland economy allows it to earn its unique gateway position. Major indexes on globalisation aspects include:
a) The World according to the Globalisation and World Cities Research Network (GaWC) by Globalisation and World Cities Research Network1
b) Global Power City Index (GPCI) by MORI Memorial Foundation2
c) Global Cities Index (GCI) by A. T. Kearney and the Chicago Council on Global Affairs3
Hong Kong 2030+ 3
Top 5 Cities
Globalisation and World Cities Research Network 2012
Global Power City Index 2015 Global Cities Index 2016
1 London London London 2 New York New York New York 3 Hong Kong Paris Paris 4 Paris Tokyo Tokyo 5 Singapore Singapore
Seoul (6) Hong Kong
Hong Kong (7)
Globalisation and World Cities Research Network 2012
Global Power City Index 2015 Global Cities Index 2016
Cities were assessed in terms of the integration level of their advanced producer services (APS) into the world city network. The APS firms included accountancy, advertising, law, management consultancy and financial services
Cities were evaluated and ranked according to their “magnetism,” i.e. their comprehensive power which allows them to attract creative individuals and business enterprises from every continent and to mobilise their assets in securing economic, social and environmental development
Cities were measured in terms of their global engagement across five dimensions including business activity, human capital, information exchange, cultural experience and political engagement
Table 1 Rankings (Globalisation Indexes)
Table 2 Evaluation Methods & Criteria (Globalisation Indexes)

Hong Kong 2030+ 4
2 Competitiveness
A city’s competitiveness is a holistic concept. It is interpreted as its ability to attract investment, businesses, ideas, talents and visitors. Several factors determine a city’s overall competitiveness, including but not limited to economic performance, government and institutional efficiency, business environment, quality of human capital, quality of living as well as infrastructure and technology.
Hong Kong achieves high rankings in a number of international indexes on competitiveness. In 2012, the Economist Intelligent Unit (EIU) conducted a research called Hot Spots: Benchmarking Global City Competitiveness4 to assess the competitiveness of 120 major urban agglomerations in terms of economic strength, physical capital, financial maturity, institutional effectiveness, social and cultural character, human capital, environmental and natural hazards as well as global appeal. Hong Kong ranked 4th on the list. It performed better in physical capital (1st), financial maturity (1st), human capital (2nd) and global appeal (6th), but weaker in aspects like social and cultural character (41st) and environmental and natural hazard (59th).
EIU conducted a research entitled “Hot Spots 2025: Benchmarking the Future Competitiveness of Cities”5, forecasting the competitiveness of the 120 cities in 2025 based on their projected ability to attract capital, business, talent and tourists. Hong Kong ranked 4th again in the Index,
having a clout in its physical infrastructure, financial maturity and global appeal. While the research envisaged Hong Kong to be moving down the ranks in terms of economic strength, Hong Kong is expected to benefit from the efficiency gains of a well-run, densely populated area located on the southern coast of China, which is anticipated to be the world’s largest economy in 2025.
The World Competitiveness Yearbook (WCR)6 published by International Institute for Management Development (IMD) evaluates the competitiveness of 61 economies. In 2016, Hong Kong ranked the most competitive economy in the world. Hong Kong was recognised for her consistent commitment to providing a favourable business environment, encouragement to innovation through low and simple taxation, free flow of capital, and our role as a gateway between the Mainland and the global capital markets. Hong Kong’s rankings in “Government efficiency” and “Business efficiency” both stayed at 1st globally. We also fared well in “Economic performance”.
According to Global Competitiveness Report 2016-2017 (GCR)7 published by the World Economic Forum (WEF), Hong Kong ranked 9th. Among the 12 pillars of competitiveness identified in the analysis, Hong Kong achieved high rankings in “Infrastructure”, “Financial Market Development”, “Goods Market Efficiency” and “Labour Market Efficiency”.

Hong Kong 2030+ 5
Top 5 Cities
Hot Spots: Benchmarking Global City Competitiveness 2012
World Competitiveness Yearbook 2016 Global Competitiveness Report 2016-2017
1 New York Hong Kong Switzerland 2 London Switzerland Singapore 3 Singapore USA United States 4 Paris/Hong Kong Singapore Netherlands 5 -- Sweden Germany
Hong Kong (9)
Hot spots: Benchmarking Global City Competitiveness 2012
World Competitiveness Yearbook 2016 Global Competitiveness Report 2016-2017
The cities were assessed by 31 indicators grouped under eight categories: economic strength, human capital, institutional effectiveness, financial maturity, global appeal, physical capital, environment and natural hazards, and social and cultural character
Assessed each economy based on 4 main competitiveness factors including economic performance, government efficiency, business efficiency and infrastructure
A weighted average of 12 pillars of competitiveness, grouped under 3 sub-indexes: basic requirements subindex (institutions, infrastructure, macroeconomic environment, health and primary education); efficiency enhancers subindex (higher education and training, labour market efficiency, goods market efficiency, financial market development, technological readinessi and market size); and innovation and sophistication factors subindex (business sophistication and innovation)
i The technological readiness pillar measures the agility with which an economy adopts existing technologies to enhance the productivity of its industries, with specific
emphasis on its capacity to fully leverage information and communication technologies (ICTs) in daily activities and production processes for increased efficiency and enabling innovation for competitiveness.
Table 3 Rankings (Competitiveness Indexes)
Table 4 Evaluation Methods & Criteria (Competitiveness Indexes)
Hong Kong 2030+ 6
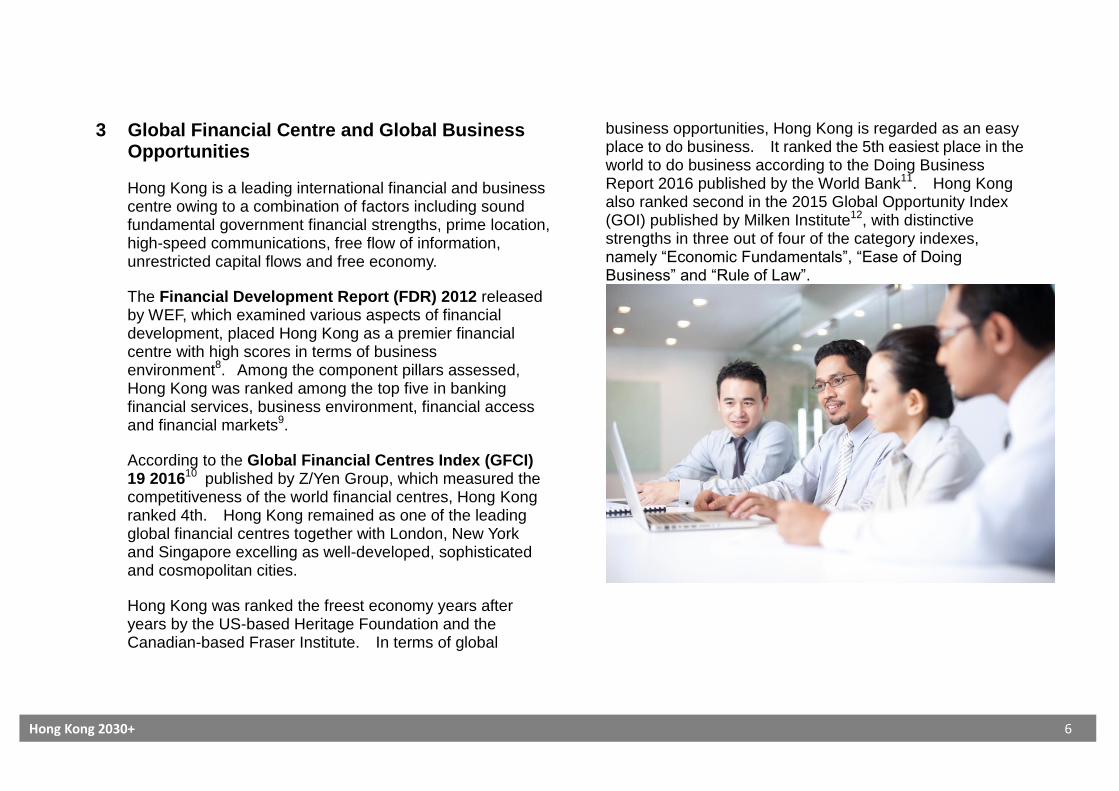
3 Global Financial Centre and Global Business Opportunities
Hong Kong is a leading international financial and business centre owing to a combination of factors including sound fundamental government financial strengths, prime location, high-speed communications, free flow of information, unrestricted capital flows and free economy.
The Financial Development Report (FDR) 2012 released by WEF, which examined various aspects of financial development, placed Hong Kong as a premier financial centre with high scores in terms of business environment8. Among the component pillars assessed, Hong Kong was ranked among the top five in banking financial services, business environment, financial access and financial markets9.
According to the Global Financial Centres Index (GFCI) 19 201610 published by Z/Yen Group, which measured the competitiveness of the world financial centres, Hong Kong ranked 4th. Hong Kong remained as one of the leading global financial centres together with London, New York and Singapore excelling as well-developed, sophisticated and cosmopolitan cities.
Hong Kong was ranked the freest economy years after years by the US-based Heritage Foundation and the Canadian-based Fraser Institute. In terms of global
business opportunities, Hong Kong is regarded as an easy place to do business. It ranked the 5th easiest place in the world to do business according to the Doing Business Report 2016 published by the World Bank11. Hong Kong also ranked second in the 2015 Global Opportunity Index (GOI) published by Milken Institute12, with distinctive strengths in three out of four of the category indexes, namely “Economic Fundamentals”, “Ease of Doing Business” and “Rule of Law”.

Hong Kong 2030+ 7
Top 5 Cities
Financial Development Report 2012 Global Financial Centres Index 19 2016
Global Opportunity Index 2015
1 Hong Kong London Singapore 2 United States New York Hong Kong 3 United Kingdom Singapore Finland 4 Singapore Hong Kong New Zealand 5 Australia Tokyo Sweden
Financial Development Report 2012 Global Financial Centres Index 19 2016 Global Opportunity Index 2015
Measured various aspects of financial development by 7 pillars grouped into 3 broad categories (including factors, policies and institutions; financial intermediation; and financial access)
Compiled based on a combination of 102 instrumental factors (external indexes and grouped into 5 overarching areas of competitiveness including human capital, business environment, infrastructure factors, financial sector development, reputational and general factors) and responses to an ongoing online questionnaire from international financial services professionals
Benchmarked and tracked 136 countries’ progress on 61 variables aggregated in four categories: Economic Fundamentals, Ease of Doing Business, Regulatory Quality, and Rule of Law
Table 5 Rankings (Financial Development and Business Opportunities Indexes)
Table 6 Evaluation Methods & Criteria (Financial Development and Business Opportunities Indexes)

Hong Kong 2030+ 8
B. Liveability
Liveability concerns elements of a city which contribute to quality of life and well-being of its people. The most popular liveable city indexes include Mercer’s Quality of Living Survey13, Economic Intelligence Unit’s (EIU’s) Liveability Survey14 and Monocle’s Quality of Life Survey15.
Notwithstanding that the liveable city indexes have been widely referred to as international benchmarking tools on liveability, caution should be taken in making reference to them. For example, the Mercer’s and EIU’s Surveys were based on the cities’ attractiveness to expatriate executives, instead of the general public. The expatriate might have different priorities and preference from the permanent residents living in a city.
Generally speaking, the top-ranked cities fared well in aspects of quality of life, high stability and good healthcare. They tended to be mid-sized cities in wealthier countries with a relatively lower population density, whereas global business centres tended to be victims of their own “big city buzz”. The leading global cities including London, New York and Hong Kong were not rated the most liveable cities. Hong Kong does not score high in the liveability indexes. It ranked 70th and was lagging behind Singapore (26th), London (39th) and New York City (44th)16 in the Mercer’s Survey, although it ranked better in the other two indexes. Interestingly, Hong Kong was ranked the top in the Spatially Adjusted Liveability
Indexii, which has introduced a new category to account for the
spatial characteristics of the city: urban form (sprawl, green space), the geographical situation of the city (natural assets, isolation and connectivity), cultural assets and pollution. In the evaluation, Hong Kong scored well as it was recognised as a compact city which has managed to maintain its natural heritage, create a dense network of green spaces and enjoy extensive links to the rest of the world. Yet, Hong Kong did not score well in terms of pollution and cultural assets.
ii http://pages.eiu.com/rs/eiu2/images/EIU_BestCities.pdf. In 2012, EIU and
BuzzData hosted a competition to offer users an opportunity to combine data from the existing EIU’s Liveability Survey (EIU’s Index) with data from other sources to provide a ranking of their own. Filippo Lovato, with his “Spatially Adjusted Liveability Index” (the New Index), was the winning entry. The New Index aimed to complement the EIU’s Index with an awareness of cities’ spatial characteristics. In practical terms, this meant proportionately reducing the weight of the 5 categories in EIU's Index (i.e. Stability, Healthcare, Culture and Environment, Education, and Infrastructure) to 75% and adding a sixth category (Spatial Characteristics) that carried a weight of 25%. The New Index only evaluated 70 out of the 140 cities in the EIU’s Index in view of time and resource availability.

Hong Kong 2030+ 9
Top 5 Cities
Mercer’s Quality of Living Survey 2016 EIU’s Liveability Survey 2016 Monocle’s Quality of Life Survey 2016
1 Vienna Melbourne Tokyo 2 Zurich Vienna Berlin 3 Auckland Vancouver Vienna 4 Munich Toronto Copenhagen 5 Vancouver Adelaide/Calgary Munich Hong Kong (70)17 Hong Kong (43)18 Hong Kong (18)
Mercer’s Quality of Living Survey 2016 EIU’s Liveability Survey 2016 Monocle’s Quality of Life Survey 2016
Based on an annual survey of professionals working for multinational companies and regional specialists
Derived from survey responses to an assessment of quantitative “quality of life determinants”
10 broad categories were assessed: political & social environment, economic environment, socio-cultural environment, medical and health consideration, schools & education, public services & transportation, natural environment, recreation, housing and consumer goods
Each city was assigned a rating of relative comfort score for over 30 qualitative and quantitative factors across 5 broad categories (i.e. stability, healthcare, culture and environment, education and infrastructure)
Rating of qualitative indicators was based on the judgment of in-house analysts and in-city contributors, and rating of quantitative indicators was based on the relative performance of a number of external data points
Used quantitative data and subjective opinion
Derived 25 quality of life indicators which could be grouped into broad categories
The broad categories were cost & quality of transport infrastructure, availability of communications & connectivity, crime rates, level of social tolerance, quality of education & health care, natural environment, recreation
Table 7 Rankings (Liveability Indexes)
Table 8 Evaluation Methods & Criteria (Liveability Indexes)

Hong Kong 2030+ 10
C. Sustainability
1 Human Sustainability Development
Progress of development has long been measured by GDP
alone. It was not until the 1990s that the United Nations
(UN) has introduced an alternative measure, Human
Development Index (HDI), to measure human
development and quality of life in terms of indexes on
wealth (decent standard of living), health and education.
Nevertheless, HDI also has a major failing of taking no
account of the environment. To rectify this, the UN has
added an environmental dimension (per capita carbon
emissions) to the HDI and come up with a “Human
Sustainability Development Index” (HSDI)19.
Comparing the 2010 HDI and HSDI, the most dramatic
changes were at the top. USA and Canada plummeted
out of the top as a lifestyle based on high use of oil and gas
was considered not sustainable.
On the other hand, Hong Kong has leapt from 21st to 8th
when the 2010 HDI and HSDI were compared. This
showed that Hong Kong was doing well in terms of overall
sustainability, which impacted less on the environment as
compared to the other advanced economies.iii
iii In the HDI 2015, Hong Kong ranked 12th. Overall speaking, Hong Kong was
categorised as a city of “very high human development”.
Table 9 2010 Rankings in HDI and HSDI

Hong Kong 2030+ 11
2 Green City
Green city is an indicator of the environmental performance of cities. The Green City Index (GCI) series is a research project conducted by the EIU sponsored by Siemens to assess the greening performance of more than 120 cities throughout the world. It includes Asian GCI, European GCI, Germany GCI, US and Canada GCI, African GCI, Australia and New Zealand GCI as well as Latin American GCI. It covers aspects such as CO2 emissions, energy, buildings, land use, transport, water and sanitation, waste management, air quality and environmental governance.
In the Asian GCI20, Singapore was the only city to rank “well above average” overall, attributable to self-government, effective policy implementation and integrated master planning. Hong Kong was “above average” overall in the Asian GCI. The city performed best in the land use and buildings category, where it ranked well above average, boosted by the largest amount of green spaces according to the Asian GCI. In most other categories, Hong Kong ranked above average. In addition to having well-developed transport and sanitation infrastructure in place, Hong Kong was envisaged to benefit from a wide range of proactive policies to improve and protect its environment. In terms of greenhouse gas (GHG) emission, the global GHG emissions in 2012 were about 47.6 billion tonnes. The world average on a per capita basis is about 6.8 tonnes. Hong Kong is a service
economy without energy-intensive industries. In this regard, Hong Kong’s GHG emission in 2012 was only 43.1 million tonnes, contributing to less than 0.1% of global emission. In addition, Hong Kong’s per capita GHG emission is only around 6 tonnes, which is considerably lower than most developed economies and the world average. The city ranked average in the water category, mainly due to a high rate of consumption and a relatively high level of water leakagesiv. Notwithstanding, Hong Kong ranked 3rd in National Water Security Indicator amongst other Asian countries in Asian Water Development Outlook 2013 published by the Asian Development Bank, which indicates our good performance in water security and water management.
iv Although the Asian Green City Index ranked Hong Kong as average in the water
category, it should be noted that the index referred a leakage rate of 21%, which had already been improved significantly to around 16%. Also, it quoted Hong Kong to have comparatively high water consumption by consuming 371 litres of water per capita per day, compared to 22-city average of 278 litres. However, this 278 litres of average consumption has been largely affected by the low consumption in cities with low GDP. The methodology of scoring against a lower benchmark of 500l/h/d and an upper benchmark of 100l/lh/d also does not give consideration to the per capita GDP of different cities. In fact, Hong Kong obtained the third highest National Water Security Indicator amongst other Asian countries in Asian Water Development Outlook 2013 published by the Asian Development Bank, which indicates our performance in water security and water management.

Hong Kong 2030+ 12
D. Health and Well-being
The World Health Organisation (WHO) defines “health” as “a state of complete physical, mental and social well-being and not merely the absence of disease or infirmity.” It encompasses a broader sense of well-being, incorporating both objective needs such as decent housing and subjective feelings of happiness and life satisfaction. Health development is increasingly taken as a key consideration in assessing city performance.
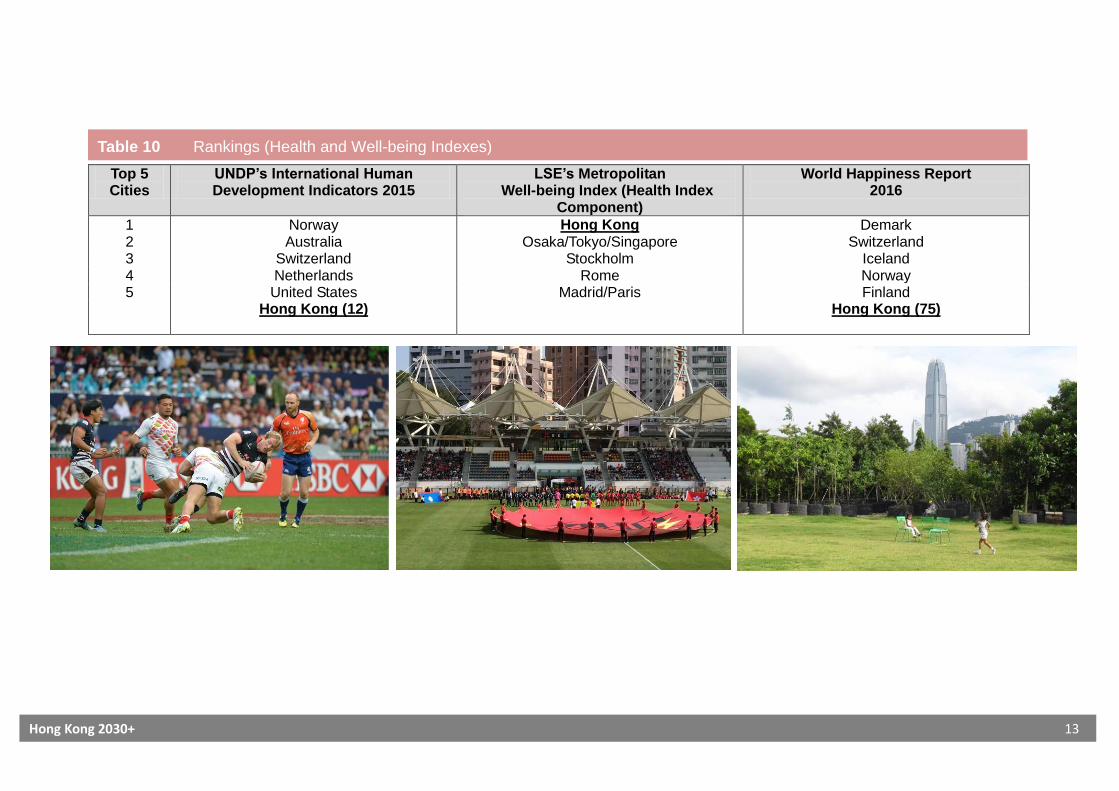
The United Nation Development Programme (UNDP) has compiled a list of International Human Development Indicators with a component measuring life expectancy at birth. In 2014, Hong Kong, ranked 1st in life expectancy at birth among a list of 188 economies21.
In London School of Economics (LSE)’s Metropolitan Well-being Index22, Hong Kong scored best in its health index. This was largely attributable to the high life expectancy at birth and a very low infant mortality rate. According to the Report, notwithstanding the good health performance, pollution, pressure on space, high real estate prices, etc have been affecting all aspects of urban life and the overall well-being of the people.
In addition to physical health, psychological and social well-being is also important. The United Nations Sustainable Development Solutions Network published the World
Happiness Report 201623 to measure the level of happiness of
different countries/cities.
Happiness is an aspiration of every human being, and can also be a measure of social progress. Six key variables are used to explain most of the variation in annual national average scores over time and among countries/cities: GDP per capita, healthy life expectancy, social support, freedom, generosity and absence of corruption. In addition to the six variables, the level of happiness is also affected by each country/city’s average amount of unexplained happiness, which represents happiness that cannot be explained by the aforementioned six variables. In 2016, Hong Kong ranked 75th among 157 economies. A local survey conducted by Lingnan University on Happiness Index for Hong Kong people revealed that work pressure, long working hours and financial burdens were the main factors undermining the happiness of Hong Kong people. Nevertheless, it was interesting to note that sports and outdoor activities were by far the favourite activities of Hong Kong
people24.
Hong Kong 2030+ 13
Top 5 Cities
UNDP’s International Human Development Indicators 2015
LSE’s Metropolitan Well-being Index (Health Index
Component)
World Happiness Report 2016
1 Norway Hong Kong Demark 2 Australia Osaka/Tokyo/Singapore Switzerland 3 Switzerland Stockholm Iceland 4 Netherlands Rome Norway 5 United States Madrid/Paris Finland Hong Kong (12)
Hong Kong (75)
Table 10 Rankings (Health and Well-being Indexes)

Hong Kong 2030+ 14
E. Innovation
Human capital, knowledge and technology are the pre-conditions for an innovative economy. The following are some notable benchmarking indexes for comparing the innovation performance of cities.
In the 2016 Global Innovation Index25 co-published by Cornell University, INSEAD and the World Intellectual Property Organisation, which benchmarked the state of innovation of different economies, Hong Kong ranked 14th in the world and ranked 3rd in Asia. Hong Kong ranked 2nd in innovation inputs, but 25th overall in innovation outputs. According to the Report, Hong Kong generally performed well in terms of innovation inputs such as “Infrastructure” and “Market Sophistication”, but it was relatively weak in “Expenditure in Education” and “government expenditure on education per pupil”.
In the Global Competitiveness Report 2016-2017 published by WEF, “innovation” was one of the aspects underpinning national competitiveness. Hong Kong ranked 9th in overall competitiveness, scoring very well in terms of infrastructure and financial market development. Regarding the pillar of innovation, Hong Kong was ranked 27th. According to the report, “the challenge for Hong Kong is to evolve from one of the world’s foremost financial hubs to an innovative power house” and “innovation is the weakest aspect of Hong Kong’s performance and the capacity to innovate is the biggest concern of the business community”.
In 2thinknow’s Innovation Cities Index 201526, though Hong Kong was classified as a critical nexus for multiple economic and social innovation segments, it ranked only 22nd, lagging behind such world cities as New York (6th) and London (1st). Drawing from these different report cards on the innovation performance of Hong Kong, the common message is that Hong Kong does have good potential in becoming a leading innovative city but there is still some room for improving its innovative capacity.
“The traditional distinction between countries being ‘developed’ or ‘developing’ will become less relevant and we will instead differentiate among countries based on whether they are ‘innovation rich’ or innovation poor’. It is therefore vital that leaders from business, government and civil society work collaboratively to create enabling environments to foster innovation and, in particular, to create appropriate education systems.”
Klaus Chwab Executive Chairman, World Economic Forum

Hong Kong 2030+ 15
Top 5 Cities
Global Innovation Index 2016 Global Competitiveness Report 2016-2017
(Pillar of Innovation)
Innovation Cities Index 2015
1 Switzerland Switzerland London 2 Sweden Israel San Francisco–San Jose 3 United Kingdom Finland Vienna 4 United States United States Boston 5 Finland Germany Seoul Hong Kong (14) Hong Kong (27)
Hong Kong (22)
Global Innovation Index 2016 Global Competitiveness Report 2016-2017 (Innovation and Sophistication Factors)
Innovation Cities Index 2015
Innovation inputs (institution, human capital and research, infrastructure, market sophistication and business sophistication)
Innovation outputs (knowledge and technology outputsv and creative outputsvi)
Innovation was a pillar in the innovation and sophistication factors subindex for measuring global competitiveness
Assessed whether the city environment was conducive to innovative activity (e.g. sufficient R&D investment, presence of high-quality scientific institutions, extensive collaboration between universities and industry, protection of intellectual property, etc)
Cities were scored for innovation on 3 factors capturing the innovation process: cultural assets (measurable sources of ideas such as designers, galleries, museums, etc), human infrastructure (soft and hard infrastructure to implement innovation such as universities, venture capital, technology, etc), and networked markets (basic conditions and connections for innovation such as location, economies of related entities, etc)
Table 11 Rankings (Innovation Indexes)
Table 12 Evaluation Methods & Criteria (Innovation Indexes)

Hong Kong 2030+ 16
Hong Kong has excellent development in terms of internet infrastructure. For example, it was identified as one of the top internet cities by UBM Future Cities27. Hong Kong also has good performing tertiary education institutions with high performers in the QS World University Rankings 2016/1728 which ranked universities based on their research quality, teaching quality, graduate employability and internationalisation. Hong Kong has a good macro environment for innovation, but performed less well in R&D and knowledge and technology outputs.
____________________________________
v The indicators under Knowledge and Technology Outputs include 1) Knowledge Creation (national office resident patent applications, Patent Cooperation Treaty resident
applications, national office resident utility model applications, Scientific and technical publications and Citable documents H index); 2) Knowledge Impact (growth rate of GDP per person engaged, new business density, total computer software spending, ISO 9001 quality certificates and high-tech and medium-high-tech output); and 3) Knowledge Diffusion (royalties and license fees receipts, high-tech exports, communications, computer and information services exports and foreign direct investment net outflows).
vi The indicators under Creative Outputs include 1) Intangible Assets (national office resident trademark applications, Madrid System trademark applications by country of origin, ICTs and business model creation and ICTs and organisational model creation); 2) Creative Goods and Services (cultural and creative services exports, national feature films produced, global entertainment and media output, printing and publishing output and creative goods exports); and 3) Online Creativity (generic top-level domains (gTLDs), country-code top-level domains (ccTLDs), Wikipedia monthly edits and Video uploads on YouTube).
Hong Kong 2030+ 17
F. City Image
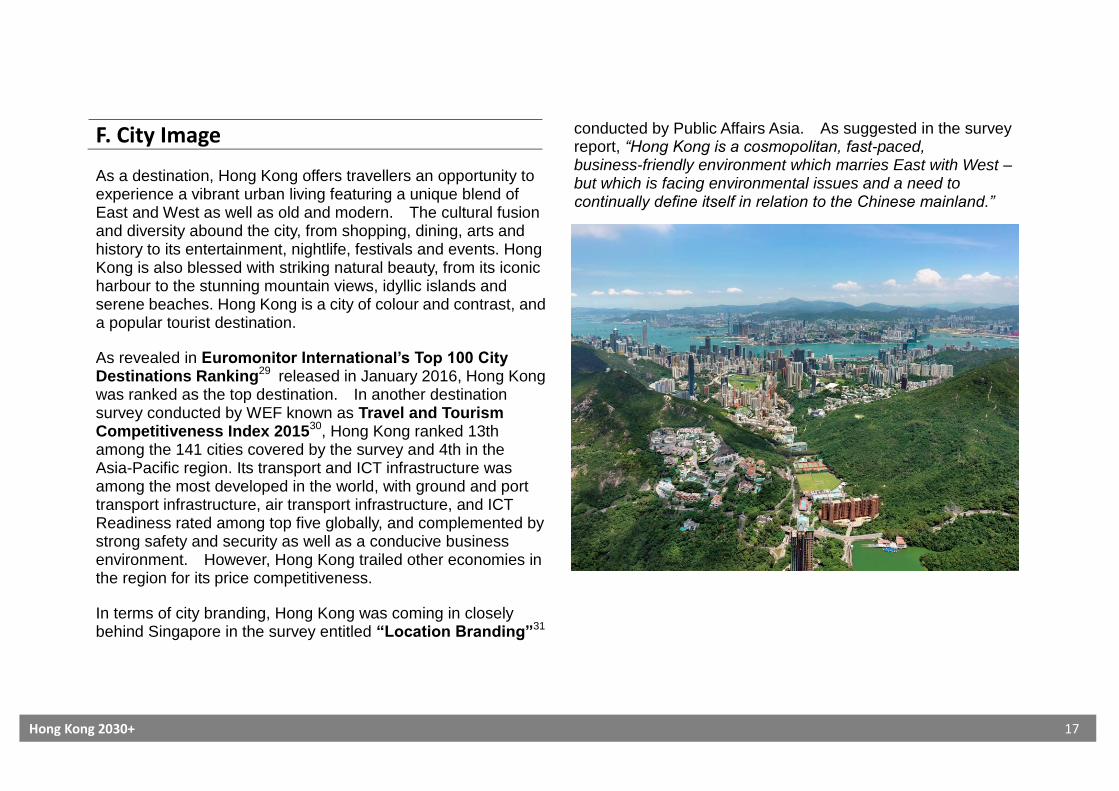
As a destination, Hong Kong offers travellers an opportunity to experience a vibrant urban living featuring a unique blend of East and West as well as old and modern. The cultural fusion and diversity abound the city, from shopping, dining, arts and history to its entertainment, nightlife, festivals and events. Hong Kong is also blessed with striking natural beauty, from its iconic harbour to the stunning mountain views, idyllic islands and serene beaches. Hong Kong is a city of colour and contrast, and a popular tourist destination.
As revealed in Euromonitor International’s Top 100 City Destinations Ranking29 released in January 2016, Hong Kong was ranked as the top destination. In another destination survey conducted by WEF known as Travel and Tourism Competitiveness Index 201530, Hong Kong ranked 13th among the 141 cities covered by the survey and 4th in the Asia-Pacific region. Its transport and ICT infrastructure was among the most developed in the world, with ground and port transport infrastructure, air transport infrastructure, and ICT Readiness rated among top five globally, and complemented by strong safety and security as well as a conducive business environment. However, Hong Kong trailed other economies in the region for its price competitiveness.
In terms of city branding, Hong Kong was coming in closely behind Singapore in the survey entitled “Location Branding”31
conducted by Public Affairs Asia. As suggested in the survey report, “Hong Kong is a cosmopolitan, fast-paced, business-friendly environment which marries East with West – but which is facing environmental issues and a need to continually define itself in relation to the Chinese mainland.”

Hong Kong 2030+ 18
Top 5 Cities
Euromonitor International’s Top 100 City Destinations Ranking 2016
Travel and Tourism Competitiveness Index 2015
Public Affairs Asia: Location Branding 2012
1 Hong Kong Spain Singapore 2 London France Hong Kong 3 Singapore Germany Sydney 4 Bangkok United States Tokyo 5 Paris United Kingdom Melbourne Hong Kong (13)
Table 13 Rankings (City Image Indexes)
Hong Kong 2030+ 19
Overall Assessment
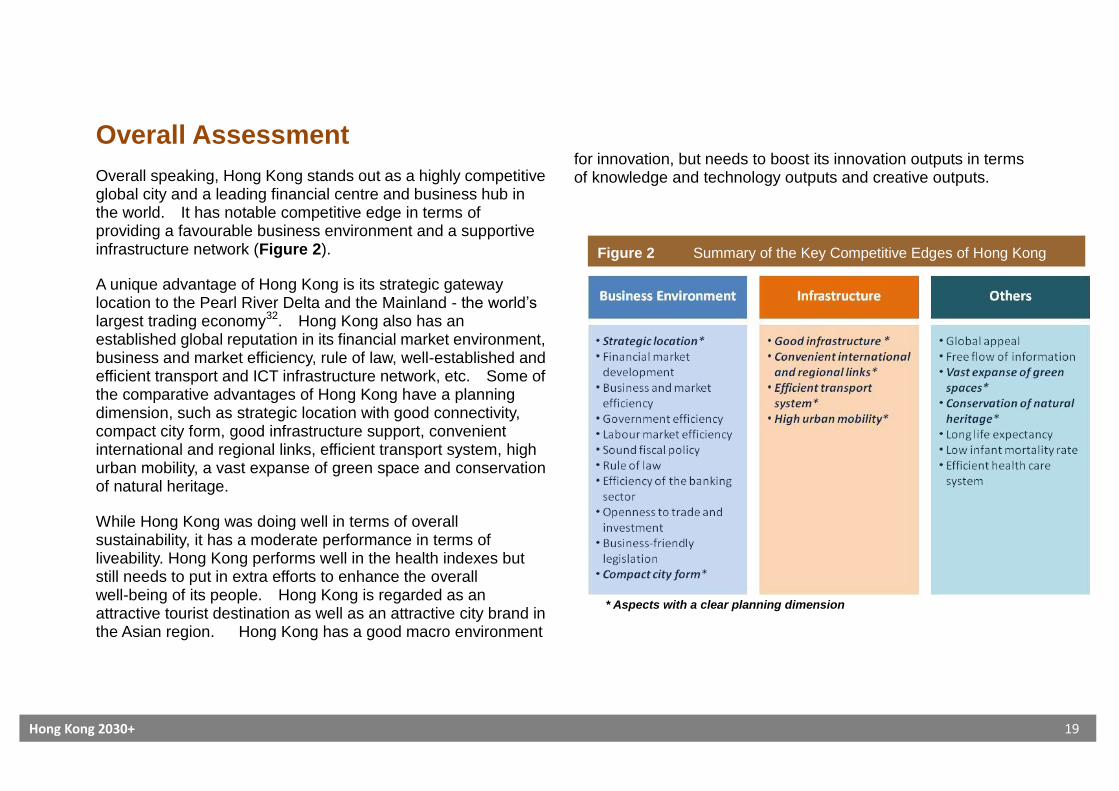
Overall speaking, Hong Kong stands out as a highly competitive global city and a leading financial centre and business hub in the world. It has notable competitive edge in terms of providing a favourable business environment and a supportive infrastructure network (Figure 2).
A unique advantage of Hong Kong is its strategic gateway location to the Pearl River Delta and the Mainland - the world’s largest trading economy32. Hong Kong also has an established global reputation in its financial market environment, business and market efficiency, rule of law, well-established and efficient transport and ICT infrastructure network, etc. Some of the comparative advantages of Hong Kong have a planning dimension, such as strategic location with good connectivity, compact city form, good infrastructure support, convenient international and regional links, efficient transport system, high urban mobility, a vast expanse of green space and conservation of natural heritage.
While Hong Kong was doing well in terms of overall sustainability, it has a moderate performance in terms of liveability. Hong Kong performs well in the health indexes but still needs to put in extra efforts to enhance the overall well-being of its people. Hong Kong is regarded as an attractive tourist destination as well as an attractive city brand in the Asian region. Hong Kong has a good macro environment
for innovation, but needs to boost its innovation outputs in terms of knowledge and technology outputs and creative outputs.
* Aspects with a clear planning dimension
Figure 2 Summary of the Key Competitive Edges of Hong Kong

Hong Kong 2030+ 20
Part B: Global Megatrends
Our world is changing fast and the emerging global megatrends may have far-reaching impacts on the future development of Hong Kong. The salient ones33 are highlighted below (Figure 3). We need to think globally to rise to global challenges and to maintain our competitive edge.
Adapted from KPMG’s Future State 2030: The Global Megatrends shaping Governments
Figure 3 Global Megatrends

Hong Kong 2030+ 21
A. Individuals and Society
Changing Demographic with Ageing Population
Higher life expectancy and falling birth rates are increasing the proportion of elderly people across the world. It is estimated that, the number of people aged 65 and older will double to 1 billion globally by 2030.
Countries would need to monitor and further adjust their policies to accommodate the impacts of ageing populations, taking into account declining labour market productivity, health, elderly care, social and community-based care, accessible infrastructure, etc. We also need to develop policies to encourage youth development through human capital investment, vocational training and education, and entrepreneurship.
Better Education
Education enables empowerment. It is instrumental to increasing productivity amidst shrinking labour force. Innovation, knowledge and a more skilled labour force have become the key to productivity enhancements and long-term economic growth. In addition, the governments would need to address rising expectations for services from a more demanding, more vocal and more connected middle class.
More Technology and Information and Communications Technology (ICT) Enabled
Technological advancement and ICT have greatly transformed our society. They are instrumental in enabling the research and innovation in many other fields such as applied science, engineering, health and transport. Governments are increasingly using big data for better decision making and service delivery as well as social media for better communication.

Hong Kong 2030+ 22
B. Physical Environment
Scarcity and Sustainability of Resources
The combined pressures of population growth, economic growth, climate change and technological advancements will place increased stress on essential natural resources including water, food and energy. The International Energy Agency projects estimated an approximate 40% increase in global energy demand by 2030. Also, about one billion more people will live in areas of water stress by 2030.
Accelerating Urbanisation
Almost two-thirds of the world’s population will reside in cities by 2030. Urban growth is mainly driven by the developing world. Urbanisation is exerting pressure on the needs for large-scale urban infrastructures and natural resources, particularly energy. Policy makers need to ensure adequate access to housing, water and energy for all citizens. Governments are urged to develop long-term infrastructure plans for cities and regions and better manage urbanisation through balancing hard and soft infrastructure.
Climate Change
It is the most significant human-induced environmental issue currently facing the world. Rising greenhouse gas emission is causing climate change and driving a complex mix of unpredictable changes to the environment, and further taxing the resilience of natural and built systems. It is projected that the costs of extreme weather could reach up to 1% of world GDP per annum by 2050. With a warming of 2-3oC, about 20% to 50% of species would be at risk of extinction34. Governments would need to design long-term plans for mitigation strategies for tackling extreme weather and to allow greater role for cities in addressing climate change impacts. As climate change adaptation through land use planning has been adopted by different government authorities, consideration should also be given to the use of various land use planning mechanisms in Hong Kong to address the climate change issues.

Hong Kong 2030+ 23
C. Global Economy
Interconnected Global Economy
The interconnected global economy was manifested in the continued increase in the levels of international trade and capital flows. The trend towards further economic interconnectedness brings significant potential as well as new challenges as economies are increasingly connected to risks beyond national borders. This will lead to continual growth of trade and investment, increasingly complex trade and investment relationships, and greater risk for international contagion events. Governments should be more aware of the economic impacts arising from interconnectedness such as increasing competition and globalised markets for high-end skills.
Rise of the Global Middle Class
It is estimated that about 60% of the world’s population will be middle class in 2030, up from 27% in 2009. About 80% of the global middle class will reside in developing regions in 2030, increased from 58% in 201035. Governments would need to address the rising demands of the middle class, including increasing demand for services, transparency and two-way communication.
Innovation and Technology as Key Drivers As suggested by the WEF36, innovation is the key driver to global growth. Our economies are interconnected and technologies are deeply connected. Within this framework of interconnectedness, innovation and technology will be key drivers of sustainable and equitable growth. Innovation and technology development could facilitate the transformation of an economy into a knowledge-based one, economic growth, and the provision of quality employment opportunities, especially the younger generation. We also need to create a sustainable tech-ecosystem through collaboration with the industry, academia and research community37. Shifting of Economic Power to the East
Driven by trade liberalisation, economic reforms and freer movement of capital and technology from the developed to the developing world, emerging market economies are becoming important players in the global economy. The consequences of economic power shift include the ‘global south’vii as the engine for growth, the emerging multi-polar world order, and increased consumption related economic opportunities. As such, it is important for governments to have a greater understanding of economic comparative advantages in the changing context.
______________________________________________________
vii According to UNDP, The term “South” or “Global South” refers to developing countries, which are located primarily in the Southern Hemisphere.

Hong Kong 2030+ 24
Part C: SWOT Analysis
A SWOT analysis is conducted for Hong Kong with reference to the international benchmarking indexes and relevant statistics and reports. The SWOT analysis (Figure 4) provides a tool for identifying and analysing Hong Kong’s key strengths, weaknesses, opportunities and threats with a planning horizon spanning beyond 2030. The focus of the analysis is on aspects with a spatial planning dimension.
Strengths: Intrinsic advantages and competitive edge over others Weaknesses: Intrinsic disadvantages or constraints affecting the
performance of Hong Kong Opportunities: Niches or realms for Hong Kong to capitalise on in
face of the changing world Threats: External competition and threats
Figure 4 SWOT Analysis Diagram
Hong Kong 2030+ 25
1 Strategic Geographical Location
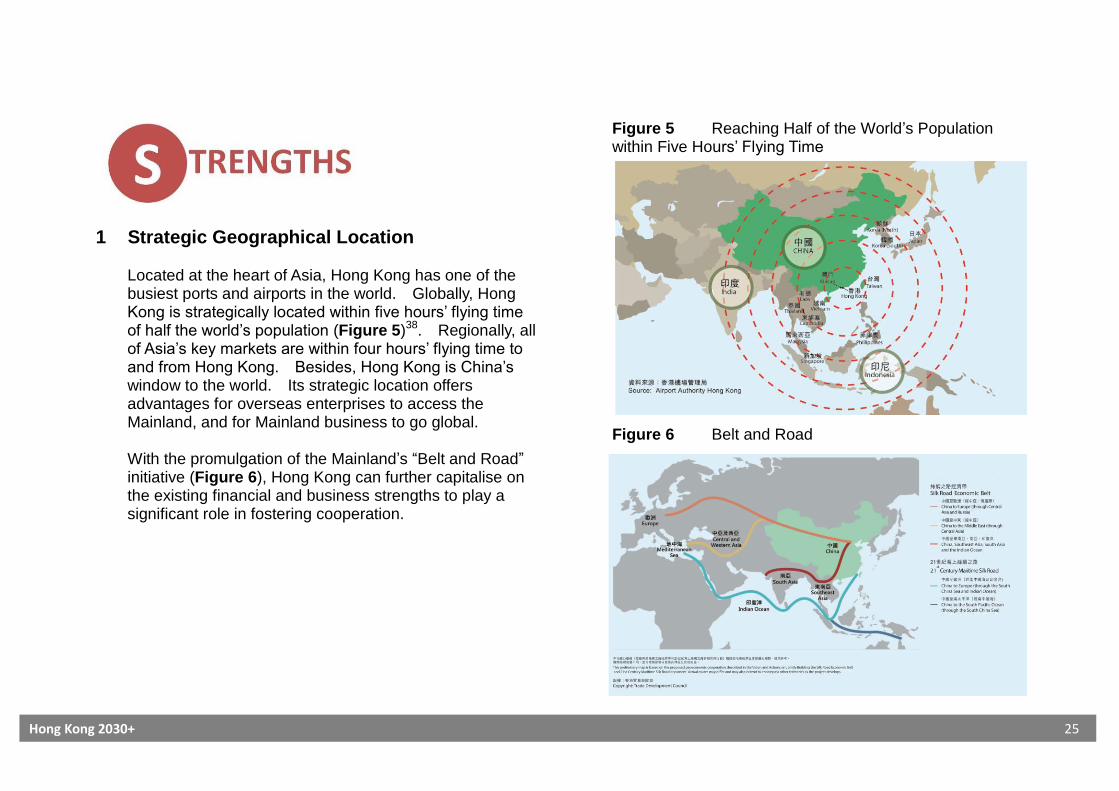
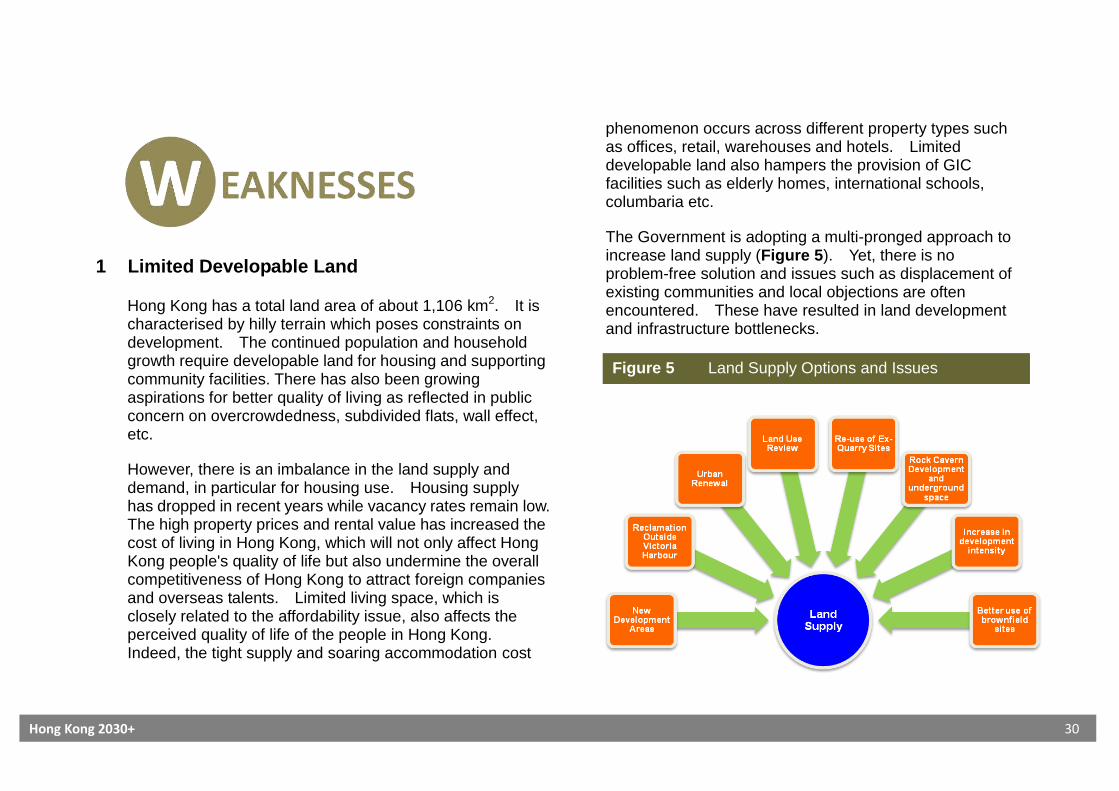
Located at the heart of Asia, Hong Kong has one of the busiest ports and airports in the world. Globally, Hong Kong is strategically located within five hours’ flying time of half the world’s population (Figure 5)38. Regionally, all of Asia’s key markets are within four hours’ flying time to and from Hong Kong. Besides, Hong Kong is China’s window to the world. Its strategic location offers advantages for overseas enterprises to access the Mainland, and for Mainland business to go global. With the promulgation of the Mainland’s “Belt and Road” initiative (Figure 6), Hong Kong can further capitalise on the existing financial and business strengths to play a significant role in fostering cooperation.
Figure 5 Reaching Half of the World’s Population within Five Hours’ Flying Time
Figure 6 Belt and Road

Hong Kong 2030+ 26
2 Reputable International Financial and Business Hub
Hong Kong is one of the leading global financial centres as identified by the GFCI and FDR published by Z/Yen Group and WEF respectively. We should continue our efforts in strengthening our competitiveness on various fronts to uphold this status. Hong Kong has a long-standing reputation as one of the most popular centres for capital-raising amongst major global financial markets. Hong Kong is also a major asset management, capital formation, banking and insurance hub. It is emerging as an international initial public offering (IPO) centre, and a global hub for Renminbi trade settlement, financing and asset management.
Based on the “One Country, Two Systems” principles and the Basic Law, Hong Kong has endeavoured to enhance further co-operation with the Mainland in recent years. The initiatives made under the “Mainland and Hong Kong Closer Economic Partnership Arrangement” (CEPA) and the most recent “Belt and Road” have fostered closer economic cooperation and a conducive environment for Hong Kong’s financial and economic development.
Hong Kong’s excellent business environment has long been the bedrock for its economic success. Key attributing factors include its established financial market development, business and market efficiency, government and labour market efficiency, rule of law, business-friendly
environment, etc. In addition, the compact development mode in Hong Kong helps promote networking opportunities and face-to-face interaction for firms, entrepreneurs and in general the services sector, and boost efficiency in business operations.

Hong Kong 2030+ 27
3 World Class Infrastructure Hong Kong is both an international and a regional transport hub. It has an extensive transport network connecting to the world and the region, including the international airport at Chek Lap Kok, container port, cruise terminals and other planned infrastructure projects which are on the pipeline. Notably Hong Kong-Zhuhai-Macao Bridge (HZMB) and Guangzhou-Shenzhen- Hong Kong Express Rail Link (Hong Kong Section) will greatly facilitate the creation of a “one-hour inter-city living circle” of the areas around the Pearl River Estuary.
Hong Kong also has an efficient, reliable and safe internal transport system. It was ranked the best city in Arthur D. Little’s Urban Mobility Index 201439, attributable to the high percentage of public transport in the modal split, the relatively low number of vehicles per capita, prevalent smart card penetration, low level of transport-related emissions per capita, low rate of traffic-related deaths and a respectable mean travel time to work given its population density.
Railway network is the backbone of the integrated land use – transport – environment planning strategy for Hong Kong. It accounted for about 41% of domestic public transport and some 55% of the land-based cross-boundary passenger trips by end 201540. According to Railway Development Strategy (RDS) 201441, with the implementation of the railway projects, the rail share in the
public transport patronage will further rise to between 45% and 50% in 2031 depending on a myriad of variables. Upon the implementation of the railway proposals in the RDS, the railway network is expected to serve areas inhabited by 75% of the local population and about 85% of job opportunities. The rail system is complemented by efficient bus transport and pedestrian walkway systems to facilitate commuting.
In addition, Hong Kong is one of the cities with the best infrastructures of electricity supply, water availability, and telephony/ICT and technological infrastructure.

Hong Kong 2030+ 28
4 Compact City Form
Our compact, transit-oriented and high-density urban development makes our city very efficient and convenient to live in, do business, work and relax. Hong Kong is renowned for its transit-oriented development (TOD) model, whereby higher density development are planned around railway stations. Currently, about 77% of our commercial and office space and 45% of our living quarters are located within 500m from rail stations. Such development pattern is also conducive to social interaction, information exchange, knowledge spillover, agglomeration economies, efficient provision of transport and other infrastructure and community facilities, walkability, etc. and hence creativity. It is also environmentally friendly as it helps reduce motorised traffic and carbon footprint.
The high-density and compact city form also helps contain urban sprawl and promote conservation of natural resources. The prevalence of green spaces in Hong Kong is not only partly due to its natural geography, but also its proactive policies towards conservation and prudent land use policies. Only about 24% of our land are built-up areas including land taken up for rail/road purposes. About 40% of our land is designated as Country Parks. The countryside and green spaces are easily accessible to the publicix. The transit-oriented urban pattern helps provide a convenient and efficient living environment for the residents.
In the Spatially Adjusted Liveability Index by EIU, Hong Kong was also recognised as a compact city which could maintain its natural heritage, create a dense network of green spaces and enjoy extensive links to the rest of the world.
_______________________________________ ix Currently, about 90% of the population is living within a reachable walking
distance of 400m from a public park or open space, and about 85% of our population is within 3km or a car journey time of about 10 minutes from home to the boundary of a country park.

Hong Kong 2030+ 29
5 Cosmopolitan, Dynamic and Diverse City Development
Hong Kong is characterised by diverse and mixed use/ development which promotes different lifestyles, choices, efficiency, convenience, and shared use of facilities, thereby creating symbiotic relationships and enriching city experience.
Our cityscape is dynamic as it is constantly adapting to the changing economic and social environment. One vivid example of Hong Kong’s adaptive urban fabric is our Victoria Harbour - one of our most valuable heritage and public assets. Its shore used to be occupied by warehouses, cargo handling areas and shipyards, denying public access to the waterfront. Transformation of the harbourfront was triggered in the 1990’s by the Metroplan and is recently sped up with the effort of the Harbourfront Commission. More than half of the 73km-long harbourfront has been or can be potentially transformed into vibrant promenade for the enjoyment of our people and visitors to our city.
Hong Kong is leveraging on its distinctive blend of Chinese and Western cultures to become an international centre for cultural exchanges. Hong Kong's unique global city image and cultural heritage and local characters are important elements of strength. It is a dynamic city where creativity and entrepreneurship converge. It is a cosmopolitan city offering global connectivity and rich diversity.
In addition, Hong Kong has extraordinary biodiversity for a densely populated city. The richness is a valuable asset and the fruit of decades of conservation efforts. Taking into account local needs and priorities, the Government is formulating the first city level Biodiversity Strategy and Action Plan for Hong Kong in response to the Convention on Biological Diversity to provide an administrative and planning guidance on the conservation of local biodiversity. It helps stepping up conservation efforts in biodiversity and supporting sustainable development of Hong Kong.
Hong Kong 2030+ 30
1 Limited Developable Land
Hong Kong has a total land area of about 1,106 km2. It is characterised by hilly terrain which poses constraints on development. The continued population and household growth require developable land for housing and supporting community facilities. There has also been growing aspirations for better quality of living as reflected in public concern on overcrowdedness, subdivided flats, wall effect, etc.
However, there is an imbalance in the land supply and demand, in particular for housing use. Housing supply has dropped in recent years while vacancy rates remain low. The high property prices and rental value has increased the cost of living in Hong Kong, which will not only affect Hong Kong people's quality of life but also undermine the overall competitiveness of Hong Kong to attract foreign companies and overseas talents. Limited living space, which is closely related to the affordability issue, also affects the perceived quality of life of the people in Hong Kong. Indeed, the tight supply and soaring accommodation cost
phenomenon occurs across different property types such as offices, retail, warehouses and hotels. Limited developable land also hampers the provision of GIC facilities such as elderly homes, international schools, columbaria etc.
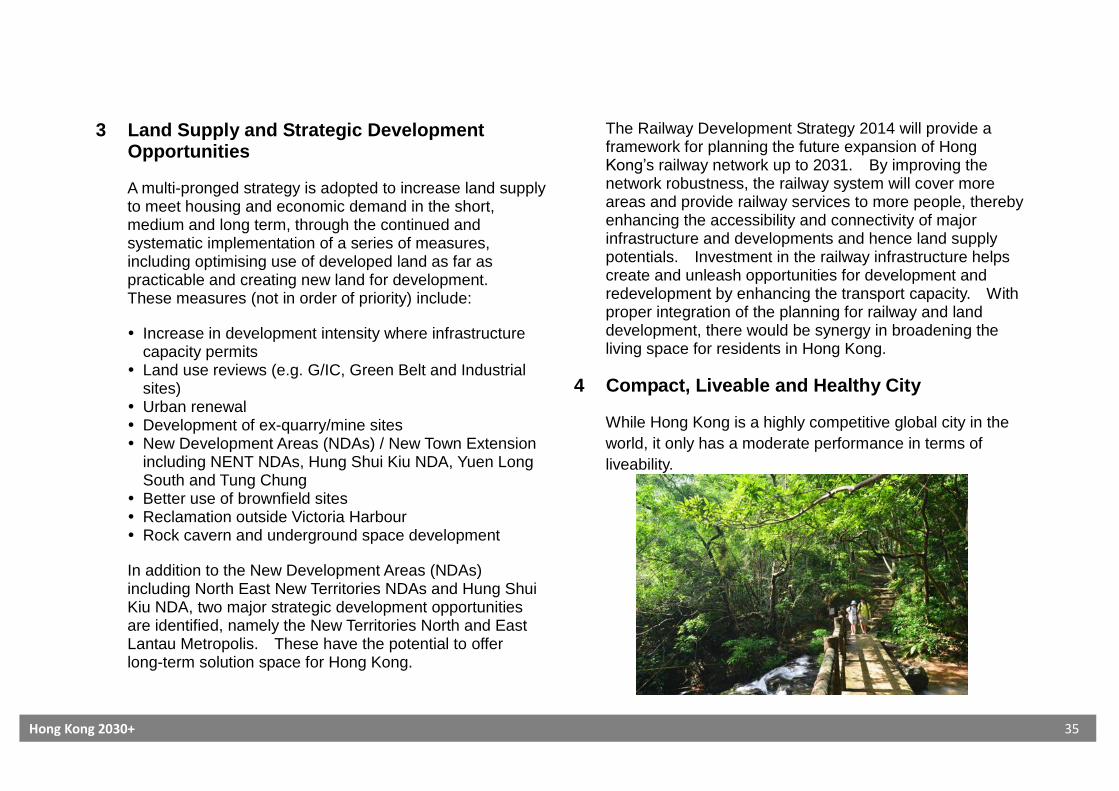
The Government is adopting a multi-pronged approach to increase land supply (Figure 5). Yet, there is no problem-free solution and issues such as displacement of existing communities and local objections are often encountered. These have resulted in land development and infrastructure bottlenecks.
Figure 5 Land Supply Options and Issues

Hong Kong 2030+ 31
2 Susceptible to External Economic Shocks
As a small and open economy, Hong Kong has been susceptible to regional and global shocks, as exemplified by the Asian Financial Crisis in 1997, the global financial tsunami in 2008 and the Eurozone sovereign debt crisis in 2011. Given our position as a highly open international business and financial centre as well as our close connection with the rest of the world with high volume of international trade and the free flow of capital, Hong Kong’s economic performance would inevitably be greatly influenced by the global economic environment and financial market developments. It is thus important for the Government and the related regulatory authorities to ensure a sound financial infrastructure with prudent regulatory regime so as to safeguard the macroeconomic resilience and financial stability against external shocks and unexpected events. The Government also needs to stay vigilant to global economic and financial developments, and formulate appropriate responses when necessary.
3 Relatively Weak in Innovation and Technology
Innovation and technology (I&T) have been identified as new economic areas which Hong Kong has clear advantage and should be further promoted. Due to the late start on the development of this sector compared with other economies , Hong Kong's performance in I&T in past years is relatively weak, even though there is a good macro environment and with various support from Government
such as funding, cash rebates and infrastructure. The I&T sector has experienced difficulties in recruiting R&D personnel, attracting industrial investment and entrepreneurial capital, fostering university-industrial links and limited local manufacturing activities. According to C&SD, the ratio to GDP of R&D expenditure in 2014 is only 0.74%42. To remain competitive in the future world, it is crucial for us to create an enabling environment to foster innovation and technology.
4 Relatively Weak in Cultural Character
The social and cultural character of a city plays an important role in shaping its attractiveness for talent and visitors. Despite its modern and global city image, Hong Kong is considered by some to be relatively weak in cultural character, as noted in EIU’s “Hot Spots 2025: Benchmarking the Future Competitiveness of Cities”x.
Hong Kong is a global city but yet a predominantly Chinese society. There is scope for enhancing its cosmopolitan character. At the same time, the trend of globalisation and regionalisation would often result in diminishing local character. This will hamper the diversity and dynamism which are important attributes of Hong Kong.
________________________________________ x “Social and Cultural Character” denotes openness and diversity in each city
based on five attributes: (1) the degree of global/regional ethnic/racial diversity; (2) the number of different languages spoken or heard; (3) whether English or another major language is widely spoken; (4) whether foreigners feel comfortable; and (5) whether there is an acceptance of different lifestyles and beliefs.

Hong Kong 2030+ 32
5 Environmental Issues
Hong Kong is facing environmental problems, particularly in terms of air pollution and municipal solid waste generation and disposal. Electricity accounted for about half of Hong Kong’s total energy consumption43. According to the fuel mix consultation document issued by Environment Bureau in March 2014, the use of coal accounts for 53% in the fuel mix of Hong Kong in 2012. Besides, as more municipal solid waste and construction waste are generated, the city’s existing landfills will soon reach their designed capacities44. To address the waste management problem and develop a sustainable waste management regime, the Environment Bureau promulgated the “Hong Kong Blueprint for Sustainable Use of Resources (2013-2022)” in May 2013 and “A Food Waste & Yard Waste Plan for Hong Kong 2014-2022” in February 2014 to map out a comprehensive waste and resource management strategy with targets, policies and actions plans for waste reduction, reuse, recycling, modern waste-to-energy infrastructures and hygienic landfilling for the coming years up to 2022. The Environment Bureau also commenced in 2015 a study for planning of future waste management and transfer facilities to identify additional strategic and regional waste facilities needed up to 2041, on the basis of "smart city" and circular economy concepts to support sustainable development. On air side, the Environment Bureau promulgated “A Clean Air Plan for Hong Kong” in March 2013 to set out in detail the various measures to tackle air pollution from power plants,
land and sea transport, and non-road mobile machinery and to strengthen collaboration with Guangdong to deal with regional pollution.

Hong Kong 2030+ 33
1 Broadening Economic Base and Transforming the Economy
The Hong Kong economy is dominated by the service sector, in particular, by four pillar industries, viz. financial services, trading and logistics, tourism and professional and producer services. We need to move up the value chain in future economic transformation by: promoting new emerging industries, especially those
knowledge and technology-based and high value-added ones (e.g. innovation and technology, energy saving and green technology, and modern industries);
facilitating innovation start-ups, riding on an emerging entrepreneurship around the world and technopreneurship in particular;
supporting the small and medium enterprises accounting for over 98% of our local business units to move up the value chain; and
nurturing local talents and attract those from overseas.
2 Regional and Mainland Opportunities
Hong Kong benefits from the many opportunities arising from the momentum provided by the rapid development of the region, including the Mainland and the Association of Southeast Asian Nations (ASEAN) economies. Capitalising on its strategic gateway position to China and Asia, Hong Kong possesses unique comparative advantage over many other cities in accessing the China and Asian markets.
There are a number of infrastructure projects that would enhance the linkages with the PRD West (Figure 8) and help creating a “one-hour intercity traffic circle” in the Greater PRD (Figure 9). This provides Hong Kong with a wider hinterland and market as well as more cooperation opportunities These include cross-boundary transport infrastructural projects (viz. Hong Kong-Zhuhai-Macao Bridge (HZMB), Guangzhou-Shenzhen-Hong Kong Express Rail Link (Hong Kong Section), Liantang/ Heung Yuen Wai Boundary Control Point (LT/HYW BCP), and the development of new districts (viz. Qianhai in Shenzhen, Nansha in Guangzhou, and Hengqin in Zhuhai). As a three-hour living circle within the Greater PRD Region is in the making, there is a need to ensure that the region as a whole should focus on economic growth as well as invest in the development of a quality living environment.

Hong Kong 2030+ 34
The National Thirteenth Five-year Plan emphasises the deepening of cooperation between the Mainland and Hong Kong, including the creation of Guangdong-Hong Kong-Macao cooperation platforms in Qianhai, Nansha and Hengqin, the development of the Guangdong-Hong Kong-Macao Bay Area, and the fostering of cooperation within the Pan-PRD Region. New initiatives such as China (Guangdong) Pilot Free Trade Zone (FTZ) and the “Belt and Road” Initiative will foster cooperation not only within the PRD, but also with other countries in Europe, Africa and Asia, including the Association of Southeast Asian Nations (ASEAN), opening up further economic opportunities and development platforms that extend beyond our city boundary.
Figure 8 Infrastructure in the Greater PRD Region Figure 9 One-hour Intercity Traffic Circle
Hong Kong 2030+ 35
3 Land Supply and Strategic Development Opportunities
A multi-pronged strategy is adopted to increase land supply to meet housing and economic demand in the short, medium and long term, through the continued and systematic implementation of a series of measures, including optimising use of developed land as far as practicable and creating new land for development. These measures (not in order of priority) include:
Increase in development intensity where infrastructure capacity permits
Land use reviews (e.g. G/IC, Green Belt and Industrial sites)
Urban renewal Development of ex-quarry/mine sites New Development Areas (NDAs) / New Town Extension
including NENT NDAs, Hung Shui Kiu NDA, Yuen Long South and Tung Chung
Better use of brownfield sites Reclamation outside Victoria Harbour Rock cavern and underground space development
In addition to the New Development Areas (NDAs) including North East New Territories NDAs and Hung Shui Kiu NDA, two major strategic development opportunities are identified, namely the New Territories North and East Lantau Metropolis. These have the potential to offer long-term solution space for Hong Kong.
The Railway Development Strategy 2014 will provide a framework for planning the future expansion of Hong Kong’s railway network up to 2031. By improving the network robustness, the railway system will cover more areas and provide railway services to more people, thereby enhancing the accessibility and connectivity of major infrastructure and developments and hence land supply potentials. Investment in the railway infrastructure helps create and unleash opportunities for development and redevelopment by enhancing the transport capacity. With proper integration of the planning for railway and land development, there would be synergy in broadening the living space for residents in Hong Kong.
4 Compact, Liveable and Healthy City
While Hong Kong is a highly competitive global city in the
world, it only has a moderate performance in terms of
liveability.

Hong Kong 2030+ 36
Notwithstanding this, Hong Kong has good potential in developing into an exemplary compact, liveable and healthy city to show the world and help maintain our competitiveness by attracting talents from all over the world. By improving our congested built environment, reinforcing our good planning practices and introducing new initiatives, planning can help create a better city environment. This could meet the general community aspirations for health and well being, inclusive with bountiful economic opportunities, employment opportunities closer to homes, affordable accommodation, spacious dwellings and activity space, walkable, green and clean, opportunities for leisure and recreation, resilience to climate change, hazard and ageing infrastructure, and proactive protection and conservation of the protected areas and valuable ecological, landscape and historical assets, arts development and heritage conservation, etc.
5 Create Environmental Capacity
Hong Kong needs to create more development capacity in terms of land, transport and other infrastructure provision; and at the same time to create/ regenerate our environmental capacity and improve our environment to cater for sustainable development. Guiding principles and planning framework of environmental protection and nature conservation to create/ replenish environmental capacity are detailed in the topical paper “Environmental Protection and Nature Conservation for Sustainable Growth.”
Hong Kong 2030+ 37
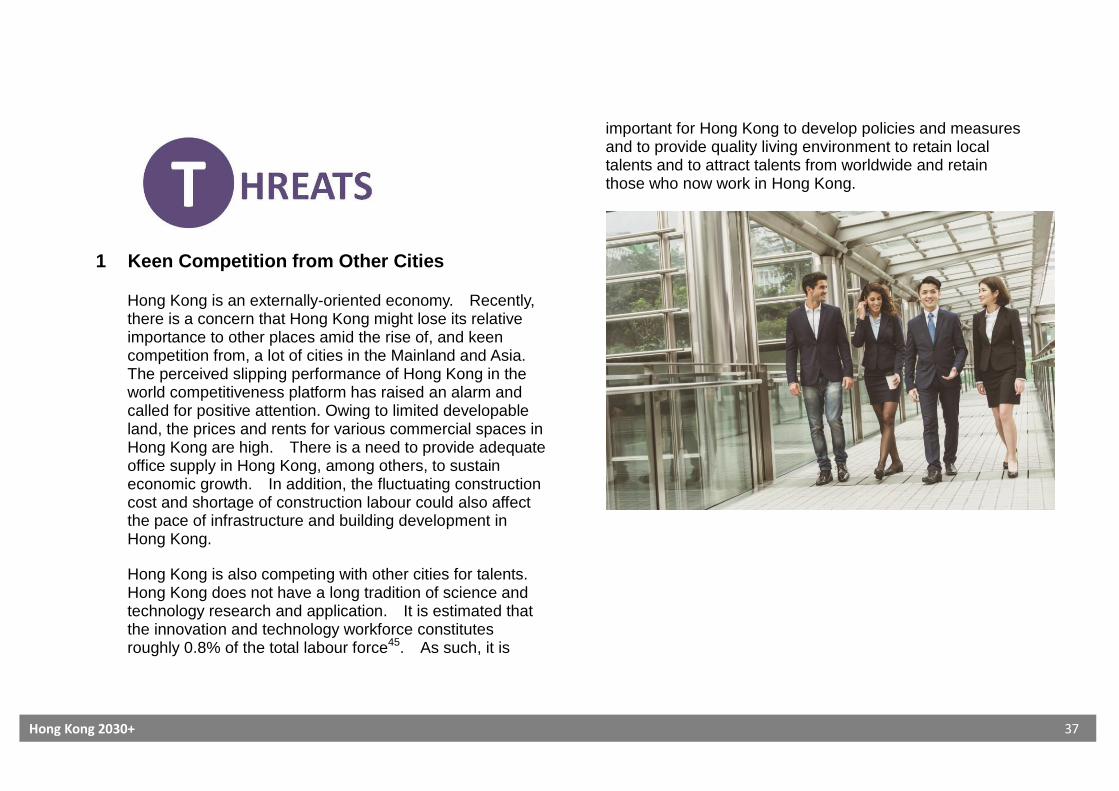
1 Keen Competition from Other Cities Hong Kong is an externally-oriented economy. Recently, there is a concern that Hong Kong might lose its relative importance to other places amid the rise of, and keen competition from, a lot of cities in the Mainland and Asia. The perceived slipping performance of Hong Kong in the world competitiveness platform has raised an alarm and called for positive attention. Owing to limited developable land, the prices and rents for various commercial spaces in Hong Kong are high. There is a need to provide adequate office supply in Hong Kong, among others, to sustain economic growth. In addition, the fluctuating construction cost and shortage of construction labour could also affect the pace of infrastructure and building development in Hong Kong.
Hong Kong is also competing with other cities for talents. Hong Kong does not have a long tradition of science and technology research and application. It is estimated that the innovation and technology workforce constitutes roughly 0.8% of the total labour force45. As such, it is
important for Hong Kong to develop policies and measures and to provide quality living environment to retain local talents and to attract talents from worldwide and retain those who now work in Hong Kong.

Hong Kong 2030+ 38
2 Ageing Population and Shrinking Labour Force Hong Kong’s population is ageing, particularly attributable to a longer life expectancy and a low fertility rate. According to C&SD’s latest population projection, old aged population (i.e. aged 65 and over) will rise significantly from 15% in 2014 to 33% in 2044 and 36% in 2064 and those aged 85 or above would increase by almost 5 folds (from 2.2% in 2014 to 10.1% in 2064)46. The Government should alert to such impact which might result in an “ageing tsunami” for Hong Kong and the problem should not be under-estimated (e.g. provision for health and services demand, elderly care, age-friendly design for buildings and the public environment, etc.) (Figure 10). The ageing population will lead to the problems of shrinking labour force and hence affect the growth in productivity. It will also require increased public spending on healthcare and elderly services. Our labour force (excluding foreign domestic helpers (FDHs)) will reach its peak by 2018 at 3.65 million and decrease to about 3.11 million in 2064. Economic growth in future will depend more on increasing productivity through enabling education and technology among others.
Figure 10 Trends of Ageing Population

Hong Kong 2030+ 39
3 Ageing Building Stock Hong Kong has a significant amount of old buildings. About 326,000 private housing units will be aged 70 or above by 2046, nearly 300 times of those in 2015. If we do not act in time, their conditions will deteriorate rapidly. High-rise buildings and multiple owners would compound the difficulties in urban renewal. The redevelopment process will take a long time to complete and flats are required to accommodate the displaced households. As the need for redevelopment rises, such a demand for housing land would become more sizeable.
4 Climate Change
Same as the other cities in the world, Hong Kong is facing the challenges arising from the climate change issues. According to the Hong Kong Observatory (HKO)47, the annual temperature of Hong Kong between 1986and 2015 has increased by 0.17oC per decade. The number of very hot days (daily maximum air temperature at 33°C or above) and hot nights (daily minimum air temperature greater than 28°C) has increased dramatically. The preliminary projection conducted by HKO indicates that, under the high greenhouse gas emission scenario, Hong Kong’s temperature is expected to further rise by 1.5-3oC in the mid 21st century (2051-2060).
Hong Kong is also suffering from the urban heat island effect, with the urban areas generally warmer than the rural surroundings. The problem is compounded by the congested built environment and poor air ventilation. This leads to uncomfortable urban living, heat stress and related health problems, and increase in energy consumption. All in all, this has resulted in poorer living quality.
Apart from the rising temperature, extreme weather events such as extreme heat and extreme rainfall are becoming more frequent due to a warming climate and the mean sea level at Victoria Harbour has increased at a rate of 30mm per decade between 1954 and 2015. In connection with mean sea level, there is an increased risk of sea flooding as a result of storm surges brought by tropical cyclones.

Hong Kong 2030+ 40
The passage of the Paris Agreement in 2015 signifies the collaborative international commitment to control global warming and reduce GHG emissions. As a world city, Hong Kong shall continue to join the global efforts in combating the climate change issues.
5 Resources Availability
In addition to shortage of land and shrinking labour force as explained in the preceding paragraphs as well as limited financial resource availability, Hong Kong has limited indigenous city resources, especially energy and water resources.
Hong Kong is highly energy dependent. To help combat climate change and reduce the environmental impact arising from the use of fossil fuels, promoting energy saving and the use of renewable energy is becoming increasingly important. It is necessary to promote energy conservation and green building development by enhancing the green performance of buildings, conduct periodic reviews to expand and/or tighten relevant energy-related standards, promote the application and development of renewable energy, promote the use of renewable energy and mobilise the community to take collective actions to change our behaviour and to invest in more energy efficient products, technologies and practices.
With the growing population and economic development, the water consumption of Hong Kong is high. With around
130 litres of domestic fresh water and over 90 litres of flushing water consumption, the estimated per capita daily water consumption is over 220 litres, which is more than the global average of about 170 litres48. In view of uncertainties such as climate change and the global decrement of clean water sources, we have to better prepare through implementing a Total Water Management Strategy to conserve water and develop new water resources which are less sensitive to climate change such as seawater desalination reclaimed water, while at the same time enhance the cooperation with other PRD cities in promoting the sustainable use of water resources.
There is also a growing concern on Hong Kong’s food security. About 90% of the total food supply in Hong Kong is imported food. The Mainland is our most important food source, especially for fresh food49. In view of such global threats as climate change and food crisis, there is a call for a rethink of our food supply, including local produce.

Hong Kong 2030+ 41
Conclusion
This SWOT Analysis (Figure 11) for Hong Kong is not meant to be exhaustive. Its focus is mainly on the most salient aspects or realms with spatial planning dimension. On the one hand, we have to reinforce our strengths and capitalise on our opportunities. On the other hand, we need to explore how strategic spatial planning can help address our weaknesses and tackle our threats.
As revealed in the above analysis, Hong Kong is vulnerable to losing its edge on certain fronts with the rising competition and challenges from other fast-growing cities, particularly those in Asia, in the globalisation era. We would plan for a liveable high-density city with a desirable urban form, i.e. smart, green, resilient and healthy, in order to provide good living quality. We shall strive to create more capacity for sustainable growth (including developable land and supporting transport and infrastructure provision as well as environmental capacity). We would also investigate how to provide suitable, adequate and timely land supply for our diversified economic needs and to create new business and employment opportunities to enhance our economic competitiveness. The above would in turn help attract and retain talents to drive growth.
Figure 11 SWOT Analysis for Hong Kong (Gist)
Hong Kong 2030+ 42
ENDNOTES 1 The World according to the Globalisation and World Cities Research Network. http://www.lboro.ac.uk/gawc/world2012t.html. 2 Global Power City Index. http://www.mori-m-foundation.or.jp/english/ius2/gpci2/index.shtml. 3 Global Cities Index. http://www.atkearney.com/research-studies/global-cities-index. 4 Hot Spots: Benchmarking Global City Competitiveness. http://www.citigroup.com/citi/citiforcities/pdfs/eiu_hotspots_2012.pdf. 5 Hot Spots 2025: Benchmarking the Future Competitiveness of Cities. http://www.citigroup.com/citi/citiforcities/pdfs/hotspots2025.pdf. 6 The World Competitiveness Yearbook 2016. http://www.imd.org/uupload/imd.website/wcc/scoreboard.pdf. 7 The Global Competitiveness Report 2016-2017. https://www.weforum.org/reports/the-global-competitiveness-report-2016-2017-1/. 8 The Financial Development Report 2012. http://www.weforum.org/reports/financial-development-report-2012. 9 http://www.info.gov.hk/gia/general/201211/01/P201211010290.htm. 10 The Global Financial Centres Index 19 2016. http://www.longfinance.net/global-financial-centre-index-19/992-gfci-19.html. 11 World Bank’s Doing Business Report 2016. http://www.doingbusiness.org/reports. 12 2015 Global Opportunity Index. http://www.globalopportunityindex.org/ 13 Quality of Living Survey– Mercer Survey. https://www.imercer.com/content/mobility/quality-of-living-city-rankings.html 14 A Summary of the Liveability Ranking and Overview August 2016 15 The Monocle Quality of Life Survey 2016. https://monocle.com/film/affairs/top-25-cities-2016/ 16 https://www.imercer.com/content/quality-of-living.aspx 17 Ditto
18 http://www.straitstimes.com/singapore/housing/spore-still-among-worlds-liveable-cities. The Strait Times “Singapore still among world's liveable cities”. 24
August 2016. 19 http://ourworld.unu.edu/en/the-2010-human-sustainable-development-index/ 2010 Human Sustainable Development Index. In the 2014 Human
Development Report (HDR) which covers 186 economies, Hong Kong ranks 15th in the HDI (Top 5: Norway, Australia, Switzerland, Netherlands and US). 20 Asian Green City Index. http://www.siemens.com/entry/cc/features/greencityindex_international/all/en/pdf/report_asia.pdf.
21 UNDP International Human Development Indicators – Health Index. http://hdr.undp.org/en/indicators/72206# 22 Hong Kong 2011 Cities, Health and Well-being. http://files.lsecities.net/files/2011/11/Health-Education-and-Wealth-in-129-
Metropolitan-Regions3.jpg/. 23 Helliwell, John F., Richard Layard, and Jeffrey Sachs, eds. 2016. World Happiness Report 2016. New York: UN Sustainable Development Solutions
Network. 24 Centre for Public Policy Studies of Lingnan University - Hong Kong Happiness Index Survey http://www.ln.edu.hk/news/20151130/Happiness_Index_2015 25 2016 Global Innovation Index. https://www.globalinnovationindex.org/home. 26 Innovation Cities Index 2015. http://www.innovation-cities.com/innovation-cities-index-2015-global/9609. 27 UBM Future Cities: Top 10 Internet Cities. http://www.ubmfuturecities.com/document.asp?doc_id=525595. 28 QS World University Rankings. http://www.topuniversities.com/.
Hong Kong 2030+ 43
29 Euromonitor International. http://blog.euromonitor.com/2016/01/top-100-city-destinations-ranking-2016.html. 30 Travel and Tourism Competitiveness Index 2015. http://reports.weforum.org/travel-and-tourism-competitiveness-report-2015/ 31 Public Affairs Asia: Location Branding 2012. http://www.publicaffairsasia.net/location_branding2012.pdf. 32 Brand Hong Kong: Facts about Hong Kong – Gateway to China. http://www.brandhk.gov.hk/en/facts/factsheets/pdf/03_gateway_to_china_en.pdf 33 Adapted from KPMG (2014) Future State 2030: The Global Megatrends Shaping Governments.
https://www.kpmg.com/Global/en/IssuesAndInsights/ArticlesPublications/future-state-government/Documents/future-state-2030-v3.pdf 34 Ditto. 35 Ditto. 36 “Why innovation is the key that will unlock global growth”.
https://www.weforum.org/agenda/2015/09/why-innovation-is-the-key-that-will-unlock-global-growth/ 37 Speech by S for IT at Internet of Things Conference of APAC Innovation Summit 2016 Series (English only).
http://www.itb.gov.hk/en/speeches/2016/pr_20160407.htm 38 http://www.hongkongairport.com/eng/business/about-the-airport/welcome.html Hong Kong International Airport, 2014. 39 Arthur D. Little, The Future of Urban Mobility 2.0 – Imperatives to shape extended mobility ecosystems of tomorrow, 2014.
http://www.adlittle.com/downloads/tx_adlreports/Arthur_D._Little___UITP_Future_of_Urban_Mobility_2_0.pdf. 40 Hong Kong: The Facts – Railway Network (April 2016). http://www.gov.hk/en/about/abouthk/factsheets/docs/railway.pdf 41 Transport and Housing Bureau. Railway Development Strategy 2014. http://www.thb.gov.hk/eng/psp/publications/transport/publications/rds2014.pdf. 42 Census and Statistics Department . Research and Development (R&D) Expenditure and R&D Personnel.
http://www.censtatd.gov.hk/hkstat/sub/so120.jsp 43 Electrical and Mechanical Services Department (2015) “Hong Kong Energy End-use Data 2015”.
http://www.emsd.gov.hk/filemanager/en/content_762/HKEEUD2015.pdf 44 Environment Bureau. "The Hong Kong: Blueprint for Sustainable Use of Resources 2013-2022" 45 HK Monthly Digest of Statistics April 2013, Feature Article: The Four Key Industries and Other Selected Industries in the Hong Kong Economy 46 Census and Statistics Department (2015) Hong Kong Population Projections 2015-2064.
http://www.censtatd.gov.hk/media_workers_corner/pc_rm/hkpp2015_2064/index.jsp 47 Hong Kong In A Warming World (http://www.hko.gov.hk/climate_change/climate_change_e.pdf) 48 LCQ9: Use of water resources (November 9, 2011). http://www.info.gov.hk/gia/general/201111/09/P201111090226.htm 49 Frequently Asked Questions on Food Supply of Hong Kong. www.fhb.gov.hk/download/press...food.../e_food_supply_faq.pdf.