Embed Size (px)
Citation preview

Hong Kong Baptist University
DOCTORAL THESIS
Chemical and toxicological characterization of chemical contaminants in airpollution particulate matterBillah, Md Baki
Date of Award:2015
Link to publication
General rightsCopyright and intellectual property rights for the publications made accessible in HKBU Scholars are retained by the authors and/or othercopyright owners. In addition to the restrictions prescribed by the Copyright Ordinance of Hong Kong, all users and readers must alsoobserve the following terms of use:
• Users may download and print one copy of any publication from HKBU Scholars for the purpose of private study or research • Users cannot further distribute the material or use it for any profit-making activity or commercial gain • To share publications in HKBU Scholars with others, users are welcome to freely distribute the permanent URL assigned to thepublication
Download date: 22 Dec, 2021

Chemical and Toxicological Characterization of Chemical
Contaminants in Air Pollution Particulate Matter
BILLAH Md. Baki
Hong Kong Baptist University
August 2015
A thesis submitted in partial fulfillment of the requirements
for the degree of
Doctor of Philosophy
Principal Supervisor: Prof. WONG Chris KC


CHEMICAL AND TOXICOLOGICAL CHARACTERIZATION OF
CHEMICAL CONTAMINANTS IN AIR POLLUTION
PARTICULATE MATTER
BILLAH MD. BAKI
HONG KONG BAPTIST UNIVERSITY
2015
Ph.D. Thesis


i
Declaration
I hereby declare that this thesis represents my own work which has been done
after registration for the degree of Ph.D at Hong Kong Baptist University, and has
not been previously included in a thesis or dissertation submitted to this or any
other institution for a degree, diploma or other qualifications.
Signature:
Date: August 2015

ii
Abstract
In wintertime hazy episodes, the air pollution in northern China has always
reached to an alarming level. In the winter of 2012-13, the trans-boundary air
pollution from China has attracted national and global attention. An elevated
public awareness to the unprecedented pollution levels has prompted much
investigation on the health effects of fine particulate matter (PM), in particular
PM2.5. Since PM-elicited harmful effects primarily depends on the composition of
chemical contaminants adsorbed, in this study we characterized the chemical
compositions of PM2.5 and determined its associated toxicity.
Samples of PM2.5 were collected using high-volume samplers installed in five
northern and southern cities in China. One typical (polycyclic aromatic
hydrocarbons, PAHs) and one emerging (perfluorinated compounds, PFCs) family
of organic pollutants were analyzed using gas chromatography–mass spectrometry
(GC-MS) or liquid chromatography-MS-MS (LC-MS-MS), followed by in-vitro
or/and in vivo studies. In Chapters 2 and 3, sixteen PAH congeners in PM2.5
samples collected from five different cities (Hong Kong (HK), Guangzhou (GZ),
Xiamen (XM), Xi’an (XA) and Beijing (BJ)) in the winter and summer time
2012-13 was analyzed. The biological effects of the sample extracts were
determined using the human bronchial epithelial cells BEAS-2B. The total PAH
concentrations ranged from 3.35 to 80.45 ng/m3 air, leading by BJ, followed by
XA, XM, GZ and HK. In a comparison of the physical and chemical data of the
samples obtained during the winter and summer sampling periods, the amount of
PM collected per unit time and the concentrations of PAHs adsorbed were found
to be remarkably greater in the winter time. In the cell culture study, the
expression levels of the pro-inflammatory cytokine (interleukin-6, IL-6) and
detoxifying enzymes (i.e. cytochrome p450 enzymes, CYP1A1 and CYP1B1)
were found to be stimulated in the treatment. The cells exposed to sample extracts
prepared from XA and BJ demonstrated significant migratory activities, indicating
a sign of increase of tumorigenicity. These data highlighted the risk of getting
lung cancer in local population.
In chapters 4 and 5, we focused on the emerging pollutants PFCs, in particular
PFOS. Chemical characterization was implemented using the winter samples.

iii
Biological effects of PFOS were conducted using omics approach in a maternal-
fetal model. Therefore, in the first part of chapter 4, we measured the
concentrations of nine PFC congeners in PM2.5 samples using LC-MS-MS.
Generally, the eight PFCs, namely PFOS, PFDoA, PFUdA, PFDA, PFNA, PFOA,
PFHxA and PFBA were detected in all the sampling cities, with the exception
PFHxS which was below the limit of detection. The total PFC concentrations
ranged from 121.2 to 192.2pg/m3, leading by GZ, followed by XA, BJ, XM and
HK. The data denoted the risk of inhalation exposure to PFCs through PM2.5,
which enter into blood circulations via lung alveoli, presumably penetrates
through placenta in affecting fetal health. Therefore, in the latter part of chapter
4, the potential adverse effect of prenatal exposure to the prototypical PFC
congener PFOS was used in the maternal-fetal mouse model to determine its
effects on fetal liver and pancreas. Transcriptomic analysis demonstrated that the
in-utero exposure to PFOS affect the expression of genes associated with fatty
acid metabolism, lipid transport, and steroid synthesis in fetal livers. KEGG
pathway analysis showed these changes were primarily associated with
modulations of arachidonic, linoleic acid, retinol metabolism and PPAR signaling
pathways in fetal liver. To identify additional target fetal tissue of PFOS, in
chapter 5, we investigated the effects of PFOS on the protein expression in fetal
pancreas using the technique of “Isobaric tags for relative and absolute
quantitation” (iTRAQ). We identified changes in the protein expressions involved
in pancreatic secretion, protein digestion and absorption, protein processing in
endoplasmic reticulum, fat digestion and absorption, glycerolipid metabolism and
steroid biosynthesis. The perturbations to these targets may increase the risk of
pancreatitis in mouse offspring. Collectively, this study provided a
comprehensive chemical and biological analysis of PM2.5 collected in China and
demonstrated the toxicities, in vitro and in vivo of the adsorbed chemical
contaminants.

iv
Acknowledgement
I have the honor and privilege to thank all the benevolent people that made my
Hong Kong adventure a pleasant one! First of all, I would like to express my
sincere gratitude to my supervisor Prof. Chris KC Wong for his support, effort and
friendship all these years during my post graduate studies in the department of
Biology, Hong Kong Baptist University. I highly acknowledge his support since
the very beginning and during the development and conclusion of this thesis and
for his trust in me, even when I had no idea about the subject particulate matter
toxicity. I am also grateful to my co-supervisor Prof. N. K. MAK for his sincere
moral support.
I speak volume about the superior nature of Dr. Ball KP Lai, Research Assistant
Professor, School of Biological Sciences, The University of Hong Kong, for his
illuminating ideas and scholarly discussion about transcriptomic and proteomic
research, when I was the scared Bangladeshi student trying to pursue my studies
here in Hong Kong Baptist University. Thank you very much Dr. Lai you made it
happens!
Thanks to Dr. WKF Tse for his valuable suggestions, kind help and for
proportionating me shining days every morning with his beautiful smile (even if
feeding Zebrafish).
I would also like to thank my dear classroom teachers, scientific officers,
colleagues, lab-mates and friends and administrative stuff, to name just a few, Dr.
H.T. Wan, Dr. Zhao, Dr. Gu Jie, Dr. Alice Law, Dr. Bonnie, Dr. W.Y. Mo, Becky,
Aman, and Mr. Lo Kam Fai for encouraging, helping, sample analysis and
introducing me to the field of molecular biology with a lot of patience and smiles
and laughs throughout all these years.
I highly acknowledge the Government of Hong Kong for the financial support to
pursue my postgraduate studies under the Hong Kong Ph.D Fellowship Scheme
(HKPFS) and would also like to thank the Department of Biology and Croucher
Institute for Environmental Science for giving me the congenial working
environment and instrumental support.
From the bottom of my heart I would like to thank my family especially my wife
and my son (Yearid) for their endless love, friendship and constructive support
and for being always with me, even if far away.

v
Table of contents
Declaration i
Abstracts ii
Table of contents v
Lists of Figures Viii
CHAPTER 1
LITERATURE REVIEW
1
1. Air pollution 1
1.1 Natural and anthropogenic sources of air pollution 4
1.2 Heath effects associated with air pollution 5
1.3 Global concern of air pollution 10
1.4 Contaminants present in PM 17
1.5 Mechanism of PM toxicity 27
1.6 Research questions and Hypothesis 31
1.7 Objectives of the present study 32
CHAPTER 2
CHEMICAL AND BIOLOGICAL CHARACTERIZATION OF
WINTER TIME FINE PARTICULATE MATTER (PM2.5)
COLLECTED IN FIVE CITIES IN CHINA
33
2.1 Introduction 33
2.2 Materials and Methods 35
2.3 Results and Discussion 43
2.4 Conclusions 55
CHAPTER 3
CHEMICAL AND BIOLOGICAL CHARACTERIZATION OF FINE
PARTICULATE MATTER (PM2.5) COLLECTED IN CHINA IN
SUMMER
56

vi
3.1 Introduction 56
3.2 Materials and Methods 57
3.3 Results and Discussion 58
3.4 A comparison of winter and summer sample data 69
3.5 Conclusions 70
CHAPTER 4
DETERMINATION OF THE CONCENTRATION OF
PERFLUORINATED COMPOUNDS (PFCs) IN FINE
PARTICULATE MATTER (PM2.5) IN CHINA AND THEIR
EFFECTS ON FETAL LIVERS
71
4.1 Introduction 71
4.2 Materials and Methods 72
4.3 Results and Discussion 80
4.4 Conclusions 99
CHAPTER 5
PRENATAL EXPOSURE TO PFOS INDUCED THE RISK OF
PANCREATITIS IN OFFSPRING
100
5.1 Introduction 100
5.2 Materials and Methods 101
5.3 Results and Discussion 105
5.4 Conclusions 133
References 134
Curriculum Vitae 176

vii
Lists of Tables
Table 2.1 List of human primers used in this study 42
Table 2.2 Levels of PAHs and TEQ (ppt) measured in the air samples
from the five cities in China.
44
Table 2.3 Diagnostic ratios of PM-bounded PAHs in different cities of
China.
50
Table 3.1 PM2.5 samples from the four cities in China. 61
Table 3.2 Diagnostic ratios of PM-bounded PAHs in different cities of
China.
64
Table 3.3 Comparison of winter and summer season filters weights and
total PAHs in PM2.5
68
Table 4.1 List of mouse primers used in this study 79
Table 4.2 Total concentrations (pg/m3) of PFCs and the average
concentrations of inhalation exposure (ng/day).
82
Table 4.3 Summary of the sequencing results 90
Table 4.4 Lists of up regulated genes with their gene names and
biological functions
94
Table 5.1 Lists of differentially expressed up regulated proteins in
medium treatment dose
Table 5.2. Lists of differentially expressed down regulated proteins in
medium treatment dose
Table 5.3. Lists of differentially expressed up regulated proteins in high
dose treatment
Table 5.4. Lists of differentially expressed down regulated proteins in
high treatment dose
Table 5.5 Up regulated proteins annotated with name, Uni-port identity
and biological functions.
107
112
115
120
126

viii
Lists of Figures
Fig 1.1. PM2.5 is about 4 and 30 times smaller than PM10 and the width of a
human hair strand respectively which indicates that the smaller the size the
greater the health risks.
3
Fig 1.2. Natural and anthropogenic sources of air pollution and formation
of primary and secondary pollutants in the atmosphere.
3
Fig 1.3. (A) National emission inventory in USA in 1999 found the PM2.5,
PM10 and other gaseous pollutants comes from road dust, wind-blown dust,
and other fugitive source (The figure was prepared by Scheffe et.al., 2003;
Hiddy and Pace 2004; USEPA, 1998; Davidson et.al., 2005). (B) The
inventory for 2001 showed that in the United States the largest source of
PM2.5 was the coal burning for electricity production. (Miller, 2003;
Davidson et. al., 2005). All values were given in Ktons (thousand English
tons).
11
Fig 1.4. The basic structure of a human lung showing the trachea,
secondary bronchus, bronchiole and alveoli in which PM2.5 can be retained
in the alveoli of the lung due to their smaller sizes. Modified from National
Center for Environmental Assessment (Research Triangle Park N. C),
2003.
16
Fig 1.5. The industrial emission of PFOS in the environment in China from
direct and indirect sources (Modified from Ministry of Environmental
Protection of China, 2008).
16
Fig 1.6. Structure of some PAHs and PFCs and PFOS emission trend in
China. (A) Represents some of the high molecular weight (HMW) PAHs
that captured more efficiently on PM (Kanaly and Harayama, 2000). (B)
The C-F structure of mostly studied PFOS and PFOA. (C) The increased
PFOS emission scenario in China from 2001-2011(The figure was adopted
from Xie et. al., 2013).
23
Fig 2.1. Experimental set up of present study. (A) Location of five 37

ix
sampling cities on a China map. (B) The workflow of handling and
processing the air filters. One fourth of the air filter collected underwent
soxhlet extraction and the organic extract was dissolved in n-hexane. Half
of the dissolved extracts performed chemical analysis by GC-MS while the
other half underwent nitrogen dry and reconstituted in 1mL DMSO for
biological analysis using cell line.
Fig 2.2. Weights of PM2.5 dust in air filters and the mean concentrations of
total PAHs in each sampling site.
43
Fig 2.3. Concentrations and distributions of PAH congeners in each
sampling site.
46
Fig 2.4. Calculated excess lifetime cancer risks (per million exposed
individuals) of the five sampling sites.
49
Fig 2.5. Graphic illustration of the diagnostic ratios on the sources of PAHs
emission.
51
Fig 2.6. Gene expression levels of pro-inflammatory cytokines and
xenobiotic metabolic enzymes upon extracts treatment for 24h in BEAS-2B
cells. (A) mRNA levels of interleukin-6 (IL-6) was significantly up-
regulated in all five sampling sites as compared to the blank filter control
(p<0.01). (B) Gene expression levels of cytochrome p450 enzymes were
significantly up-regulated by the extracts exposure of all sampling sites
(p<0.01).
53
Fig 2.7. Exposure to PM extracts increased the migration of BEAS-2B
cells in cell migration assay. (A) The proliferation assay demonstrated the
increase in proliferation in the cells treating with GZ, XM, XA and BJ
extracts in MTT assay (p<0.05). (B) Micrographs showing the
representative pictures of cell migration assay (200x). The percentage of
migration of cells treated with XA and BJ were significantly higher than
that of other cities and the blank filter (p<0.05).
54
Fig 3.1. Locations of four sampling cities on a China map 59
Fig 3.2. The weights of PM2.5 in the air filters and the mean concentrations
of total PAHs in each sampling site.
60

x
Fig 3.3. The concentrations and distributions of PAH congeners in each
sampling site.
62
Fig 3.4. Calculated excess lifetime cancer risks (per million exposed
individuals) of the five sampling sites.
65
Fig 3.5. Cytotoxicity and gene expression levels of pro-inflammatory
cytokines and xenobiotic metabolic enzymes upon summer extracts
treatment for 24h in BEAS-2B cells. (A) The MTT assay showed no
cytotoxicity was found with the summer PM2.5 sample extracts upon
exposure to BEAS-2B cells. (B) Gene expression levels of cytochrome
p450 enzymes (CYP1A1 and CYP1B1) were significantly up-regulated by
the summer extracts exposure of all the sampling sites (*p<0.05). (C)
Relative mRNA expression levels of interleukin-6 (IL-6) was significantly
up-regulated in BJ and XA sampling sites as compared to the blank filter
control (*p<0.05).
67
Fig 4.1. A flow diagram illustrates the experimental procedure for RNA
sequencing, including PFOS exposure, sample collection, library
construction, transcriptome sequencing, global gene expression analysis
and pathway analysis.
75
Fig 4.2. A schematic flowchart shows the working principal of using
Illumina MiSeq platform.
77
Fig 4.3. The weights of PM2.5 dust in air filters and the mean
concentrations of total PFCs in each sampling site.
81
Fig 4.4. The concentrations of PFC congers in different cities. (A) PFOS
and PFBA were the most abundantly PFCs detected in HK samples while
PFHxS, PFDoA, PFUdA, and PFDA were found below the LOD. (B) In
GZ, PFBA and PFOS were found to be the major PFC congeners. (C) In
XM, PFBA exhibited the highest concentration followed by PFOS,
PFHxA, PFOA, and PFNA. (D) In BJ, PFOS was most abundantly found
while other PFCs were detected at relatively low concentrations. (E) In
XA, PFOS, PFHxA, and PFBA were the most abundantly found PFCs.
Error bars represents standard deviation.
84

xi
Fig 4.5. A comparison of the average concentrations and human inhalation
exposure of PFCs. (A) PFOS, PFOA, PFBA and PFHxA were abundantly
found in PM2.5 samples. (B) The inhalation exposure data from different
cities.
86
Fig 4.6. Enrichment analysis of GO Molecular Functions. Top 20 pathways 91
Fig 4.7. Enrichment analysis of GO Biological Process. Top 20 pathways 92
Fig 4.8. (A) Enrichment analysis of KEGG pathways. (B) The schematic
diagram showing the genes altered by prenatal PFOS exposure are related
to fatty acid metabolism.
95
Fig 4.9. (A) Validation of some selected RNAseq-identified genes using
mouse fetal liver samples collected at E=17. (B) Significant ROS
formation was found in AML-12 cultured with PFOS. H2O2 was used as a
positive control. Asterisks (*) indicates the statistical significant (p< 0.05)
difference between the control and treatment groups.
98
Fig 5.1. General work flow and summary of the present study. The study
applied proteomic approaches to identify the differentially expressed
proteins in the mouse pancreas in response to exposure with different
prenatal doses of PFOS (Modified from the model proposed by Tse et. al.,
(2013).
104
Fig 5.2. The diagram showing the number of up and down regulated as
well as overlapped protein expression in mouse pancreas in response to
medium and high doses of PFOS.
106
Fig 5.3. Pie diagram showing the enrichment analysis of gene ontology of
PFOS responsive proteins in mice. (A) Proteolysis (3/10) is the dominant
category in the biological process. (B) Hydrolase activity (4/10) is the
dominant molecular function in GO assignment.
109
Fig 5.4. Enrichment analysis of KEGG pathways showing pancreatic
secretion (4/10) is the dominant pathway followed by protein digestion and
absorption (3/10), protein processing in endoplasmic reticulum (1/10) fat
digestion and absorption (1/10), glycerolipid metabolism (1/10) and steroid
biosynthesis (1/10).
110

xii
Lists of Abbreviations
PM Particulate Matter
PM2.5 Particulate Matter 2.5
PM10 Particulate Matter10
SPM Suspended Particulate Matter
VOC Volatile Organic Compound
ROFA Residual Oil Fly Ash
RR Relative Risk
CI Confidence Interval
EPA Environmental Protection Agency
AQG Air Quality Guidelines
GC-MS Gas Chromatography Mass Spectrometry
LC-MS/MS Liquid Chromatography Mass Spectrometry
iTRAQ Isobaric Tag for Relative and Absolute Quantification
NGS Next Generation Sequencing
LOD Limit of Detection
ANOVA Analysis of Variance
TEF Toxic Equivalent Factors
IL-6 interleukin-6
TNF Tumor Necrosis Factor-alpha
CYP1A1 Cytochrome 4501A1
CYP1B1 Cytochrome 4501B1
PFCs Perfluorinated Compounds
PFOS Perfluorooctane Sulfonate
PFOA Perfluorooctanoic Acid
GD Gestational Day
KEGG Kyoto Encyclopedia for Gene and Genome
ROS Reactive Oxygen Species
GO Gene Ontology
FDR False Discovery Rate
PPAR-α Peroxisome Proliferator Activated Receptor- α

xiii

1
CHAPTER 1
REVIEW OF LITERATURE
1. Air pollution
Air pollution is one of the main concerns in the world today. The whole world is
reverberated with resounding slogans stop pollution, stop pollution. The presence
of chemicals in the atmosphere at concentrations that interfere with or causes
harm to biota is generally regarded as air pollution. Severe air pollution episode
took place globally which elevated more public concern than before. For example,
industrial air pollution episodes took place in the Meuse Valley (Belgium, 1930;
Firket, 1931; Nemery et.al., 2001), Donora Valley, Pennsylvania, United States
(Schrenk et. al., 1949) and in the urban London (December 1952). In Belgium
and Pennsylvania, the extreme air pollution episodes took place due to coal
burning and industrial furnaces. In the London Fog, concentrations of particulate
matters (PM) were in excess of 1000μg/ml and were found to be strongly
associated with increased mortality and cardiovascular conditions among the
elderly (Greenbaum 2003; Krewski et al. 2003). The London incidence happened
due to a temperature inversion, a situation in which cold weather trapped the
pollutants at lower ground level (Krewski et al. 2003). Thus, people were exposed
to relatively high concentrations of PM that caused 4000 people death. PM is
generally a complex mixture of extremely small particles, metals, organic
chemicals, and biological materials (Alfaro-Moreno et al., 2007; Baulig et al.,
2009; Billet et al., 2008; Gualtieri et al., 2010; Osornio-Vargas et al., 2011).
Among the particulate matters, PM2.5 and PM10 pertains for aerodynamic diameter
smaller than 2.5μm and 10μm respectively. PM can also be categorized as coarse,
fine and ultrafine particles with sizes larger than 1, smaller than 1 and smaller than
0.1μm in aerodynamic diameter respectively. But according to US standard the
fine particles having aerodynamic diameter < 2.5μm is referred to as fine PM
(Donaldson et. al., 2001). The comparison of the sizes of fine and coarse particles
is shown in Figure 1.1 .
2
A severe air pollution episode was also experienced by the Los Angeles basin
which emitted a lot of fumes from vehicles leading to severe degradation of the air
quality (Elsom, 1987). It is well-recognized that air pollution is associated with a
wide range of acute and chronic health effects. The nature of health effects
depends on the constituents of pollutants. It was reported that ambient air
pollution could cause cardiopulmonary disease, cancers (trachea, bronchus and
lung) and acute respiratory infections in children worldwide, leading to an
increase of mortality by 1-5%. This health burden occurs predominantly in
developing countries of which 65% is in Asia (Cohen, et. al., 2005). A study in
Mexico City showed that air quality in association with health issues are of grave
concern in megacities (Molina & Molina, 2004). Health problems in megacities
are social problems but its regional and global environmental consequences are
also of great concern.
Air pollution is enormously increasing in megacities (for example Beijing,
Shanghai and Guangzhou) in China (Wang et. al., 2010). China has surpassed
United States in term of total CO2 emission since 2007, although emissions per
head are still at the global average (International Energy Agency, 2009). China‟s
rapid industrial and economic development has brought severe environmental
degradation. Economic expansion is largely driven by the use of fossil fuels which
dramatically increase the ambient air pollution. Realizing the severity of air
pollution, the Chinese government has implemented various environmental
friendly measures to improve the air quality. In recent years, China has been
promoting the use of renewable-energy in the markets and set a target of adding at
least 15% renewable energy in the national energy budget by 2020 (Natural
Resources Defense Council, 2007). China government has also introduced special
loans to upgrade equipment in different industries (Economy, 2007) to reduce
levels of emitted pollution. Nevertheless, air pollution is still a big problem in
China. Thus, in this review, we highlighted some potential natural and
anthropogenic sources of air pollution that greatly influenced the air quality in
China.

3
Fig 1.2. Natural and anthropogenic sources of air pollution and formation of primary and
secondary pollutants in the atmosphere.
Fig 1.1. PM2.5 is about 4 and 30 times smaller than PM10 and the width of a human hair
strand respectively which indicates that the smaller the size the greater the health risks.

4
1.1 Natural and anthropogenic sources of air pollution
Both man-made (anthropogenic) and natural (non-anthropogenic) sources attribute
to an increasing severity of air pollution. An anthropogenic source includes
combustion, traffic emission, coal, lignite, heavy oil and biomass combustion for
energy generation (Kampa and Castanas, 2008) while natural sources are mainly
originated from forest and grassland fires which release secondary sulfates
particles to the atmosphere (Davidson et. al., 2005; Yan et al., 2006).
A large variety of pollutants emitted from the natural and anthropogenic sources
can be divided into primary and secondary pollutants. The primary pollutant
includes those pollutants that coming directly from the natural and anthropogenic
sources (NO, CO) while the secondary pollutant includes those pollutants that are
produced by subsequent reactions undertaken in the environment to produce
secondary compounds (for example H2O2, O3). The primary and secondary
sources of pollutants are shown in Figure 1.2.
(A) Coal combustion
The high energy consumption, the reliance on coal burning, and the rapid increase
of vehicle number, made air pollution the major environmental issue in China
(Millman et. al., 2008; He et.al, 2002). In China, 70-75% of energy supply comes
from coal combustion which is much greater than in Japan (14%), USA (22%)
and India (53%) (Economy, 2003; Zhang et. al., 2002). Nearly half of the coal
biomass is used for heating and cooking purposes. Coal burning in China is
characterized by low thermal efficiency, poor dust collection systems, absence of
sulfur purification method and low smoke stakes. Under unfavorable
meteorological conditions, heavy atmospheric air pollution often occurs in urban
and/or suburban areas. Thus, coal-burning produces a lot of pollutants, among
them suspended particulate matter (SPM), sulfur oxides (SO2) are the main
problems (Zhao and Sun, 1986). It was also reported that iron and steel companies
contributed to 55% of total airborne particulate in Beijing (Zhifang et. al., 1998).
In China, the PM exceeded the concentrations of other major pollutant such as
SO2 and NOx. For example, in 2005, PM concentrations in more than 300 major

5
cities in China were 99μg/m3, while those of SO2 and NOx were only 57 and 35
μg/m3, respectively (State Environmental Protection Administration of China,
2007). A report in the same year, showed that coal power plant emitted a
significant amount of PM which was 3.81 million tonnes per year representing
44.6% of total PM emission (National Bureau of Statistics of China, 2006). In a
study, an average PM10 levels in cities in the United States and Europe ranged
from 20 to 70μg/m3 while Asian cities showed PM10 concentrations of 35–
220μg/m3
(WHO, 2006), of particular interest, Chinese cities belongs to the most
air polluted cities in the world (WHO and UNDP, 2001).
(B) Traffic emission
In 2003, the motor vehicles numbers in China were 59.29 million which expected
to increase up to 192 million by 2020 (World Bank, 1997; Deng, 2006). A study
on the vehicular emissions in China from 1980–2005 showed that the emissions of
CH4, CO, CO2, VOC, NOx, PM10, and SO2 were 5, 1066, 19 893, 169, 174, 26,
and 16 thousand-tons in 1980, whereas in 2005, the figures were increased to 377,
36 197, 674 629, 5911, 4539, 983, and 484 thousand-tons. Respectively the
calculated annual increasing rates were 19%, 15%, 15%, 15%, 14%, 16%, and
15% (Cai & Xie, 2007). Since 1990, motorcycles contributed largely to the
emission of CH4, CO, VOC, and PM10 while heavy-duty vans and passenger cars
contributed largely to the emission of NOx and SO2 (Cai & Xie, 2007).
A study on the children health in China suggested that air pollution is associated
with more than 300000 deaths, 20 million cause of respiratory illness which costs
about 500 billion renminbi and accounts for >3% gross domestic product annually
(Millman et. al., 2008). If the increased rate of vehicular emission and fossil fuel
combustion continues at the present trends, a substantial damage to children‟s
health and future economic development would be anticipated (World Bank,
2007).
1.2 Health effects associated with air pollution
The epidemiological data from studies on both short- and long-term exposures
showed positive correlations among air pollution, mortality and hospital
admission rate (Brunekreef and Holgate, 2002). The health effects can range from
breathing problem, skin irritation to cancer. It may also cause defects in birth,

6
delays in developmental and immune system dysfunction (Kampa and Castanas,
2008). The effects of air pollution on human health depend on many factors such
composition of chemical contaminants, doses and exposure time. Some of the
acute and chronic health effects are discussed below.
(A) Pulmonary diseases
In China, the prevalence of asthma among urban children was increased by 64%
during the 1990s (Watts, 2006). In some bigger cities where the air quality was
worsening, this figure was more than doubled. Investigations in China conducted
by US academic institutions and the US Environmental Protection found that the
risk of respiratory morbidity (such as cough with phlegm, wheeze, asthma, and
bronchitis) was higher in children with high exposure levels to both indoor and
outdoor air pollution derived from coal burning (Qian et.al., 2004a,b; Miller et.al.,
2004). In laboratory studies, the exposure to concentrated ambient particles using
a rat model, showed minute effects on pulmonary functions (Godleski et al., 2000;
Clarke et al., 1999; Gordon et al., 2000). But the exposure effects of residual oil
fly ash (ROFA) on rats via inhalation found direct effects on pulmonary
membranes (Kodavanti, et.al. 1996 and 1997a). A thickening of alveolar and
airway walls was noted that implied the progression of lung fibrosis.
(B) Lung cancer
In 2005, 58 million cancer deaths were reported worldwide in which 1.3 million
were due to lung cancer (World Health Organization, 2002). The relationship
among long-term exposure to ambient PM and lung cancer was first addressed by
three cohort studies in the United States (Pope III, 2002). The first longitudinal
study recruited 6,338 non-smoker adults and followed their health conditions for
15 years. The investigators reported that the long term exposure to PM10 increased
the relative risk (RR) of lung cancer mortality among men. The study showed the
RR value as 3.36 which were associated with an annual average increase of PM
24μg/m3 (average increase of PM per 10μg/m
3 causes the risk of lung cancer).
7
The second study was conducted from 1974–1989 on 8,111 residents in six US
cities. In their study they found PM10 at the concentrations of 24.2, 32.5,31.4,
46.5, 18.2 and 26.4μg/m3 from Watertown, Massachusetts (where study
enrollment was conducted in 1974); Harriman, Tennessee, including Kingston
(1975); specific census tracts of St. Louis (1975); Steubenville, Ohio (1976);
Portage, Wisconsin, including Wyocena and Pardeeville (1976); and Topeka,
Kansas (1977) cities respectively. Among the most and the least polluted cities,
the differences in the average PM10 concentrations were about 28μg/m3. They
found RR value as 1.37, which was estimated as a 19% increase of cancer risk per
10μg/m3 (Dockery et.al., 1993).
The third and largest US investigation was published by Pope et. al., (2002).
This study was conducted for a period of 17 years based on the mortality of
approximately 500,000 adult men and women. Concentrations of PM2.5 were
collected from different data sources for each 50 states in the District of
Columbia. Personal information and other confounders or risk factors were
collected with questionnaires (age, race, marital status, smoking, body mass,
occupational exposures, diet, etc.). They found the RR as 1.14 which was around
14% increase of cancer risk per 10μg/m3. These three studies are remarkable
because they avoided the geographical limitations and considered the various
confounders or risk factors, especially smoking habits (Vineis et. al., 2004;
Katsouyanni and Pershagen, 1997).
In all the three aforementioned studies, the estimated RR value indicated that
PM is associated with the lung cancer risk in the United States. In contrast, the
European cities are more polluted than the United States in term of PM emission.
So, it should be possible that more cancer risk in European is associated with PM
exposure. Therefore, another study regarding the association between lung cancer
and long term exposure to PM10 in Europe was conducted in 1993, covering nine
countries (France, Italy, Spain, UK, The Netherlands, Greece, Germany, Sweden
and Denmark) involving over half a million of volunteers. A total of 271 lung
cancer cases and 737 controls were included in these studies which were taken
from cancer registries. PM10 exposure data for cancer cases and controls were 113
and 312 respectively. They found the RR as 0.91 for an increase in PM10 of

8
10μg/m3
and 0.98 (95% CI: 0.66–1.45) for exposures over 27μg/m3 (Vineis et. al.,
2006). This study also found the risk of lung cancer associated with PM10.
Recently, satellite measurement of haze data in the Chinese city of Guangzhou
showed the association of the air pollution events from 1954 to 2006 with the
increased risk of lung cancer (Tie et. al., 2009).
(C) Mortality and cardio-vascular diseases
Epidemiological evidences suggested that lung cancer, respiratory diseases and
arteriosclerosis are associated with long term exposure to PM while short term
exposure causes respiratory diseases, including bronchitis and asthma (Chiaverini,
2002; Sorensen et. al., 2003). Miller et. al., 2007) carried out investigation
regarding long term exposure of PM on cardiovascular events. This study found
the variations of PM2.5 levels in atmosphere ranged from 3.4 to 28.3μg/m3 (mean,
13.5). Each increase of 10μg/m3 was associated with 76% increase in the risk of
death from cardiovascular disease (hazard ratio, 1.76; 95% CI, 1.25 to 2.47) and
24% increase in the risk of a cardiovascular event (hazard ratio, 1.24; 95%
confidence interval [CI], 1.09 to 1.41). Kodavanti et. al., (1999) carried out
residual oil fly ash (ROFA) effects on monocrotaline treated rat (suitable model
for cardiorespiratory disease) and found the severe effects on the cardiac function.
In 2000, another study related daily mortality and air pollution was carried out
using samples from European cities (for example, London, Paris, Barcelona,
Helsinki, Athens, Lyon) (Touloumi et. al., 1997). The daily deaths and
NO2 and/or O3 levels were investigated. This study found that the daily number of
deaths increased by 1.3% and 2.9% with an average increase of 50μg/m3 in
NO2 (1-hour maximum) or O3 (1-hour maximum) concentrations respectively.
The results of this study suggested that short term effects of air pollutants may
causes mortality.
(D) Neurodevelopmental effects
The combustion of high amount of coal caused enormous amount of mercury
emission in China (Zhang et. al., 2002). Elemental mercury can be transported to a
long distance (Morel et.al., 1998). In aquatic ecosystem, in addition to elemental

9
mercury, ionic and organic mercury especially methyl mercury are also present
which become bio-concentrated in fish tissues (Morel et.al., 1998). Prenatal
mercury exposure from maternal consumption of fish is associated with
developmental deficits in children in the United States and elsewhere (Cohen et.
al., 2005; Trasande et. al., 2005). Besides mercury exposure, a study with children
in New York City showed that the children who had high prenatal exposure to
airborne PAHs had suffered from neurodevelopmental delay (Mead and Brajer,
2006).
(E) Susceptibility of the young
Among the population, the very young groups are of particular risk because their
biological systems are developing and growing. For example, the lung of a child
continues to develop until sixth to eighth years of life (Perera et. al., 2006;
Grandjean and Landrigan, 2006 and Plopper and Fanucci, 2000). Experimental
and human evidences reported that the fetus and neonates are the most likely
affected and sensitive to a wide range of chemicals such as, air pollution, tobacco
smoke, PAHs, nitrosamines, pesticides, and radiation (Mead and Brajer 2006;
Dahl, 2005; Shen et.al., 2010; Luo et.al., 2003; Anderson et.al., 2000; National
Research Council, 1993; Whyatt et. al., 2001). More recent epidemiological
studies have shown that infants are mostly affected by the air pollution related
chronic respiratory effects and mortality (Ha et. al., 2003; Hertz-Picciotto et. al.,
2007).
(F) Adverse birth outcomes
Published studies reported that reduced fetal growth is associated with
combustion-related air pollution (Millman et. al., 2008). A study in New York
City found that during pregnancy, exposure to air borne PAHs could lead to
decreased birth weight and reduced head circumference among black infants
(Perera et. al., 2003). Another study from Poland reported that prenatal PAHs
exposure caused reduction in fetal growth (Choi et. al., 2006). A recent study in
China found that the elevated PAH-DNA adducts in cord-blood associated with a
decrease of head circumference in newborns (Tang et. al., 2006).

10
1.3 Global concern of air pollution particulate matter (PM)
1.3.1 Large scale global emission of PM
Globally the PM increases from 1970s to 1980s in rapid growing cities with huge
population for example, China, Chicago, Mexico City, Lagos, Cairo, Tokyo, and
Athens (Asby and Anderson 1982). The 1999 national emission inventory for the
United States (Hidy and Pace 2004) showed the emission among the six major
categories, of them 70% of the PM2.5 emissions came from road dust, wind-blown
dust, and other fugitive sources (Fig. 1.3A).The inventory for 2001 that focused
on primary anthropogenic sources of PM2.5 shown in Figure 1.3B (U.S. EPA,
2004d). This inventory report showed that in the United States the largest source
of PM2.5 is the coal burning for electricity production. In addition, other sources
such as fuel combustion and metals processing altogether contributed in the
emission of total PM2.5 at the amount of 2550 Ktons/year (Davidson et. al., 2005).
In contrast, in China, the PM10 and PM2.5 emissions in 2005 were 1842 and 994 kt,
and 824 and 1090 kt in 2010 respectively (Zhao et.al., 2008). Adverse effects of
different pollutants in PM on human health have been well documented in Europe
and other parts of the world. Realizing the situation, the United States
Environmental Protection Agency (EPA) instituted the PM2.5 24 h standard as
65μg/m3 and an annual average standard of 15μg/m
3 (Greenbaum 2003). Until
2012, there were no regulatory standard for PM2.5 in China. Recently, the Chinese
government issued a national PM2.5 standard on February 29, 2012, that requires
cities to have concentrations below 35μg/m3
annual average and <75μg/m3 for
24h, beginning in 2016 (Cao et. al., 2012). These standards were adopted owing to
recognized adverse effects of PM2.5, chemical components on human health,
visibility, and materials (Hu et al., 2009; Mauderly and Chow, 2008; Pope and
Dockery, 2006).

11
A
B
Fig 1.3. (A) National emission inventory in USA in 1999 found the PM2.5, PM10 and other
gaseous pollutants comes from road dust, wind-blown dust, and other fugitive source (The
figure was prepared by Scheffe et.al., 2003; Hiddy and Pace 2004; USEPA, 1998;
Davidson et.al., 2005). (B) The inventory for 2001 showed that in the United States the
largest source of PM2.5 was the coal burning for electricity production. (Miller, 2003;
Davidson et. al., 2005). All values was given in Ktons (thousand English tons).

12
A study on PM10 in more than 300 major cities in China from 2002 to 2006
showed that PM10 concentrations increased from 36.8% to 62.8%. (State
Environmental Protection Administration of China, 2007). In contrast, for the
regulation of PM emission, European Union defined a limit value of 40μg/m3 of
PM10. Among 25 countries, the PM10 annual means in Bulgaria, Czech and Poland
(East) were 64.3, 69.8 and 71.8μg/m3 respectively; in Greece, Italy, and Spain
(South) were 68.8, 59.3, 103.3μg/m3, respectively; in Denmark, Norway, and
Sweden (North) were 34.2, 23.1 and 51.1μg/m3, respectively; Belgium, France,
Germany and UK (Western) were 36.8, 43.6, 45.5 and 33.4μg/m3 respectively
(CAFE Working Group on Particulate Matter, 2004). From this data, it was
evident that 60% Chinese major cities reached the increased PM emission level of
the east and south Europe countries.
In China, another study related to PM2.5 was carried out in some cities
(Guangzhou, Wuhan, Lanzhou, Chongqing, Shanghai and Beijing) at different
times from 1995 to 2007 (Duan et al., 2006; Kan et al., 2007; Zhang et al., 2002).
A study reported that in the 2000s, the annual average concentrations of PM2.5
were in the range of 56 to 122μg/m3. In 2001- 204, Beijing exhibited a dramatic
increase in PM2.5 concentration levels to the range of 96.5 to 106.7 μg/m3 (Duan et
al., 2006), which was seven times greater than the ambient air quality standard
prescribed by the US Environmental Protection Agency (15 μg/m3) and ten times
higher than the WHO Global Air Quality Guidelines (AQG) (10μg/m3). In 2005,
the concentration of PM2.5 level in Shanghai was much higher (56μg/m3) (Kan et
al., 2007), as compared with the Global Air Quality Guidelines set by World
Health Organization (10μg/m3 for annual mean) and U.S. National Ambient Air
Quality Standards (15μg/m3 for annual mean). In 2013, the PM2.5 concentration in
Beijing was recorded 950μg/m3 which was by far the highest value ever reported
in this year. In year 2015, the air pollution reading in Beijing showed the higher
levels with 671μg/m3 PM2.5, reaching 26 times the threshold level recommended
by World Health Organization (WHO) and visibility reduced to 500 meters (South
China Morning Post, 2015).

13
1.3.2 Relation of PM with climate change, energy use and human welfare
Anthropogenic CO2, CH4 and PM contribute to global warming. Other warming
gases include tropospheric O3, halocarbons, and N2O and warming particle
component includes iron, aluminum, ammonium, polycyclic aromatics, and
nitrated aromatics (Jacobson, 2001). PM exerts both direct and indirect effects on
climate change. The direct effects incudes scattering and absorption of sun‟s
energy. In some cases, the PM may reflect solar radiation back to space which
causes the cooling of the earth. In most other cases, the PM absorbs the solar
radiation results in warming effects. For example, ammonium sulfate have high
reflectance which take part in cooling, while elemental carbon absorb radiation
contributing to global warming. It was reported that elemental carbon may be the
second most important anthropogenic atmospheric constituent responsible for
global warming next to CO2 (Hansen and Sato, 2001; Jacobson, 2000).
Most particulate emissions are black carbon and organic matter (Shauer, et al.,
1999). Black carbon is a component of PM2.5 which warms the earth by absorbing
heat in the atmosphere and by reducing albedo, the ability to reflect sunlight.
According to Jacobson (2002) the reduction of black carbon could slow global
warming more than the strategy to reduce CO2 or CH4. This study also showed
that if all the black carbon and anthropogenic CO2 and CH4 emissions are
eliminated together, within 25-100 years it could be possible to slow down global
warming. They measured the historic net global warming by subtracting the
cooling from warming caused by greenhouse gas and black carbon. This study
also showed that elimination of 20–45% of net warming could be possible from
eliminating all black carbon within 3–5 years, if no further changes occur in the
environment.
Adams et.al, (2003) found that regions with high PM air pollution formed
clouds with tiny droplets that resulted in the formation of brighter clouds. These
clouds could reflect back the solar radiation in space. For example, ammonium
sulfates are efficient cloud condensation nuclei that reflect back the solar energy
into space. Thus, helps the cooling process of the earth. Some other research
postulated that high elemental carbon concentration in Asian countries affected
the local hydrological cycle due to absorption of sun‟s energy (INDOEX, 2003).

14
All these evidences suggested that local as well as global climate change was
linked to PM. Malm et. al., (2003) found that reduced visibility can have a
negative impact on psychological well-being of people. PM may bring PM
scatters light thus reduce the light intensity between distant object and background
sky resulting visibility reduction. Normally people can see objects at a distance of
200km in a clean dry air but PM air pollution may restrict the visibility to less
than a kilometer. In this study, it was also reported that ammonium sulfate,
ammonium nitrate, organic compounds, soil and coarse dust particles may reduce
the visibility.
Recently, the U.S has introduced a complex regulatory standard for reducing the
emission of SOx, NOx and Hg from power plants that used for energy production.
In order to achieve the goal, PM should be reduced below the national ambient air
quality standard. But residual PM may contain a greater fraction of carbons that
will be a big challenge for the prescribed standard to reduce SOx, NOx and Hg,
because this standard does not address the elemental carbon issue (Davidson et.
al., 2005). EPA also recognized the importance of controlling all the major
components in PM2.5. However, formulation of new national rule for the major
anthropogenic carbonaceous sources is a challenge ahead (Bachmann, 2003).
Thus, this study suggested that PM is associated with increasing energy
consumption and economic growth. Therefore, PM should undertake to address a
number of questions that have been raised regarding health issue associated with
PM.
1.3.3 Difficulties in the isolation of the health effects of specific chemical
components in PM2.5
Among the international scientific community, much more emphasis was given on
the smaller size PM for their more adverse health effects (Laden et. al., 2000).
PM2.5 can penetrate into the lung alveoli thus cannot be cleared efficiently. The
human lung and retention mechanism of PM2.5 in alveoli is shown in Figure 1.4).
During a pollution episode, each alveolus on an average could receive 1500 PM in
a 24-h exposure period of which, 50% can be retained in lung parenchyma
(Brown, et.al, 2001). Some studies suggested that the particles that reached the
alveoli included toxic sulfates, nitrates, and bioavailable transition metals
(Kodavanti, et.al., 1997; Pritchard et.al., 1996). Several studies were conducted to

15
isolate the health effects of the specific chemical component of PM2.5 but many of
these studies were not able to address the individual chemical species with a
particular health effect (Harrison and Yin, 2000). Thus, much more study is
needed globally to address the PM2.5 related health issues. Since the health effects
of PM are thought to be strongly associated with particle size, composition and
concentrations at which they prevail in the atmosphere. Therefore, next
appropriate step in the scientific research was to investigate the contaminants
associated with PM.

16
A
B
Fig 1.4. The basic structure of a human lung showing the trachea, secondary bronchus,
bronchiole and alveoli in which PM2.5 can be retained in the alveoli of the lung due to their
smaller sizes. Modified from National Center for Environmental Assessment (Research
Triangle Park N. C), 2003.
Fig 1.5. The industrial emission of PFOS in the environment in China from direct and
indirect sources (Modified from Ministry of Environmental Protection of China, 2008).

17
1.4 Contaminants present in PM
Contaminants in PM vary greatly and depend on the factors such as combustion
sources, climate change and type of urban and industrial sources. No single
compound was identified to explain the effects of PM. So, it is generally accepted
that the composition and sizes of PM are responsible for producing health effects
(Kampa and Castanas, 2008). The nucleus of PM is a carbonaceous core covered
by multiple layers of adsorbed pollutant such as various metals, organic
pollutants, acid salts, and biological contaminants (Spurny, 1996). In this review,
we discussed the biotic and abiotic contaminants with special focus on their
sources, functions and general health effects.
1.4.1 Biotic contaminants
The biological contaminants such as endotoxin, allergens and pollen fragments
(Spurny, 1996) can be adsorbed on the carbon core of PM. The pollen fragments
in PM are associated with the respiratory allergic diseases. Allergens are produced
by plant-derived paucimicronic (few microns) components that elicited allergic
symptoms (D'amato, et. al., 2001). It was also reported that the air pollution PM
caused mucosal damage and hindered the muco-cilliary clearance activities thus
facilitated the biotic compounds such as pollen, allergens to enter the cells and
interfere with the immune system (D'amato, et.al, 2001).
Endotoxins (cell-associated bacterial toxin) associated with gram-negative
bacteria for example, Escherichia coli, Salmonella, Shigella, Pseudomonas,
Neisseria, Haemophilus influenzae, Bordetella pertussis, and Vibrio cholerae.
Endotoxin exerts their effects on the intact and isolated lung cells as well. In
whole animals, the pathological functions of both airways and the pulmonary
circulations are mediated by endotoxins. It was reported that acute lung injury and
chronic changes in lung structure and function can be explained by the
pathogenomic effects of endotoxins (Brigham et.al., 1986). A study in Germany
was conducted to determine the endotoxin concentrations in ambient PM
suggested that the concentration of endotoxin in coarse particles were 10-fold
higher than PM2.5 (Heinrich et. al., 2003). Another study from British Columbia,
Canada from October 2005 to September 2006 was conducted to measure the
outdoor airborne endotoxin concentration on PM (PM2.5 and PM10). This study

18
showed the concentrations were generally highest in the summer and fall and
lowest in the winter and spring which explained relative humidity as the
influential environmental factor for this strong seasonal variation (Allen et. al.,
2011).
1.4.2 Abiotic contaminants
Metals
Heavy metals such as vanadium, lead, cadmium, mercury, silver, nickel,
chromium, manganese and transition metals (iron, nickel, vanadium, copper, etc.)
are the constituents of PM (Huang et al., 2009b). By emitting one quarter of the
world‟s anthropogenic emissions of mercury which was approximately 600 tons,
China is the largest contributor of mercury in the world (Pottinger et. al., 2004). In
contrast, the United States produced 120 tons of atmospheric mercury in1999
(Pottinger et. al., 2004). Some of the China‟s central provinces such as Shaanxi,
Guangzhou, Henan, and Sichuan using high amount of coal in heavy industry,
thus contributing to high emission of mercury in this region (Zhang et. al., 2002).
Some other studies suggested that coal combustion is responsible for an estimated
46% of Chongqing‟s total mercury emissions (Wang et. al., 2006).
In fact, metals penetrate into cellular organelles and finally interfere with the
functions of the organism. Chavez et. al. (1987) observed the effects of lead
accumulation in mitochondria and suggested that it caused the fast release of
accumulated Ca2+ and reduction of membrane potential. Other studies postulated
that metals could bind to DNA and regulate the expression of genes. For example,
tumor suppressor genes are masked by the interaction of nuclear chromatin with
nickel (Costa et. al., 2003).
Redox active and redox inactive metals are associated with PM (Costa and
Dreher, 1997). When redox-active metals such as iron, copper and chromium are
present in PM, they undergo redox cycling whereas redox-inactive metals, such as
lead, cadmium, mercury used up the thiol-containing antioxidants (help defend the
body against ROS) and enzymes. Both of these metals may cause an increase in
production of reactive oxygen species (ROS) such as hydroxyl radical (HO-),
superoxide radical (O2-) or hydrogen peroxide (H2O2) leading to oxidative stress

19
in cardiopulmonary damage (Costa and Dreher, 1997). Oxidative stress is the
disturbance of oxidant and anti-oxidant balance. Cumulative evidences suggested
that PM induced oxidative stress is associated with asthma (Li et.al, 2003).
Polycyclic Aromatic Hydrocarbons (PAHs)
PAHs are semi-volatile organic compounds with several hundred of chemicals of
two or more fused aromatic rings, 16 of them are considered as priority
compounds for estimating health risk. Among the 16 priority compounds,
benzo(a)pyrene, the surrogate PAH which is mostly used in carcinogenic studies
(Deutsch-Wenzel et.al., 1983). Due to the PAHs high volatility, PAHs from
emission sources can be released both supported onto PM or in the gas phase
(Mastral et al., 2000, 2001). The most volatile compounds with two or three
aromatic rings are mainly released in the gas phase, while compounds containing
more than three aromatic rings are associated with the PM emission (Mastral et
al., 2000). The structures of some high molecular weight PAHs are shown in
Figure 1.6 A. Atmospheric photochemical degradation and humidity helps to form
different kinds of derivatives of PAHs, for example nitrated PAH (NPAHs),
hydroxylated PAHs (OH-PAHs), amino PAHs (APAHs). Hydroxy radicles and
the oxygen radicles in the presence of nitrogen oxide (N2O5) in the atmosphere
form the NPAHs. Some studies found that these derivatives are sometimes more
toxic than the parent PAH species (Liu et. al., 2007a). PAHs and their derivatives
are mainly originated from industrial process, coal burning, cigarette smoke,
diesel engine and industrial process (Mohanraj et. al., 2011). PAHs are of grave
concern due to their probable carcinogenic activity (IARC, 1983; IPCS, 1998;
UNECE, 1998; Vestreng and Klein, 2002). PAHs have occupied distinct place on
the Convention on Long-Range Trans boundary Air Pollution Protocol (Zhang et.
al., 2009).
In 2004, the total PAHs emission from China was 114,000 tons (Zhang et. al.,
2009), which represented 29% of the total global emission. The huge emission
aggravated the concentrations of PAHs in ambient air which suggested that many
parts of China have high amount of PAHs concentrations compared to other
developed countries (Zhang et. al., 2009). For instances, winter season exhibited
the highest PAHs concentrations in 2005 with the maximum 346ng/m3 in the

20
North China (Liu et. al., 2007b). This concentration was significantly greater than
PAHs concentrations found in London in 1997 (39ng/m3), Chicago in 2004
(70ng/m3) (Sun et.al., 2006; Dimashki et.al., 2001; Harrison et.al 1996) and
Birmingham, United Kingdom in 1992 (20.3ng/m3).
General health effects of PAHs
Previous studies from experimental and human studies suggested that PAHs,
pesticides, tobacco smoke, air pollution, and radiations are carcinogen and
detrimental to the fetus and neonates growth and survival (Mead et. al., 2006;
Whyatt et. al., 2001and Luo et. al., 2003). PM2.5 with PAH-like characteristics
forms an undesired mutagenic risk (Hamers et. al., 2000). The urban air
containing carcinogenic PAH mixtures were collected from Teplice, Czch
Republic and exposed to 3-day-old chick embryos at a concentration of 49.5ng/m3
showed defects in heart and abdominal wall (Binkova et.al., 1999). In mice,
heritable mutations are associated with high atmospheric PAHs concentration
(Bostrom et. al., 2002).
People exposed to coke oven and aluminum production plants those emitting
high PAHs pollutants were prone to an increased lung cancer risk (Bostrom et. al.,
2002). A recent study in China found air pollution was responsible for an increase
of PAH-DNA adducts in cord bloods and a decrease of head circumference in
newborns (Tang et. al., 2006). This study suggested that in addition to
mutagenicity, PAHs can cross the placental barrier and interfere with the
development process of the fetus.
Dioxin/dioxin-like compounds
Chemicals that persists for a longer period of time in the environment are known
as POPs which includes pesticides as well as dioxins, furans and PCBs. Dioxins
are used to explain polychlorinated dibenzo-dioxins (PCDDs) and polychlorinated
dibenzo-furans (PCDFs) while polychlorinated biphenyls (PCB) are regarded as
dioxin -like compounds because of their similar mode of action in case of dioxin-
type toxicity (Schecter et al., 2006).

21
Incomplete combustion and burning of materials that contains chlorine (for
example plastics) are responsible for the production of dioxins and dioxin-like
compounds in the environment. A study in USA suggested that bituminous coal
subjected to high temperature air oxidation and chlorination resulted in the
formation of chlorinated dibenzo-p-dioxins, some of which was known to be
highly toxic (Mahle and Whiting, 1980). Another study before, during, and after
“bonfire night” at Oxford in England suggested that public bonfire and firework
display could change in ambient levels of dioxins (Dyke et.al., 1997). In China, a
short-term sampling survey to determine dibenzo-p-dioxins and dibenzofurans
(PCDD/Fs) from four districts of Guangzhou revealed that the PCDD/Fs were
derived from small diffuse combustion sources such as domestic burning of fossil
fuels, traffic sources, industrial combustion sources and non-industrial combustion
sources as well. Estimation of inhalation exposure of PCDD/Fs also showed that
the exposure levels by the inhabitants in Liwan district were relatively high (Yu
et. al., 2006).
Inhalation risks of PCDDs and PCDFs and PCBs around a steel plant area in
northeast China was investigated by Li et. al. (2010). The results of this study
indicated that steel plants provided a potential source of PCDD/Fs in ambient air.
Dioxins, due to their bio-magnification (Broman et.al., 1992) potential, move up
through the food chain in a magnified way. It was reported that dioxin are
carcinogenic to humans and might association with other health outcomes,
including cardiovascular- and endocrine-related effects (Bertazzi et. al., 2001).
From this study, it was assumed that China environment is the potential source
of dioxin like compounds. Therefore, to estimate the public health risk assessment
and monitoring of environmental health identifying the presence of other toxic
organic compounds in PM are necessary.

22
Perfluorinated compounds (PFCs)
PFCs are stable compounds with unique fluorine-carbon structure. Due to their
unique chemical resistance and surfactant properties, manufacturers have used
PFCs to repel water and oil from furniture carpeting, clothing and food packaging
such as fast-food containers and paper industries (Lau et. al., 2007; Paul et. al.,
2008 and Prevedouros et. al., 2006).
Among the PFCs, perfluorooctane sulfonate (PFOS) and perflourooctanoic acid
(PFOA) are most widely studied compound. The structure of PFOS and PFOA are
shown in Figure 1.6 B. A study of the PFCs in water samples from the Pearl River
(Guangzhou Province, south China) and the Yangtze River (central China)
suggested that PFOS and PFOA were found with the highest concentrations in
water samples from these areas (So et. al., 2007). In our subsequent review, we
highlighted the uses, production, human exposure and general effects of PFOS.
PFOS
PFOS is a fluorinated compound consists of eight carbons (Fig. 1.6B). PFOS was
used extensively in a variety of industry and consumer products, such as repellant
coatings for carpets, leather and food packing materials, and as surfactants in
diverse cosmetics and fire-fighting foams (Thibodeaux, et. al., 2003; Lau, et. al.,
2003 and Wan, et. al., 2012). In addition to stability and metabolic degradation in
environment, PFOS cannot be easily cleared from the body and has serum
elimination half-lives of months in rats and monkeys (Seacat et al., 2002) to
several years in humans (Olsen et al., 2007). Entering into body, PFOS undergo
biotransformation (Nelson et. al., 2010) process and have been shown to affect
cell to cell communication, membrane transport and process of energy generation,
and proxisome proliferation (Upham et. al., 1998; Sohlenius et. al., 1993). PFOS
and related compounds were listed into the Annex B by Stockholm Convention on
Persistent Organic Pollutants (POPs) in May 2009 due to their properties of
persistence, bioaccumulation and toxicity (UNEP, 2009).

23
PFOS PFOA
(A)
(B)
(C)
Fig 1.6. Structure of some PAHs and PFCs and PFOS emission trend in China. (A)
Represents some of the high molecular weight (HMW) PAHs that captured more
efficiently on PM (Kanaly and Harayama, 2000). (B) The C-F structure of mostly
studied PFOS and PFOA. (C) The increased PFOS emission scenario in China from
2001-2011(The figure was adopted from Xie et. al., 2013).

24
Release of PFOS in the environment
PFOS was banned in 2005, but it is a matter of deep concern that PFOS and PFOS
related compounds are being used in many industries in China. PFOS
manufacturers in China generally used ECF (electro-chemical fluorination)
process that was developed by 3M Company. The environmental release of PFOS
was estimated applying the emission factors of PFOS developed by international
PFOS producers (Sweetman, et. al., 2009) which showed that China‟s largest
PFOS manufacturer located in Hubei Province that emit PFOS in air and water at
the rate of 315.6 kg/y and 525.0 kg/y respectively. In the process of metal plating
PFOS are used to prevent the formation of mists or prevent harmful chemicals
from baths (Mei, 2008). Applying the emission scenario document on metal
finishing (OECD, 2004), an investigation was made on the large metal plant in
China, regarding how much PFOS they are releasing in the local water
compartment. The data showed that about 2.88 kg/y PFOS is released. In contrast,
the fire-fighting foams industry released 1.76 kg/y and 35.3 kg/y of PFOS to local
air and water compartment respectively (European Commission, 2003). As for
sulfluramid formulation, the releases of PFOS to local air, water and soil
compartment were estimated to be 15.0 kg/y, 120 kg/y and 0.60 kg/y respectively
(European Commission, 2003). The sources of PFOS are shown in Figure. 1.5
(Ministry of Environmental Protection of China, 2008). Recently, a study
suggested that the production volume of PFOS is about 100 tons per year (Zhang
et. al., 2012). Figure 1.6 C represents the trends of PFOS production in China
since 2001-2011, which indicated that in last 10 years 1800 tons production
surprisingly adding a huge load to the ecosystem population leading to adverse
health effects (Xie et. al., 2013).
Even though, the huge amount of PFOS was released in the environment, little
data has been reported on the levels of PFOS contamination in wildlife and
humans because of the difficulties in measuring the trace amount of PFOS in
surface water and air borne particulate matter (Sasaki et. al., 2003). Hanseng et.
al., (2001), developed a new method for several low levels (ng/mL or ng/g) of
PFCs in sera and liver tissue using high-performance liquid chromatography with
electro-spray tandem mass spectrometry (HPLC/MS/MS). Later on, for the
determination of the concentrations of PFOS from the surface waters, a simple
and sensitive method that enables the determination of trace concentrations of

25
PFOS at the pg/mL level was developed in Japan using LC/MS (Saito et. al.,
2004). Since then a number of analyses have been conducted.
PFOS in air samples
Published report on PFOS concentrations from Japan air samples suggested that in
urban and rural areas the average PFOS concentrations exhibited 5.3pg/m3, and
0.6pg/m3
respectively (Sasaki et. al., 2003). Another study in 2005 suggested that
in urban areas (5.6pg/m3) the PFOS concentrations are greater than rural area
(0.7pg/m3) (Harada et. al., 2005). However, after one year it was found that the
PFOS concentration in rural areas increased by 3 times (6.8 pg/m3) compared to
urban area (2.9pg/m3) (Harada et. al., 2006). As follow up to this study, Sugita et.
al. (2007) carried out an experiment where the highest average PFOS
concentrations were recorded in the Wako city of Japan with the concentration of
7.3pg/m3. These studies suggested that PFOS is widely distributed with increasing
trend in rural areas.
PFOS in dust samples
A study conducted in Spain found the average daily intakes of ionic PFCs by
toddlers from dust were 4.9ng/day. For adults, the average daily intakes of dust
were 3.6ng/day. The first indoor dust PFOS concentrations were measured in
Japan (Moriwaki et. al., 2003) and the concentration was found 24.5ng/g, while
Zhang et.al (2010a) measured the concentration of PFOS from indoor dust of 17
cities of China that found a range of 1.11-10.7ng/g. Subsequently, the PFOS
concentrations from the outdoor dust in Japan were measured with the range of
<0.2-11ng/g. This study also mentioned that the variation in these data were due
to variations in sources, sampling methods and detection methodologies. The
existence of PFOS in dust sample suggested that air dust inhalation can be a
potent source of human exposure.

26
General health effects of PFOS
Toxicological studies suggested that PFOS is correlated with multiple toxicities
such as hepatotoxicity, carcinogenicity, immunotoxicity as well as reproductive
and developmental toxicity (OECD, 2002; Lau, et. al., 2007; Wan et. al., 2012). It
was reported that prenatal exposure of PFOS causes neonatal rat lung
morphological changes and rat early death (Grasty et al., 2005). Previous studies
postulated that PFOS could induce hepatocellular hypertrophy and lipid
vacuolation and cause loss of body weights in rat (Seacat et al., 2002). A recent
study from our lab demonstrated that PFOS elicit pathological manifestation
resembled one of the most common human liver diseases, nonalcoholic fatty liver
diseases (Wan et. al., 2012).
From this review, it was evident that some of the pollutants embedded on PM
are of global concern and may exert some noxious effects on animal health.
Therefore, in regard to question through which mechanism these metals, organic
and inorganic contaminants associated with PM could induce toxicity, in our
subsequent review, we discussed free radical generating activity, oxidative stress,
mutagenicity, cytotoxicity and genotoxicity potential of PM.

27
1.5 Mechanism of PM toxicity
Combination, composition and daily variations in PM mass are believed to
contribute to the toxicity of PM. In order to study the adverse effects of PM
exposure and to identify valuable information on the toxicology of known
compounds present in PM, the study of the mechanism of the toxicity is the key.
Thus, in this review, we discussed the role of the chemical contaminants of PM in
mediating toxic effects by producing oxidative stress, mutagenicity and
genotoxicity.
1.5.1 Free radical generating activity and oxidative stress
PM pollution is associated with adverse health effects in humans, especially with
the cardiopulmonary system (Sunyer and Basagana, 2001). Respiratory infections,
lung cancer, and chronic cardiopulmonary diseases progressions are associated
with oxidative stress through the generation of ROS (Valavanidis et. al., 2008). In
addition, it was also reported that PM initiate inflammatory damage by up
regulation of pro-inflammatory mediators (cytokines and chemokines), endotoxin
effects, modification of cellular components, cellular mutagenicity, and DNA
damage (Nel et. al., 2006). A strong antioxidant defense (enzymatic and non-
enzymatic) for cellular redox homeostasis exists in all aerobic organisms to avoid
oxidative damage to important biological macromolecules (proteins,
carbohydrates, membrane lipids, and mitochondrial and cellular DNA). It was
believed that intracellular enzymatic mechanisms greatly facilitate the anti-
oxidant process.
Cigarette smoke air pollution are important factors that affected ROS production
and can change the redox status of the cell and subsequently triggered the
cascade of events associated with inflammation (Schafer and Buettner, 2001;
Gonzales-Flecha, 2004). A recent observation showed that diesel exhaust particles
(DEP) play an important role in oxidative cellular damage through the generation
of oxygen-free radicals (e.g., hydroxyl, HO-; superoxide anion, O2
- ) and ROS
(e.g., H2O2) which are the suggestive of the ability of PM to produce ROS in the
cellular environment. Many studies have reported the association of ROS with
membrane lipid peroxidation and oxidative DNA damage (Bai et. al., 2001;
Kumagai et.al., 1997; Knuckles and Dreher, 2007).

28
In order to understand, the cellular damage and adverse health effects associated
with oxidative stress a three phase response model was developed (Valavanidis et.
al., 2008). In first phase, at relatively low level of oxidative stress, various
transcription factors (such as the nuclear factor erythroid-2, Nrf2) stimulate a
series of antioxidant and detoxification enzymes (including catalase, superoxide
dismutase, glutathione S-transferase, known collectively as phase 2 response) to
scavenge or destroy ROS. In this phase, PM exposures might not cause any
adverse biological outcomes (Li et. al., 2002 and Cho et. al., 2006).
In the second phase, when ROS concentration is greater than the anti-oxidant
concentration results is the formation of pro-inflammatory situation and lead to
cytotoxicity of the cells. The cytokine production is regulated by the redox-
sensitive mitogen-activated protein (MAP) kinase and NF-κB pathways which are
involved in the inflammatory processes of the lungs (Xia et. al., 2006; Chan and
Kan, 1999).
In the third phase, when the oxidative stress level is high it overwhelmed the
antioxidant defenses and subsequently induce cytotoxic effects. In this stage,
mitochondria may release pro-apoptotic factors and induce apoptosis of lung cells
(Hiura et. al., 2000). It was reported that oxidative potential of PM2.5 and ultrafine
PM is the result of significant amount of organic carbon compounds such as
quinones and PAHs. A study found the correlation between PM concentration and
redox active compounds and damage in the macrophages and epithelial cells.
Electron microscope found the ultrafine particles are localized inside damaged
mitochondria (Li et. al., 2003). Quinones (oxidized derivatives of aromatic
compounds) interacts with the metal ions and results in the formation of ROS
which through redox cycling reactions induce the carcinogenicity of quinones
(Qui and Cadenas, 1997; Hirakawa et.al., 2002).
The principal pathways of metabolic activation of PAHs are involved in (1) The
catalization of cytochrome p450 produces diol epoxides, leading to DNA adduct
formation, considered to be essential to PAH mechanism of carcinogenesis. (2)
dihydro diol dehydrogenases produces redox-active quinones, contributing to

29
PAH carcinogenesis and tumor promotion (Dannisenko et.al., 1996; Ohnishi and
Kawanishi, et. al., 2002).
In addition, transition metal ions of PM with redox potential can contribute to
ROS overproduction and play an important role in oxidative DNA and protein
damage (Kasprzak, 2002). It was also reported that solvable metals on inhaled
particles for example, Fe, Ni, Cu, Cr, Co were associated with ROS production
which cause oxidative stress in air way epithelial cells (Gotschi, et. al., 2008;
Mazumbar et.al., 1982; Koening, 1980). Some other studies have found the
activity of some metals and antioxidants in producing oxidant effects and
inflammation in laboratory animals (Lawther, 1975; Pearlman, et.al., 1971).
1.5.2 Mutagenicity
For the study of mutagenicity of ambient and indoor PM, short-term Ames test is
widely used (Claxton et.al, 2004; Claxton et. al., 1989). Short-term mutagenicity
assays in general applied to determine the effect of either single chemical or
chemicals in a complex mixture such as ambient PM. Metabolizing enzymes from
rat liver microsomes or S9 is used in mutagenicity assay because some PAH and
other organic molecules require metabolic activation in order to exert their
mutagenic activity. But some nitro-PAH originating from diesel engines (Černá
et. al., 2000) due to their mutagenic activities, do not require metabolic activation.
Thus, to characterize organic extracts of airborne particles, Salmonella
typhimurium tester strains TA98, having high sensitivity and specificity has
frequently been used.
The majority of studies that have used TA98 and TA100, showed an increase in
mutagenicity of PM in the Ames test upon addition of S9 (Squadrito et. al., 2001;
Černá, et.al., 2000; Bronzetti et.al., 1996 and Sato et.al., 1995). A study on the
mutagenicity of PM found some day to day variation of S9 on the mutagenic
potential suggests that the composition of PM can vary considerably and
metabolic activation generally resulted in increased mutagenicity (Bronzetti et.al.,
1996).

30
1.5.3 Genotoxicity
Generally, genotoxicity is characterized by DNA-adduct formation and oxidative
DNA damage. A large number of chemical components are associated with PM.
Among them traffic-related airborne particles contains a large number of
genotoxic/mutagenic chemical substances that can cause DNA damage and
promote malignant neoplasms.
In recent decades, the mutagenic potential of airborne PM has been confirmed
using different short-term assays. DNA damage can be measured by comet assay
or as the formation of 8-oxo-7, 8- dihydro-20-deoxyguanosine (8-oxodG). Most of
the genotoxicity studies were conducted using extractable organic compounds and
mixtures, water-soluble substances (such as metals) and volatile organic
compounds (Knaapen et. al., 2002; de Kok et. al., 2005).
A study with the extractable organic material (especially PAH-containing
mixtures bound onto PM10 particles) on human-derived cell lines (leukocytes,
human alveolar carcinoma, human myeloid leukemia, human trancheobronchial
epithelia, human fibroblasts) have been used to investigate DNA damage. In this
study, they used residual oil fly ash (ROFA), PM10, PM2.5, PM2.5−10 and TSP and
other types of PM and found positive DNA damage, single-strand breaks,
micronuclei sister chromatid exchange, and oxidative DNA damage. The
measurements were analyzed by alkaline single-cell gel electrophoresis and comet
assay. These studies suggest that the mechanisms of genotoxicity of PM are the
result of adduct-forming compounds (through cell particulate interactions) and
oxidizing DNA damage (Poma, et. al., 2002; Karlsson et. al., 2004; Healey et. al.,
2005).
Other research was focused on the water-soluble fractions (mainly transition
metals) and compared their DNA damage potential. In their studies they found
that the constituents of the water-soluble PM extracts are more potent to induce
oxidative DNA damage than the organic compounds (Gutierrez-Castillo et. al.,
2006; Prahalat et.al., 1999). Previous studies suggested that inhalation and
deposition of PM in the lung, alveoli are able to stimulate the formation of ROS
(Knaapen et al. 2002), which can be generated by transition metals and/or quinoid

31
redox cycling and can play an important role in oxidative damage to cellular
membrane lipids, proteins-enzymes, and DNA. In addition, ROS can initiate
pulmonary inflammation which might be able to alter the excision repair
mechanisms of DNA and activates oncogenes (Knaapen et. al., 2004; Sagai et. al.,
2000).
Several studies suggested that transition metal contents and the concentrations
of the total or carcinogenic PAHs in PM2.5 (de Kok et. al., 2005) induced
genotoxicity. But Knaapen et al. (2002) concluded that apart from ROS
generation, a direct „particle‟ effect contributes to the genotoxic potential of
ambient PM. Another study showed that both the organic and inorganic
components of PM contributed to the induction of DNA damage, but the majority
of the damage (approximately 75%) was induced by the organic extract (Healey
et. al., 2005) of PM.
1.6 Research questions and Hypothesis
Epidemiological data indicated that PM2.5 is detrimental to public health but there
still remain many questions pertaining to how PM2.5 exerts harm to cells, the lung
and across body. Thus, assuming the adverse effects of PM2.5 on public health, we
undertook to address a number of questions that have been raised regarding the
toxicology and biological effects associated with PM2.5 exposure. For example,
what are the concentrations of particular organic compounds (for example, PAHs
and PFCs) in PM2.5? Does PM2.5 exert any direct toxic effects on human lung
cells? If it is toxic, what cellular mechanisms lead to cell injury or damage? Is
inflammation the basis of cellular toxicity upon exposure to PM2.5? How the
contaminants do adsorb on PM2.5 cause adverse effects on offspring‟s health?
With the benefit of hindsight, we hypothesized that i) PM2.5 from Chinese cities
may contain the chemical contaminants PAHs and PFCs. Thus inhalation
exposure of PM2.5 may cause risks to develop lung diseases to the local people.
Since lung is the first organ in contact with air PM2.5, inflammatory damage may
be evoked. Once the chemical contaminants got into the circulation, they could
pass through placenta in affecting fetal health.

32
1.7 Objectives of the present study
Our goals were to determine the concentrations of some organic pollutants in
PM2.5 and examine the biological effects of PM2.5 in vitro and to investigate the
possible health effects of the contaminant of PM2.5 using in-vivo study.
i) To determine the concentrations of chemical contaminants in PM2.5
collected from different cities of China using either GC-MS or LC-
MS/MS techniques.
ii) To examine the biological effects of the chemical extracts of PM2.5 on
inflammatory and detoxification responses in cell-line studies.
iii) To explore the transcriptional profile associated with the prenatal
hepatotoxicity of PFOS with the intent of identifying critical target
pathways.
iv) To investigate the toxicity of PFOS on fetal pancreas using high-
throughput iTRAQ quantitative proteomic technique.
33
CHAPTER 2
CHEMICAL AND BIOLOGICAL CHARACTERIZATION OF
WINTER TIME FINE PARTICULATE MATTER (PM2.5)
COLLECTED IN FIVE CITIES IN CHINA
2. 1 Introduction
Air pollution problem in Northern China has reached alarming levels. In the
winter of 2012-13, trans-boundary air pollution from China was reported and
became a global concern. A remarkable increase in the prevalence of lung cancers
in the country in the past decades was found to be related to particulate matter
(PM) with an aerodynamic diameter of less than 2.5m (Chen et al., 2013). The
latest report from World Health Organization (WHO) stated that air pollution has
become the world’s single biggest environmental health risk, linked to around 7
million or nearly one in eight deaths in 2012. The figures suggested that outdoor
pollution from traffic fumes, coal and wood burning may kill more people than
smoking and diabetes combined. Outdoor air pollution came as a result of stroke,
cardiovascular and pulmonary disease and the vast majority was found to be in
Asia and America. The situation worsens with the exponential growth in
population together with the industrialization in this area.
It has been well known that ambient PM suspended in the atmosphere as
aerosol are adversely affecting human health, especially to the respiratory and
cardiovascular systems (Brunekreef et al., 2009; Langrish et al., 2012; Lee et al.,
2007; Park et al., 2011). PM10 and PM2.5 which are differentiated by the
particulate diameters (m) are commonly used in the air quality monitoring
scheme all over the world (USEPA). Of which, PM2.5, as compare to PM10, can
penetrate into the deeper area of the lung, directly affect the respiratory surfaces

34
and dissolve into blood which may cause systemic toxic effects. According to the
Environmental Protection Agency (USEPA), the ambient concentration of PM2.5
was set as 35 g/m3 (24 h mean) and 15g/m
3 (annual mean) for national ambient
air quality standard (USEPA, 2013). The pollutants which attached on the PM2.5,
which can pass all along the respiratory tract to the deeper alveolar sac, are the
disease-causing reason of air pollution. Organic and inorganic pollutants were
adsorbed on PM2.5 found globally (Cachon et al., 2014; Chang et al., 2006).
Polycyclic aromatic compounds (PAHs) had been accepted as a class of
ubiquitous environmental pollutants which are mostly products of energy
production such as coal and petroleum, natural gas and fossil fuels, as well as
cigarette smoking and waste incineration (Bostrom et al., 2002; Kong et al., 2010).
The sources of PAHs production may varies from countries to countries; in
Sweden, phenanthrene is the dominant PAHs found in 1994-2000 (Bostrom et al.,
2002); while fluoranthene being the most abundant PAHs detected in Beijing,
China (Wang et al., 2008). The USEPA has classified 7 PAHs as probable human
carcinogens: benz (a) anthracene, benz (a) pyrene, benzo (b) fluoranthene, benzo
(k) fluoranthene, chrysene, dibenz (a,h) anthracene and indeno (1,2,3-cd) pyrene.
Due to its small size, PM2.5 is able to penetrate to the lower respiratory tract to
alveolar sacs and induce cell damage. There are two major routes of inhaled PAHs
to the blood circulations. The majority of the PAHs deposits on the thinner
alveolar epithelium where they readily absorbed and enter the circulation; while
about 10-20% of PAHs inhaled will deposit on the thicker bronchial epithelium,
slowly absorbed and transport through the epithelium. Due to the lipophilic
properties of most PAHs, a fraction of compounds can be retained in the bronchial
tissues and accumulated to attain a high local dose even at low environmental
35
exposure levels (Bostrom et al., 2002). Industrial development and exponential
growth in population in China raises the needs of energy and subsequent different
kind of pollutions to the environment. On Feb 2014, Beijing recorded dangerously
high level of suspended PM2.5 for over 15 times of the recommended levels of
WHO limits (25 g/m3 24h mean PM2.5) for consecutive 6 days (Chen et al.,
2013). This leads to our concern to the air quality monitoring and its potential
health effects to lung, which is the first organ encountered with the suspended
pollution in air. Thus, in this study, human bronchial epithelial Beas-2b cell line
was used to evaluate the cytotoxicity of PM2.5 collected from the five cities in
China.
2.2 Materials and Methods
Air sample collection
Two northern (BJ and XA) and three southern (GZ, XM and HK) Chinese cities
were selected in the present study (Fig. 2.1A). The samples were taken for six to
eight days during the air pollution episode of haze from the end of January to the
beginning of February in 2013. The PM2.5 samples were collected on quartz fiber
filter (8 inch 10 inch) using a high-volume sampler at a flow rate of 1.05–1.16
m3 min
-1. Seven to eight air filters were collected from each sampling sites. A
sampling period of ~ 24 h was adopted at all sampling sites. The filters were then
wrapped in aluminum foils for further analysis in our laboratory.

36
The weights of filters were measured before and after the sampling procedure and
were stored in desiccator cabinet at room temperature. Field blanks were also
collected at each sampling site by putting the filters in the sampler without
drawing air through. The workflow of the experiment was shown in Fig. 2.1B.
City Location Longitude Latitude Site description
Beijing (BJ) Institute of Atmosphere Physics 116°23′09.25″ 39°59′10.78″ Urban
residential
Xi’an (XA) Institute of Earth Environment 108°52′58.59″ 34°13′49.36″ Commercial
and residential
Guangzhou
(GZ)
South China Institute of
Environmental Sciences
113°21′18.14″ 23°07′26.53″ Urban
residential
Xiamen
(XM)
Hu Li District Power Supply
Bureau
118°06′08.04″ 24°29′11.20″ Coastal
Hong Kong
(HK)
Hong Kong Polytechnic Univ. 114°11′00.17″ 22°18′11.49″ Roadside &
coastal

37
Fig 2.1. Experimental set up of present study. (A) Location of five sampling cities
on a China map. (B) The workflow of handling and processing the air filters.
One fourth of the air filter collected underwent soxhlet extraction and the organic
extract was dissolved in n-hexane. Half of the dissolved extracts performed
chemical analysis by GC-MS while the other half underwent nitrogen dry and
reconstituted in 1mL DMSO for biological analysis using cell line.

38
Measurement of PAHs in air filters
One fourth of the air filters were extracted for 16-18h at 68oC with 60 ml of the
solution mix (acetone: dichloromethane (DCM), n-hexane 1:1:1) in a soxhlet
extractor, as described in the standard method 3540C (USEPA Method 3540C,
1996c). The extracted solution was concentrated to 1 ml by a rotary evaporator,
and was then followed by florisil cleanup (USEPA Method 3620B, 1996b). The
cleaned extract was dried under nitrogen gas and resuspended in 1 ml of n-hexane.
Deuterated PAH internal standards (acenaphthene-d10, phenanthrene-d10,
chrysene-d12 and perylene-d12) were added into the extracts at the concentration of
320 ng/g prior to GC-MSD analysis (Hewlett-Packard (HP) 6890 N gas
chromatograph (GC) coupled with a HP-5973 mass selective detector (MSD) and
a 30 m x 0.25 mm x 0.25 m DB-5 capillary column (J&W Scientific Co. Ltd.,
Folsom, CA), as described in the Standard method 8270C (USEPA Method 8270C,
1996c). The native PAH standards (naphthalene (Nap), acenaphthylene (Acel),
acenaphthene (Ace), fluorine (Flu), phenanthrene (Phe), anthracene (Ant),
fluoranthene (Fla), pyrene (Pyr), benz (a) anthracene (BaA), chrysene (Chr),
benzo (b+k) fluoranthene (BbkF), benzo (a) pyrene (BaP), indeno (1,2,3-cd)
pyrene (Ind), dibenzo (a,h) anthracene (DbA), benzo (g,h,i) pyrelene (BghiP))
were used to obtain the standard curve with the concentrations of 0, 2, 5, 10, 20,
50, 100 and 200 ng/g. QA/QC analysis. The limit of detection (LOD) was
determined as the concentration of an individual PAH detected in a sample with a
signal-to-noise ratio of 3, ranging from 0.05 – 0.15 ng/g. The recoveries of
individual PAHs were from 74 – 108%. For each batch of samples, a method
blank (solvent), a spiked blank, a sample duplicate and a standard reference
material were analyzed.
39
The variation of coefficients of concentrations of PAHs of duplicate samples was
less than 10%. The concentrations of PAHs in the method blank were less than
the LOD. All the results were expressed as per one fourth of air filter.
Risk assessment
The risk assessment methodology advocated by WHO was used for assessing the
excess lifetime cancer risk from exposure to PAHs. The unit risk of lung cancer
suggested by WHO air quality guidelines is 87 x 10-6
per ng BaP per m3 air. The
lifetime cancer risk for lung cancer is then calculated by the equation below. The
cancer risk was expressed as extra cancer cases occur in 100,000 exposed
individuals.
Cancer risk = BaP equivalents (ng/ m3) x 87 x 10
-6
Cell culture and treatment
The human normal bronchial epithelium cell line, Beas-2b (ATCC, CRL-9609)
was grown in DMEM/F12 (HAM’s) medium supplemented with 10% FBS
(HyClone, Perbio, Thermo Fisher Scientific, Carmlington, UK) and antibiotics
(50U/ml penicillin and 50g/ml streptomycin) (Invitrogen, CA, USA). For the
soluble organic extractable matter in the extracts for biological assay, half of the
extracts in n-hexane (0.5 ml) were dried under nitrogen and reconstituted with
dimethyl sulfoxide (DMSO) (Sigma Aldrich, USA.). Filter extracts from same
region were combined to form a mixture for each region and approximately 500
g of extracts were used for cell assay (DMSO <0.005%).

40
MTT assay
Effects of filter extracts on cell viability were determined by MTT assay. Human
Beas-2b cells were plated into 96-well plates (Iwaki, Tokyo, Japan) at a density
reaching 70-80% confluence by the time of adding 500μg of extracts. After
incubation for 24 h with extracts in 5% CO2 at 37°C, the cells were incubated with
100 μl of 10% MTT solution (Sigma Aldrich) for another 4 hours at 37oC for
color development. The medium was then removed and 100μl of DMSO was
added to dissolve the intracellular blue crystalline formazan product for 10 min at
room temperature. Optical density was measured at 540nm by absorbance
microplate reader (BioTek ELx800). The results were presented as a percentage of
the absorbance of control cells.
Cell Migration assay
Cell migration was performed by using trans well chambers with 8m pore size
(Costar) in a 24-well plate (Iwaki, Tokyo, Japan).Cells were seeded at 2x10⁴ in 0.2
ml in the top chambers while the bottom chambers contained 0.7ml of completed
medium with 500g of extracts from different locations. Migration assay was
done in duplicate. After incubation at 37oC and 5% CO2 for 24 hours, the migrated
cells were fixed with ice-cold absolute methanol for 10 min and stained with
crystal violet solution for another 10 min before mounted on glass slide. More
than 10 views were analyzed under light microscope (100X) and number of
migrated cells was scored. The mean value was expressed as percentage from two
or three independent experiments as compared to the blank filter controls.

41
Real-time PCR
BEAS-2B cells were plated at a density of 7 x 10⁴ in a 12-well plate (Iwaki, Tokyo,
japan) and incubated at 37∘C, 5% CO2 for 24 hours until the cells had reached
70-80% confluence. An amount of 500g of extracts were then added and
incubated for 24 hours. Total RNA was then isolated and measured. Total RNA
with A260:A280 ratio between 1.8 and 1.9 was used for real-time PCR analysis.
Complementary DNA was synthesized from 100ng of total RNA using High
Capacity RNA-to-cDNA Master Mix (Applied Biosystems, Foster City, CA).
Primers which are gene-specific were designed from published sequences.
Real-time PCR was carried out with programmed time and temperature: 3min at
95∘C, 40 cycles of 95∘C for 15 sec, 56∘C for 20 sec and 72∘C for 30 sec. The
amplified PCR product from samples were quantified by Step One Real-Time
PCR system using SYBR Green Master mix (Applied Biosystems). Cycle
numbers were then calculated and normalized by the transcript level of actin.
Sequences of primers were listed in Table 2.1.
Statistical analysis
Statistical evaluations were conducted by SigmaStat 3.5. All data were tested to be
normally distributed and independent by using the Normal Plots in SigmaStat
significance were 0.05. Differences among groups were tested for statistical
significance by analysis of variance (ANOVA) followed by Duncan’s Multiple
Range test (significance at p< 0.05). Results are presented as the mean + SD.
Groups were considered significantly different if p< 0.05.

42
Table 2.1 List of human primers used in this study.
Primer Forward primer sequences Reverse primer sequences
CYP1A1 AGCAGCTGGATGAGAACGCC GCCGTGACCTGCCAATCACT
CYP1B1 TTGTGCCTGTCACTATTCCTC ATCAAAGTTCTCCGGGTTAGG
TNF- GGGCCTGTACCTCATCTACT TAGATGGGCTCATACCAGGG
IL-6 AGCCCACCGGGAACGAAAGA TGTGTGGGGCGGCTACATCT
IL-8 AAGCCACCGGAGCACTCCAT CACGGCCAGCTTGGAAGTCA
b-Actin GACTACCTCATGAAGATCCTCACC TCTCCTTAATGTCACGCACGATT

43
2. 3 Results and Discussion
16 USEPA PAHs were detected in PM2.5 of samples from China.
Air filters were collected from the five cities in southern (HK, GZ and XM) and
northern (XA and BJ) China. The one fourth of each air filters collected was
undergo standardized soxhlet extraction for PAHs and performed chemical and
biological analysis. The weights of PM2.5 collected on the filters were measured
(Fig. 2.2 A). The weights of PM2.5 per m3 air collected in the northern cities of
China were approximately 3 times higher than that of the southern cities,
weighted in average of 228g and 50g respectively. The concentrations of 16
USEPA PAHs in PM2.5 per m3 air flow of the five selected cities were shown in
Fig. 2.2 B and details were listed in Table 2.2.
Fig 2.2. Weights of PM2.5 dust in air filters collected from different cities of China
and the mean concentrations of total PAHs in each sampling site.

44
Table 2.2 Levels of PAHs and TEQ* (ppt) measured in the air samples from the
five cities in China.
HK GZ XM XA BJ
PAH Species TEF PAH
(ng/m3)
TEQ
(ppt)
PAH
(ng/m3)
TEQ
(ppt)
PAH
(ng/m3)
TEQ
(ppt)
PAH
(ng/m3)
TEQ
(ppt)
PAH
(ng/m3)
TEQ
(ppt)
Naphthalene
n.d n.d 0.03 0.09 0.08
Acenaphthylene n.d n.d n.d 0.32 0.34
Acenaphthene n.d 0.12 n.d 0.12 0.20
Fluorene 0.1 n.d n.d 0.21 0.43
Phenanthrene 0.13 0.12 0.07 2.45 5.74
Anthracene 0.01 0.02 n.d 0.36 0.93
Fluoranthene 0.23 0.37 0.25 8.56 13.97
Pyrene 0.28 0.38 0.24 8.00 11.35
Benz(a)anthracene 0.1 0.12 0.01 0.19 0.02 0.58 0.06 7.27 0.73 9.74 0.97
Chrysene 0.001 0.26 0.00 0.68 0.001 0.48 0.00 9.37 0.01 11.00 0.01
Benzo(b+k)fluoranthene 0.1 0.52 0.05 1.61 0.16 0.81 0.08 11.63 1.16 12.40 1.24
Benzo(a)pyrene 1 0.28 0.28 0.86 0.86 0.42 0.42 5.16 5.16 4.91 4.91
Indeno(1,2,3-cd)pyrene 0.1 0.53 0.05 1.10 0.11 0.57 0.06 7.13 0.71 5.04 0.50

45
Dibenz(a,h)anthracene 1 0.39 0.39 0.52 0.52 0.39 0.39 1.84 1.84 1.40 1.40
Benzo(g,h,i)perylene 0.49 0.92 0.53 6.06 3.54
Total PAHs 3.35 6.77 4.35 68.05 80.45
Total BaP equivalents(BaPeq) 0.79 1.68 1.00 9.61 9.04
Lifetime excess cancer risk
( cancer cases per million
exposed individuals)
6.8 14.6 8.7 83.6 78.6
*TEF = toxic equivalency factor. TEQ= (Concentrations of PAHs in each sample x corresponding TEF)
All 16 PAHs were detected in the samples from XA and BJ, while PAHs with
shorter carbon chains were undetectable in HK, GZ and XM samples (Fig. 2.3
A-E). Total PAH concentrations were calculated by the summation of all 16
PAHs congeners, the data ranging from 3.35 to 80.45ng/m3, leading by BJ,
followed by XA, GZ, XM and HK. Our results were relatively lower than
previous studies on PAHs contamination in ambient air in China (Okuda et al.,
2010; Sin et al., 2005; Wang et al., 2008).

46
Fig 2.3. Concentrations and distributions of PAH congeners in each sampling site.
Benzo(b+k)fluoranthene (BbkF) was the most abundance species among 15 PAHs
measured with the highest concentrations detected in most sampling sites except
HK and BJ, ranging from 0.52 to 12.40ng/m3. However, its levels were found to
be noticeable higher (> 12.40ng/m3) in the northern cities (XA and BJ) versus in

47
all the three southern cites (< 2ng/m3 air). Fluoranthrene is the most abundance
species found in BJ with the mean concentration of 13.97ng/m3. Similar to a
study conducted in 2006, the most abundant quantified PAHs in PM2.5 in BJ city
was Fla, at which this species of PAHs is closely associated with the increase uses
of natural gas (Wang et al., 2008).
PAHs concentrations of samples from northern China were at least 10 times
higher than that from southern China, showing less severe pollution in the
southern cities. The higher PAHs contaminations in northern cities may be due to
more coal and wood combustions for heat production in the winter, comparing to
the lesser demand on heating in the relatively warmer southern cities. In addition,
contaminations in the southern cities which are closer to the coastal area are
readily dispersed by the sea wind verses inland northern cities which tends to
accumulate the polluted air masses to local areas. Topography and climate
differences may also contributed to the difference in levels of PAHs
contaminations in mainland China. The average temperature and precipitation in
January was much lower in BJ and XA (average temperature below 0oC and 7
inches for average precipitation) than in the three southern cities (average
temperature above 12oC and precipitation above 24 inches). Higher rainfall in
southern China brings ambient air particulate matter to the ground, may contribute
to the lower PAH concentrations in these cities. Furthermore, BJ was
geographically surrounded by three mountains, polluted air mass produced was
difficult to be dispersed and led to a higher chance of smog accumulations, thus
more PM2.5 collected and higher PAHs concentration in our samples. PAHs in
ambient air can be in both gaseous and particulates forms. PAHs in particulates
were of higher molecular weight and greater carcinogenicity (Chang et al., 2006).

48
PAH congeners with carbon chain shorter than 14, noted naphthalene,
acenaphthylene, acenaphthene and fluorene, were found in much lower
concentrations than that with longer carbon chain (highest concentration with 0.43
ng fluorine/m3 air, with most of them were in undetectable level). However, PAHs
with longer carbon chain or higher molecular weight were found in higher
concentrations in all five sampling sites.
Cancer risks via inhalation of PAHs.
Data from a number of health studies suggested that there is an association
between lung cancer and exposure to PAH compounds (Zhang and Smith, 2007;
Zhang et al., 2009). The most important exposure route for lung cancer would
appear to be via inhalation. Most of the PAHs are known to be associated with
airborne particles. According to USEPA, some of the PAHs are classified as
human carcinogens such as BaP, BaA, BbkF, Chr, InP, and DbA. BaP, a
probable human carcinogen found in appreciable concentrations in the atmosphere,
can be used as a marker of the carcinogenic risk of airborne PAH. A previous
study suggested that an average of 6.5 million people in China was diagnosis with
lung cancer due to inhalation of ambient PAHs (Zhang et al., 2009). Total BaP
equivalent measures the relative toxicity of PAHs to BaP. The total BaP
equivalents (BaPeq) determined by toxic equivalent factors (TEF) and the
concentrations of individual PAHs was listed in Table 2.2. The data from XA
(9.61 ppt) show the highest calculated BaPeq among five cities, followed by BJ
(9.04 ppt), GZ (1.68 ppt), XM (1.00 ppt) and HK (0.79 ppt) with the lowest.
Excess lifetime cancer risk calculated based on total BaPeq of each city was
shown in Fig. 2.4. For XA and BJ, the estimated lifetime cancer risk were the
highest, reaching 83.6 and 78.6 extra cancer cases per 100,000 exposed

49
individuals; while HK, GZ and XM were with much lower exposure risk at 6.8,
14.6 and 8.7 extra cancer cases in 100,000 exposed individuals respectively. The
guideline value for ambient BaP was set to be 0.1ng/m3, thus the acceptable risk
of exposure to PAHs via inhalation was 1.0e-05. Our result suggested if the risk is
higher than the maximum acceptable risk level of 1 per 100,000 exposed
individuals, more legislation on the air quality control on PAHs-bound PM
emission is needed to control the pollution.
Fig 2.4. Calculated excess lifetime cancer risks (per million exposed individuals)
of the five sampling sites.
Coal combustion and vehicle emission were the common sources of PAHs in
PM 2.5.
Analyses of the diagnostic ratio were widely used to give an idea on the possible
emission sources of PAHs in environmental monitoring (Akyuz and Cabuk, 2008;
Vasilakos et al., 2007). Five diagnostic ratios were calculated and shown in Table
2.3. For Hong Kong, the ratio BaP/BghiP (0.55) and Ant/(Ant+Phe) (0.098)
indicated gasoline engine and non-burned fossil fuels contributed to the major
sources of emission. On the other hand, the sources of PAHs in other cities were

50
Table 2.3 Diagnostic ratios of PM-bounded PAHs in different cities of China.
Diagnostic
ratio
Ind/
(Ind+BghiP)
BaP/
BghiP
Flu/
(Flu+Pyr)
Ant/
(Ant+Phe)
BaA/
(BaA+Chr)
Gasoline
engine
>0.18 0.5-0.6 <0.5 >0.5 >0.49
Diesel
engine
0.35-0.7 0.3-0.4 >0.5 >0.35 >0.68
Coal
burning
>0.56 0.9-6.6 >0.57 >0.24 >0.46
Non-burne
d fossil
fuels inputs
- >0.58 - <0.1 -
Natural gas
combustion
>0.32 - >0.49 >0.12 >0.39
HK 0.52 ± 0.009 0.55 ± 0.039 0.30 ± 0.093 0.098 ± 0.013 0.31 ± 0.029
GZ 0.54 ± 0.008 0.95 ± 0.078 - 0.13 ± 0.027 0.19 ± 0.08
XM 0.52 ± 0.025 0.78 ± 0.080 - - 0.55 ± 0.026
XA 0.54 ± 0.011 0.87 ± 0.134 0.03 ± 0.01 0.13 ± 0.022 0.42 ± 0.036
BJ 0.59 ± 0.011 1.37 ± 0.060 0.04 ± 0.005 0.14 ± 0.031 0.46 ± 0.042

51
Fig 2.5. Graphic illustration of the diagnostic ratios on the sources of PAHs
emission.
mainly due to the burning of coal and natural gas combustion. Diagnostic ratios
shown in Fig. 2.5 illustrated the source of PAHs in XM, XA and BJ are mainly
from grass, wood and coal combustion; whereas the source in HK and GZ are
mainly from mixed sources of both combustion and petroleum for vehicles.
Flu
/ F
lu+
Pyr

52
Gene expression levels of pro-inflammatory cytokine and xenobiotic
metabolizing enzymes were altered by PM2.5 exposure.
Human bronchial epithelial cells which were usually used in in vitro study to
determine the pro-inflammatory and cytotoxic effects were exposed to 500g of
PM2.5 extracts for 24h, gene expression levels of pro-inflammatory cytokines and
xenobiotic metabolizing enzymes were investigated. Samples from all locations
were found to significantly induce the gene expression level of interleukin-6
(IL-6), but not IL-8 and tumor necrosis factor-alpha (TNF) (Fig. 2.6A). In
addition, gene expression levels of xenobiotic metabolic enzymes (CYP1A1 and
CYP1B1) were also up-regulated by PM2.5 extract treatment for 24h (Fig. 2.6B).
Recent studies demonstrated the PAHs adsorbed on particulate matter can lead to
cell damage, induce cytotoxicity and pro-inflammatory responses (Cachon et al.,
2014; Osornio-Vargas et al., 2011).
Initiation of inflammatory response involves in the induction of various
cytokines and chemokine. Other studies reported the evaluation of the relationship
between PM exposure and cytokines induction (Cachon et al., 2014; Dergham et
al., 2012; Michael et al., 2013). IL-6 and IL-8 were both critical pro-inflammatory
cytokine produced by epithelial cells to stimulate inflammatory response. In the
present study, IL-6 was significantly induced by PM2.5 extracts, inflammatory
response may be triggered by the exposure of Beas-2b cells to PM extracts from
the five cities.
Xenobiotic metabolic enzymes were also up-regulated upon exposure to PM2.5
extracts (Fig. 2.6B). CYP1A1, a phase I enzyme of xenobiotic metabolic pathway,
was known to be induced by PAHs (Cachon et al., 2014; Dergham et al., 2012; Val
et al., 2011).

53
Fig 2.6. Gene expression levels of pro-inflammatory cytokines and xenobiotic
metabolic enzymes upon extracts treatment for 24h in BEAS-2B cells. (A)
mRNA levels of interleukin-6 (IL-6) was significantly up-regulated in all five
sampling sites as compared to the blank filter control (p<0.01). (B) Gene
expression levels of cytochrome p450 enzymes were significantly up-regulated by
the extracts exposure of all sampling sites (p<0.01).
PM2.5 from XA and BJ induced migration of Beas-2b cells.
Cell proliferation and migration are important biological process found in tumor
metastasis and progression. Treatments of Beas-2b cells with PM2.5 extracts from
BJ, XA, XM or GZ induced cell proliferation (Fig. 2.7A). For the transwell cell
migration assay, PM2.5 extracts from XA and BJ caused significant increases in
cell migration as compared to the filter control, and extracts from HK, GZ and
XM (Fig. 2.7B). Although most of the PM2.5 extracts induced cell proliferation
and the expression levels of IL-6, the extracts from the Northern cities (BJ and
XA) might contain more carcinogenic substances that promoted tumorigenicity.
This observation is consistent with the highest calculated values of the excess
lifetime cancer risks in BJ and XA (Fig 2.4). However it may warrant a further
investigation if there are other unidentified carcinogenic substances in the air of
the Northern cities.

54
Fig 2.7. Exposure to PM extracts increased the migration of BEAS-2B cells in cell
migration assay. (A) The proliferation assay demonstrated the increase in
proliferation in the cells treating with GZ, XM, XA and BJ extracts in MTT assay
(p<0.05). (B) Micrographs showing the representative pictures of cell migration
assay (200x). The percentage of migration of cells treated with XA and BJ were
significantly higher than that of other cities and the blank filter (p<0.05).

55
2.4 Conclusion
Ten priority PAHs were identified in the winter time PM samples in all five cities;
while all 16 PAHs can be detected in samples of XA and BJ. Chemical analysis
results showed the higher levels of PAH contaminations were found in XA and BJ,
indicating the pollution in these two cities were much severe than HK, GZ and
XM. We used TEF to evaluate the possibility of cancer risks in equivalent to
human carcinogen BaP. These analyses suggested that a long term exposure to
such environment may cause adverse health effects, such as a higher risk of
getting lung cancers. Additional new policy measures on PM2.5 emission should
be adopted to protect the deteriorating air quality and public health against the air
pollution, especially in northern cities in China.

56
CHAPTER 3
CHEMICAL AND BIOLOGICAL CHARACTERIZATION OF
FINE PARTICULATE MATTER (PM2.5) COLLECTED IN
CHINA IN SUMMER
3.1 Introduction
In chapter two, we demonstrated that the presence of PAHs in the PM2.5 samples
collected in the winter time, increase risk of lung cancer in local population. In
summer time, the use of coal burning for heat is greatly reduced. Moreover,
summer season is in general characterized by frequent and intense precipitation.
These two factors can attribute to a large reduction of air pollution in the region
(Cao et. al., 2012). Thus, we assumed that the air pollution problem is
comparatively lesser in the summer season. However some studies suggested that
air quality and visibility can be strongly affected by atmospheric photochemistry
in summer which can produce a significant amount of secondary aerosols (Pathak
et. al. 2009). The atmospheric transformation of primary and secondary pollutants
in the presence of sunlight is generally known as photochemical smog, which can
directly affect respiratory tracts and had statistically related to increased mortality
(Motley et.al., 1959). A study using a lung cell-line to test against the effects of
complex urban air mixtures in smog chambers demonstrated that secondary
aerosols contribute significantly to the inflammatory responses (Sexton et. al.,
2004). Another study revealed an association between the formation of DNA
adducts and the exposure to O3, suggesting the role of photochemical smog in an
increased risk of lung cancer in never-smokers (Peluso et. al., 2005). In
considering all these factors, we expected that PM2.5 collected in summer time
could cause negative health effects on the local residences.
In this study, PM2.5 samples were collected from 4 cities in China, including
Guangzhou (GZ), Xiamen (XM), Beijing (BJ) and Xian (XA) from July 2013 –
August 2013. We then determined the concentrations of PAH congers using GC-
MS and estimated excess lifetime cancer risk via inhalation exposure to PAHs. In

57
addition, the potency the PM2.5 samples to induce pro-inflammatory cytokines
(IL-6, IL-8, TNF-alpha) and cytochrome P450 enzymes (CYP1A1, CYP1B1)
were determined using human bronchial epithelial cells, BEAS-2B. Then a
comparison of summer and winter season data was made to provide a better
understand on the chemical characteristics of PM2.5 in association with seasonal
variations.
3. 2 Materials and Methods
Air sample collection
Two northern (BJ and XA) and two southern (GZ and XM) China cities were
selected in the present study (Fig.3.1). Air was sampled for six to eight days from
the end of July to the beginning of August in 2013. The air PM2.5 samples were
collected using quartz fiber filters (8 inch 10 inch) installed in the high-volume
samplers at a flow rate of 1.05–1.16 m3 min
-1. Seven to eight air filters were
collected from each sampling sites for a period of 24 h. The filters were then
wrapped in aluminum foils for further analysis in our laboratory.
Measurement of PAHs in air filters, risk assessment, cell culture and
treatment
The method of chemical analysis and biological experiments were conducted as
described in section 2.2 of chapter 2.
Statistical analysis
Statistical evaluations were conducted by SigmaStat 3.5. All data were tested to be
normally distributed and independent by using the Normal Plots in SigmaStat
significance were 0.05. Differences among groups were tested for statistical
significance by analysis of variance (ANOVA) followed by Duncan’s Multiple
Range test (significance at p< 0.05). Results are presented as the mean ± SD.
Groups were considered significantly different if p< 0.05.

58
3.3 Results and Discussion
Physical and chemical characterization of PM2.5 samples.
The weights of PM2.5 collected from southern (GZ, XM) and northern (BJ and
XA) cities were measured (Fig. 3.2A). Concentrations of the 16 USEPA PAHs
detected in the PM2.5 samples from the four cities were shown in (Fig 3.2B). All
16 PAHs were detected in the samples from all the sampling cities. The total PAH
concentrations were calculated by the summation of all the 16 PAHs congeners,
ranged from 0.81 to 11.2 ng/m3, led by XA, followed by BJ, GZ and XM (Table
3.1). Generally the concentrations of PAHs with shorter carbon chains
(naphthalene, acenaphthylene, acenaphthene and fluorine) were lesser than that of
the longer carbon chain congeners (Fig. 3.3 A-D) which are known to have high
carcinogenicity and may impose greater risk of lung cancer (Ravindra, et.al.,
2008).
The average total weights of the PM2.5 filters collected from the northern cities
(148.73 μg/m3air) were 3.5 times greater than that from the southern cities (41.30
μg/m3air). In contrast, the average total concentrations of PAHs in the northern
cities (15.05 ng/m3) were 4 times greater than that of the southern cities (3.75
ng/m3). These observations indicated the serious air pollution problem in the
Northern cities. In this study, the fewer amounts of PAHs in the PM2.5 samples
collected in the filters indicated the less severe pollution in the southern cities.
The higher PAH contamination in northern cities may be due to reliance on huge
coal and wood combustion for heat production (Cao et. al., 2012), while relatively
warmer southern cities showed lesser demand of heating. In addition,
contaminations in the southern cities those are closer to the coastal area are readily
dispersed by the sea wind verses inland northern cities where PM tends to be
accumulated in the local areas. Topography and climate differences may also
affect the PAH contamination in China. The average temperature and rainfall in
July was much lower in BJ and XA (average temperature 27°C and 4 inches for
precipitation) than the two southern cities (average temperature 29°C and
precipitation above 10 inches) (Weather.org, 2015).

59
The higher precipitation in the southern China might facilitate the dilution of PAH
concentrations in these cities. Moreover, Beijing was geographically surrounded
by three mountains which make difficulty in both horizontal and vertical diffusion
of pollutants, leading to a high chance of smog formation. It was reflected by the
more PM2.5 collected in filters and greater PAHs concentrations detected in our
samples.
Fig 3.1. Locations of four sampling cities on a China map

60
24.32 16.98
62.96
85.77
0
20
40
60
80
100
120
140
GZ XM BJ XA
Wei
gh
t (μ
g/m
3 a
ir)
2.94
0.81
3.85
11.2
0
2
4
6
8
10
12
14
GZ XM BJ XA
Co
nce
ntr
atio
n (
ng/
m3)
(B)
(A)
Fig 3.2. The weights of PM2.5 in the air filters and the mean concentrations of total PAHs in each
sampling site.

61
Table 3.1 PM2.5 samples from the four cities in China.
Sampling cities GZ XM XA BJ
PAH Species TEF PAH
(ng/m3)
TEQ
(ppt)
PAH
(ng/m3)
TEQ
(ppt)
PAH
(ng/m3)
TEQ (ppt) PAH
(ng/m3)
TEQ
(ppt)
Naphthalene
0.09 0.01 0.06 0.13
Acenaphthylene 0.01 0.01 0.03 0.01
Acenaphthene 0.04 n.d 0.08 0.03
Fluorene 0.04 0.02 0.06 0.04
Phenanthrene 0.12 0.06 0.35 0.20
Anthracene 0.17 0.01 0.11 0.10
Fluoranthene 0.12 0.06 0.75 0.35
Pyrene 0.13 0.06 0.66 0.29
Benz(a)anthracene 0.1 0.08 0.00 0.06 0.00 0.77 0.07 0.12 0.01
Chrysene 0.001 0.17 0.00 0.09 9.27 0.86 0.00 0.40 0.00
Benzo(b+k)fluoranthene 0.1 0.36 0.03 0.14 0.01 1.57 0.15 0.52 0.05
Benzo(a)pyrene 1 0.26 0.26 0.02 0.02 1.13 1.13 0.23 0.22
Indeno(1,2,3-cd)pyrene 0.1 0.46 0.04 0.07 0.00 1.85 0.18 0.51 0.05
Dibenz(a,h)anthracene 1 0.12 0.12 0.02 0.02 0.50 0.49 0.14 0.14
Benzo(g,h,i)perylene 0.71 0.12 2.45 0.76
Total PAHs 2.94 0.81 11.2 3.85
Total BaP
equivalents(BaPeq)
0.473 0.077
2.04 0.485
Lifetime excess cancer risk
( cancer cases per million
exposed individuals)
4.12 0.670 17.83 4.22

62
0
0.2
0.4
0.6
0.8
1
1.2
Nap
hth
alen
e
Ace
nap
hth
yle
ne
Ace
nap
hth
ene
Flu
ore
ne
Phen
anth
rene
Anth
race
ne
Flu
ora
nth
ene
Pyre
ne
Ben
z(a)
anth
race
ne
Ch
ryse
ne
Ben
zo(b
+k
)flu
ora
nth
ene
Ben
zo(a
)pyre
ne
Inden
o(1
,2,3
-cd
)py
ren
e
Dib
enz(
a,h)a
nth
race
ne
Ben
zo(g
,h,i
)per
yle
ne
Con
cen
trati
on
s of
tota
l P
AH
s (n
g/m
3 a
ir)
GZ
0
0.05
0.1
0.15
0.2
0.25
Nap
hth
alen
e
Ace
nap
hth
yle
ne
Ace
nap
hth
ene
Flu
ore
ne
Phen
anth
rene
Anth
race
ne
Flu
ora
nth
ene
Pyre
ne
Ben
z(a)
anth
race
ne
Ch
ryse
ne
Ben
zo(b
+k
)flu
ora
nth
ene
Ben
zo(a
)pyre
ne
Inden
o(1
,2,3
-cd
)py
ren
e
Dib
enz(
a,h)a
nth
race
ne
Ben
zo(g
,h,i
)per
yle
ne
Co
nce
ntr
ati
on
s o
f to
tal
PA
Hs
(ng
/m3 a
ir)
XM (B)
0.00
0.20
0.40
0.60
0.80
1.00
1.20
Nap
hth
alen
e
Ace
nap
hth
yle
ne
Ace
nap
hth
ene
Flu
ore
ne
Phen
anth
rene
Anth
race
ne
Flu
ora
nth
ene
Pyre
ne
Ben
z(a)
anth
race
ne
Ch
ryse
ne
Ben
zo(b
+k
)flu
ora
nth
ene
Ben
zo(a
)pyre
ne
Inden
o(1
,2,3
-cd
)py
ren
e
Dib
enz(
a,h)a
nth
race
ne
Ben
zo(g
,h,i
)per
yle
ne
Co
ncen
tra
tio
ns
of
tota
l P
AH
s (n
g/m
3 a
ir)
BJ
0.00
0.50
1.00
1.50
2.00
2.50
3.00
3.50
4.00
4.50
5.00
Nap
hth
alen
e
Ace
nap
hth
yle
ne
Ace
nap
hth
ene
Flu
ore
ne
Phen
anth
rene
Anth
race
ne
Flu
ora
nth
ene
Pyre
ne
Ben
z(a)
anth
race
ne
Ch
ryse
ne
Ben
zo(b
+k
)flu
ora
nth
ene
Ben
zo(a
)pyre
ne
Inden
o(1
,2,3
-cd
)py
ren
e
Dib
enz(
a,h)a
nth
race
ne
Ben
zo(g
,h,i
)per
yle
ne
Co
ncen
tra
tio
n o
f to
tal
PA
Hs
(ng
/m3 a
ir)
XA (D)
Fig 3.3. The concentrations and distributions of PAH congeners in each sampling site.
(A)
(C)

63
Benzo (g,h,i) perylene was measured in samples from all the sampling cities
ranging from 0.12 to 2.45 ng/m3 (Table 3.1). The concentrations were found
greater (3.21 ng/m3) in the northern (BJ and XA) than the southern cities (0.83
ng/m3). Among the sampling cities, the samples from XA were measured with the
highest level of benzo (g,h,i) perylene concentration (2.45 ng/m3). Similar to a
study conducted in 2008, the most abundant PAHs detected in PM sample from
XA was benzo (g,h,i) perylene, which emission is closely associated with
increased traffic-activities (Shen et. al., 2010).

64
Table 3.2 Diagnostic ratios of PM-bounded PAHs in different cities of China.
Diagnostic
ratio
Ind/
(Ind+BghiP)
BaP/
BghiP
Flu/
(Flu+Pyr)
Ant/
(Ant+Phe)
BaA/
(BaA+Chr)
Gasoline
engine
>0.18 0.5-0.6 <0.5 >0.5 >0.49
Diesel
engine
0.35-0.7 0.3-0.4 >0.5 >0.35 >0.68
Coal
burning
>0.56 0.9-6.6 >0.57 >0.24 >0.46
Non-
burned
fossil fuels
inputs
- >0.58 - <0.1 -
Natural gas
combustion
>0.32 - >0.49 >0.12 >0.39
GZ 0.386±0.03 0.301±0 0.480±0.01
0.577±0.007
0.335±0.02
XM 0.361±0.06 0.225±0.320 0.526±0.017 0.267±0.171 0.350±0.217
XA 0.422±0.028 0.444±0.135 0.521±0.03 0.209±0.129 0.713±0.096
BJ 0.432±0.086 0.354±0.188 0.546±0.012 0.155±0.151 0.235±0.040

65
Cancer risks via inhalation of PAHs.
B[a]P is a surrogate marker to indicate carcinogenic risk of airborne PAHs. Thus,
in our study, the total B[a]P equivalent (B[a]Peq) were determined using toxic
equivalent factors (TEF) and the concentrations of the individual PAHs (Table
3.1). The calculated value of 2.04 ppt from XA showed the highest calculated
B[a]Peq among the four cities, followed by BJ (0.485 ppt), GZ (0.473 ppt) and
XM (0.077 ppt) (Table 3.1). The estimated excess lifetime cancer risk was shown
in Fig. 3.4. For XA, BJ and GZ, the estimated lifetime cancer risk were
comparatively greater, reaching 17.83, 4.22 and 4.12 extra-cancer cases per
100,000 exposed individuals. The relative lower exposure risk was calculated in
XM with 0.670 extra-cancer cases in 100,000. Therefore in the summer season,
the serious lifetime cancer risk was in XA, BJ and GZ. Recent studies on Chinese
population suggested that lung cancer caused by inhaled exposure to PAHs was
1.6%, corresponding to an excess annual lung cancer incidence rate of 0.65x 10⁻⁵
(Zhang et. al., 2009). In this context, however, the estimated results of our study
suggested a comparable high cancer risk is associated with PAH exposure.
4.12
0.67
4.22
17.83
0
2
4
6
8
10
12
14
16
18
20
GZ XM BJ XA
Exce
ss li
fe t
ime
can
cer
risk
s (p
er
mill
ion
exp
ose
d in
div
idu
als)
Fig 3.4. Calculated excess lifetime cancer risks (per million exposed individuals) of
the five sampling sites.

66
Coal combustion and vehicle emission were the common sources of PAHs in
PM 2.5.
The ratio of the individual PAH concentration can be calculated and used to trace
possible emission sources (Schauer et al., 2003). Among the PAH compounds,
BkF, Ind, and BghiP are considered as the tracers of vehicle emission (Miguel and
Pereira 1989; Li and Kamens 1993; Harrison et al. 1996), whereas Phe, Ant, Flu,
Pyr, BaA, Chr, BaP, and BghiP are recognized to be the source of coal
combustion and coke production (Duval and Friedlander 1981). Thus, five
diagnostic ratios were calculated and shown in Table 3.2. For GZ, the gasoline
and diesel engine contributed to the major sources of the emission. On the other
hand, the sources of PAHs in other cities were mainly due to coal and diesel
engine combustion.
Biological characterization of the effects of PM2.5 extracts on the expression
levels of pro-inflammatory cytokine and xenobiotic metabolizing enzymes in
human bronchial cells.
Human bronchial epithelial cells (BEAS-2B) were exposed to the PM2.5 extracts
and gene expression levels of pro-inflammatory cytokines and xenobiotic
metabolizing enzymes were measured. For cell cytotoxicity study, no noticeable
effects were observed in the cells exposed to PM2.5 samples extracts (Fig. 3.5A).
For inflammatory responses, the samples from BJ and XA were found to
significantly induce the gene expression levels of interleukin-6 (IL-6), but not IL-
8 and tumor necrosis factor-alpha (TNF-) (Fig.3.5B). Among different
cytokines, IL-6 is an important pro-inflammatory cytokine produced by epithelial
cells. In addition, gene expression levels of xenobiotic metabolic enzymes
(CYP1A1 and CYP1B1) were found to be up-regulated in the treatment with
PM2.5 extracts (Fig. 3.5C). It was reported that CYP1 enzymes actively take part
in detoxifying PAHs (Nebert et. al., 2004). Since CYP enzymes belongs to
xenobiotic metabolizing pathway. The induction of CYP1A1 and CYP1B1
enzymes illustrated the response of the biological system to the presence of PAH
contaminants in the samples.

67
0
50
100
150
Solvent control GZ XM BJ XA
% o
f ce
ll v
iab
ilit
y
MTT assay: BEAS-2B cells were exposed to PM2.5 for 24-h
Fig 3.5. Cytotoxicity and gene expression levels of pro-inflammatory cytokines and
xenobiotic metabolic enzymes upon summer extracts treatment for 24h in BEAS-2B
cells. (A) The MTT assay showed no cytotoxicity was found with the summer PM2.5
sample extracts upon exposure to BEAS-2B cells. (B) Gene expression levels of
cytochrome p450 enzymes (CYP1A1 and CYP1B1) were significantly up-regulated by
the summer extracts exposure of all the sampling sites (*p<0.05). (C) Relative mRNA
expression levels of interleukin-6 (IL-6) was significantly up-regulated in BJ and XA
sampling sites as compared to the blank filter control (*p<0.05).
A
B C
* *
*
*
* * *
* * *

68
Table 3.3 Comparison of winter and summer season filters weights and total PAHs
in PM2.5
Sampling
location
Sampling
cities
Winter Average
total
Summer Average
total
Weight
of dust
Filters
(μg/m3)
Southern
cities
HK 42.91 151.15 - 41.3
GZ 68.32 24.32
XM 39.92 16.98
Northern
cities
BJ 223.98 456.41 62.96 148.73
XA 232.43 85.77
Total
PAHs
(ng/m3)
Southern
cities
HK 3.35 14.47 - 3.75
GZ 6.77 2.94
XM 4.35 0.81
Northern
cities
BJ 80.45 148.15 3.85 15.05
XA 68.05 11.2

69
3.4 A comparison of winter and summer sample data
Since the summer samples were collected only from the four cities in China, we
didn’t have the HK summer samples for the comparison.
Comparison of data in the northern and southern cities in winter and
summer.
To compare the effects of seasonal changes on the quantity and chemical
characteristics of PM2.5 collected, our data indicated that the amount of filter
samples collected per unit time in the winter season were notably greater.
Moreover, the concentrations of PAHs detected in the PM2.5 samples were
significantly higher. In the northern cities, the average total PM2.5 filters weights
of the winter samples (456.41 g/m3 air) were more than 3 times greater than the
summer samples (148.73 μg/m3 air) (Table 3.3). In northern cities, the average
total concentrations of PAHs in the winter samples (148.5 ng/m3 air) were about
10 times greater than the summer season (15.05 ng/m3 air) (Table 3.3). In contrast,
in the southern cities, the average total PM2.5 filters weights of the winter samples
(151.15 μg/m3 air) were 3.6 times greater than in the summer season (41.3 μg/m
3
air). The average total PAH concentrations (14.47 ng/m3 air) were found to be
around 4 times greater than the summer season (3.75 ng/m3 air). To compare the
air pollution problem among the cities of the northern or southern region, our data
showed that XA and BJ were found to be seriously polluted in the respective
region in both sampling seasons.
These data suggested that the higher the filter weights the greater the PAHs
concentrations. In a study from Peking University, He et. al., (2006) reported that
PM2.5 concentrations at Shenzhen, China was 34.9μg/m3 in summer and
99.0μg/m3 in winter; while another study carried out by He et.al. (2001) from
Tsinghua University found greater PM2.5 concentrations in Beijing in winter than
the summer. Taken together the levels and contamination profile of PM emission
was influenced by seasonal variations (Feng et. al., 2006; Niu et. al., 2006 and Hu
et. al., 2005).

70
3.5 Conclusion
In summer, fifteen priority PAHs were identified in all the sampling cities. From
the chemical analysis, we understood that the amounts of PAH concentrations in
the northern cities (BJ and XA) were greater than southern cities (GZ and XM)
indicating the pollution in BJ and XA were severe than GZ and XM. A seasonal
comparison suggested that the greater levels PM2.5 were collected in the winter
time. In considering the analytical and biological analysis in term of seasonal
variations, we assumed that a long term exposure to such environment may cause
adverse health effects, such as a higher risk of getting lung cancer. A strict
regulation of criteria standard for PM2.5 at both local and national levels should be
enforced to protect the deteriorating air quality and public health, especially in
northern cities in China.

71
CHAPTER 4
DETERMINATION OF THE CONCENTRATION OF
PERFLUORINATED COMPOUNDS (PFCs) IN FINE
PARTICULATE MATTER (PM2.5) IN CHINA AND THEIR
EFFECTS ON FETAL LIVERS
4.1 Introduction
In the previous chapters 2 and 3, we measured the concentrations of PAHs in
PM2.5 collected from different cities in China during winter and summer. Our
data suggested that a long-term exposure to such environment may cause adverse
health effects, such as a higher risk of lung cancers. Besides PAHs, perfluorinated
compounds (PFCs) are global pollutants that is known to have long environmental
and biological half-life (Ellis et al., 2004; Wallington et al., 2006; Young et al.,
2007; Martin et al., 2005), are widely detected in humans and wildlife (Zhao et.
al., 2011). PFCs can be transported in air and adsorbed on PM. A study in
Keihanshin in Japan suggested that inhalation is a potential source of PFCs
(perfluorooctane sulfonate (PFOS) and perfluorooctanoic acid (PFOA) intake
(Harada et. al., 2005). Despite the worldwide ban on the uses of PFOS, it is still
being produced and used in China. PFOS has a long half-life of 4 years in
humans, suggesting that continuous exposure of PFOS could increase body
burden to levels that may result in adverse health outcomes (ATSDR 2009).
Therefore, in the first part of this chapter, we measured the concentrations of
PFCs in the winter dust samples collected from the northern cities (Beijing, BJ;
Xian, XA) and southern cities (Hong Kong, HK; Guangzhou, GZ; and Xiamen,
XM) in China using LC-MS/MS techniques.
The inhalation of PFCs through PM2.5 dust, subsequently get into our blood
circulation via lung alveoli. Cumulating reports demonstrated the presence of
PFOS in human maternal blood, umbilical cord blood and placenta, suggesting
that human fetus is potentially exposed to PFOS via their mothers' blood (Midasch
et. al., 2007; Inoue et. al., 2004; Kim et. al., 2011). In the second part of this

72
chapter, we used mouse model and high throughput transcriptomic technology, to
determine the potential effects of prenatal exposure to PFOS on fetal livers.
4.2 Materials and Methods
Air samples collection
The method of sample collection and description of sampling cities were
described in section 2.2. of chapter 2.
Measurement of PFCs in air filters
The concentration of PFC in the PM2.5 collected from different cities of China was
determined using high-performance liquid chromatography with an electrospray
tandem mass spectrometer (LC/MS/MS) as previously described (Sasaki et.al.,
2003; Harada et.al., 2005; Zhao et.al., 2011). Briefly, one-quarter of the air filters
were used for the extraction. Deuterated PFCs internal standards at the
concentration of 10 ppb (sodium perfluoro-1-hexane[18
O2] sulfonate, MPFHxS;
sodium perfluoro-1-[1,2,3,4-13
C4 ] octanesulfonate, MPFOS; perfluoro-n- [13
C4]
butanoic acid, MPFBA; perfluoro-n-[1,2-13
C2] hexanoic acid, MPFHxA;
perfluoro-n-[1,2,3,4-13
C4 ] octanoic acid, MPFOA; perfluoro-n-[1,2,3,4,5-13
C5 ]
nonanoic acid, MPFNA; perfluoro-n-[1,2-13
C2] decanoic acid, MPFDA;
perfluoro-n-[1,2-13
C2 ] undecanoic, MPFUdA; perfluoro-n-[1,2-13
C2] dodecanoic
acid, MPFDoA were added into the extracts. The homogenate was extracted by
1mL of 0.5M tetra-N-butyl ammonium hydrogen sulfate (TBA, Sigma-Aldrich,
GmbH, Switzerland) solution and 2mL of 0.25M sodium carbonate buffer in a 15-
mL polypropylene tube. After being thoroughly mixed, 5mL of methyl terta-butyl
ether (MTBE, Sigma-Aldrich, GmbH, Seelze) was added to the solution, and the
mixture was shaken at 280rpm for 40 minutes. After being separated by
centrifugation at 3000 rpm for 10 minutes, adequate volume of MTBE (4 mL) was
removed from the solution, and the process was repeated twice. The solvent was
allowed to evaporate under nitrogen (N-EvapTM
112, MA, USA) and then
reconstituted in 1mL solution of ammonium acetate and acetonitrile (6:4 ratios).
After centrifugation, the supernatants were collected in auto sampler vials (AMB
ram vial 9mm THD, Grace, USA).

73
LC-MS/MS system for determination of PFCs
The PFCs standards (Perfluoro-n- butanoic acid, PFBA; perfluoro-n-hexanoic
acid, PFHxA; perfluoro-n-octanoic acid, PFOA; perfluoro-n-nonanoic acid,
PFNA; perfluoro-n-decanoic acid, PFDA; perfluoro-n-undecanoic acid, PFUdA;
perfluoro-n -dodecanoic acid, PFDoA; sodium perfluoro-1-hexanesulfonate, L-
PFHxS; sodium perfluoro-1-octanesulfonate, L-PFOS) were used to obtain the
standard curve.
Analysis was performed using LC/MS/MS (Agilent 1200 series, Agilent 1200
Series 6410 Triple Quad LC/MS, USA) with a sample volume of 30μL. Sample
separation was achieved in the Zorbax Eclipse plus C8 column (2.1x 100mm, 3.5
micron), using a mobile phase of 10 mM ammonium acetate/water (v/v) at a flow
rate of 0.25 mL/min. The gradient profile was as follows: a linear increase from
40% to 90% acetonitrile (ACN) solution in 0-5.5 min, held at 90% for 4 min, then
held at 100% for 1min. PFCs were quantitatively analyzed by single mass mode
using characteristic ions at m/z.
Quality control/quality assurance
The limit of detection (LOD) was determined as the concentration of an individual
PFCs detected in a sample with a signal-to-noise ratio of 3. The concentrations of
PFCs in the method blank were less than the LOD. All the results were expressed
as per one fourth of air filter.
Risk assessment
Inhalation exposure (Einhal, pg/day) was calculated as publised previously (Shoeib
et. al., 2011). EInhal= Cair x V air x F uptake fraction .Where Cair is the concentrations of
PFCs (pg/m3) in PM2.5, V air is the volume inhaled (m
3/day).

74
Experimental animal and PFOS dosing
ICR mice were purchased and acclimatized for one week before experiment. The
mice were breed and ascertained of mating by the sperm positive vaginal smear of
the females. The mice were divided into 4 groups including a control and 3 PFOS-
treated groups, housed in polypropylene cages with sterilized bedding. The
treatment was started on gestational day 0.5 (GD 0.5) through GD 17. PFOS
(98% purity, sigma Aldrich) was dissolved in DMSO (<0.4%) and the exposed
groups were orally administered with 0, 0.3, 1 and 3 mg/kg/day PFOS. The
animals were maintained in a controlled temperature (24°C) and light (12h/12h
light-dark cycles) and given with standards foods (LabDiet, 5001Roden Diet) and
water ad libitum. On GD 17, pregnant mice were sacrificed by cervical dislocation
and fetal livers were collected. Total RNA was prepared for library construction,
followed by RNA sequencing using the MiSeq platform according to the
manufacturer’s protocols. All experimental animals were maintained according to
the guidelines and regulations of HKBU. The workflow of this study is shown in
Figure 4.1.

75
Fig 4.1. A flow diagram illustrates the experimental procedure for RNA sequencing,
including PFOS exposure, sample collection, library construction, transcriptome
sequencing, global gene expression analysis and pathway analysis.

76
RNA preparation, cDNA synthesis and real-time PCR quantification
RNA isolation was conducted as previously described (Wan et. al., 2012).
Concentration of RNA was measured using a Nanodrop 1000 Spectrophotometer
(Thermo Scientific, USA). The quality of RNA with A260/A280 ratio of between
1.7 and 1.9 was used. For the cDNA synthesis, High Capacity RNA-to-cDNA
Master Mix and 100 ng of total RNA was used in the reaction (Applied
Biosystems, Foster City, CA).
RNA Isolation, cDNA Library Construction and Illumina Deep Sequencing
Total RNA was isolated from GD17 fetal liver using TRIzol reagent (Life
Technologies, CA, USA). The RNA concentration was measured using Qubit®
RNA Assay Kit in Qubit® 2.0 Flurometer (Life Technologies, CA, USA). RNA
samples (300 ng) with RNA Integrity Number (RIN) greater than 8, as determined by
the Agilent 2100 Bioanalyzer system, was used for library construction (Agilent
Technologies, CA, USA). Four independent cDNA libraries were prepared for RNA
sequencing using the TruSeq Stranded mRNA LT Sample Prep Kit (Illumina, San
Diego, USA) following manufacturer’s recommendation. Index codes were ligated
and used as identification for individual samples. Firstly, mRNA was purified from
the total RNA using poly-T oligo-attached magnetic beads (Illumina, San Diego,
USA), followed by fragmentation using divalent cations. First strand cDNAs was
synthesized using random oligonucleotides and SuperScript II. Then second strand
cDNA was synthesized using DNA polymerase I and RNase H. Overhangs were
blunted by using exonuclease/polymerase, followed by 3/ end adenylation and
ligation using Illumina PE adapter oligonucleotides. DNA fragments with adaptor
molecules were enriched by 15 cycles of PCR reaction. The libraries were then
purified using the AMPure XP magnetic bead system and were quantified using the
Agilent Bioanalyzer 2100 system. Before subjected to sequencing, the libraries were
normalized and pooled together in a single lane on an Illumina MiSeq platform.
Working principal of illumine MiSeq platform is illustrated in Figure 4.2.

77
Step1: Sample
preparation
Step2: Library
construction
Step3: Cluster
generation
Step4:
Sequencing
Attach DNA to flow cell
Fig 4.2. A schematic flowchart shows the working principal of using Illumina MiSeq
platform.
Bridge
amplification
Cluster
formation

78
Paired-end reads, each of 151 bp read-length, were sequenced. Adapters, reads
containing poly-N were first trimmed and the sequence-reads were dynamically
trimmed according to BWA's− q algorithm (Li & Durbin, 2009). All the
downstream analyses were based on quality trimmed reads.
Differential expression and GO enrichment analysis
Sequencing reads were mapped to mouse reference genome (GRCm38/mm10)
using Novoalign v3.00.05 with parameter–r to report all multi-mapped reads
(http://www.novocraft.com/). Alignment files were parsed via Samtools. Briefly,
the number of reads mapping to each transcript in each sample were summarized
generate a count table (Li, et. al, 2012). Read count data were then subjected to
differential expression analysis using the edge R package (Robinson et. al., 2010).
Samples with identical treatment were considered as biological replicate. B&H
corrected p-value <0.05 &|log2 (fold change)| >1.5 was set as the threshold for the
determination of significant differential expression. Expression in terms of TMM-
normalized-FPKM of transcripts were obtained independently using RSEM
pipeline (Li & Dewey, 2011). Dysregulated genes were subjected to KEGG
pathway analysis in the Database for Annotation, Visualization and Integrated
Discovery (DAVID) Tools to decipher the deregulated molecular interaction
networks (Huang et. al., 2009a).
Verification of RNA-sequencing data by real time-PCR (RT-PCR)
Based on the results from the RNA-sequencing data, RT-PCR verification of
selected genes was conducted for the independent cohort of sample (n: 6).The
primer list was shown as Table 4.1.

79
Real-time PCR was conducted with a program that consisted of 3 min at 95 °C
followed by 40 cycles of 95 °C for 15 s, 56 °C for 20 s and 72 °C for 30 s.
StepOne Real-time PCR system using SYBR Green Master mix (Applied
Biosystems) was used for the quantification of cDNAs from samples. Data
normalization was performed using the transcript levels of mouse actin.
Cell culture and treatment
Mouse primary liver cells (AML-12) were cultured in DMEM high glucose
medium supplemented with 10% FBS (HyClone, Perbio, Thermo Fisher
Scientific, Carmlington, UK) and antibiotics (50U/ml penicillin and 50μg/ml
streptomycin) (Invitrogen, CA, USA).
Reactive Oxygen Species (ROS) assay
ROS was measured as described previously (Law et. al., 2012). AML-12 cells
were seeded at the density of 0.5 x 10⁴ in triplicate into 96-well plate. After 24h of
an incubation period, the cells were incubated with 10mM H2DCF-DA (Molecular
Probes, Invitrogen) for 1 hour followed by 4 hours incubation with PFOS (100
and 400μM) and H2O2 (200μM) treatment (DMSO <0.005%). DCF fluorescence
was then measured at excitation 495 nm/emission 530 nm using the multi label
reader VICTOR X4.
Table 4.1 List of mouse primers used in this study
Primers Forward sequences Reverse sequences
Cyp2j6 CCCTCTACCCAGAAGTCCAA TTCTGGCCAATCACCCTATC
Cyp4a10 ATCTCCTTAATGACCCTAGACACTG GCCTGGAGGTAGGTCCTGTAA
Cyp2e1 CCAAAGAGAGGCACACTTCC TCAGAAAGGTAGGGTCAAAAGG
Cyp2e40 ATCTGGTTTTTGTGGGACA CATTGTCAATCTCTTCCTGGACT
Cyp4f16 GGATTGTTGACCCTGCATTT GGCTTCAGGAAGCGTAAAAA
Cyp4a31 CAACACATCTCTTTAATGACCCTAGA ATGGCCTGGAGGTAGGTCTT
Cyp4a14 GATGGAGTCAGGGCAGTC AGCCAGAGACAAAAGCAGGTA

80
Statistical analysis
Statistical evaluations were conducted by SPSS 16.0. Student’s t-test was
performed to test the level of significances (p< 0.05) of the tested genes.
4.3 Results and Discussion
PFC concentrations in the PM2.5 samples from China.
Air filters were collected from the five cities in southern (HK, GZ and XM) and
northern (XA and BJ) China. The weights of PM2.5 collected on the filters were
measured (Fig 4.3A). The weights of PM2.5 per m3 air collected in the northern
cities of China were approximately 4 times higher than that of the southern cities,
weighted in average of 228g and 50g respectively. The concentrations of PFCs
in PM2.5 per m3 air flow of the five selected cities were shown in Fig 4.3B and
details were listed in Table 4.2.
Among the 9 measured PFC compounds, the levels of PFHxS in all the samples
were below the limit of detection. The other 8 PFCs (PFOS, PFDoA, PFUdA,
PFDA, PFNA, PFOA, PFHxA and PFBA) were detected in the samples from GZ,
XM, XA and BJ, while PFDoA was not found in the HK samples (Fig. 4.4A-E).
Total PFC concentrations calculated by the summation of all PFC compounds,
ranged from 121.2 to 192.2pg/m3, leading by GZ, followed by XA, BJ, XM and
HK. The levels of PFCs detected in this study, were relatively higher than
previous studies on PFOS contamination in ambient air from Japan (Sugita et.
al.2007; Harada et. al., 2005; Sasaki et. al., 2003).
PFOS was the most abundant species among the 9 PFCs measured with the
highest concentrations detected in most sampling sites ranging from 28.25- 99.4
pg/m3. However, its levels were found to be noticeable higher (> 72pg/m
3) in the
northern cities (XA and BJ) versus in all the three southern cites (< 65pg/m3 air).
In this study PFOS, PFHxA, PFBA and PFOA were predominantly measured in 5
sampling cities reflecting the very low volatility of these compounds. Gewurtz et
al. 2009 reported ionic PFCs in the indoor window film in Toronto with a profile

81
dominated by PFOA, PFDA, PFNA, and PFOS which is consistent with our
findings.
A
B
42.91
68.32
39.92
232.44 223.98
0.00
50.00
100.00
150.00
200.00
250.00
300.00
HK GZ XM BJ XA
Wei
gh
t (μ
g/m
3 a
ir)
121.21
192.28
139.06 156.97
172.41
0
50
100
150
200
250
HK GZ XM BJ XAConce
ntr
atio
ns
of
tota
l P
FC
s
(pg/m
3 a
ir)
Fig 4.3. The weights of PM2.5 dust in air filters and the mean concentrations
of total PFCs in each sampling site.
A

82
Table 4.2 Total concentrations (pg/m3) of PFCs and the average concentrations of
inhalation exposure (ng/day).
PFCs HK GZ XM BJ XA
Con
(pg/m3)
Inhala
tion
expos
ure
(ng/
day)
Con
(pg/m3)
Inhal
ation
expo
sure
(ng/
day)
Con
(pg/m3)
Inhalat
ion
exposu
re(ng/
day
Con
(pg/m3)
Inhala
tion
expos
ure(ng
/day
Con
(pg/m3)
Inhala
tion
expos
ure(ng
/
day
PFOS 99.45 1.59 72.39 1.15 28.25 0 74.77 1 70.78 1
PFHxS 0 0 0 0 0.00 0 0.00 0 0.00 0
PFDoA 0 0 0.36 0.00 0.33 0 1.90 0 0.36 0
PFUdA 0.84 0.01 0.36 0.00 0.41 0 2.00 0 0.43 0
PFDA 0.60 0.00 0.69 0.01 0.79 0 1.31 0 0.42 0
PFNA 2.28 0.03 2.646 0.04 2.78 0 3.96 0 3.21 0
PFOA 3.89 0.06 11.73 0.18 16.81 0 14.05 0 4.52 0
PFHxA 3.01 0.04 16.84 0.26 18.96 0 27.66 0 49.32 1
PFBA 11.12 0.17 87.23 1.39 70.72 1 31.32 1 43.37 1
Total 121.2 1.93 192.28 3.07 139.06 2 156.97 3 172.41 3

83
PFOS exhibited the highest concentration in HK with an average mean of
99.45pg/m3 which comprised 82% of the total PFC content while PFHxA, PFBA
and PFOA exhibited 49, 87 and 16.81pg/m3 respectively for XA, GZ and XM
(Fig.4.5A).
PFCs concentrations of samples from northern China (164.69 pg/m3) were
higher than that from the southern cities (150.8 pg/m3), showing the less severe
pollution in the southern cities. As we do not have any direct evidence in terms of
the sources of PFCs, it is believed that the traffic density (Sasaki et. al., 2003)
might be responsible for the PFC contamination levels in the northern cities. Other
possible sources of PFC emission can be found in fire extinguishers and industrial
products. It was reported that PFOS was one of the ingredients in fire
extinguishing media (Moody et. al., 2003). In addition, Teflon contained PFOA is
widely used in paint sealant coating, oil additives and grease manufacturing
purposes (Harada et. al., 2005).

84
PAHs concentrations of samples from northern China were at least 10 times
Fig 4.4. The concentrations of PFC congers in different cities. (A) PFOS and PFBA were the
most abundantly PFCs detected in HK samples while PFHxS, PFDoA, PFUdA, and PFDA
were found below the LOD. (B) In GZ, PFBA and PFOS were found to be the major PFC
congeners. (C) In XM, PFBA exhibited the highest concentration followed by PFOS, PFHxA,
PFOA, and PFNA. (D) In BJ, PFOS was most abundantly found while other PFCs were
detected at relatively low concentrations. (E) In XA, PFOS, PFHxA, and PFBA were the most
abundantly found PFCs. Error bars represents standard deviation.
0
50
100
150
200
250
Co
nce
ntr
atio
n (
pg/
m3 )
HK
020406080
100120
PFO
S
PFH
xS
PFD
oA
PFU
dA
PFD
A
PFN
A
PFO
A
PFH
xA
PFB
A
Co
nce
ntr
atio
n (
pg/
m3 )
GZ
0.00
20.00
40.00
60.00
80.00
100.00
120.00
Co
nce
ntr
atio
n (
pg/
m3)
XM
0.00
20.00
40.00
60.00
80.00
100.00
120.00
140.00
160.00
Co
nce
ntr
ati
on
(p
g/m
3)
BJ
0.00
50.00
100.00
150.00
PFOS PFHxS PFDoA PFUdA PFDA PFNA PFOA PFHxA PFBA
Co
nce
ntr
atio
n (
pg/
m3 )
XA
A
C D
E
B

85
PFCs compositions in different cities of China.
HK
PFOS exhibited the highest concentration in HK with an average mean of
99.45pg/m3 which constituted 82% of the total PFC content. Among the other
PFCs, PFBA (11.12 pg/m3), PFHxA (3pg/m
3), PFOA (3.89 pg/m
3) and PFNA
(2.28pg/m3) were also dominant which constituted 9.17, 3.21, 2.48 and 1.88% of
the total PFC content respectively while PFHxS and PFDoA were found below
the limit of detection (LOD) (Table 4.2; Fig. 4.4A).
GZ
In GZ, PM2.5 samples were dominant with PFBA (87.23 pg/m3) which formed
45% of the total PFC content. In contrast, PFOS (72.39 pg/m3), PFHxA (16.84
pg/m3) and PFOA (11.3 pg/m
3) were detected at 37.65, 8.76, 6.10% of total PFC
content respectively (Table 4.2; Fig. 4.4B).
XM
In XM, PFBA (70.71pg/m3) exhibited the highest concentration followed by
PFOS (28.25 pg/m3), PFHxA (18.96 pg/m
3), PFOA (16.81 pg/m
3) and PFNA
(2.77pg/m3) respectively. Among the PFC compounds, PFBA and PFOS
consituted 50.58 and 20.31% of the total PFC content respectively (Table 4.2; Fig.
4.4C).

86
Fig 4.5. A comparison of the average concentrations and human inhalation
exposure of PFCs. (A) PFOS, PFOA, PFBA and PFHxA were abundantly found
in PM2.5 samples. (B) The inhalation exposure data from different cities.
0
50
100
150
200
250
PFOS PFHxS PFDoA PFUdA PFDA PFNA PFOA PFHxA PFBA
Co
nce
ntr
ati
on
(p
g/m
3 a
ir)
Comparison of citywise abundance of PFCs in PM2.5
samples
HK GZ XM BJ XA
0
0.5
1
1.5
2
2.5
3
3.5
HK GZ XM BJ XA
Inh
ala
tion
exp
osu
re (
ng/d
ay)
Inhalation exposure of PFCs in adults based on
concentrations
(A)
(B)

87
BJ
Among the PFCs, PFOS (74.76 pg/m3) was most abundantly found in BJ while
other PFCs were detected at relatively low abundance with PFHxS below the
LOD. Among the PFC compounds, PFOS (74.76 pg/m3), PFBA (31.31pg/m
3),
PFHxA (27.65pg/m3) and PFOA were the dominant congeners contributing to
47.6, 19.9, 17.6 and 12.08 % of the total PFC content respectively (Table 4.2; Fig.
4.4D).
XA
In XA, PFOS exhibited the highest concentration (99.45pg/m3) which constituted
41% of the total PFC content. PFBA (43.36 pg/m3), PFNA (3.21pg/m
3) and PFOA
(4.52 pg/m3) were also detected in the samples with PFHxS below the LOD
(Table 4.2; Fig. 4.4E).
These data altogether suggested that the determination of PFCs in the PM2.5
samples allowed us to estimate human exposure risk (Sasaki et.al. 2003). Recent
studies indicated that men showed a higher exposure risk to PFOS as compared to
women (Yeung et. al., 2008). More importantly the detection of PFOS in
umbilical cord blood suggests fetal exposure risk (Calafat et al., 2006a; Calafat et
al., 2006b) to PFOS via maternal blood circulation.
Human exposure to PFCs by inhalation.
An adult male inhale 20m3 of air daily (Arrieta et al., 2003), thus to estimate the
inhalation exposure, we multiplied the PFCs concentrations with the volume of air
inhaled. Accordingly, the daily intake was estimated to be 1.93, 3.07, 2, 3, and 3
ng/day for HK, GZ, XM, BJ and XA respectively (Fig. 4.5B). Among the PFCs,
PFOS was the dominant inhaled compound representing 1.59, 1.15, 1 and 1ng/day
exposure for HK, GZ, BJ and XA while PFOA was inhaled at 0.06, 0.18ng/day in
HK, GZ respectively (Table 4.2).
A study in Canada reported the dietary intake of 110ng/day for PFOS and
70ng/day for PFOA (Tittlemier et. al., 2007). In our study, we estimated that the
intake of total PFCs by inhalation represented about 91% (HK), 41% (GZ), 37%

88
(BJ) and 37% (XA) for PFOS and for PFOA 2% (HK) and 4% (GZ) of the
Canadian dietary contribution. But another study reported (Shoeib et. al., 2011)
28% of the PFCs intake by inhalation of the Canadian dietary contribution. In this
study, the daily intakes of PFOS in Chinese cities were higher compared to that of
10 and 100 pg/day inhalation exposure of Fukuchiyama city and Oyamazaki town
of Japan (Sasaki et.al. 2003) respectively. Published data suggested that PFOS
through inhalation was little compare to drinking water (Harada et. al., 2003;
Sasaki et. al., 2003). Thus, human exposure to PFCs via inhalation suggests that a
continuous exposure of PFCs could increase body burden to levels that would
result in adverse health outcomes (ATSDR 2009). Therefore, in our subsequent
investigation, we focused on PFOS to determine its adverse health effects in
animal offspring.

89
4.4 RNA-Sequencing Revealed A Disruption Of Hepatic Fatty Acid
Metabolism In Prenatal PFOS-exposed Mouse Fetal Liver.
Illumina RNA-Seq.
We obtained 6.36, 6.01, 7.37, and 6.06 million quality trimmed Illumina reads for
the control and treatment groups 0.3, 1, and 3 mg/kg/day of PFOS respectively, to
give the total clean bases of 0.94 Gb for the control group, 0.89 Gb for the low dose
and 1.09 Gb for the medium dose and 0.90 Gb for the high dose treatment groups
(Table 4. 3).
Gene expression and differential gene expression.
In the comparison of transcriptome data among the control group and PFOS-
treatment groups, a total of 2084 genes were identified to be differentially expressed
(B&H corrected p-value <0.05 & |log2 (fold change)|>1.5). These included 719 up
and 1365 down differentially expressed genes in the PFOS-treatment groups as
compared to the control group (Table 4.3). The differentially expressed genes were
further analysed according to GO functional enrichment analysis. The top five
pathways involved in molecular functions, included metal ion binding, protein
tyrosine kinase activity, protein binding, heme binding and monooxygenase activity
(Fig. 4.6). In “biological process”, it included metabolic process, protein
phosphorylation, oxidation-reduction process, angiogenesis, acyl-CoA metabolic
process (Fig. 4.7).

90
Table 4.3 Summary of the sequencing results
Control Low Medium High
Category Measure Reverse Forward Reverse Forward Reverse Forward Reverse Forward
Raw Reads count 3484717 3484717 3317085 3317085 3935207 3935207 3319617 3319717
Base 5238164
97
5244835
15
4982872
43
4991129
49
5899327
53
5919435
22
4985307
74
4995390
76
Quality
trimmed
Reads count 3180724 3180724 3003986 3003986 3685395 3685395 3028350 3028350
Base 4730711
68
4711959
51
4471037
09
4452170
05
5469249
78
5468620
15
4500951
74
4492179
27
Mapping
GRCm
38
% mapped 99.37 99.44 99.51 99.34
No. uniquely
mapped
77.41 82.64 78.13 77.41
Total genes differentially
expressed
2084
Total up regulated genes 719
Total down regulated genes 1365

91
0 20 40 60 80 100 120
antibiotic transporter activity (MF)
non-membrane spanning protein tyrosine kinase activity (MF)
carboxylesterase activity (MF)
oxidoreductase activity, acting on paired donors, with
incorporation or reduction of molecular oxygen (MF)
electron carrier activity (MF)
heme binding (MF)
protein tyrosine kinase activity (MF)
monooxygenase activity (MF)
transferase activity, transferring phosphorus-containing groups
(MF)
protein kinase activity (MF)
catalytic activity (MF)
oxidoreductase activity (MF)
kinase activity (MF)
nucleic acid binding (MF)
ATP binding (MF)
transferase activity (MF)
hydrolase activity (MF)
nucleotide binding (MF)
protein binding (MF)
metal ion binding (MF)
Fig 4.6. Enrichment analysis of Gene Ontology Molecular Functions
(X-axis indicates the molecular functions of the genes) . Top 20 pathways

92
0 10 20 30 40 50 60 70 80
antibiotic transport (BP)
glomerular filtration (BP)
regulation of systemic arterial blood pressure by renin-
angiotensin (BP)
positive regulation of complement activation (BP)
threonine biosynthetic process (BP)
linoleic acid metabolic process (BP)
cellular response to mechanical stimulus (BP)
oligopeptide transport (BP)
long-chain fatty acid metabolic process (BP)
drug transmembrane transport (BP)
regulation of Rab GTPase activity (BP)
acyl-CoA metabolic process (BP)
protein complex assembly (BP)
positive regulation of angiogenesis (BP)
angiogenesis (BP)
protein phosphorylation (BP)
oxidation-reduction process (BP)
phosphorylation (BP)
transport (BP)
metabolic process (BP)
Fig 4.7. Enrichment analysis of Gene Ontology Biological Process (X-axis
indicates the biological process). Top 20 pathways

93
KEGG pathway analysis.
All the activated genes were subjected to Kyoto Encyclopedia of Genes and
Genomes (KEGG) analysis. Our results highlighted that prenatal exposure to PFOS
caused the deregulation of different metabolic pathways (Fig. 4.8 A). Among those,
we found an induction of a subset of genes involving in fatty acid metabolic
pathways including PPAR signaling pathway, arachidonic acid, retinol and linoleic
acid metabolisms in the fetal livers (Fig. 4.8 B). The genes and their functions in
fatty acid metabolism were highlighted and shown in Table 4.4.
Effects of PFOS on arachidonic acid metabolism.
Cyp2j5, Cyp4a10, Cyp2e1, Cyp2b9, Cyp2c40, Cyp4f16, Cyp4a31 and cyp4a14
associated with arachidonic metabolism, were found to be elevated in the livers of
fetus exposed to PFOS (Fig. 4.8B). Arachidonic metabolism is known to be
responsible for the fatty acid metabolism and the synthesis of prostaglandins
(PGs) and leukotrienes (LTs). LTs and PGs are pro-inflammatory mediators
involved in the inflammatory cascade in asthmatic airways (Wenzel et.al., 1997).
Inflammatory responses can result in the induction of cytokines and chemokines,
leading to the progression of liver fibrosis through actions on hepatic stellate cells
(Marra, 2002). Taken together, our data suggested that the prenatal exposure to
PFOS stimulated arachidonic acid pathways to drive a variety of inflammatory
signals which may result in an initiation of liver fibrosis.

94
Symbol Gene name Biological functions
Cyp2e1 Cytochrome P450, family 2,
subfamily E, polypeptide 1
Fatty acid metabolism; steroid
metabolism
Cyp2j6 Cytochrome P450, family 2,
subfamily b, polypeptide 6
(Cyp2b10)
Fatty acid metabolism; electron
transport
Cyp2c40 Cytochrome P450, family 2,
subfamily E, polypeptide 40
Metabolized arachidonic acid to
signaling molecules
Cyp4a10 Cytochrome P450, family 2,
subfamily A, polypeptide 10
Metabolized arachidonic acid to
signaling molecules
Cyp4a14 Cytochrome P450, family 4,
subfamily A, polypeptide 14
Fatty acid metabolism; omega
hydroxylation and beta oxidation,
marker gene for PPAR-alpha
activation
Ehhadh Enoyl-Coenzyme A,
hydratase (L-bifunctional
protein)
Fatty acid beta-oxidation
Slc27a1 Solute carrier family 27,
member 1 (FATP1)
Fatty acid metabolism, lipid
transport
Fabp1 Fatty acid binding protein 1,
liver
Fatty acid metabolism; steroid
metabolism
Table 4.4 Lists of up regulated genes with their gene names and biological functions

95
0 2 4 6 8 10 12
Pantothenate and CoA biosynthesis
Linoleic acid metabolism
Steroid hormone biosynthesis
Drug metabolism - other enzymes
Peroxisome
PPAR signaling pathway
Arachidonic acid metabolism
Drug metabolism - cytochrome P450
Metabolism of xenobiotics by cytochrome P450
Vascular smooth muscle contraction
Retinol metabolism
Purine metabolism
Enrichment analysis of KEGG pathways
Fig 4.8. (A) Enrichment analysis of KEGG pathways. (B) The schematic diagram showing
the genes altered by prenatal PFOS exposure are related to fatty acid metabolism.
(A)
(B)

96
Effects of PFOS on PPAR signaling pathway.
In our study, genes related to peroxisome proliferator-activated receptor (PPPAR)
signaling pathway including Ehhadh, fabp1, cyp8b1, cyp4a10, cyp4a31, Slc27a1,
cyp4a14 were found to be induced in the livers of fetus exposed to PFOS (Fig.
4.8B). The up-regulated genes included genes associated with peroxisomal beta
oxidation (Ehhadh) and fatty acid transport (Slc27a1and fabp1). Slc27a1 is a
membrane bound fatty acid transporter while Fabp1 is synthesized for the
intracellular transport of fatty acids. In addition, our data demonstrated a
significantly induction of cyp4a14 which is a marker for PPAR-α activation. The
PPAR-α signaling was found to directly regulate the process of inflammation
(Corton et al., 1998; Cuzzocrea et al., 2006).
PPARs belong to nuclear hormone receptor super family and mainly consisted
of three nuclear receptor isoforms, PPAR-α, PPAR-γ and PPAR-δ. PPARs are
ligand-activated transcription factors. PPAR forms a heterodimer with the retinoid
X receptor (RXR) (Tan et.al, 2005; Tien et. al., 2006). The endogenous ligand for
RXR is 9-cis-retinoic acid and RXR is a partner for several other nuclear receptors
(retinoic acid receptor, thyroid hormone receptor, and vitamin D receptor). Upon
ligand binding, conformational changes in the protein structure occurs and
recruitment of co-activators/co-factors to PPAR-RXR heterodimer activates
transcription (Zoete et. al., 2007; Tan et.al, 2005; Tien et. al., 2006). PPAR-α
plays an important role in the peroxisome proliferation, but PPAR-γ and PPAR-δ
are not involved in peroxisome proliferation (Peters et al., 2005). It was reported
that PPARs bind to endogenous ligands to regulate genes involved in different
biological processes including lipid and glucose metabolism and transport. Thus,
the receptors play a pivotal role to maintain metabolic homeostasis. Different
pathogenesis including atherosclerosis, inflammation, cancer, infertility, and
demyelination were found to relate to PPAR-signaling (Berger & Moller, 2002).
Thus, ligands for the PPARs were recognized for the treatment of various diseases
including dyslipidemias and cardiovascular risk (Plutzky, 2000; Linton and Fazio,
2000).

97
Effects of PFOS on retinol metabolism.
The prenatal PFOS exposure also induced a group of genes that are associated
with retinol metabolism including Aldh1a7, cyp3a25, cyp4a10, cyp2b9, Ugt2b36,
cyp2c40, cyp3a44, cyp3a11, cyp4a31 and cyp4a14 (Fig. 4.8B). Our results
demonstrated an induction of Aldh1a7, which is an oxidoreductase that catalyzed
the biosynthesis of the two retinoic acid (RA) receptor ligands, 9-cis-retinoic acid
and all-trans-retinoic acid. Retinols (vitamin A) are fat soluble and is essential for
vision, growth and differentiation of many cell types during embryonic
development as well as in adult tissues (Blomhoff and Wake, 1991). Retinol
regulates metabolism by activating specific nuclear receptors such as retinoic acid
receptor (RAR) and the retinoid X receptor (RXR). 9-cis-retinoic acid is a high-
affinity ligand for RXR (Heyman et.al., 1992; Levin et.al., 1992), its activation
lead to heterodimerization with nuclear receptors including CAR, FXR, LXR,
PPAR (Plutzky, 2011) .
Liver is a major storage site for vitamin A (Blomhoff and Wake, 1991). But
excess vitamins A in liver would initiate a pathologic liver condition including
lysosomal labilization with enzyme release to increase cytolysosomes and
mitochondrial swelling (with “filamentous” inclusions) (Hruban, et.al., 1974;
Hathcock et. al., 1990). Liver fibrosis can be resulted from diverse forms of acute
injury or inflammation. It was reported that the fibrotic lesion in liver may be
derived from a superfluous hepatic storage of retinol (Blomhoff and Wake, 1991).
Moreover a study of hypervitaminosis A (diseases caused by excess vitamin A) in
liver defined an advanced hepatic fibrosis involving intra-acinar, portal and
periportal zones with nodular regeneration (i.e., cirrhosis) in humans (Jacques
et.al., 1979). This observation was further supported by a report from Seifert et al.
(1989) to demonstrate that a high intake of retinol (37.5 mg/kg body weight twice
a week for 4 week) increased liver fibrosis in rats. Therefore, our data suggested
that the prenatal exposure of PFOS induce the over-production of retinol that may
increase the risk of liver fibrosis in fetus.

98
0
50
100
150
200
250
Solvent control PFOS-100uM PFOS-400uM H202 200uM
DC
F f
luore
scen
ce
*
*
* *
0
5
10
15
20
25
CYP4A10 CYP4A14 CYP2j6 CYP4A31 CYP2e1 CYP2e40 CYP4f16
Rel
ati
ve
gen
e ex
pre
ssio
n l
evel
s RT-PCR validation of some selected genes of RNA sequencing using
mouse fetal liver samples collected at GD=17
Control High treatment dose
(A)
Fig 4.9. (A) Validation of some selected RNAseq-identified genes using mouse fetal liver
samples collected at E=17. (B) Significant ROS formation was found in AML-12 cultured
with PFOS. H2O2 was used as a positive control. Asterisks (*) indicates the statistical
significant (p< 0.05) difference between the control and treatment groups.
(B)

99
Verification of some selected RNA-sequencing transcripts.
To investigate the pro-inflammatory responses caused by PFOS in fetal liver, a
number of selected up regulated-genes involved in linoleic acid and arachidonic
acid metabolism were validated by qRT-PCR analysis. The primer sequences were
listed in Table 4.1. The results of qRT-PCR analysis demonstrated an increased in
all the tested genes, although there is no significant difference (Fig. 4.9A).
PFOS induces oxidative stress in in vitro.
Oxidative stress is resulted from the imbalance between antioxidant and reactive
oxygen species (ROS) in cells. In vitro studies on primary culture of tilapia
hepatocytes demonstrated that PFOS and PFOA exposure are able to produce
oxidative stress and induce apoptosis in liver (Liu et. al., 2007c). In an attempt to
test whether PFOS exposure caused oxidative stress in mouse liver mouse primary
cell line, AML-12 was used. We exposed the AML-12 cells to PFOS (100μM -
400μM) for 4 h, followed by the measurement of ROS activity. We found a
significant induction of ROS activity in the PFOS treated cells as compared to the
control group, suggesting PFOS exposure induced oxidative stress in livers (Fig.
4.9B).
4.5 Conclusion
Exposure to PFOS during gestation altered total 2084 genes in fetal livers. This
set of genes was involved in 1) fatty acid metabolism (arachidonic acid, linoleic
acid and retinol metabolism) through the activation of PPAR-α and 2) pro-
inflammation in fetal liver. Taken together, our results indicated that prenatal
exposure of PFOS caused perturbations to fatty liver metabolism and might provoke
lifelong effects on fatty acid metabolism. In future studies, both transcriptomic and
metabolomics profiling are necessary to provide a better understanding on the
adverse effects of prenatal exposure of PFOS on fetal livers.

100
CHAPTER 5
PRENATAL EXPOSURE TO PFOS INDUCED THE RISK OF
PANCREATITIS IN OFFSPRING
5.1 Introduction
In chapter four, we demonstrated the disorder of fatty acid metabolism associated
with prenatal PFOS exposure in the liver of mouse fetus using high throughput
transcriptomic deep sequencing. Besides the liver, pancreas is another major organ
which is important for fatty acid metabolism. In this chapter, we examined the
changes in protein expressions in fetal pancreas using high-throughput isobaric tag
for relative and absolute quantitation (iTRAQ) labeling technique to provide insight
into the molecular mechanisms underlying the adverse effects of the prenatal PFOS
exposure.
Proteins are important functional molecules in different cellular processes. Changes
protein expression induced by environmental pollutants might reveal the clues to the
underlying mechanisms and information about biomarkers to indicate the exposure in
disease susceptibility (Benninghoff, 2007; Colquhoun et. al., 2009) A number of
studies were conducted to unravel the possible mechanisms of PFOS-induced toxicity
in mice. But almost all of them share common objectives to make feasible the protein
expression mechanism. The use of a conventional 2-DE proteomic technique could
capture only a few numbers of proteins. The separation efficiency of 2-DE is low
when the proteins are at high molecular mass, isoelectric point, or hydrophobic
character. In addition, low abundance proteins are difficult to be identified because
of the low sensitivity of 2-DE (Nesatyy et. al., 2007). On the contrary, the
determination of the global protein changes using high-throughput iTRAQ labeling
quantitative proteomic technique coupled with LTQ-Orbitrap can help to perform
reliably quantifiable pathway analysis (Wang and You et. al., 2012).
The working principle of the iTRAQ approach is the use of a set of at least four
isobaric reagents to differentially label the amide linkages of peptides, prepared from

101
different biological samples (Ross, et al., 2004). In LC-MS/MS, differentially labeled
peptides appear as single peaks in MS scans. When iTRAQ-tagged peptides are
subjected to MS/MS analysis, the mass balancing carbonyl moiety is released to
liberate isotope-encoded reporter ions that provide relative quantitative information
on protein levels.
In this study, pregnant mice were orally dosed with PFOS. On gestational day 17
(GD-17), the mice were sacrificed by cervical dislocation and the pancreatic
rudiments were collected to investigate the protein expression profiles using iTRAQ
techniques. The workflow of this study is shown in Fig 5.1. The results of iTRAQ
technique followed by gene ontology analysis suggested that prenatal exposure of
PFOS caused changes in proteins involved in functions of pancreatic secretion,
protein digestion and absorption, protein processing in endoplasmic reticulum, fat
digestion and absorption, glycerolipid metabolism and steroid biosynthesis.
5.2 Materials and Methods
Experimental animals and treatments
ICR mice were purchased and acclimatized for one week before the experiment. The
mice were bred and ascertained of mating by checking the presence of vaginal
smears. The pregnant mice were then divided into 4 groups and housed in
polypropylene cages with sterilized bedding. On gestational 0.5 (GD 0.5), the dams
(one control and 3 PFOS exposed groups) were treated through GD 17.
PFOS (98% purity, sigma Aldrich) was dissolved in DMSO (<0.4%) and the PFOS-
exposed groups were orally administered with 0, 0.3, 1 and 3 mg/kg/day PFOS. The
animals were maintained at a controlled temperature (24°C) and 12 h/12h light-dark
cycles and given with standard foods (LabDiet, 5001Roden Diet) and water ad
libitum. On GD 17, pregnant mice were sacrificed by cervical dislocation and fetal
pancreas were collected for proteomic analysis using the technique “isobaric tag for
relative and absolute quantitation (iTRAQ)” coupled with the LTQ-Orbitrap, a high

102
resolution mass spectrometer. All experimental animals were maintained according to
the guidelines and regulations of HKBU.
Protein extraction
The protein extraction was performed as previously described (Tse et. al., 2013).
Pancreatic tissue from each group was homogenized in an extraction buffer
consisting of 8 M urea and 40 mM HEPES at pH 7.4 respectively. The homogenates
were then sonicated and centrifuged at 15,000 g for 10 min. 2D clean-up kit (Bio-
Rad) and RC-DC Protein Assay Kit (Bio-Rad) were used for purification and
determination of protein concentrations respectively.
iTRAQ labeling
The iTRAQ labeling was performed on the basis of a published protocol (Tse et.al.,
2013; Zhang et. al., 2010b) with slight modifications. Briefly, 5 mM tris carboxyethyl
phosphine hydrochloride (TCEP) was added into 200 μg of protein sample incubated
for 60 min at 37 °C to facilitate the process of chemical reduction, then was followed
by alkylation with 10 mM methyl methane thiosulfonate (MMTS) for 20 min at room
temperature. The samples were then diluted by seven fold with 50 mM
triethylammonium bicarbonate (TEAB). For digestion, the sequencing grade trypsin
(Promega) was added into the protein samples in 1:50 trypsin-to-protein mass-ratio
and kept at 37 °C for 16 h. The digests were desalted and dried using Sep-Pak C18
cartridges (Waters) and SpeedVac (Eppendorf). Peptides from pancreatic samples of
control, low, medium and high dosed groups were labeled with the iTRAQ reporter
114, 115, 116 and 17 respectively. A strong cation exchange fractionation of peptide
mixture was carried out as described (Zhang et. al., 2010b). The collected fractions
were desalted followed by the reconstitution of dried fractions in 30μl of 0.1% formic
acid.
LC-MS/MS analysis
LTQ-Orbitrap (Velos, Thermo Electron, Germany) coupled with an Easy-nLC
(Proxeon, Germany) was used for analysis of the samples. The LC-MS/MS was

103
performed as previously described (Tse et. al., 2013). Briefly, for each analysis, 10 μl
of peptide sample was used for analysis followed by two phases with a different
gradient of solvents in a C18 capillary column (Michrom Bioresources, USA). The
mobile phases A was 0.1% formic acid in water and the mobile phase B was 0.1%
formic acid in acetonitrile. The system was run in a linear gradient: 0-5 minutes of
100% A, after 5 minutes mobile phase was increased from 0-30%, held for 50
minutes. After 50 minutes, mobile phase B was increased from 30-80% and held for
10 minutes, followed by a final run at 100%A for 10 minutes. The full Mass
Spectrometry (MS) scan was obtained in a profile mode with resolution of 30,000 and
ion resolution time 2s. The fragmentation was achieved by ions with multiple charges
in a high-energy collision-induced dissociation (HCD) in C-trap and collision-
induced dissociation (CID) in LTQ. The other parameters were adjusted followed by
Tse et. al. (2013).
Protein identification & quantification
The protein identification and quantification was performed according to a standard
protocol (Tse et.al, 2013). The obtained HCD and CID were subjected to Proteome
Discoverer 1.0 (Thermo Fisher Scientific) to generate the MASCOT generic files
(mgf). The normalized mgf files of three replicates were submitted through
MASCOT (version 2.3.02) to search the protein database. In order to maintain the
false discovery rate, FDR at both peptides and protein levels of less than 1%, cut-off
scores were dynamically assigned to each dataset. Proteins containing at least two
spectra were used for quantification.
According to manufacturer's instructions isotope impurity of iTRAQ, was corrected
and any dissimilar ratios between any two iTRAQ reporters (e.g. 115/114 over 100)
were removed in this analysis. Normalization of the peptide-iTRAQ reporter intensity
was performed to make sure that they were all 1. Based on the total intensity of the
assigned peptides, protein quantification was made using a python script followed by
statistical analysis (Student's t-test).

104
Pancreas samples
from E=17
Protein extraction
followed by
enzymatic digestion
iTRAQ labeling and
MS analysis Control
Control group
(0 mg/kg/day)
Low treatment group
(0.3 mg/kg/day)
Medium treatment group
(1 mg/kg/day)
High treatment group
(3 mg/kg/day)
Low Medium High
Quantification of
Ctrl vs Low
Quantification of Ctrl
vs Medium
Quantification of Ctrl
vs High
Low dose treatment group
showed a highly dissimilar
pattern of protein expressions
as compared to medium and
high dose treatment groups
58 proteins
up
regulated
50 proteins
up
regulated
25 proteins
down
regulated
62 proteins
down
regulated
17 overlapped up-regulated
proteins in mid and high doses
2 overlapped down regulated
proteins in mid and high doses
Enrichment analysis of GO
Biological process, Molecular
function and KEGG pathway
Fig 5.1. General work flow and summary of the present study. The study applied proteomic
approaches to identify the differentially expressed proteins in the mouse pancreas in response to
exposure with different prenatal doses of PFOS. (Modified from the model proposed by Tse et.
al., (2013). In our study, 4-5 pregnant mice were sacrificed from each group.
19 proteins
up
regulated
11 proteins
down
regulated

105
5.3 Results and Discussion
Identification and quantification of pancreas proteome.
In order to investigate the expression changes of pancreatic proteins associated with
prenatal PFOS exposure in mice, high-throughput iTRAQ labeling quantitative
proteomic technology was conducted. After labeling the protein samples with
iTRAQ reagents, the samples were subjected to LCMS/MS analysis. The HCD and
CID data obtained from MASCOT generic files were combined to match the protein
profile identified in each treatment group. We then compared the 3 treatment groups
(low, medium and high) to determine the commonly dysregulated proteins in
response to prenatal PFOS exposure. We found dissimilar patterns of protein profiles
detected from low to high dose treatment (similarity <1%). But, we observed a
number of dysregulated proteins commonly identified in the medium and high dose
treatments (Fig. 5.2). A total of 176 proteins exhibited differential expression in
medium and high dose treatment groups (Table 5.1-5.4). Among them, a total of 91
differentially up-regulated proteins were identified in medium and high dose groups
with 17 proteins overlapped including chymotrypsin-like elastase family members
(Cel A1, Cel 2A & Cel 3B), Serpin I2, PRSS3, bile salt-activated lipase (BAL),
protein disulfide isomerase (PDI) and carboxypeptidases. On the other hand, 85
down-regulated proteins were identified with 2 overlapped proteins, such as Retinol-
binding protein and large neutral amino acids transporter small subunit 1. Then we
focused on the function of the commonly up-regulated proteins using gene
enrichment analysis of GO biological process, molecular function and KEGG
pathway. The list of pathway analysis is summarized in Table 5.5.

106
Fig 5.2. The diagram showing the number of up and down regulated as well as overlapped protein
expression in mouse pancreas in response to medium and high doses of PFOS.

107
Accession Name
1
sp|Q8BP67|RL24_MOUSE
60S ribosomal protein L24 OS=Mus musculus
GN=Rpl24 PE=2 SV=2
2
sp|P62242|RS8_MOUSE
40S ribosomal protein S8 OS=Mus musculus
GN=Rps8 PE=1 SV=2
3
sp|P14148|RL7_MOUSE
60S ribosomal protein L7 OS=Mus musculus
GN=Rpl7 PE=2 SV=2
4
sp|P47963|RL13_MOUSE
60S ribosomal protein L13 OS=Mus musculus
GN=Rpl13 PE=2 SV=3
5
sp|Q9D8E6|RL4_MOUSE
60S ribosomal protein L4 OS=Mus musculus
GN=Rpl4 PE=1 SV=3
6
sp|P47911|RL6_MOUSE
60S ribosomal protein L6 OS=Mus musculus
GN=Rpl6 PE=1 SV=3
7
sp|P61255|RL26_MOUSE
60S ribosomal protein L26 OS=Mus musculus
GN=Rpl26 PE=2 SV=1
8
sp|P62918|RL8_MOUSE
60S ribosomal protein L8 OS=Mus musculus
GN=Rpl8 PE=2 SV=2
9
sp|P19253|RL13A_MOUSE
60S ribosomal protein L13a OS=Mus musculus
GN=Rpl13a PE=1 SV=4
10
sp|Q9D1R9|RL34_MOUSE
60S ribosomal protein L34 OS=Mus musculus
GN=Rpl34 PE=3 SV=2
11
sp|Q9CR57|RL14_MOUSE
60S ribosomal protein L14 OS=Mus musculus
GN=Rpl14 PE=2 SV=3
Table 5.1 Lists of differentially expressed up regulated proteins in medium treatment dose

108
12
sp|P62754|RS6_MOUSE
40S ribosomal protein S6 OS=Mus musculus
GN=Rps6 PE=1 SV=1
13
sp|Q6ZWV3|RL10_MOUSE
60S ribosomal protein L10 OS=Mus musculus
GN=Rpl10 PE=2 SV=3
14
sp|Q6ZWN5|RS9_MOUSE
40S ribosomal protein S9 OS=Mus musculus
GN=Rps9 PE=2 SV=3
15
sp|Q91X79|CELA1_MOUSE
Chymotrypsin-like elastase family member 1
OS=Mus musculus GN=Cela1 PE=2 SV=1
16
sp|Q8K0C5|ZG16_MOUSE
Zymogen granule membrane protein 16
OS=Mus musculus GN=Zg16 PE=2 SV=1
17 tr|Q9CPN9|Q9CPN9_MOUSE Protein 2210010C04Rik OS=Mus musculus
GN=2210010C04Rik PE=2 SV=1
18
sp|Q504N0|CBPA2_MOUSE
Carboxypeptidase A2 OS=Mus musculus
GN=Cpa2 PE=2 SV=1
19
sp|Q7TPZ8|CBPA1_MOUSE
Carboxypeptidase A1 OS=Mus musculus
GN=Cpa1 PE=2 SV=1
20
sp|Q64285|CEL_MOUSE
Bile salt-activated lipase OS=Mus musculus
GN=Cel PE=1 SV=1
21
tr|B2RS76|B2RS76_MOUSE
Carboxypeptidase B1 (Tissue) OS=Mus
musculus GN=Cpb1 PE=2 SV=1
22
sp|P05208|CEL2A_MOUSE
Chymotrypsin-like elastase family member 2A
OS=Mus musculus GN=Cela2a PE=2 SV=1
23
sp|P02089|HBB2_MOUSE
Hemoglobin subunit beta-2 OS=Mus musculus
GN=Hbb-b2 PE=1 SV=2

109
24
sp|P27659|RL3_MOUSE
60S ribosomal protein L3 OS=Mus musculus
GN=Rpl3 PE=2 SV=3
25
sp|P15864|H12_MOUSE
Histone H1.2 OS=Mus musculus GN=Hist1h1c
PE=1 SV=2
26
sp|P62849|RS24_MOUSE
40S ribosomal protein S24 OS=Mus musculus
GN=Rps24 PE=1 SV=1
27
tr|Q792Z0|Q792Z0_MOUSE
Protein Prss3 OS=Mus musculus GN=Prss3
PE=3 SV=1
28
sp|P62717|RL18A_MOUSE
60S ribosomal protein L18a OS=Mus musculus
GN=Rpl18a PE=1 SV=1
29
sp|P62806|H4_MOUSE
Histone H4 OS=Mus musculus GN=Hist1h4a
PE=1 SV=2
30
sp|P14115|RL27A_MOUSE
60S ribosomal protein L27a OS=Mus musculus
GN=Rpl27a PE=2 SV=5
31 tr|Q9CQM8|Q9CQM8_MOUS
E
60S ribosomal protein L21 OS=Mus musculus
GN=Rpl21 PE=2 SV=1
32
sp|Q9D2R4|TMD11_MOUSE
Transmembrane emp24 domain-containing
protein 11 OS=Mus musculus GN=Tmed11
PE=2 SV=1
33
sp|P62900|RL31_MOUSE
60S ribosomal protein L31 OS=Mus musculus
GN=Rpl31 PE=2 SV=1
34
sp|P47962|RL5_MOUSE
60S ribosomal protein L5 OS=Mus musculus
GN=Rpl5 PE=1 SV=3
35 tr|Q4VBW7|Q4VBW7_MOUS
E
Pancreatic lipase-related protein 2 OS=Mus
musculus GN=Pnliprp2 PE=2 SV=1

110
36
sp|P43137|LIT1_MOUSE
Lithostathine-1 OS=Mus musculus GN=Reg1
PE=2 SV=1
37
sp|P61358|RL27_MOUSE
60S ribosomal protein L27 OS=Mus musculus
GN=Rpl27 PE=2 SV=2
38
sp|P35980|RL18_MOUSE
60S ribosomal protein L18 OS=Mus musculus
GN=Rpl18 PE=2 SV=3
39
tr|L7N202|L7N202_MOUSE
Uncharacterized protein OS=Mus musculus
GN=Gm16477 PE=4 SV=1
40
sp|Q9JK88|SPI2_MOUSE
Serpin I2 OS=Mus musculus GN=Serpini2
PE=1 SV=1
41
sp|P06467|HBAZ_MOUSE
Hemoglobin subunit zeta OS=Mus musculus
GN=Hbz PE=2 SV=2
42
sp|D3Z6P0|PDIA2_MOUSE
Protein disulfide-isomerase A2 OS=Mus
musculus GN=Pdia2 PE=1 SV=1
43
sp|Q9CQ52|CEL3B_MOUSE
Chymotrypsin-like elastase family member 3B
OS=Mus musculus GN=Cela3b PE=2 SV=1
44
sp|P43274|H14_MOUSE
Histone H1.4 OS=Mus musculus GN=Hist1h1e
PE=1 SV=2
45
sp|P62281|RS11_MOUSE
40S ribosomal protein S11 OS=Mus musculus
GN=Rps11 PE=2 SV=3
46
tr|G3X8R0|G3X8R0_MOUSE
Receptor accessory protein 5, isoform CRA_a
OS=Mus musculus GN=Reep5 PE=4 SV=1
47
sp|Q9EQU5-2|SET_MOUSE
Isoform 2 of Protein SET OS=Mus musculus
GN=Set

111
48
tr|D3Z6C3|D3Z6C3_MOUSE
40S ribosomal protein S3a OS=Mus musculus
GN=Rps3a2 PE=3 SV=1
49
sp|P04444|HBBZ_MOUSE
Hemoglobin subunit beta-H1 OS=Mus musculus
GN=Hbb-bh1 PE=2 SV=3
50
sp|P09103|PDIA1_MOUSE
Protein disulfide-isomerase OS=Mus musculus
GN=P4hb PE=1 SV=2
51
sp|P02535-3|K1C10_MOUSE
Isoform 3 of Keratin, type I cytoskeletal 10
OS=Mus musculus GN=Krt10
52
tr|Q9D8L3|Q9D8L3_MOUSE
Signal sequence receptor, delta OS=Mus
musculus GN=Ssr4 PE=2 SV=1
53
sp|P62301|RS13_MOUSE
40S ribosomal protein S13 OS=Mus musculus
GN=Rps13 PE=1 SV=2
54
tr|E9QAZ2|E9QAZ2_MOUSE
Ribosomal protein L15 OS=Mus musculus
GN=Gm10020 PE=3 SV=1
55
tr|Q5XJF6|Q5XJF6_MOUSE
Ribosomal protein OS=Mus musculus
GN=Rpl10a PE=2 SV=1
56
sp|P84228|H32_MOUSE
Histone H3.2 OS=Mus musculus GN=Hist1h3b
PE=1 SV=2
57 tr|Q6ZWZ4|Q6ZWZ4_MOUS
E
60S ribosomal protein L36 OS=Mus musculus
GN=Rpl36 PE=3 SV=1
58
sp|P63325|RS10_MOUSE
40S ribosomal protein S10 OS=Mus musculus
GN=Rps10 PE=1 SV=1

112
Accession Name
1
sp|Q6ZWY8|TYB10_MOUSE
Thymosin beta-10 OS=Mus musculus
GN=Tmsb10 PE=2 SV=3
2
sp|Q9Z127|LAT1_MOUSE
Large neutral amino acids transporter small
subunit 1 OS=Mus musculus GN=Slc7a5 PE=1
SV=2
3
sp|P31001|DESM_MOUSE
Desmin OS=Mus musculus GN=Des PE=1
SV=3
4
sp|Q4VAA2|CDV3_MOUSE
Protein CDV3 OS=Mus musculus GN=Cdv3
PE=1 SV=2
5
tr|Q497J0|Q497J0_MOUSE
MCG130175, isoform CRA_b OS=Mus
musculus GN=BC100530 PE=4 SV=1
6
sp|P20152|VIME_MOUSE
Vimentin OS=Mus musculus GN=Vim PE=1
SV=3
7
sp|Q9CY02|AHSP_MOUSE
Alpha-hemoglobin-stabilizing protein OS=Mus
musculus GN=Ahsp PE=2 SV=1
8
sp|Q9CPU0|LGUL_MOUSE
Lactoylglutathione lyase OS=Mus musculus
GN=Glo1 PE=1 SV=3
9
tr|H7BX95|H7BX95_MOUSE
Serine/arginine-rich-splicing factor 1 OS=Mus
musculus GN=Srsf1 PE=2 SV=1
10
sp|Q9CQ60|6PGL_MOUSE
6-phosphogluconolactonase OS=Mus musculus
GN=Pgls PE=2 SV=1
Table 5.2. Lists of differentially expressed down regulated proteins in medium treatment dose

113
11
sp|O70400|PDLI1_MOUSE
PDZ and LIM domain protein 1 OS=Mus
musculus GN=Pdlim1 PE=2 SV=4
12
sp|Q9D3D9|ATPD_MOUSE
ATP synthase subunit delta, mitochondrial
OS=Mus musculus GN=Atp5d PE=1 SV=1
13
sp|Q06770|CBG_MOUSE
Corticosteroid-binding globulin OS=Mus
musculus GN=Serpina6 PE=1 SV=1
14
tr|Q8C6G3|Q8C6G3_MOUSE
Ribonuclease pancreatic OS=Mus musculus
GN=Rnase1 PE=2 SV=1
15
tr|H7BWY6|H7BWY6_MOUSE
Retinol-binding protein 4 OS=Mus musculus
GN=Rbp4 PE=2 SV=1
16
sp|Q60598|SRC8_MOUSE
Src substrate cortactin OS=Mus musculus
GN=Cttn PE=1 SV=2
17
sp|P37889-2|FBLN2_MOUSE
Isoform 2 of Fibulin-2 OS=Mus musculus
GN=Fbln2
18
sp|Q9DAW9|CNN3_MOUSE
Calponin-3 OS=Mus musculus GN=Cnn3 PE=2
SV=1
19
sp|P97825|HN1_MOUSE
Hematological and neurological expressed 1
protein OS=Mus musculus GN=Hn1 PE=1
SV=3
20
sp|P48428|TBCA_MOUSE
Tubulin-specific chaperone A OS=Mus
musculus GN=Tbca PE=2 SV=3
21
sp|Q91XV3|BASP1_MOUSE
Brain acid soluble protein 1 OS=Mus musculus
GN=Basp1 PE=1 SV=3
22
sp|O88207|CO5A1_MOUSE
Collagen alpha-1(V) chain OS=Mus musculus
GN=Col5a1 PE=2 SV=2

114
23
sp|Q3U962|CO5A2_MOUSE
Collagen alpha-2(V) chain OS=Mus musculus
GN=Col5a2 PE=1 SV=1
24
sp|Q9CQ45|NENF_MOUSE
Neudesin OS=Mus musculus GN=Nenf PE=1
SV=1
25
tr|O08692|O08692_MOUSE
Myeloid bactenecin (F1) OS=Mus musculus
GN=Ngp PE=2 SV=1

115
Accession Name
1
sp|Q06890|CLUS_MOUSE
Clusterin OS=Mus musculus GN=Clu PE=1
SV=1
2
tr|E9PZF0|E9PZF0_MOUSE
Nucleoside diphosphate kinase OS=Mus
musculus GN=Gm20390 PE=2 SV=1
3
sp|P15947|KLK1_MOUSE
Kallikrein-1 OS=Mus musculus GN=Klk1 PE=1
SV=3
4
sp|Q93092|TALDO_MOUSE
Transaldolase OS=Mus musculus GN=Taldo1
PE=1 SV=2
5
sp|Q91X79|CELA1_MOUSE
Chymotrypsin-like elastase family member 1
OS=Mus musculus GN=Cela1 PE=2 SV=1
6
tr|G5E8N5|G5E8N5_MOUSE
L-lactate dehydrogenase OS=Mus musculus
GN=Ldha PE=3 SV=1
7
sp|Q9CQC2|COL_MOUSE
Colipase OS=Mus musculus GN=Clps PE=2
SV=1
8
sp|Q6ZWY8|TYB10_MOUSE
Thymosin beta-10 OS=Mus musculus
GN=Tmsb10 PE=2 SV=3
9
sp|Q8K0C5|ZG16_MOUSE
Zymogen granule membrane protein 16
OS=Mus musculus GN=Zg16 PE=2 SV=1
10
sp|Q9JK88|SPI2_MOUSE
Serpin I2 OS=Mus musculus GN=Serpini2 PE=1
SV=1
11 tr|Q9ER05|Q9ER05_MOUSE Chymopasin OS=Mus musculus GN=Ctrl PE=2
Table 5.3. Lists of differentially expressed up regulated proteins in high dose treatment

116
SV=1
12
tr|Q9CPN9|Q9CPN9_MOUSE
Protein 2210010C04Rik OS=Mus musculus
GN=2210010C04Rik PE=2 SV=1
13
sp|Q00623|APOA1_MOUSE
Apolipoprotein A-I OS=Mus musculus
GN=Apoa1 PE=1 SV=2
14
sp|P17742|PPIA_MOUSE
Peptidyl-prolyl cis-trans isomerase A OS=Mus
musculus GN=Ppia PE=1 SV=2
15
sp|Q504N0|CBPA2_MOUSE
Carboxypeptidase A2 OS=Mus musculus
GN=Cpa2 PE=2 SV=1
16
sp|P06728|APOA4_MOUSE
Apolipoprotein A-IV OS=Mus musculus
GN=Apoa4 PE=2 SV=3
17
sp|P06467|HBAZ_MOUSE
Hemoglobin subunit zeta OS=Mus musculus
GN=Hbz PE=2 SV=2
18
tr|Q9CR49|Q9CR49_MOUSE
Hemoglobin Y, beta-like embryonic chain
OS=Mus musculus GN=Hbb-y PE=2 SV=1
19
sp|D3Z6P0|PDIA2_MOUSE
Protein disulfide-isomerase A2 OS=Mus
musculus GN=Pdia2 PE=1 SV=1
20
sp|P08228|SODC_MOUSE
Superoxide dismutase [Cu-Zn] OS=Mus
musculus GN=Sod1 PE=1 SV=2
21
sp|P08226|APOE_MOUSE
Apolipoprotein E OS=Mus musculus GN=Apoe
PE=1 SV=2
22
sp|P07146|TRY2_MOUSE
Anionic trypsin-2 OS=Mus musculus GN=Prss2
PE=2 SV=1
23 sp|Q7TPZ8|CBPA1_MOUSE Carboxypeptidase A1 OS=Mus musculus

117
GN=Cpa1 PE=2 SV=1
24
sp|Q9CQ52|CEL3B_MOUSE
Chymotrypsin-like elastase family member 3B
OS=Mus musculus GN=Cela3b PE=2 SV=1
25
sp|Q64285|CEL_MOUSE
Bile salt-activated lipase OS=Mus musculus
GN=Cel PE=1 SV=1
26
tr|B2RS76|B2RS76_MOUSE
Carboxypeptidase B1 (Tissue) OS=Mus
musculus GN=Cpb1 PE=2 SV=1
27
sp|P02088|HBB1_MOUSE
Hemoglobin subunit beta-1 OS=Mus musculus
GN=Hbb-b1 PE=1 SV=2
28
sp|P05208|CEL2A_MOUSE
Chymotrypsin-like elastase family member 2A
OS=Mus musculus GN=Cela2a PE=2 SV=1
29
sp|Q3SYP2|CTRC_MOUSE
Chymotrypsin-C OS=Mus musculus GN=Ctrc
PE=2 SV=1
30
sp|P02089|HBB2_MOUSE
Hemoglobin subunit beta-2 OS=Mus musculus
GN=Hbb-b2 PE=1 SV=2
31
sp|Q9CQZ1|HSBP1_MOUSE
Heat shock factor-binding protein 1 OS=Mus
musculus GN=Hsbp1 PE=2 SV=1
32
sp|Q9D154|ILEUA_MOUSE
Leukocyte elastase inhibitor A OS=Mus
musculus GN=Serpinb1a PE=1 SV=1
33
sp|Q00915|RET1_MOUSE
Retinol-binding protein 1 OS=Mus musculus
GN=Rbp1 PE=2 SV=2
34
sp|P62082|RS7_MOUSE
40S ribosomal protein S7 OS=Mus musculus
GN=Rps7 PE=2 SV=1
35 sp|P01867|IGG2B_MOUSE Ig gamma-2B chain C region OS=Mus musculus

118
GN=Igh-3 PE=1 SV=3
36
sp|P29595|NEDD8_MOUSE
NEDD8 OS=Mus musculus GN=Nedd8 PE=1
SV=2
37
sp|Q06770|CBG_MOUSE
Corticosteroid-binding globulin OS=Mus
musculus GN=Serpina6 PE=1 SV=1
38
sp|P24369|PPIB_MOUSE
Peptidyl-prolyl cis-trans isomerase B OS=Mus
musculus GN=Ppib PE=2 SV=2
39
tr|Q8C6G3|Q8C6G3_MOUSE
Ribonuclease pancreatic OS=Mus musculus
GN=Rnase1 PE=2 SV=1
40
sp|P56480|ATPB_MOUSE
ATP synthase subunit beta, mitochondrial
OS=Mus musculus GN=Atp5b PE=1 SV=2
41
sp|P20029|GRP78_MOUSE
78 kDa glucose-regulated protein OS=Mus
musculus GN=Hspa5 PE=1 SV=3
42
sp|P55095|GLUC_MOUSE
Glucagon OS=Mus musculus GN=Gcg PE=1
SV=1
43
sp|P04444|HBBZ_MOUSE
Hemoglobin subunit beta-H1 OS=Mus musculus
GN=Hbb-bh1 PE=2 SV=3
44
sp|P09103|PDIA1_MOUSE
Protein disulfide-isomerase OS=Mus musculus
GN=P4hb PE=1 SV=2
45
tr|Q792Z0|Q792Z0_MOUSE
Protein Prss3 OS=Mus musculus GN=Prss3
PE=3 SV=1
46
sp|P02802|MT1_MOUSE
Metallothionein-1 OS=Mus musculus GN=Mt1
PE=1 SV=1
47 sp|P02535-3|K1C10_MOUSE Isoform 3 of Keratin, type I cytoskeletal 10

119
OS=Mus musculus GN=Krt10
48
sp|P21107-2|TPM3_MOUSE
Isoform 2 of Tropomyosin alpha-3 chain
OS=Mus musculus GN=Tpm3
49
sp|P20065|TYB4_MOUSE
Thymosin beta-4 OS=Mus musculus
GN=Tmsb4x PE=1 SV=1
50
sp|P07309|TTHY_MOUSE
Transthyretin OS=Mus musculus GN=Ttr PE=1
SV=1

120
Accession Name
1
sp|P46978|STT3A_MOUSE
Dolichyl-diphosphooligosaccharide--protein
glycosyltransferase subunit STT3A OS=Mus
musculus GN=Stt3a PE=1 SV=1
2
tr|A8DUK4|A8DUK4_MOUSE
Beta-globin OS=Mus musculus GN=Hbbt1
PE=4 SV=1
3
sp|Q8BP67|RL24_MOUSE
60S ribosomal protein L24 OS=Mus musculus
GN=Rpl24 PE=2 SV=2
4
tr|Q6ZWZ7|Q6ZWZ7_MOUSE
60S ribosomal protein L17 OS=Mus musculus
GN=Rpl17 PE=2 SV=1
5
sp|P62242|RS8_MOUSE
40S ribosomal protein S8 OS=Mus musculus
GN=Rps8 PE=1 SV=2
6
sp|P14148|RL7_MOUSE
60S ribosomal protein L7 OS=Mus musculus
GN=Rpl7 PE=2 SV=2
7
sp|P47963|RL13_MOUSE
60S ribosomal protein L13 OS=Mus musculus
GN=Rpl13 PE=2 SV=3
8
sp|Q9D8E6|RL4_MOUSE
60S ribosomal protein L4 OS=Mus musculus
GN=Rpl4 PE=1 SV=3
9
sp|Q9CZS1|AL1B1_MOUSE
Aldehyde dehydrogenase X, mitochondrial
OS=Mus musculus GN=Aldh1b1 PE=2 SV=1
10
sp|P47911|RL6_MOUSE
60S ribosomal protein L6 OS=Mus musculus
GN=Rpl6 PE=1 SV=3
11
sp|P61255|RL26_MOUSE
60S ribosomal protein L26 OS=Mus musculus
GN=Rpl26 PE=2 SV=1
Table 5.4. Lists of differentially expressed down regulated proteins in high treatment dose

121
12
sp|P61358|RL27_MOUSE
60S ribosomal protein L27 OS=Mus musculus
GN=Rpl27 PE=2 SV=2
13
sp|P62918|RL8_MOUSE
60S ribosomal protein L8 OS=Mus musculus
GN=Rpl8 PE=2 SV=2
14
sp|P35980|RL18_MOUSE
60S ribosomal protein L18 OS=Mus musculus
GN=Rpl18 PE=2 SV=3
15
sp|P19253|RL13A_MOUSE
60S ribosomal protein L13a OS=Mus musculus
GN=Rpl13a PE=1 SV=4
16
sp|Q9D1R9|RL34_MOUSE
60S ribosomal protein L34 OS=Mus musculus
GN=Rpl34 PE=3 SV=2
17
sp|P61620|S61A1_MOUSE
Protein transport protein Sec61 subunit alpha
isoform 1 OS=Mus musculus GN=Sec61a1
PE=2 SV=2
18
sp|Q9DCF9|SSRG_MOUSE
Translocon-associated protein subunit gamma
OS=Mus musculus GN=Ssr3 PE=1 SV=1
19
sp|Q9CR57|RL14_MOUSE
60S ribosomal protein L14 OS=Mus musculus
GN=Rpl14 PE=2 SV=3
20
sp|P62754|RS6_MOUSE
40S ribosomal protein S6 OS=Mus musculus
GN=Rps6 PE=1 SV=1
21
sp|P35564|CALX_MOUSE
Calnexin OS=Mus musculus GN=Canx PE=1
SV=1
22
sp|P62301|RS13_MOUSE
40S ribosomal protein S13 OS=Mus musculus
GN=Rps13 PE=1 SV=2
23
sp|Q6ZWV3|RL10_MOUSE
60S ribosomal protein L10 OS=Mus musculus
GN=Rpl10 PE=2 SV=3

122
24
sp|Q6ZWN5|RS9_MOUSE
40S ribosomal protein S9 OS=Mus musculus
GN=Rps9 PE=2 SV=3
25
tr|L7N202|L7N202_MOUSE
Uncharacterized protein OS=Mus musculus
GN=Gm16477 PE=4 SV=1
26
sp|Q9D0F3|LMAN1_MOUSE
Protein ERGIC-53 OS=Mus musculus
GN=Lman1 PE=2 SV=1
27
sp|Q9D1D4|TMEDA_MOUSE
Transmembrane emp24 domain-containing
protein 10 OS=Mus musculus GN=Tmed10
PE=2 SV=1
28
sp|Q80UM7|MOGS_MOUSE
Mannosyl-oligosaccharide glucosidase
OS=Mus musculus GN=Mogs PE=2 SV=1
29
tr|E9PY58|E9PY58_MOUSE
Caseinolytic peptidase B protein homolog
OS=Mus musculus GN=Clpb PE=2 SV=1
30
sp|P70168|IMB1_MOUSE
Importin subunit beta-1 OS=Mus musculus
GN=Kpnb1 PE=1 SV=2
31
sp|O54734|OST48_MOUSE
Dolichyl-diphosphooligosaccharide--protein
glycosyltransferase 48 kDa subunit OS=Mus
musculus GN=Ddost PE=1 SV=2
32
sp|P27659|RL3_MOUSE
60S ribosomal protein L3 OS=Mus musculus
GN=Rpl3 PE=2 SV=3
33
tr|Q7JCZ1|Q7JCZ1_MOUSE
Cytochrome c oxidase subunit 2 OS=Mus
musculus GN=mt-Co2 PE=2 SV=1
34
sp|P12382|K6PL_MOUSE
6-phosphofructokinase, liver type OS=Mus
musculus GN=Pfkl PE=1 SV=4
35 sp|Q8VDN2|AT1A1_MOUSE Sodium/potassium-transporting ATPase subunit

123
alpha-1 OS=Mus musculus GN=Atp1a1 PE=1
SV=1
36
sp|P25206|MCM3_MOUSE
DNA replication licensing factor MCM3
OS=Mus musculus GN=Mcm3 PE=1 SV=2
37
sp|Q68FD5|CLH1_MOUSE
Clathrin heavy chain 1 OS=Mus musculus
GN=Cltc PE=1 SV=3
38
sp|Q9DCN2|NB5R3_MOUSE
NADH-cytochrome b5 reductase 3 OS=Mus
musculus GN=Cyb5r3 PE=1 SV=3
39
sp|P60229|EIF3E_MOUSE
Eukaryotic translation initiation factor 3 subunit
E OS=Mus musculus GN=Eif3e PE=1 SV=1
40
sp|P47915|RL29_MOUSE
60S ribosomal protein L29 OS=Mus musculus
GN=Rpl29 PE=2 SV=2
41
sp|P43274|H14_MOUSE
Histone H1.4 OS=Mus musculus GN=Hist1h1e
PE=1 SV=2
42
sp|P15864|H12_MOUSE
Histone H1.2 OS=Mus musculus GN=Hist1h1c
PE=1 SV=2
43
tr|H7BWY6|H7BWY6_MOUSE
Retinol-binding protein 4 OS=Mus musculus
GN=Rbp4 PE=2 SV=1
44
sp|Q7TPV4|MBB1A_MOUSE
Myb-binding protein 1A OS=Mus musculus
GN=Mybbp1a PE=1 SV=2
45
sp|Q9Z127|LAT1_MOUSE
Large neutral amino acids transporter small
subunit 1 OS=Mus musculus GN=Slc7a5 PE=1
SV=2
46
tr|E9QAZ2|E9QAZ2_MOUSE
Ribosomal protein L15 OS=Mus musculus
GN=Gm10020 PE=3 SV=1

124
47
sp|P43276|H15_MOUSE
Histone H1.5 OS=Mus musculus GN=Hist1h1b
PE=1 SV=2
48
sp|P10922|H10_MOUSE
Histone H1.0 OS=Mus musculus GN=H1f0
PE=2 SV=4
49
sp|Q9D8V0|HM13_MOUSE
Minor histocompatibility antigen H13 OS=Mus
musculus GN=Hm13 PE=1 SV=1
50
sp|Q99PV0|PRP8_MOUSE
Pre-mRNA-processing-splicing factor 8
OS=Mus musculus GN=Prpf8 PE=1 SV=2
51
sp|P62849|RS24_MOUSE
40S ribosomal protein S24 OS=Mus musculus
GN=Rps24 PE=1 SV=1
52
sp|P97449|AMPN_MOUSE
Aminopeptidase N OS=Mus musculus
GN=Anpep PE=1 SV=4
53
sp|Q6ZQI3|MLEC_MOUSE
Malectin OS=Mus musculus GN=Mlec PE=2
SV=2
54
sp|P84228|H32_MOUSE
Histone H3.2 OS=Mus musculus GN=Hist1h3b
PE=1 SV=2
55
sp|P14115|RL27A_MOUSE
60S ribosomal protein L27a OS=Mus musculus
GN=Rpl27a PE=2 SV=5
56
sp|Q7TPR4|ACTN1_MOUSE
Alpha-actinin-1 OS=Mus musculus GN=Actn1
PE=1 SV=1
57
sp|P41105|RL28_MOUSE
60S ribosomal protein L28 OS=Mus musculus
GN=Rpl28 PE=1 SV=2
58
sp|O88508|DNM3A_MOUSE
DNA (cytosine-5)-methyltransferase 3A
OS=Mus musculus GN=Dnmt3a PE=1 SV=2
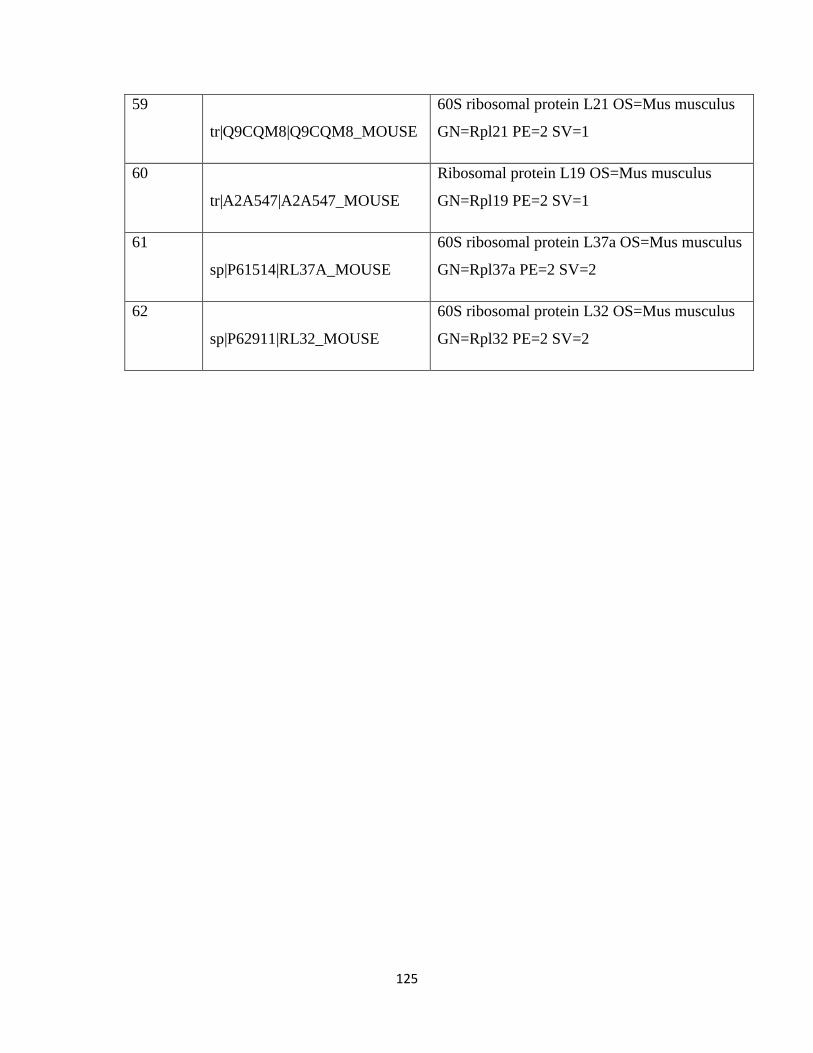
125
59
tr|Q9CQM8|Q9CQM8_MOUSE
60S ribosomal protein L21 OS=Mus musculus
GN=Rpl21 PE=2 SV=1
60
tr|A2A547|A2A547_MOUSE
Ribosomal protein L19 OS=Mus musculus
GN=Rpl19 PE=2 SV=1
61
sp|P61514|RL37A_MOUSE
60S ribosomal protein L37a OS=Mus musculus
GN=Rpl37a PE=2 SV=2
62
sp|P62911|RL32_MOUSE
60S ribosomal protein L32 OS=Mus musculus
GN=Rpl32 PE=2 SV=2

126
Table 5.5 Up regulated proteins annotated with name, Uni-port identity and
biological functions.
Protein name Uni port ID Functional description
Bile salt activated lipase (BAL) Q64285 Carboxylic ester hydrolase activity,
pancreatic juice secretion
Chymotrypsin like elastase family
member 2A (Cela 2A)
P05208 Serine hydrolase activity, establishment
of skin barrier
Carboxy peptidase A1(cpa1) Q7tpz8 Metallo- carboxypeptidase activity
Carboxy peptidase A2(cpa2) Q504N0 Metallo- carboxypeptidase activity
Protein disulfide isomerase (PDI) P09103 Protein disulfide isomerase activity
Enrichment analysis of Gene Ontology (GO) biological process.
We further examined the biological process enrichment analysis of the up-regulated
proteins based on GO terms using genecodis algorithm (reference cite PMID:
22573175, PMID: 19465387). Seventeen differentially proteins mapped to biological
process, with the majority of them involved in proteolysis (3/10), cell redox
homeostasis (2/10), oxygen transport (2/10), glycerol-ether metabolic process (2/10),
regulation of cell adhesion (1/10), erythrocyte maturation (1/10), cholesterol catabolic
process (1/10), pancreatic juice secretion (1/10), peptidyl-proline hydroxylation to 4-
hydroxy-L-proline (1/10) and ceramide catabolic process (1/10) (Fig 5.3A).

127
Enrichment analysis of GO molecular function.
GO analysis based on molecular functions showed that 17 (4/10) up-regulated
proteins were involved in the activities of hydroxylase (3/10), peptidase (2/10),
carboxypeptidase (2/10), metallocarboxy peptidase (2/10), protein disulfide oxido
reductase (2/10), protein disulfide isomerase (2/10), oxygen binding (2/10), oxygen
transporter (2/10), hemoglobin alpha binding (1/10), retinyl palmitate esterase (1/10),
sterol esterase (1/10) and exopeptidase (1/10) (Fig. 5.3B).
Enrichment analysis of Kyoto Encyclopedia of Genes and Genomes (KEGG)
pathways.
KEGG pathway analysis highlighted that prenatal exposure of PFOS might affect the
functions of the fetal pancreas, including pancreatic secretion (4/10), protein
digestion and absorption (3/10), protein processing in endoplasmic reticulum (1/10),
fat digestion and absorption (1/10), glycerolipid metabolism (1/10) and steroid
biosynthesis (1/10) pathways (Fig. 5.4).

128
A
Fig 5.3. Pie diagram showing the enrichment analysis of gene ontology of PFOS
responsive proteins in mice. (A) Proteolysis (3/10) is the dominant category in the
biological process. (B) Hydrolase activity (4/10) is the dominant molecular function
in GO assignment.
B

129
PFOS exposed fetal
mice pancreas
B
Pancreatic secretion
(BAL, Cpa1, Cpa2)
Protein digestion and
absorption (Cpa1, Cpa2)
Steroid biosynthesis (BAL)
Glycero lipid
metabolism (BAL)
Fat digestion and
absorption (BAL)
Protein processing in
endoplasmic reticulum
(PDI)
Fig 5.4. Enrichment analysis of KEGG pathways showing pancreatic secretion (4/10) is the dominant
pathway followed by protein digestion and absorption (3/10), protein processing in endoplasmic
reticulum (1/10) fat digestion and absorption (1/10), glycerolipid metabolism (1/10) and steroid
biosynthesis (1/10).
A

130
Chymotrypsin-like elastase family members (Elastase-1, Cela2A, Cela3B).
In the KEGG pathways analysis, we found that a number of dysregulated proteins
including Bile salt activated lipase (BAL), Chymotrypsin-like elastase family
member 3B (CELA3B), Carboxypeptidase A1 (Cpa1), and Carboxypeptidase A2
(Cpa2) are involved in pancreatic functions (Fig. 5.4B), such as pancreatic secretion,
fat digestion and absorption and glycerolipid metabolism.
Pancreas involved in secretion of digestive enzymes into small intestines to
hydrolysis protein to be absorbed by intestinal villus. Among the enzymes,
chymotrypsin and elastase are endopeptidases of serine protease family.
Chymotrypsin hydrolyses protein at the peptide (aromatic amino acids for example
tyrosine, tryptophan) level while elastase hydrolyses small amino acids (for example
glycine, serine, alanine) (Schmitz, 2004). Humans have six elastase genes
(Rosenbloom, 1984; Appelt et. al., 1988) which encode the structurally similar
proteins elastase 1, 2, 2A, 2B, 3A, and 3B. Elastase 3B is involved in intestinal
transport and metabolism of cholesterol. Generally elastase 3A and elastase 3B is
referred as elastase-1 (NCBI, 2015). The determination of major elastic like elements
in pancreatic juices may serve as a springboard for understanding the pancreatic
functions. For example, an excretion of elastase-1 protein in fecal materials is
frequently used as a measure of pancreatic function in clinical assays. In order to
measure the elastase concentrations in stool, monoclonal antibodies and an ELISA is
commercially available elsewhere in Europe (Gullo, et.al., 1999; Dominguez-Munoz
et.al., 1995; Amann, et.al., 1996). In the inflammation of the pancreas, pancreatic
elastase-1 (E1) is released into the bloodstream. Thus, the quantification of elastase-1
in serum allows diagnosis or exclusion of acute pancreatitis (Clavien et. al., 1989).
The concentration of elastase-1 was measured in patients with chronic pancreatitis
and those with non-pancreatic digestive diseases (Gullo et.al., 1999). Progressive use
of elastase-1 and its role in distinguishing between cystic fibrosis and pancreatic
inefficiencies is also recognized (Glasbrenner et. al., 2002). A study conducted with
cigarette smoke effects on mouse suggested that a set of pancreatic enzymes
including carboxypeptidase 1 (Cbp1), Chymotrypsin-like elastase (Cela3b) was

131
highly up-regulated in livers of ApoE-/- mice exposure to cigarette smoke (Leon et.
al., 2013), which is consistent with our findings.
Carboxypeptidases A1 and Carboxypeptidases A2.
The enzymes involved in the digestion of C-terminus peptide chains are called
carboxypeptidases. Carboxypeptidases are classified into A1 (Cpa1) and A2 (Cpa2),
A3, B1 and B2 (Whitcomb and Lowe, 2007). Cpa1 acts on terminal amino acid of a
target peptide whereas Cpa2 attack the basic amino acids (serine hydrolase activity).
The carboxypeptidase family and the elastase family are strongly associated with
microvascular endothelial cell dysfunction (Han et. al., 2010).
The carboxypeptidase enzymes are synthesized by proenzymes that are activated by
trypsin (Whitcomb and Lowe, 2007). But it was reported that premature activation of
trypsin in the pancreas causes the risk of acute pancreatitis (Whitcomb, 1999). Some
other studies showed that the proper regulation of protease enzymes can help to
prevent from digesting of body tissue, and activating inflammatory pathways
(Whitcomb and Lowe, 2007). In our iTRAQ results, the carboxypeptidase family
proteins (Cpa1 and Cpa2) were expressed in mouse pancreatic cells that can be used
as potential biomarkers to indicate pancreatic inflammation.
Serine protease inhibitor (Serpin I2).
Serine proteases are enzymes that cleave the peptide bonds in protein. One thousand
five hundred serpin sequences have been identified (Potempa et.al., 1994). Serpins
play important physiological roles in hormone transport, corticosteroid binding,
coagulation, and blood pressure regulation, tumor invasion and inflammation
(Silverman, 2001; Mignatti, and Rifkin, 1993). The use of SERPINs for identification
of diseases was suggested (Heit, 2013). Specifically, SERPINI2, as they have
unknown target may be involved in pancreatic dysfunction (Ozaki et. al., 1998). It is
expressed in the heart, plasma and platelets. But it was reported that serpin I2 is a
protein specific to the pancreas and to breast cancer stroma (Ozaki et.al., 1998; Xiao
et.al., 1999). The function of Serpin I2 is poorly understood, however, sequence

132
analysis suggested its role as a serine protease inhibitor in protein digestion and
absorption. Some other studies suggested that Serpin I2 deficiency directly results in
the apoptosis of acinar cell, mal-absorption, and malnutrition observed in pq/pq mice
(Loftus et. al., 2005).
Bile salt-Activated Lipase (BAL).
For the digestion of fat droplets, pancreas secretes lipase enzyme (Scheele et.al.,
1981) that requires bile salt for the activation Fat digestion by BAL occurs in the
small intestine (Iijima et. al., 1998; Wang and Hartsuck, 1993). BAL brokedown fats
by hydrolysis and make them absorbable by the intestinal lumen. But the activity of
the BAL is solely depended on bile salts released by the pancreas. In the human
infant, BAL is also presence in the breast milk (Alemi et. al., 1981; Wang et.al.,
1989). Thus, the copious supply of BAL in the mother's milk, in fact, show no
activity until it reaches the intestine where the bile salt is secreted. Therefore, these
evidences suggested that BAL is especially important for human infant nutrition
(Wang et. al., 1997).
Like other intestinal lipases BAL facilitated the hydrolytic activity for
triacylglycerol. Some other unique functions, for example hydrolytic activity of
cholesterol and vitamin A esters were reported (Lombardo, and Guy, 1980;
Fredrikzon et.al., 1978), highlighting the importance of BAL in human physiological
functions (Wang et. al., 1997). In laboratory experiment, BAL stimulated cholesterol
uptake in cultured cells (Lepez-Candales et.al., 1993). This observation was
supported by a transgenic mice study, in which reduced reduction of cholesterol
uptake was observed in BAL-knockout mice (Howles et. al., 1996). If pancreas stops
working or fails, the fat droplets cannot be hydrolysed, leading to steatorrhea
(DiMagno et.al., 1973) the presence of excessive fat in faces.

133
5.4 Conclusion
This study postulated that prenatal exposure to PFOS altered fetal pancreatic
functions. A total of 176 proteins exhibited differential expression in medium and
high dose treatment groups. Among them, a total of 91 differentially up-regulated
proteins were identified in the medium and high dose groups with 17 proteins
overlapped, including chymotrypsin-like elastase family members, Serpin I2, PRSS3,
bile salt-activated lipase (BAL), protein disulfide isomerase (PDI) and
carboxypeptidases. In the fetal pancreas, the effects of PFOS were noticeable in
affecting the expression of the proteins associated with hydroxylase activity,
peptidase activity, carboxypeptidase activity, metallocarboxy peptidase activity,
protein disulfide oxido reductase activity, protein disulfide isomerase activity, oxygen
binding, oxygen transporter activity, hemoglobin alpha binding, retinyl palmitate
esterase activity, sterol esterase activity and exopeptidase activity. The KEGG
pathway analysis showed that the differential expressed proteins are mainly involved
in pancreatic functions such as pancreatic secretion, fat digestion and absorption, and
glycerolipid metabolic pathways. From the literatures, we found some of the proteins,
for example, chymotrypsin-like elastase-1 is associated with inflammation, initial
cause for diseases progression. Apparently, we extrapolated that the excessive
secretion of some of the enzymes might provoke the inflammation in pancreas, thus
increased the risk of pancreatitis. Taken together, the results of the iTRAQ analysis
suggested that PFOS affected the expression levels of some pancreatic protein in
mice. The identification of BAL, SERPIN I2, elastase family member proteins
(elastase-1, Cela2A, cela3B) might be helpful for the diagnosis of PFOS exposure in
associated with pancreatitis. However, the possible role of PFOS in the risk of
pancreatitis may warrant further investigation.

134
References
Abbott, B. D. 2009. Review of the expression of peroxisome proliferator-activated
receptors alpha (PPARα), beta (PPARβ), and gamma (PPARγ) in rodent
and human development. Reproductive toxicology, 27(3), 246-257.
Adams, P. 2003. Presentation at the Conference ―Particulate Matter: Atmospheric
Sciences, Exposure, and the Fourth Colloquium on PM and Human
Health,‖ Pittsburgh, PA, March 31–April 4.
Akimoto, H. 2003. Global air quality and pollution. Science, 302(5651), 1716
1719.
Akyuz, M., Cabuk, H., 2008. Particle-associated polycyclic aromatic
hydrocarbons in the atmospheric environment of Zonguldak, Turkey. Sci
Total Environ 405, 62-70.
Alemi, B., Hamosh, M., Scanion, J.W., Salzman-Mann, C. and Hamosh, P. 1981.
Pediatrics 68, 484-489.
Alfaro-Moreno, E., Ponce-de-León, S., Osornio-Vargas, A. R., García-Cuellar,
C., Martínez, L., & Rosas, I. 2007. Potential toxic effects associated to
metals and endotoxin present in PM10: an ancillary study using
multivariate analysis. Inhalation toxicology, 19(S1), 49-53.
Allen, J., Bartlett, K., Graham, M., & Jackson, P. 2011. Ambient concentrations
of airborne endotoxin in two cities in the interior of British Columbia,
Canada. Journal of Environmental Monitoring, 13(3), 631-640.
Amann, S. T., Bishop, M., Curington, C., Toskes, P. P., 1996. Fecal pancreatic
elastase 1 is inaccurate in the diagnosis of chronic pancreatitis. Pancreas
13:226–230
Anderson, L. M., Diwan, B. A., Fear, N. T., Roman E. 2000. Critical windows of
exposure for children‘s health: cancer in human epidemiological studies
and neoplasms in experimental animal models. Environ Health
Perspect.108 (suppl 3):573–594.

135
Appelt, G., Schulze, B., Rogos, R., Kopperschlager, G., 1988. Analysis of human
exocrine pancreatic proteins by means of pore gradient polyacrylamide gel
electrophoresis. Biomed Biochim Acta 47:133–140
Arrieta, D. E., Ontiveros, C. C., Li, W. W., Garcia, J. H., Denison, M. S.,
McDonald, J. D., ... & Washburn, B. S. 2003. Aryl hydrocarbon receptor-
mediated activity of particulate organic matter from the Paso del Norte
airshed along the US-Mexico border. Environmental health perspectives,
111(10), 1299.
Asby, E., Anderson, M. 1982. The Politics of Clean Air, Oxford University Press,
Oxford.
Asian Correspondent, 2013. Record pollution levels reported at Beijing Culture
and Tourism City site. Retrieved on 15 January 2015 from
http://asiancorrespondent.com/95342/highest-pm2-5-level-reported-in-
beijing-culture-and-tourism-city/
ATSDR (Agency for Toxic Substance and Diseases Registry), 2009. Draft
toxicological profile for perfluoroalkyls.www.atsdr.cdc.gov/tox
profiles/tp200.pdf
Bachmann, J. D. 2003. Presentation at the Conference ―Particulate Matter:
Atmospheric Sciences, Exposure, and the Fourth Colloquium on PM and
Human Health,‖ Pittsburgh, PA, March 31–April 4.
Bai, Y., Suzuki, A., Sagai, M. 2001. The cytotoxic effects of diesel exhaust
particles on human pulmonary artery endothelial cells in vitro: role of
reactive oxygen species. Free Radical Biology and Medicine, 30:555–562.
Bascom, R., Bromberg, P. A., Costa, D. L., et al. 1996. Health effects of outdoor
air pollution. Am J Respir Crit Care Med. 153: 477-98.
Baulig, A., Singh, S., Marchand, A., Schins, R., Barouki, R., Garlatti, M.,
Marano, F., Baeza-Squiban,A., 2009. Role of Paris PM2.5 components in
the pro-inflammatory response induced in airway epithelial
cells.Toxicol.261, 126–135.
Beeson, W.L., Abbey, D. E., Knutsen, S. F. 1998. Long-term concentrations of
ambient air pollutants and incident lung cancer in California adults: results
from the AHSMOG study. Adventist Health Study on Smog.
Environmental Health Perspectives; 106:813–823.

136
Benninghoff, A. D. 2007.Toxicoproteomics - The next step in the evolution of
environmental biomarkers? Toxicol. Sci., 95 (1), 1− 4.
Berger, J., & Moller, D. E. 2002. The mechanisms of action of PPARs. Annual
review of medicine, 53(1), 409-435.
Bertazzi, P. A., Consonni, D., Bachetti, S., Rubagotti, M., Baccarelli, A.,
Zocchetti, C., & Pesatori, A. C. 2001. Health effects of dioxin exposure: a
20-year mortality study. American Journal of Epidemiology, 153(11),
1031-1044.
Billet, S., Abbas, I., LeGoff, J.,Verdin, A., Andre,V., Lafargue, P. E., Hachimi,
A., Cazier, F., Sichel, F., Shirali, P., Garcon, G., 2008. Genotoxic potential
of polycyclic aromatic hydrocarbons-coated onto air borne particulate
matter (PM2.5) in human lung epithelial A549cells. Cancer Lett.270, 144–
155.
Binkov , B., Vesel , D., Vesel , D., Jel nek, R., r m, R. J. 1999. enotoxicity
and embryotoxicity of urban air particulate matter collected during winter
and summer period in two different districts of the Czech
Republic.Mutation Research/Genetic Toxicology and Environmental
Mutagenesis, 440(1), 45-58.
Bjork, J. A., Lau, C., Chang, S. C., Butenhoff, J. L., & Wallace, K. B. 2008.
Perfluorooctane sulfonate induced changes in fetal rat liver gene
expression. Toxicology, 251(1), 8-20.
Blankenship, A. L., Kannan, K., Villalobos, A., Falandysz, J., Giesy J. P. 2000.
Relative potencies of halowax mixtures and individual polychlorinated
naphthalenes (PCNs) in H4IIe-Luc cell bioassay Environ. Sci. Technol.,
34, pp. 3153–3158.
Blomhoff, R., Wake, K. 1991. Perisinusoidal stellate cells of the liver: important
roles in retinol metabolism and fibrosis. FASEB J; 5:271–7.
Bostrom, C. E., Gerde, P., Hanberg, A., Jernstrom, B., Johansson, C., Kyrklund,
T., Rannug, A., Tornqvist, M., Victorin, K., Westerholm, R., 2002. Cancer
risk assessment, indicators, and guidelines for polycyclic aromatic
hydrocarbons in the ambient air. Environ Health Perspect 110 Suppl 3,
451-488.

137
Braakman, I., Hoover-Litty, H., Wagner, K. R., & Helenius, A. 1991. Folding of
influenza hemagglutinin in the endoplasmic reticulum. The Journal of cell
biology, 114(3), 401-411.
Brigham, K. L., & Meyrick, R. A. 1986. Endotoxin and lung injury. The
American review of respiratory disease, 133(5), 913-927.)
Brimblecombe, P. 1977. London air pollution 1500–1900. Atmospheric
Environment; 11:1157–1162.
Brody, J. S., & Spira, A. 2006. State of the art. Chronic obstructive pulmonary
disease, inflammation, and lung cancer. Proceedings of the American
Thoracic Society, 3(6), 535-537.
Broman, D., Rolff, C., Näf, C., Zebühr, Y., Fry, B., & Hobbie, J. 1992. Using
ratios of stable nitrogen isotopes to estimate bioaccumulation and flux of
polychlorinated dibenzo‐p‐dioxins (PCDDs) and dibenzofurans (PCDFs)
in two food chains from the Northern Baltic. Environmental Toxicology
and Chemistry, 11(3), 331-345.
Bronzetti, G., Cini, M., Paoli, M., Ciacchini, G., Giaconi, V., & Morichetti, E.
1996. Mutagenicity and chemical analysis of airborne particulate matter
collected in Pisa. Journal of environmental pathology, toxicology and
oncology: official organ of the International Society for Environmental
Toxicology and Cancer, 16(2-3), 147-156.
Brown, D. M., Wilson, M. R., MacNee, W., Stone, V., Donaldson, K. 2001. Size-
dependent pro-inflammatory effects of ultrafine polystyrene particles: the
role of surface area and oxidative stress in the enhanced activity of
ultrafines. Toxicology and Applied Pharmacology, 175:191–199.
Brunekreef, B., Beelen, R., Hoek, G., Schouten, L., Bausch-Goldbohm, S.,
Fischer, P., Armstrong, B., Hughes, E., Jerrett, M., van den Brandt, P.,
2009. Effects of long-term exposure to traffic-related air pollution on
respiratory and cardiovascular mortality in the Netherlands: the NLCS-
AIR study. Res Rep Health Eff Inst, 5-71; discussion 73-89.
Brunekreef, B., Holgate, S.T., 2002. Air pollution and health. Lancet 360, 1233.
Buja, L. M., Eigenbrodt, M. L., & Eigenbrodt, E. H. 1993. Apoptosis and
necrosis. Basic types and mechanisms of cell death. Archives of pathology
& laboratory medicine, 117(12), 1208-1214.

138
Buschini, A., Cassoni, F., Anceschi, E., Pasini, L., Poli, P., & Rossi, C. 2001.
Urban airborne particulate: genotoxicity evaluation of different size
fractions by mutagenesis tests on microorganisms and comet assay.
Chemosphere, 44(8), 1723-1736.
Cachon, B. F., Firmin, S., Verdin, A., Ayi-Fanou, L., Billet, S., Cazier, F., Martin,
P.J., Aissi, F., Courcot, D., Sanni, A., Shirali, P., 2014. Pro-inflammatory
effects and oxidative stress within human bronchial epithelial cells
exposed to atmospheric particulate matter (PM2.5 and PM>2.5) collected
from Cotonou, Benin. Environ Pollut 185, 340-351.
CAFE Working Group on Particulate Matter. 2004. Second position paper on
particulate matter.Brussels: CAFE Working Group on Particulate Matter.
Seealsohttp://ec.europa.eu/environment/air/cafe/pdf/working_groups/2nd_
Cai, H., & Xie, S. 2007. Estimation of vehicular emission inventories in China
from 1980 to 2005. Atmospheric Environment, 41(39), 8963-8979.
Calafat, A. M., Kuklenyik, Z., Caudill, S. P., Reidy, J, A., Needham L. L.,
Perfluorochemicals in pooled serum samples from United States residents
in 2001 and 2002. Environmental Science & Technology 2006a; 40: 2128-
2134.
Calafat, A. M., Needham, L. L., Kuklenyik, Z., Reidy, J. A., Tully, J. S., Aguilar-
Villalobos, M., Naeher L, P. Perfluorinated chemicals in selected
residents of the American continent. Chemosphere 2006b; 63: 490-496.
Campling, B. G., Pym, J., Galbraith, P. R., & Cole, S. P. 1988. Use of the MTT
assay for rapid determination of chemo sensitivity of human leukemic
blast cells. Leukemia research, 12(10), 823-831.
Cao, J. J., Shen, Z. X., Chow, J. C., Watson, J. G., Lee, S. C., Tie, X. X., ... &
Han, Y. M. 2012. Winter and summer PM2.5 chemical compositions in
fourteen Chinese cities. Journal of the Air & Waste Management
Association, 62(10), 1214-1226.
ern , M., Pochmanov , D., Pastorkov , A., Bene , ., en ek, J., Topinka, J., &
Binková, B. 2000. Genotoxicity of urban air pollutants in the Czech
Republic: Part i. bacterial mutagenic potencies of organic compounds
adsorbed on PM10 particulates. Mutation Research/Genetic Toxicology
and Environmental Mutagenesis, 469(1), 71-82.

139
Chan, K., & Kan, Y. W. 1999. Nrf2 is essential for protection against acute
pulmonary injury in mice. Proceedings of the National Academy of
Sciences, 96(22), 12731-12736.
Chang, K.F., Fang, G.C., Chen, J.C., Wu, Y.S., 2006. Atmospheric polycyclic
aromatic hydrocarbons (PAHs) in Asia: a review from 1999 to 2004.
Environ Pollut 142, 388-396.
Chavez, E., Jay, D., Bravo, C.1987. The mechanism of lead-induced
mitochondrial Ca2þ efflux. J. Bioenerg. Biomembr 19, 285.
Chen, Z., Wang, J. N., Ma, G. X., Zhang, Y. S. 2013. China tackles the health
effects of air pollution. Lancet 382, 1959-1960.
Chiaverini, L. 2002. Asthma, particulates, and diesel exhaust, Med. Health RI 85,
140–142.
Cho, H. Y., Reddy, S. P, Kleeberger, S. R. 2006. Nrf2 defends the lung from
oxidative stress. Antioxidant and Redox Signaling, 8: 76–87.
Choi, J. H., Kim, J. S., Kim, Y. C., Kim, Y. S., Chung, N. H., and Cho, M. H.
2006. Comparative study of PM2.5 and PM10 - induced oxidative stress in
rat lung epithelial cells. J Vet Sci 5, 11-8.
Clarke, R. W., Catalano, P. J., Coull, B., Koutrakis, P., Krishna Murthy, G.G.,
Godleski, J.J. 2000. Age-related responses in rats to concentrated urban air
particles (CAPs). In: Proceedings of the third colloquium on particulate air
pollution andhuman health. June 1999; Durham, NC. Inhal. Toxicology.
129 (suppl. 1): 73-84.
Clarke, R. W., Catalano, P. J., Koutrakis, P., Krishna Murthy, G. G., Sioutas, C.,
Paulauskis, J., Coull, B., Ferguson, S., Godleski, J.J. 1999. Urban air
particulate inhalation alters pulmonary function and induces pulmonary
inflammation in a rodent model of chronic bronchitis. Inhal. Toxicology
11:637-656.
Clavien, P. A., Burgan, S., & Moossa, A. R. 1989. Serum enzymes and other
laboratory tests in acute pancreatitis. British journal of surgery, 76(12),
1234-1243.
Claxton, L. D., Matthews, P. P., & Warren, S. H. 2004. The genotoxicity of
ambient outdoor air, a review: Salmonella mutagenicity. Mutation
Research/Reviews in Mutation Research, 567(2), 347-399.

140
Claxton, L. D., Morin, R. S., Hughes, T. J., & Lewtas, J. 1989. A genotoxic
assessment of environmental tobacco smoke using bacterial bioassays.
Mutation Research/Genetic Toxicology, 222(2), 81-99.
Clifton, M., Stuart Harris, C. 1978. Effect of air pollution, Part 1. Air pollution
and health. In: Parker, A. (ed.), Industrial Air Pollution, McGraw Hill,
London, pp. 1931.
Cohen, A. J., Ross Anderson, H., Ostro, B., Pandey, K. D., Krzyzanowski, M.,
Künzli, N., & Smith, K. 2005. The global burden of disease due to outdoor
air pollution. Journal of Toxicology and Environmental Health, Part A,
68(13-14), 1301-1307.
Cohen, J. T, Bellinger, D. C, Shaywitz, B. A. 2005. A quantitative analysis of
prenatal methyl mercury exposure and cognitive development. Am J Prev
Med. 29(4):353–365
Colquhoun, D. R., Goldman, L. R., Cole, R. N., Gucek, M., Mansharamani, M.,
Witter, F. R., Apelberg, B. J., Halden, R. U. 2009. Global Screening of
human cord blood proteomes for biomarkers of toxic exposure and effect.
Environ. Health Perspect, 117 (5), 832−838.
Conner, E. M., & Grisham, M. B. 1996. Inflammation, free radicals, and
antioxidants. Nutrition, 12(4), 274-277.
Corton, J. C., Fan, L. Q., Brown, S., Anderson, S. P., Bocos, C., Cattley, R. C.,
1998. Distribution of perfluorochemicals between sera and milk from the
same mothers and implications for prenatal and postnatal exposures.
Environmental Pollution, 159(1), 169-174.
Corton, J.C., Anderson, S.P., Stauber, A., 2000. Central role of peroxisome
proliferator activated receptors in the actions of peroxisome proliferators.
Annu. Rev. Pharmacol. Toxicol. 40, 491–518.
Costa, D. L., & Dreher, K. L. 1997. Bioavailable transition metals in particulate
matter mediate cardiopulmonary injury in healthy and compromised
animal models. Environmental health perspectives, 105(Suppl 5), 1053.
Costa, M., Yan, Y., Zhao, D., Salnikow, K., 2003. Molecular mechanisms of
nickel carcinogenesis: gene silencing by nickel delivery to the nucleus and
gene activation/inactivation by nickel-induced cell signaling. J. Environ.
Monit. 5, 222.

141
Crutzen, P. J., Heidt, L. E., Krasnec, J. P., Pollock, W. H., & Seiler, W. 1979.
Biomass burning as a source of atmospheric gases CO, H2, N2O, NO,
CH3Cl and CO2. Nature, 282, 253-256.
Cuzzocrea, S., Mazzon, E., Di Paola, R., Peli, A., Bonato, A., Britti, D.,
Genovese, T., Muia, C., Crisafulli, C., Caputi, A. P., 2006. The role of the
peroxisome proliferator activated receptor-alpha (Ppar -alpha) in the
regulation of acute inflammation. J. Leukoc. Biol. 79, 999–1010.
D‘eon, J. C., Mabury, S. A. 2011. s indirect exposure a significant contributor
to the burden of perfluorinated acids observed in humans? Environmental
science & technology, 45(19), 7974-7984.
Dahl, R. 2005. Heavy traffic ahead: car culture accelerates. Environ Health
Perspect.113 (4):A238–A245.
D'amato, G., Liccardi, G., D'amato, M., & Cazzola, M. 2001. The role of outdoor
air pollution and climatic changes on the rising trends in respiratory
allergy. Respiratory medicine, 95(7), 606-611.
Dannisenko, M. F. A., Tang, M. S., Pfeifer G. P. 1996. Preferential formation of
benzo[a]pyrene adducts at lung cancer mutational hotspots in p53.
Carcinogenesis, 14:475–482.
Davidson, C. I., Phalen, R. F., & Solomon, P. A. 2005. Airborne particulate
matter and human health: a review. Aerosol Science and Technology,
39(8), 737 749.
De Kok, T. M., Hogervorst, J. G., Briedé, J. J., van Herwijnen, M. H., Maas, L.
M., Moonen, E. J., & Kleinjans, J. C. 2005. Genotoxicity and
physicochemical characteristics of traffic‐related ambient particulate
matter. Environmental and molecular mutagenesis, 46(2), 71-80.
Deng, X. 2006. Economic costs of motor vehicle emissions in China: a case study.
Transportation Res D Transport Environ,11(3): 216–222
Dergham, M., Lepers, C., Verdin, A., Billet, S., Cazier, F., Courcot, D., Shirali,
P., Garcon, G., 2012. Pro-oxidant and pro-inflammatory potency of air
pollution particulate matter (PM2.5-0.3) produced in rural, urban, or
industrial surroundings in human bronchial epithelial cells (BEAS-2B).
Chem Res Toxicol 25, 904-919.
Desvergne, B., Wahli, W. 1999. Peroxisome proliferator-activated receptors:
nuclear control of metabolism, Endocr. Rev. 20, 649–688.

142
Deutsch-Wenzel, R. P., Brune, H., Grimmer, G., Dettbarn, G., & Misfeld, J.
1983. Experimental studies in rat lungs on the carcinogenicity and dose-
response relationships of eight frequently occurring environmental
polycyclic aromatic hydrocarbons. Journal of the National Cancer
Institute, 71(3), 539-544.
Dietert, R. R., Etzel, R. A., Chen, D., Halonen, M., Holladay, S. D., Jarabek, A.
M., & Zoetis, T. 2000. Workshop to identify critical windows of exposure
for children's health: immune and respiratory systems work group
summary. Environmental health perspectives, 108(Suppl 3), 483.
DiMagno, E. P., Go, V. L., Summerskill, W. H., 1973. Relations between
pancreatic enzyme ouputs and malabsorption in severe pancreatic
insufficiency. N Engl J Med 288:813–815.
Dimashki, M., Lim, L. H., Harrison, R. M., Harrad, S. 2001. Temporal trends,
temperature dependence, and relative reactivity of atmospheric polycyclic
aromatic hydrocarbons. Environ Sci Technol 35:2264–2267.
Dockery, D. W., Pope, C. A III. 1994. Acute respiratory effects of particulate air
pollution. Annu Rev Public Health.15:107-32.
Dockery, D. W., Schwartz, J., and Spengler, J. D. 1993. Air pollution and daily
mortality Association with particulates and acid aerosols. Environ. Res.
59, 362-373.
Dominguez-Munoz, J. E., Hieronymus, C., Sauerbruch, T., Malfertheiner, P.
1995 Fecal elastase test: evaluation of a new noninvasive pancreatic
function test. Am J Gastroenterol 90:1834–1837.
Donaldson, K., Gilmour, M. I., Mac Nee, W., 2001. Asthma and PM10. Respir.
Res. 1, 12–15.
Duan, F. K., He, K. B., Ma, Y. L., Yang, F. M., Yu, X. C., Cadle, S. H., et al.
2006. Concentration and chemical characteristics of PM2.5 in Beijing,
China: 2001–2002. Sci Total Environ, 355: 264–75.
Duan, J., Bi, X., Tan, J., Sheng, G., and Fu, J. 2007. Seasonal variation on size
distribution and concentration of PAHs in Guangzhou city, China.
Chemosphere, 67(3), 614-622.
Duval, M. M., & Friedlander, S. K. 1981. Source resolution of polycyclic
aromatic hydrocarbons in the Los Angeles atmosphere application of a

143
CMB with first-order decay. U.S. EPA report EPA-600/2-81-161.
Washington, DC: US Government Printing Office.
Dyke, P., Coleman, P., & James, R. 1997. Dioxins in ambient air, bonfire night
1994. Chemosphere, 34(5), 1191-1201.
Economy, E. C. 2003. China‘s Environmental Challenge: Political, Social, and
Economic Implications. New York, NY: Council on Foreign Relations.
Economy, E. C. 2007.The great leap backward? Foreign Aff.; 86(5):38–59
Ellis, D. A., Martin, J. W., De Silva, A. O., Mabury, S. A., Hurley, M. D., Sulbaek
Andersen, M. P., Wallington, T. J., 2004. Degradation of fluorotelomer
alcohols: a likely atmospheric source of perfluorinated carboxylic acids.
Environmental Science & Technology 38, 3316-3321.
Elsom, D. Atmospheric Pollution, Blackwell, Oxford, 1987, pp. 156–160.
Environmental Protection Agency, Office of Air Quality Planning and Standards.
1996. Review of the National Ambient Air Quality Standards for
Particulate Matter: policy assessment of scientific and technical
information. OAQPS staff paper no. EPA-452\R-96-013. Washington,
D.C.: Government Printing Office.
EPA, U.S. 2004. Air Quality Criteria for Particulate Matter (vol. I, EPA/600/P-
99/002aF and vol. II, EPA/600/P-99/002bF), Report.
European Commission. 2003. Technical Guidance Document in support of
Commission Directive 93/67/EEC on Risk Assessment for New Notified
Substances, Commission Regulation (EC) No. 1488/94 on Risk
Assessment for Existing Substances and Directive 98/8/EC of the
European Parliament and of the Council Concerning the Placing of
Biocidal Products on the19 Market. Joint Research Centre, European
Chemicals Bureau, Brussels, Belgium.
Feng, J. L., Hu, M., Chan, C. K., Lau. P. S., Fang, M. He., L. Y., et al. 2006. A
comparative study of the organic matter in PM2.5 from three Chinese
megacities in three different climatic zones. Atmos Environ, 40(21):3983–
94.
Fredrikzon, B., Hernell, O., Blackberg, L. and Olivecrona, T. 1978. Pediat. Res.
12, 1048-1052.

144
Gielen, M. H., van der Zee, S. C., van Wijnen, J. H., van Steen, C. J., Brunekreef,
B., 1997. Acute effects of summer air pollution on respiratory health of
asthmatic children. Am. J. Respir. Crit. Care Med. 155, 2105–2108.
Giesy, J. P, Hilscherova, K., Jones, P. D., Kannan, K and Machala, M. 2002. Cell
bio-assays for detection of aryl hydrocarbon (AhR) and estrogen receptor
(ER) mediated activity in environmental samples, Marine pollution
Bulletin 45: 3-16.
Giesy, J. P., & Kannan, K. 2001. Global distribution of perfluorooctane sulfonate
in wildlife. Environmental science & technology, 35(7), 1339-1342.
Gilbert, H. F. 1997. Protein disulfide isomerase and assisted protein
folding.Journal of Biological Chemistry, 272(47), 29399-29402.
Glasbrenner, B., Kahl, S., & Malfertheiner, P. 2002. Modern diagnostics of
chronic pancreatitis. European journal of gastroenterology &
hepatology, 14(9), 935-941.
Glover, J. 1974. Retinol-binding proteins. Vitamins & Hormones, 31, 1-42.
Godleski, J. J., Verier, R. L, Koutrakid, P., Catalano, P. 2000. Mechanisms of
morbidity and mortality from exposure to ambient air particles.
Cambridge, MA: Health Effects Institute; research report no. 91.
Gonzales-Flecha B. 2004. Oxidant mechanisms in response to ambient air
particles. Molecular Aspects of Medicine, 25:169–182.
Gordon, T., Nadziejko, C., Chen, L. C., Schlessinger, R. 2000. Effects of
concentrated ambient particles in rats and hamsters: an exploratory study.
Cambridge, MA: Health Effects Institute; research report no. 93.
Gotschi, T., Heinrich, J., Sunyer, J., Kuzli, N. 2008. Long-term effects of ambient
air pollution on lung function: a review. Epidemiology, 19:690–701.
Grandjean P, Landrigan P. J. 2006. Developmental neurotoxicity of industrial
chemicals. Lancet.368 (9553):2167–2178
Grasty, R. C., Bjork, J. A., Wallace, K. B., Lau, C. S., & Rogers, J. M. 2005.
Effects of prenatal perfluorooctane sulfonate (PFOS) exposure on lung
maturation in the perinatal rat. Birth Defects Research Part B:
Developmental and Reproductive Toxicology, 74(5), 405-416.

145
Grasty, R. C., Grey, B. E., Lau, C. S., Rogers, J. M., 2003a. Prenatal window of
susceptibility to perfluorooctane sulfonate-induced neonatal mortality in
the Sprague–Dawley rat. Birth Defects Res. B Dev. Reprod. Toxicol. 68,
465–471.
Grasty, R. C., Grey, B. E., Lau, C. S., Rogers, J.M., 2003b. Prenatal window of
susceptibility to perfluorooctane sulfonate-induced neonatal mortality in
the Sprague–Dawley rat. Birth Defects Res. (Part B) 68, 465–471.
Greenbaum, D. S. 2003. A historical perspective on the regulation of particles. J
Toxicol Environ Health A 66, 1493-8.
Greenwell, L. L., Moreno, T., Jones, T. P., & Richards, R. J. 2002. Particle-
induced oxidative damage is ameliorated by pulmonary antioxidants. Free
Radical Biology and Medicine, 32(9), 898-905.
Gualtieri, M., Øvrevik, J., Holme, J. A., Perrone, M. G., Bolzacchini, E.,
Schwarze, P. E., Camatini, M., 2010. Differences in cytotoxicity versus
pro-inflammatory potency of different PM fractions in human epithelial
lung cells. Toxicology in Vitro 24, 29–39.
Gullo, L., Ventrucci, M., Tomassetti, P., Migliori, M., & Pezzilli, R. 1999. Fecal
elastase 1 determination in chronic pancreatitis. Digestive diseases and
sciences, 44(1), 210-213.
Gutierrez-Castillo, M., Roubicek, D. A., Cebri´an-Garcia, M. E., De Vizcaya-
Ruiz, A., Sordo-Cedeo, M., Ostrosky-Wegman, P. 2006. Effect of
chemical composition on the induction of DNA damage by urban airborne
particulate matter. Environmental and Molecular Mutagenesis; 47:199–
211.
Gützkow, K. B., Line, S., Haug, C. T., Azemira, S., Georg, B., and Gunnar B.
2012. "Placental transfer of perfluorinated compounds is selective–a
Norwegian Mother and Child sub-cohort study." International journal of
hygiene and environmental health 215, no. 2: 216-219.
Ha, E. H, Lee, J. T, Kim, H., et al. 2003. Infant susceptibility of mortality to air
pollution in Seoul, South Korea. Pediatrics. 111(2): 284–290
Hamers, T., Van Schaardenburg, M. D., Felzel, E. C., Murk, A. J., & Koeman, J.
H. 2000. The application of reporter gene assays for the determination of
the toxic potency of diffuse air pollution. Science of the total environment,
262(1), 159-174.

146
Han, D., Moon, S., Kim, H., Choi, S. E., Lee, S. J., Park, K. S., & Kim, Y. 2010.
Detection of differential proteomes associated with the development of
type 2 diabetes in the Zucker rat model using the iTRAQ
technique. Journal of proteome research, 10(2), 564-577.
Hansen, J. E., & Sato, M. 2001. Trends of measured climate forcing agents.
Proceedings of the National Academy of Sciences, 98 (26), 14778-14783.
Hansen, K. J., Clemen, L. A., Ellefson, M. E., & Johnson, H. O. 2001b.
Compound-specific, quantitative characterization of organic
fluorochemicals in biological matrices. Environmental science &
technology, 35(4), 766-770.
Harada, K. Saito, N., Sasaki, K., Inoue, K., Koizumi, A. 2003. Perfluorooctane
sulfonate contamination of drinking water in the Tama River, Japan:
Estimated effects on resident serum levels. Bull Environ Contam Toxicol
71: 31-36.
Harada, K., Nakanishi, S., Saito, N,. Tsutsui, T., Koizumi, A. 2005. Airborn
Perfluorooctanoate May Be a Substantial Source Contamination in Kyoto
Area, Japan, Bull. Environ. Contam. Toxicol, 74:64–69
Harada, K., Nakanishi, S., Sasaki. K., Furuyama, K., Nakayama, S., Saito, N.,
Yamakawa, K., Koizumi, A. 2006. Particle size distribution and
respiratory deposition estimates of airborne perfluorooctanoate and
perfluorooctane-sulphonate in Kyoto area, Japan. Bulletin of
Environmental Contamination and Toxicology, 76: 306-310.
Harrison, R. M., and Yin, J. 2000. Particulate Matter in the Atmosphere: Which
Particle Properties are Important for its Effects on Health? Sci. Total
Environ. 249:85–101
Harrison, R. M., Smith, D. J. T., Luhana, L. 1996. Source apportionment of
atmospheric polycyclic aromatic hydrocarbons collected from an urban
location in Birmingham, UK. Environ Sci Technol 30:825–832.
Hathcock, J. N., Hattan, D. G., Jenkins, M. Y., McDonald, J. T., Sundaresan. P.
R., Wilkening, V. L. 1990. Evaluation of vitamin A toxicity. Am J Clin
Nutr; 52:183–202.

147
Haywood, J., & Boucher, O. 2000. Estimates of the direct and indirect radioactive
forcing due to tropospheric aerosols: A review. Reviews of geophysics,
38(4), 513-543.
He, K. B., Yang, F. M., Ma, Y. L., Zhang, Q., Yao, X. H., Chan, C. K, et al.
2001.The characteristics of PM2.5 in Beijing, China. Atmos Environ,
35(29):4959–70.
He, K., Hou, H., and Zhang, Q. 2002. Urban air pollution in China: Current status,
characteristics, and progress. Annu. Rev. Energy Environ. 2002. 27:397–
431
He, L. Y., Hu, M., Huang, X. F., Zhang, Y. H., Yu, B. D., & Liu, D. Q. 2006.
Chemical characterization of fine particles from on-road vehicles in the
Wutong tunnel in Shenzhen, China. Chemosphere, 62(10), 1565-1573.
Healey, K., Lingard, J. J. N, Tomlin, A., Hughes, A., White, K. L. M, Wild, C. P,
Roudledge, M. N. 2005. Genotoxicity of size-fractionated samples of
urban particulate matter. Environmental and Molecular Mutagenesis;
45:380–387.
Heinrich, J., Pitz, M., Bischof, W., Krug, N., & Borm, P. J. 2003. Endotoxin in
fine (PM2.5) and coarse (PM2.5–10) particle mass of ambient aerosols. A
temporo-spatial analysis. Atmospheric environment, 37(26), 3659-3667.
Heit, C., Jackson, B. C., McAndrews, M., Wright, M. W., Thompson, D. C.,
Silverman, G. A., & Vasiliou, V. 2013. Update of the human and mouse
SERPIN gene superfamily. Hum Genomics, 7(1), 22.
Hertz-Picciotto, I., Dostal, M., James, R. A., Keller, J., Dejmek, J., Selevan, S. G.,
Kotesovec, F., Nozicka, J., Gomez-Caminero, A., Wegienka, G., Sram, R.
J. 2007. Immunity and childhood morbidity in the Teplice program. In:
Teplice Program: Impact of air pollution on human health. (R.J. Sram, ed.)
Academia, Prague, p. 207-215.
Heyman, R. A., Mangelsdorf, D. J., Dyck, J. A., Stein, R. B., Eichele, G., Evans,
R. M. a Thaller, C. 1992. 9-Cis retinoic acid is a high affinity ligand for
the retinoid X receptor. Cell 68: 397-406.
Hiddy, G. M., and Pace, T. 2004. Emissions Characterization, In Particulate
Matter Science for Policy Makers: A NARSTO Assessment. McMurry, P.,
Shepherd, M., and Vickery, J. eds. Chapter 4 Cambridge University Press,

148
United Kingdom, ISBN 0521842875. (EPRI report version available at
http://www. cgenv. com/Narsto link to PM Science and Assessment).
Hirakawa, K., Oikawa, S., Hiraku, Y., Hirosawa, I., Kawanishi, S. 2002. Catechol
and hydroquinone have different redox properties responsible for their
differential DNAdamaging ability. Chemical Research in Toxicology,
15:76–82.
Hiura, T. S., Li, N., Kaplan, R., Horwitz, M., Seagrave, J. C., Nel, A. 2000. The
role of a mitochondrial pathway in the induction of apoptosis by chemicals
extracted from diesel exhaust particles. Journal of Immunology,
165:2703–2711.
Hogrefe, C., Civerolo, K., Ku, J. Y., Lynn, B., Rosenthal, J., Solecki, B. et al.
2006. Air quality in future decades determining the relative impacts of
changes in climate, anthropogenic and biogenic emissions, global
atmospheric composition, and regional land use. In: Air Pollution
Modeling and Its Application XVII (Borrego C, Norman AL, eds).
Proceedings of the 27th NATO/CCMS international technical meeting on
air pollution modeling and its application, 25–29 October 2004, Banff,
Canada. New York: Springer, 217–226.
Howles, P. N., Carter, C. P., Hui, D. Y. Dietary free and esterified cholesterol
absorption in cholesterol esterase (bile salt-stimulated lipase) gene-
targeted mice. 1996. Biol. Chem, 271, pp. 7196–7202 96215158.
Hruban, Z., Russel, l. R. M., Boyer, J. L., et al. 1974. Ultrastructural changes in
livers of two patients with hypervitaminosis A. Am J Pathol, 76451-468.
Hu, M., Zhao, X. L., He, L. Y., Huang, X. F., Tang, X. Y., Yao, X. H, et al. 2005.
Mass size distribution of Beijing particulate matters and its inorganic
water-soluble ions in winter and summer. Environ Sci, 26(4):1–6.
Hu, T. F. S. C., Lee, J. J., Cao, W. K., Ho, K. F., Ho, J. C., Chow, J. G. 2009.
Watson, B. Rong, and Z.S. Atmospheric deterioration of Qin brick in an
environmental chamber at Emperor Qin‘s Terracotta Museum, China.
Journal of Archaeological Science 36(11):2578–2583.
doi:10.1016/j.jas.2009.07.014
Huang, D. W., Sherman, B. T. & Lempicki, R. A. 2009a. Bioinformatics
enrichment tools: paths toward the comprehensive functional analysis of
large gene lists. Nucleic Acids Res. 37, 1-13.

149
Huang, Y. C., Li, Z., Carter, J. D., Soukup, J. M., Schwartz, D. A., and Yang, I.
V. 2009b. Fine ambient particles induce oxidative stress and metal binding
genes in human alveolar macrophages. Am. J. Respir. Cell Mol. Biol.
41:544–552.
Hwang, C. J. S. A., Sinskey, A. J., & Lodish, H. F. 1992. Oxidized redox state of
glutathione in the endoplasmic reticulum. Science, 257(5076), 1496-1502.
Iijima, N., Tanaka, S., & Ota, Y. 1998. Purification and characterization of bile
salt-activated lipase from the hepatopancreas of red sea bream, Pagrus
major.Fish Physiology and Biochemistry, 18(1), 59-69.
INDOEX, 2003. INDOEX, Indian Ocean Experiment, An International Field
Experiment in the Indian Ocean. Information available at http://www-
indoex. ucsd.edu.
Inoue, K., Okada, F., Ito, R., Kato, S., Sasaki, S., Nakajima, S. & Nakazawa, H.
2004. Perfluorooctane sulfonate (PFOS) and related perfluorinated
compounds in human maternal and cord blood samples: assessment of
PFOS exposure in a susceptible population during pregnancy.
Environmental Health Perspectives, 1204-1207.
International Agency for Research on Cancer (IARC), 1983. Monographs on the
Evaluation of the Carcinogenic Risk of Chemicals to Humans: Polynuclear
Aromatic Hydrocarbons, vol. 32. World Health Organization, Lyon,
France.
International Energy Agency. 2009. CO2 Emissions from Fuel Combustion 2009
Highlights: IEA.
International Programme on Chemical Safety (IPCS), 1998. Environmental Health
Criteria 2002. Selected Non-Heterocyclic Polycyclic Aromatic
Hydrocarbons. World Health Organization, Geneva
Ivanov V. P. and Yakobson, G. A. 1965. Exchange of metabolites in plants via
aerial organs," Fiziologiya Rastenii, 12, (3): 405.
Jacobson, M. Z. 2000. A Physically Based Treatment of Elemental Carbon
receptor alpha target genes. Cell Mol. Life Sci. 61, 393–416.
Jacobson, M. Z. 2002. Control of fossil‐fuel particulate black carbon and organic
matter possibly the most effective method of slowing global warming.
150
Journal of Geophysical Research: Atmospheres (1984–2012), 107(D19),
ACH-16.
Jacobson, M. Z. 2008. On the causal link between carbon dioxide and air
pollution mortality. Geophys. Res. Lett, 35:L03809; doi:
10.1029/2007GL031101. [Online 12 February 2008].
Jacobson, M. Z., 2001. Strong radiative heating due to the mixing state of black
carbon in atmospheric aerosols, Nature, 409, 695– 697.
Jacques, E. A., Buschmann, R. J., Layden, T. J. 1979.The histopathologic
progression of vitamin A-induced hepatic injury. Gastroenterology,
76599-602.
Jaffe, D., Anderson, T., Covert, D., Trost, B., Danielson, J., Simpson, W., &
Streets, D. 2001. Observations of ozone and related species in the
northeast Pacific during the PHOBEA campaigns: 1. Ground‐based
observations at Cheeka Peak. Journal of Geophysical Research:
Atmospheres (1984–2012), 106(D7), 7449-7461.
Jahn, H. J., Schneider, A., Breitner, S., Eibner, R., Wendisch, M., & Krämer, A.
2011. Particulate matter pollution in the megacities of the Pearl River
Delta, China–A systematic literature review and health risk assessment.
International journal of hygiene and environmental health, 214(4), 281-
295.
Jarup, L., 2003. Hazards of heavy metal contamination. Br. Med. Bull. 68, 167.
Jiang, G., Cao, F., Ren, G., Gao, D., Bhakta, V., Zhang, Y., & Wang, Y. 2010.
PRSS3 promotes tumour growth and metastasis of human pancreatic
cancer. Gut, 59(11), 1535-1544.
Jin, Y. H., Liu, X., Li, T., Qin, H. M., Zhang, Y. H., 2004. Status of
perfluorochemicals in adult serum and umbilical blood in Shenyang.
Journal of Hygiene Research 33.
Kampa, M., & Castanas, E. 2008. Human health effects of air
pollution.Environmental pollution, 151(2), 362-367.
Kan, H., Chen, R., & Tong, S. 2012. Ambient air pollution, climate change, and
population health in China. Environment international, 42, 10-19.

151
Kan, H., London, S. J, Chen, G, Zhang, Y, Song, G, Zhao, N, et al. 2007.
Differentiating the effects of fine and coarse particles on daily mortality in
Shanghai, China. Environ Int; 33:376–84.
Kanai, M., Raz, A., & Goodman, D. S. 1968. Retinol-binding protein: the
transport protein for vitamin A in human plasma. Journal of Clinical
Investigation, 47(9), 2025.
Kanaly, R. A., & Harayama, S. 2000. Biodegradation of high-molecular-weight
polycyclic aromatic hydrocarbons by bacteria. Journal of bacteriology,
182(8), 2059-2067.
Karlsson, H. L., Nygren, J., Moller, L. 2004. Genotoxicity of airborne particulate
matter: the role of cell-particle interaction and of substances with adduct-
forming and oxidizing capacity. Mutation Research; 565:1–10.
Kasprzak, K. S. 2002. Oxidative DNA and protein damage in metal-induced
toxicity and carcinogenesis. Review. Free Radical Biology and Medicine,
32:958–967.
Katsouyanni, K., Pershagen, G. 1997. Ambient air pollution exposure and cancer.
Cancer Causes Control 1997; 8:284–291.
Killingsworth, C. R., Alessandrini, F., Krishna Murthy, G. G., Catalano, P. J.,
Paulauskis, J. D., & Godleski, J. J. 1997. Inflammation, chemokine
expression, and death in monocrotaline-treated rats following fuel oil fly
ash inhalation. Inhalation toxicology, 9(6), 541-565.
Kim, S. K., Lee, K. T., Kang, C. S., Tao, L., Kannan, K., Kim, K. R., & Lee, J.
H. 2011. Distribution of perfluorochemicals between sera and milk from
the same mothers and implications for prenatal and postnatal exposures.
Environmental Pollution, 159(1), 169-174.
Knaapen, A. M., Borm, P. J. A., Albercht, C., Schins, R. P. F. 2004. Inhaled
particles and lung cancer. Part A. Mechanisms. International Journal of
Cancer ; 109:799–809.
Knaapen, A. M., Shi, T., Borm, P. J. A., Schins, R. P. F. 2002. Soluble metals as
well as insoluble particle fraction are involved in cellular DNA damage
induced by particulate matter. Molecular and Cell Biochemistry; 234/235:
317–326.

152
Knuckles, T. L, Dreher K. L. 2007. Fine oil combustion particle bioavailable
constituents induce molecular profiles of oxidative stress, altered function,
and cellular injury in cardiomyocytes. Journal of Toxicology and
Environmental Health, 70:1824–1837.
Kodavanti, U. P., Hauser, R., Christiani, D. C., Meng, Z. H., McGee, J.,
Ledbetter, A., Richards, J., Costa, D. L. 1998b. Pulmonary responses to oil
fly ash particles inthe rat differ by virtue of their soluble metals. Toxicol.
Sci. 43:204-212.
Kodavanti, U. P., Jackson, M. C., Ledbetter, A. D., Richards, J. R., Gardner, S.
Y., Watkinson, W. P., Campen, M. J., Costa, D. L. 1999. Lung injury from
intratracheal and inhalation exposures to residual oil fly ash in a rat model
of monocrotoaline induced pulmonary hypertension. J. Toxicolo. Environ.
Health Part A 57: 101-121.
Kodavanti, U. P., Jaskot, R. H., Bonner, J., Badgett, A., Dreher, K. L. 1996.
Eosinophilic lung inflammation in particulate-induced lung injury:
technical consideration in isolating RNA for gene expression studies. Exp.
Lung Res. 22: 541-554.
Kodavanti, U. P., Jaskot, R. H., Su, W.Y., Costa, D. L., Ghio, A. J, Dreher, K. L.
1997. Genetic variability in combustion particle-induced chronic lung
injury. Am. J.Physiol. 272: L521-L532.
Koening, J. Q., Pierson, E., Frank, R. 1980. Acute effects of inhaled sulphur
dioxide plus sodium chloride on pulmonary function in asthmatic
adolescents. Environmental Research; 22:145–147.
Kong, S., Ding, X., Bai, Z., Han, B., Chen, L., Shi, J., Li, Z., 2010. A seasonal
study of polycyclic aromatic hydrocarbons in PM2.5 and PM 2.5-10 in five
typical cities of Liaoning Province, China. J Hazard Mater 183, 70-80.
Krewski, D., Burnett, R. T., Goldberg, M. S., Hoover, B. K., Siemiatycki, J.,
Jerrett, M., Abrahamowicz, M., and White, W. H. 2003. Overview of the
reanalysis of the Harvard Six Cities Study and American Cancer Society
Study of Particulate Air Pollution and Mortality. J Toxicol Environ Health
A 66, 1507-51.
Kultz, D., Fiol, D., Valkova, N., et al. Functional genomics and proteomics of the
cellular osmotic stress response in ‗non-model‘ organisms. J Exp Biol
2007; 210:1593–601.

153
Kumagai, Y., Arimoto, T., Shinyashiki, M., Shimojo, M., Nakai, Y., Yoshikawa,
T., Sagai, M. 1997. Generation of reactive oxygen species during
interaction of diesel exhaust particle components with NADPH-
cytochrome P450 reductase and involvement of the bioactivation in the
DNA damage. Free Radical Biology and Medicine, 22:479–487.
Laden, F., Neas, L. M., Dockery, D. W., & Schwartz, J. 2000. Association of fine
particulate matter from different sources with daily mortality in six US
cities. Environmental health perspectives, 108(10), 941.
LaMantia, M., & Lennarz, W. J. 1993. The essential function of yeast protein
disulfide isomerase does not reside in its isomerase activity. Cell, 74(5),
899-908.
Langrish, J. P., Li, X., Wang, S., Lee, M. M., Barnes, G. D., Miller, M. R.,
Cassee, F. R., Boon, N. A., Donaldson, K., Li, J., Li, L., Mills, N. L.,
Newby, D. E., Jiang, L., 2012. Reducing personal exposure to particulate
air pollution improves cardiovascular health in patients with coronary
heart disease. Environ Health Perspect 120, 367-372.
Lau, C., Anitole, K., Hodes, C., Lai, D., Pfahles-Hutchens, A., Seed, J. 2007.
Perfluoroalkyl acids—a review of monitoring and toxicological findings.
Toxicol Sci. 99:366–94.
Lau, C., Thibodeaux, J. R., Hanson, R. G., Rogers, J. M., Grey, B. E., Stanton, M.
E., Butenhoff, J. L., Stevenson, L. A., 2003. Exposure to perfluorooctane
sulfonate during pregnancy in rat and mouse. II: postnatal evaluation.
Toxicol. Sci. 74, 382–392
Law, A. Y. S., Wei, X., Zhang, X., Mak, N. K., Cheung, K. C., Wong, M. H., ... &
Wong, C. K. C. 2012. Biological analysis of endocrine-disrupting
chemicals in animal meats from the Pearl River Delta, China. Journal of
Exposure Science and Environmental Epidemiology, 22(1), 93-100.
Lawther, P. J. Carbon monoxide. 1975. British Medical Bulletin 1975; 31:256–
260.
Lee, J. T., Son, J. Y., Cho, Y. S., 2007. The adverse effects of fine particle air
pollution on respiratory function in the elderly. Sci Total Environ 385, 28-
36.

154
Lelieveld, J., & Dentener, F. J. 2000. What controls tropospheric ozone? Journal
of Geophysical Research: Atmospheres (1984–2012), 105(D3), 3531-
3551.
León, H. D., Boué, S., Peitsch, M. C., & Hoeng, J. 2013. Modulation of the
hepatic lipidome and transcriptome of Apoe-/-Mice in response to
smoking cessation. J Liver, 2(132), 2167-0889.
Lepez-Candales, A., Bosner, M. S., Spilburg, C. A., Lange, L. G. 1993.
Cholesterol transport function of pancreatic cholesterol esterase: directed
sterol uptake and esterification in enterocytes Biochemistry, 32, pp.
12085–12089 94032342
Levin, A. A., Sturzenbecker, L. J., Kazmer, S., Bosakowski, T., Huselton, C.,
Allenby, G., Speck, J., Kratzeisen, C. I., Rosenberger, M., Lovey, A. &
Grippo, J. F. 1992. 9-Cis retinoic acid stereoisomer binds and activates the
nuclear receptor RXRa. Nature 355: 359-361.
Li, B. & Dewey, C. N. 2011. RSEM: accurate transcript quantification from
RNA-Seq data with or without a reference genome. BMC. Bioinformatics.
12, 323.
Li, C. K., & Kamens, R. M. 1993. The use of polycyclic aromatic hydrocarbons as
source signatures in receptor modeling. Atmospheric Environment, 27A,
523–532.
Li, H., & Durbin, R. 2009. Fast and accurate short read alignment with Burrows-
Wheeler transform. Bioinformatics. 25, 1754-1760.
Li, J. W. et al. 2012. SEQ answers: an open access community for collaboratively
decoding genomes. Bioinformatics. 28, 1272-1273.
Li, J.G., Liu, J.Y., Luan, Y., Zhao, Y.F., Wu, Y.N., 2009. Geographical
distribution of perfluorinated compounds in human blood from Liaoning
Province, China. Environmental Science & Technology 43, 4044e4048.
Li, N., Hao, M., Phalen, R. F., Hinds, W. C., & Nel, A. E. 2003. Particulate air
pollutants and asthma: a paradigm for the role of oxidative stress in PM-
induced adverse health effects. Clinical Immunology, 109(3), 250-265.
Li, N., Kim, S., Wang, M., Froines, J., Sioutas, C., Nel, A. 2002. Use of a
stratified oxidative stress model to study the biological effects of ambient

155
concentrated and diesel exhaust particulate matter. Inhalation Toxicology,
14:459–486.
Li, Y., Wang, P., Ding, L., Li, X., Wang, T., Zhang, Q., & Wei, F. 2010.
Atmospheric distribution of polychlorinated dibenzo-p-dioxins,
dibenzofurans and dioxin-like polychlorinated biphenyls around a steel
plant Area, Northeast China. Chemosphere, 79(3), 253-258.
Linton, M. F., Fazio, S. 2000. Re-emergence of fibrates in the management of
dyslipidemia and cardiovascular risk. Curr. Atheroscler. Rep. 2:29–35.
Lippmann, M., Yeates, D. B., and Albert, R. E. 1980. Deposition, retention, and
clearance of inhaled particles. Br J Ind Med 37, 337-62.
Liu, C., Yu, K., Shi, X., Wang, J., Lam, P. K., Wu, R. S., & Zhou, B. 2007c.
Induction of oxidative stress and apoptosis by PFOS and PFOA in primary
cultured hepatocytes of freshwater tilapia (Oreochromis niloticus). Aquatic
Toxicology, 82(2), 135-143.
Liu, L. B., Hashi, Y., Liu, M., Wei, Y., & Lin, J. M. 2007a. Determination of
particle-associated polycyclic aromatic hydrocarbons in urban air of
Beijing by GC/MS. Analytical sciences, 23(6), 667-671.
Liu, Q; Bengmark, S; Qu, S. 2010. The role of hepatic fat accumulation in
pathogenesis of non-alcoholic fatty liver disease (NAFLD), Lipids Health
Dis. 9 - 42.
Liu, S. Z., et al. 2007b. Atmospheric polycyclic aromatic hydrocarbons in north
China: A wintertime study. Environ Sci Technol 41:8256–8261.
Loftus, S. K., Cannons, J. L., Incao, A., Pak, E., Chen, A., Zerfas, P. M., &
Pavan, W. J. 2005. Acinar cell apoptosis in Serpini2-deficient mice models
pancreatic insufficiency. PLoS genetics, 1(3), e38.
Lombardo, D. and Guy, O. 1980. Biochim. Biophys. Acta 611, 147-155.
uo, W., Zhang, Y., i, H. 2003. Children‘s blood lead levels after the phasing
out of leaded gasoline in Shantou, China. Arch Environ Health.
58(3):184–187
Mahle, N. H., & Whiting, L. F. 1980. The formation of chlorodibenzo-p-dioxins
by air oxidation and chlorination of bituminous coal. Chemosphere, 9(11),
693-699.

156
Malm, W. C. 2003. Fundamentals of Visibility, in Handbook of Weather, Climate,
and Water: Atmospheric Chemistry, Hydrology, and Societal Impacts, T.
D. Potter, T. D. and Colman, B. R., eds, Chapter 16, Wiley Interscience,
John Wiley & Sons, New York, pp. 285–329.
Marra, F. 2002. Chemokines in liver inflammation and fibrosis. Frontiers in
bioscience: a journal and virtual library, 7, d1899-914.
Martin, J. W., Mabury, S. A., O‘Brien, P. J., 2005. Metabolic products and
pathways of fluorotelomer alcohols in isolated rat hepatocytes. Chemico-
Biological Interactions 155, 165-180.
Mastral A. M., Callen, M. S, Garcia T, 2000. Poly aromatic environmental impact
in coal-tire blend atmospheric fluidized bed (AFB) combustion[J]. Energ
Fuel, 14: 164-168.
Mastral, A. M., Garcia, T., Callen, M. S et al., 2001. Effects of limestone on
polycyclic aromatic hydrocarbon emissions during coal atmospheric
fluidized bed combustion, J. Energ. Fuel, 15: 1469-1474.
Mauderly, J. L., Chow, J. C., 2008. Health effects of organic aerosols. Inhalation
Toxicology 20, 257–288.
Mazumbar, S., Schimmel, H., Higgins, I. T. T. 1982. Relation of daily mortality to
air pollution: an analysis of 14 London winters, 1958/59–1971/72.
Archives of Environmental Health; 37:213–220.
Mead, R. W., Brajer, V. 2006. Valuing the adult health effects of air pollution in
Chinese cities. Ann N Y Acad Sci.1076: 882–892
Mei, S. F., 2008. Production, uses and status of international and domestic
standards for PFOS/PFOA in China. Organo-Fluorine Industry 1, 21e25.
Michael, S., Montag, M., Dott, W., 2013. Pro-inflammatory effects and oxidative
stress in lung macrophages and epithelial cells induced by ambient
particulate matter. Environ Pollut 183, 19-29.
Midasch, O., Drexler, H., Hart, N., Beckmann, M. W., & Angerer, J. 2007.
Transplacental exposure of neonates to perfluorooctanesulfonate and
perfluorooctanoate: a pilot study. International archives of occupational
and environmental health, 80(7), 643-648.
Mignatti, P., & Rifkin, D. B. 1993. Biology and biochemistry of proteinases in
tumor invasion. Physiological reviews, 73(1), 161-195
157
Miguel, A. H., & Pereira, P. A. P. 1989. Benzo(k)fuoranthene,
benzo(ghi)perylene, and indeno (1,2,3,-cd) pyrene: New tracers of
automotive emissions in receptor modeling. Aerosol Science and
Technology, 10, 292–295. doi:10.1080/02786828908959265.
Miller, A. 2003. Presentation at the Conference ―Particulate Matter: Atmospheric
Sciences, Exposure, and the Fourth Colloquium on PM and Human
Health,‖ Pittsburgh, PA, March 31–April 4.
Miller, K. A., Siscovick, D. S., Sheppard, L., Shepherd, K., Sullivan, J. H.,
Anderson, G. L., & Kaufman, J. D. 2007. Long-term exposure to air
pollution and incidence of cardiovascular events in women. New England
Journal of Medicine, 356(5), 447-458.
Miller, R. L, Garfinkel, R., Horton, M., et al. 2004. Polycyclic aromatic
hydrocarbons, environmental tobacco smoke, and respiratory symptoms in
an inner-city birth cohort. Chest. 126(4): 1071–1078.
Millman, A., Tang, D., & Perera, F. P. 2008. Air pollution threatens the health of
children in China. Pediatrics, 122(3), 620-628.
Ministry of Environmental Protection of China. 2008.
(http://chm.pops.int/Portals/0/Repository/addinfo_2008/UNEP-POPS-
POPRC-SUB-F08-PFOS-ADIN-CHI. English.pdf ).
Mode, A., Gustafsson, J. A., 1998. Down-regulation of cytochrome P450 2c
family members and positive acute-phase response gene expression by
peroxisome proliferator chemicals. Mol. Pharmacol. 54, 463–473.
Mohanraj, R., Solaraj, G., & Dhanakumar, S. 2011. Fine particulate phase PAHs
in ambient atmosphere of Chennai metropolitan city, India. Environmental
Science and Pollution Research, 18(5), 764-771.
Molina, M. J., & Molina, L. T. 2004. Megacities and atmospheric pollution.
Journal of the Air & Waste Management Association, 54(6), 644-680.
Moody, C., Hebert, G., Strauss, S., and Field, J. J. Environ. Monit., 2003, 5(2),
341.
Morel, F. M., Kraepiel, A. M., & Amyot, M. 1998. The chemical cycle and
bioaccumulation of mercury. Annual review of ecology and systematics,
543-566.
Moriwaki, H., Takata Y., and Arakawa R. 2003. Concentrations of
perfluorooctane sulfonate (PFOS) and perfluorooctanoic acid (PFOA) in

158
vacuum cleaner dust collected in Japanese homes. J. Environ. Monit.,
2003, 5, 753–757
Motley, H. L., Smart, R. H., & Leftwich, C. I. 1959. Effect of polluted Los
Angeles air (smog) on lung volume measurements. Journal of the
American Medical Association, 171(11), 1469-1477.
National Bureau of Statistics of China, 2006. China statistical yearbook 2006.
Beijing: China Statistics Press.
National Center for Environmental Assessment [Research Triangle Park N.C.],
2003. Air quality criteria for particulate matter. National Center for
Environmental Assessment-RTP Office, Office of Research and
Development, U.S. Environmental Protection Agency, Research Triangle
Park, NC.
National Research Council, 1993. Pesticides in the Diets of Infants and Children.
Washington, DC: National Academy Press.
Natural Resources Defense Council. China‘s clean energy project. 2007.
Available at: www.nrdc.org/air/energy/china/cleanpower.asp. Accessed
August 8, 2007.
NCBI. 2015. chymotrypsin-like elastase family, member 3B, retrieved on April
17, 2015 from http://www.ncbi.nlm.nih.gov/gene/23436.
Nebert, D. W., Dalton, T. P., Okey, A. B., & Gonzalez, F. J. 2004. Role of aryl
hydrocarbon receptor-mediated induction of the CYP1 enzymes in
environmental toxicity and cancer. Journal of Biological Chemistry,
279(23), 23847-23850.
Nel A, Xia, T., Madler, L., Li, N., 2006.Toxic potential of materials at the
nanolevel. Science, 311:622–627.
Nelson, J. W., Hatch, E. E., & Webster, T. F. 2010. Exposure to polyfluoroalkyl
chemicals and cholesterol, body weight, and insulin resistance in the
general US population. Environmental health perspectives
(Online),118(2), 197.
Nemery, B., Hoet, P. H., Nemmar, A. 2001.The Meuse Valley for of 1930: an air
pollution disaster. Lancet, 357:704–708.
Nesatyy, V. J., Suter, M. J. F. 2007. Proteomics for the analysis of environmental
stress responses in organisms. Environ. Sci. Technol, 41 (20), 6891−6900

159
Niu, Y., He, L., Hu, M., Zhang, J., Zhao, Y. L. 2006. Pollution characteristics of
atmospheric fine particles and their secondary components in the
atmosphere of Shenzhen in summer and in winter. Sci China Ser B Chem,
49(5): 466–74.
OECD (Organisation for Economic Co-operation and Development), 2002.
Emission Scenario Document on Metal Finishing ENV/JM/MONO p. 23.
Ohnishi, S., Kawanishi, S. 2002. Double base lesions of DNA by a metabolite of
carcinogenic benzo[a]pyrene. Biochemical and Biophysical Research
Communications, 290:778–782.
Okuda, T., Okamoto, K., Tanaka, S., Shen, Z., Han, Y., Huo, Z., 2010.
Measurement and source identification of polycyclic aromatic
hydrocarbons (PAHs) in the aerosol in Xi'an, China, by using automated
column chromatography and applying positive matrix factorization (PMF).
Sci Total Environ 408, 1909-1914.
Olsen, G. W., Burris, J. M., Ehresman, D. J., Froehlich, J. W., Seacat, A. M.,
Butenhoff, J. L., Zobel, L. R., 2007. Half-life of serum elimination of
perfluorooctanesulfonate, perfluorohexanesulfonate and
perfluorooctanoate in retired fluorochemical production workers. Environ.
Health Perspect. 115, 1298–1305.
Osornio Vargas, A. R., Serrano, J., Rojas Bracho, ., Miranda, J., arc ´a Cuellar,
C., Reyna, M. A., Flores, G., Zuk, M., Quintero, M., Va´ zquez, I.,
Sa´nchez-Pe´ rez, Y., Lo´ pez, T., Rosas,I., 2011. In vitro biological
effects of airborne PM2.5 and PM10 from a semi-desert city on the Mexico–
US border.Chemosphere83, 618–626.
Ozaki K, Nagata M, Suzuki M, Fujiwara T, Miyoshi Y, Ishikawa O, Ohigashi H,
Imaoka S, Takahashi E, Nakamura Y. 1998. Isolation and characterization
of a novel human pancreas-specific gene, pancpin, that is down-regulated
in pancreatic cancer cells. Genes Chromosomes Cancer, 22:179–185.
Park, E. J., Roh, J., Kim, Y., Park, K., Kim, D. S., Yu, S. D., 2011. PM2.5
collected in a residential area induced Th1-type inflammatory responses
with oxidative stress in mice. Environ Res 111, 348-355.
Pathak, R. K., Wu, W. S., and Wang, T., 2009. Summertime PM2.5 ionic species
in four major cities of China: nitrate formation in an ammonia-deficient
160
atmosphere, Atmos. Chem. Phys., 9, 1711-1722, doi: 10.5194/acp-9-1711-
2009.
Paul A. G, Jones K. C, Sweetman A. J. 2008. A first global production, emission,
and environmental inventory for perfluorooctane sulfonate. Environ Sci
Technol, 43:386–92.
Pearlman, M. E, Finklea, J. F, Creason, J. P, Shy, C. M., Young, M. M, Horton, R.
J. 1971. Nitrogen dioxide and lower respiratory illness. Pediatrics; 47:391–
398.
Peluso, M., Munnia, A., Hoek, G., Krzyzanowski, M., Veglia, F., Airoldi, L., &
Vineis, P. 2005. DNA adducts and lung cancer risk: a prospective study.
Cancer Research, 65(17), 8042-8048.
Perera, F. P., Rauh, V., Tsai, W. Y., et al. 2003. Effects of transplacental
exposure to environmental pollutants on birth outcomes in a multi-ethnic
population. Environ Health Perspect. 111(2): 201–205
Perera, F., Viswanathan, S., Whyatt, R., Tang, D., Miller, R. L, Rauh, V. 2006.
Children‘s environmental health research: highlights from the Columbia
Center for Children‘s Environmental Health. Ann N Y Acad Sci.1076:15–
28
Pershagen, G., Simonato, L. 1990. Epidemiological evidence on air pollution and
cancer. In: Tomatis, L. (ed.), Air Pollution and Human Cancer, Springer-
Verlag, Heidelberg, pp. 63–74.
Peters, J. M., Cheung, C., and Gonzalez, F. J. 2005. Peroxisome proliferator
activated receptor-alpha and liver cancer: Where do we stand? J. Mol.
Med. 83, 774–785.
Pinkerton, K. E. 2002. A critical review of the particulate matter toxicology
literature for senate bill 25, review of the particulate matter standard.
Pinkerton, K. E. and Joad, J. P. 2000. The mammalian respiratory system and
critical windows of exposure for children‘s health. EHP 108(3):457-462.
Plopper, C. G., Fanucci, M. V. 2000. Do urban environmental pollutants
exacerbate childhood lung disease? Environ Health Perspect.
108(6):A252–A253
Plutzky, 2011. The PPAR-RXR transcriptional complex in the vasculature: energy
in the balance, Circ. Res. 108 (8): 1002–16.
161
Plutzky, J., 2000. Emerging concepts in metabolic abnormalities associated with
coronary artery disease. Curr. Opin. Cardiol. 15:416–21.
Poma, A., Arrizza, L., Picozzi, P., Spano, L. 2002. Monitoring urban air
particulate matter (fractions PM2.5 and PM10) genotoxicity by plant
systems and human cells in vitro: a comparative analysis. Teratogenesis,
Carcinogenesis, and Mutagenesis; 22:271–284.
Pope III, C. A., Burnett, R. T., Thun, M. J., Calle, E. E., Krewski, D., Ito, K., &
Thurston, G. D. 2002. Lung cancer, cardiopulmonary mortality, and long-
term exposure to fine particulate air pollution. Jama, 287(9), 1132-1141.
Pope, C. A. III and Dockery, D. W. 2006. Health effects of fine particulate air
pollution: Lines that connect. Journal of the Air & Waste Management
Association, 56(6), pp. 709–742.
Poschl, U., 2005, Atmospheric aerosols: composition, transformation, climate and
health effects, Angew. Chem. Int. Ed. Engl. 44, 7520.
Potempa J, Korzus E, Travis J. 1994. The serpin superfamily of proteinase
inhibitors: structure, function, and regulation. J Biol Chem, 269:15957–
15960.
Pottinger, M., Stecklow, S., & Fialka, J. J. 2004. Invisible export: a hidden cost of
China‘s growth: mercury migration. The Wall Street Journal, 20.
Prahalat, A. K., Soukup, J. M., Inmon, J., Willis, R., Ghio, A. J., Becker S,
Gallagher, J. E. 1999. Ambient air particles: effects on cellular oxidant
radical generation in relation to particulate elemental chemistry.
Toxicology and Applied Pharmacology; 158:81–91.
Prevedouros, K., Cousins, I. T, Buck, R. C. 2006. Sources, fate and transport of
perfluoro carboxylates. Environ Sci Technol, 40:32–45.
Pritchard, R. J., Ghio, A. J., Lehmann, J. R. 1996. Oxidant generation and lung
injury after particulate air pollutant exposure increase with the
concentrations of associated metals. Inhal Toxicol 8:457–477.
Puga, A., Barnes, S. J., Chang, C., Zhu, H., Nephew, K. P., Khan, S. A., Shertzer,
H. G. 2000. Activation of transcription factors activator protein-1 and
nuclear factor kappa B by 2,3,7,8-tetrachlorodibenzo-p-dioxin. Biochem
Pharmacol. 59:997- 1005.

162
Qian, Z., Chapman, R. S, Hu, W., Wei, F., Korn, L. R, Zhang, J. J. 2004b. Using
air pollution based community clusters to explore air pollution health
effects in children. Environ Int.30(5):611–620
Qian, Z., Zhang, J. J., Korn, L. R., Wei, F., Chapman, R. S. 2004a.
Exposureresponse relationships between lifetime exposure to residential
coal smoke and respiratory symptoms and illnesses in Chinese children. J
Expo Anal Environ Epidemiol. 14(suppl 1): S78–S84.
Qui, X. B., Cadenas, E. 1997. The role of NAD(P)H: quinone oxidoredictase in
quinonemediated p21 induction in human colon carcinoma cells. Archives
of Biochemistry and Biophysics, 346:241–251.
Ramanathan, V. C. P. J., Crutzen, P. J., Kiehl, J. T., & Rosenfeld, D. 2001.
Aerosols, climate, and the hydrological cycle. science, 294(5549), 2119-
2124.
Ravindra, K., Sokhi, R., & Van Grieken, R. 2008. Atmospheric polycyclic
aromatic hydrocarbons: source attribution, emission factors and regulation.
Atmospheric Environment, 42(13), 2895-2921.
Ravindra, K., Sokhi, R., & Van Grieken, R. 2008. Atmospheric polycyclic
aromatic hydrocarbons: source attribution, emission factors and regulation.
Atmospheric Environment, 42(13), 2895-2921.
Ray, P. D., Huang, B. W., & Tsuji, Y. 2012. Reactive oxygen species (ROS)
homeostasis and redox regulation in cellular signaling. Cellular signalling,
24(5), 981-990.
Reddy, J. K. 2001. Nonalcoholic steatosis and steatohepatitis. III. Peroxisomal
betaoxidation, PPAR alpha, and steatohepatitis, Am. J. Physiol.
Gastrointest. Liver Physiol. 281, G1333–G1339.
Reichle, H. G., Connors, V. S., Holland, J. A., Hypes, W. D., Wallio, H. A.,
Casas, J. C., & Hesketh, W. D. 1986. Middle and upper tropospheric
carbon monoxide mixing ratios as measured by a satellite‐borne remote
sensor during November 1981. Journal of Geophysical Research:
Atmospheres (1984–2012), 91(D10), 10865-10887.
Robinson, M.D., McCarthy, D.J. & Smyth, G.K. Edge, R., 2012. A bio-conductor
package for differential expression analysis of digital gene expression
data. Bioinformatics. 26, 139-140.

163
Roos, W. P., & Kaina, B. 2006. DNA damage-induced cell death by apoptosis.
Trends in molecular medicine, 12(9), 440-450.
Rosen, M. B., Schmid, J. R., Corton, J. C., Zehr, R. D., Das, K. P., Abbott, B. D.,
Lau, C. 2010. Gene expression profiling in wild-type and PPAR alpha-null
mice exposed to perfluorooctane sulfonate reveals ppar alpha-independent
effects. PPAR Res.
Rosen, M. B., Thibodeaux, J. R., Wood, C. R., Zehr, R. D., Schmid, J. E., & Lau,
C. 2007. Gene expression profiling in the lung and liver of PFOA-exposed
mouse fetuses. Toxicology, 239(1), 15-33.
Rosenbloom, J. 1984. Elastin: relation of protein and gene structure to disease.
Lab Invest 51:605–623
Ross, P. L. et al. 2004. Multiplexed protein quantitation in Saccharomyces
cerevisiae using amine reactive isobaric tagging reagents. Mol. Cell
Proteomics, 3, 1154-1169.
Sagai, M., Lim, M. S. P, Ichinose, T. 2000. Lung carcinogenesis by diesel exhaust
particles and the carcinogenic mechanism via reactive oxygens. Inhalation
Toxicology; 12:215–223.
Saito, N., Harada, K., Inoue, K., Sasaki, K., Yoshinaga, T., & Koizumi, A. 2004.
Perfluorooctanoate and perfluorooctane sulfonate concentrations in surface
water in Japan. Journal of occupational health, 46(1), 49-59.
Sasaki, K., Harada, K., Saito, N., Tsutsui, T,. Nakanishi, S., Tsuzuki, H., and
Koizumi A. 2003. Impact of Airborne Perfluorooctane Sulfonate on the
Human Body Burden and the Ecological System. Bull. Environ. Contam.
Toxicol. 71:408–413.
Sato, M. I. Z., Valent, G. U., Coimbrão, C. A., Coelho, M. C. L., Sanchez, P. S.,
Alonso, C. D., & Martins, M. T. 1995. Mutagenicity of airborne
particulate organic material from urban and industrial areas of São Paulo,
Brazil. Mutation Research/Environmental Mutagenesis and Related
Subjects, 335(3), 317-330.
Schafer, F. Q, Buettner, G. R. 2001. Redox environment of the cell as viewed
through the redox state of the glutathione disulfite/glutathione couple. Free
Radical Biology and Medicine, 30:1191–1212.
164
Schauer, C., Niessner, R., Poschl, U., 2003. Polycyclic aromatic hydrocarbons in
urban air particulate matter: decadal and seasonal trends, chemical
degradation, and sampling artifacts. Environmental Science and
Technology 37, 2861–2868.
Schecter, A., Birnbaum, L., Ryan, J. J., Constable, J. D. 2006. Dioxins: an
overview. Environ. Res. 101, 419.
Scheele, G., Bartelt, D., Bieger W. 1981. Characterization of human exocrine
pancreatic proteins by two-dimensional isoelectric focusing/sodium
dodecyl sulfate gel electrophoresis. Gastroenterology 80:461–473.
Scheffe, R. 2003. Presentation at the Conference ―Particulate Matter: Atmospheric
Sciences, Exposure, and the Fourth Colloquium on PM and Human
Health,‖ Pittsburgh, PA, March 31–April 4.
Schins, R. P., Lightbody, J. H., Borm, P. J., Shi, T., Donaldson, K., & Stone, V.
2004. Inflammatory effects of coarse and fine particulate matter in relation
to chemical and biological constituents. Toxicology and applied
pharmacology, 195(1), 1-11.
Schlesinger, R. 1995. Deposition and clearance of inhaled particles. In Concepts
in inhalation toxicology (O. a. H. McClellan R, R., F., ed., pp. 191-224.
Taylor and Francis, Washington, DC.
Schmitz, J. 2004. Maldigestion and malabsorption. In: Walker WA, Goulet O,
Kleinman RE, Sherman PM, Shneider BL, Sanderson IR (eds) Pediatric
Gastrointestinal Disease: Pathophysiology, Diagnosis, Management.
Decker, Hamilton, Canada, pp 8–20
Schrenk, H. H., Heimann, H., Clayton, G. D., Wexler, H., Gafafer, W. M. 1949.
Air pollution in Donora, Pa., USA. Us Public Health Bulletin, 306,
Washington DC.
Schwarze, P. E., Ovrevik, J., Hetland, R. B., Becher, R.,Cassee, F. R.,Lag, M.,
Lovik, M., Dybing, E., Refsnes, M., 2007. Importance of size and
composition of particles for effects on cells in vitro. InhalationToxicol.19,
17–22.
Seacat, A. M., Thomford, P. J., Hansen, K. J., Olsen, G. W., Case, M. T.,
Butenhoff, J. L., 2002. Sub chronic toxicity studies on
perfluoroctanesulfonate potassium salt in cynomolgus monkeys. Toxicol.
Sci. 68, 249–264.

165
Seifert, W. F., Bosma, A., Hendriks, H. F J., de Ruiter, G. C. F, van Leeuwen, R.
E. W., Knook, D. L., and Brouwer, A. 1989. Dual role of vitamin A in
experimentally induced liver fibrosis. In Cells of the Hepatic Sinusoid
(Wisse, E., Knook, D. L., and Decker, K.) pp. 43-48, Kupffer Cell
Foundation, Rijswijk, Netherlands.
Sexton, K. G., Jeffries, H. E., Jang, M., Kamens, R. M., Doyle, M., Voicu, I., &
Jaspers, I. 2004. Photochemical products in urban mixtures enhance
inflammatory responses in lung cells. Inhalation toxicology, 16(s1), 107-
114.
Shang, Q., Ren, X., Li, J. 2002. Estimation of arsenic accumulative intake and
residents‘ health effects in an air pollution area: relationship between
arsenic accumulative intake level and arsenicism prevalence [in Chinese].
Wei Sheng Yan Jiu. 31(5):349–351
Shauer, J. J., Kleeman, M. J., Cass, G. R., and Simoneit, B. R. T. 1999.
Measurement of emissions from air pollution sources C1 through C30
compounds from medium duty trucks, Environ. Sci. Technol., 33, 1578–
1587, 1999.
Shen, Z., Han, Y., Cao, J., Tian, J., Zhu, C., Liu, S., & Wang, Y. 2010.
Characteristics of traffic-related emissions: a case study in roadside
ambient air over Xi‘an, China. Aerosol Air Qual. Res, 10(3), 292-300.
Shipley, J. M., Hurst, C. H., Tanaka, S. S., DeRoos, F. L., Butenhoff, J. L., Seacat,
A. M., Waxman, D. J. 2004. Trans-activation of PPAR alpha and
induction of PPAR alpha target genes by perfluorooctane-based chemicals.
Toxicol. Sci. 80 (1), 151−160.
Shoeib, M., Harner, T., Webster, G. M., and Lee, S. C. 2011. Indoor Sources of
Poly- and Perfluorinated Compounds (PFCS) in Vancouver, Canada:
Implications for Human Exposure Environ. Sci. Technol. 45, 7999–8005.
Shoeib, M., Vlahos, P., Harner, T., Peters, A., Graustein, M., & Narayan, J. 2010.
Survey of polyfluorinated chemicals (PFCs) in the atmosphere over the
northeast Atlantic Ocean. Atmospheric Environment, 44(24), 2887-2893.
Shukla, A., Timblin, C., BeruBe, K., Gordon, T., Mckinney,, W., Driscoll, K.,
Vacek, P., Mossman, B. T. 2000. Inhaled particulate matter causes
expression of nuclearfactor (NF)-kappaB-related geres and oxidant-

166
dependent NF-kappaB activationin vitro. AM. J. Respri. Cell Mol. Biol.
23:182-7.
Silverman, G. A, Bird, P. I, Carrell, R. W, Church, F. C, Coughlin, P. B, Gettins,
P. G, Irving, J. A, Lomas, D. A, Luke, C. J, Moyer, R. W, Pemberton, P.
A, Remold-O'Donnell, E., Salvesen, G. S, Travis, J., Whisstock, J. C.
2001.The serpins are an expanding superfamily of structurally similar but
functionally diverse proteins: evolution, mechanism of inhibition, novel
functions, and a revised nomenclature. J. Biol. Chem, 276: 33293–33296.
Sin, D. W., Fung, W. H., Choi, Y. Y., Lam, C. H., Louie, P. K., Chow, J .C.,
Watson, J. G., 2005. Seasonal and spatial variation of solvent extractable
organic compounds in fine suspended particulate matter in Hong Kong. J
Air Waste Manag Assoc 55, 291-301.
Smith, M. T., Jones, R. M., Smith, A. H. 2007. Benzene exposure and risk of non-
Hodgkin lymphoma. Cancer Epidemiol Biomarkers Prev.16(3):385–391
So, M. K., Miyake, Y., Yeung, W. Y., Ho, Y. M., Taniyasu, S., Rostkowski, P. &
Lam, P. K. S. 2007. Perfluorinated compounds in the Pearl River and
Yangtze river of China. Chemosphere, 68(11), 2085-2095.
Sohlenius, A. K., Eriksson, A. M., Ho gstrom, C., Kimland, M., DePierre, J. W.
1993. Pharmacol. Toxicol,72:90- 93
Sorensen, M., Autrup, H., Moller, P., Hertel, O., Jensen, S. S., Vinzents, P.,
Knudsen, L. E., Loft, S. 2003. Linking exposure to environmental
pollutants with biological effects, Mutat. Res. 544, 255–271.
Sørensen, M., Daneshvar, B., Hansen, M., Dragsted, L. O., Hertel, O., Knudsen,
L., & Loft, S. 2003. Personal PM2.5 exposure and markers of oxidative
stress in blood. Environmental Health Perspectives, 111(2), 161.
South China Morning Post, 2015. Blanket of smog in Beijing hits start of Lunar
New Year getaway. Retrieved on 15 January 2015 from
http://www.scmp.com/news/china-insider/article/1406793/beijing-hit-first-
bout-charts-air-pollution-new-year
Speizer, F. E., Samet, J. M., 1994. Air pollution and lung cancer. In: Samet, J.M.
(Ed.), Epidemiology and Lung Cancer. Dekker, New York.
Spurny, K. R., 1996. Chemical mixtures in atmospheric aerosols and their
correlation to lung diseases and lung cancer occurrence in the general
population. Toxicol. Lett. 88, 271–277.

167
Squadrito, G. L., Cueto, R., Dellinger, B., & Pryor, W. A. 2001. Quinoid redox
cycling as a mechanism for sustained free radical generation by inhaled
airborne particulate matter. Free Radical Biology and Medicine, 31(9),
1132-1138.
Squadrito, G. L., Cueto, R., Dellinger, B., & Pryor, W. A. 2001. Quinoid redox
cycling as a mechanism for sustained free radical generation by inhaled
airborne particulate matter. Free Radical Biology and Medicine, 31(9),
1132-1138.
Squadrito, G. L., Cueto, R., Dellinger, B., & Pryor, W. A. 2001. Quinoid redox
cycling as a mechanism for sustained free radical generation by inhaled
airborne particulate matter. Free Radical Biology and Medicine, 31(9),
1132-1138.
State Environmental Protection Administration of China, 2007. The 2006 report
on the State of the environment in China. Beijing: State Environmental
Protection Administration. See also:
http://www.sepa.gov.cn/ztbd/sjhjr/2007hjr/tpbd56/200706/P02007060532
3023573963.pdf.
Stewart, G. S., Wang, B., Bignell, C. R., Taylor, A. M. R., & Elledge, S. J. 2003.
MDC1 is a mediator of the mammalian DNA damage checkpoint. Nature,
421(6926), 961-966.
Su, X. T., Wang, H. J., Song, S., & Zhang, Z. B. 2011. Radiative Force and
Temperature Response of Dust Aerosol over East Asia in Recent Decade
J. Plateau Meteorology, 5, 018.
Sugita, K., Koyano, M., Endo, O., Watanabe, T., Yamashita, N., Ushiyama, A., &
Suzuki, G. 2007. Perfluorinated compound levels in urban airborne
particles–recent aspects in Tokyo area. Organohalogen. Compd, 69, 2885-
2888.
Sun, P., Blanchard, P., Brice, K. A, Hites, R. A 2006. Trends in polycyclic
aromatic hydrocarbon concentrations in the Great Lakes atmosphere.
Environ Sci Technol 40:6221–6227.
Sunyer, J., Basagana X. 2001.Particles, and not gases, are associated with risk of
death in patients with chronic obstructive pulmonary disease. International
Journal of Epidemiology; 30:1138–1140.

168
Sweetman, A. J., Paul, A. G., Jones, K. C., 2009. A first global production,
emission, and environmental inventory for perfluorooctane sulfonate.
Environmental Science & Technology 43, 386e392
Tachibana, C. H. R. I. S. T. I. N. E., & Stevens, T. H. 1992. The yeast EUG1 gene
encodes an endoplasmic reticulum protein that is functionally related to
protein disulfide isomerase. Molecular and cellular biology, 12(10), 4601-
4611.
Tan, F., Jin, Y., Liu, W., Quan, X., Chen, J., & Liang, Z. 2012. Global liver
proteome analysis using iTRAQ labeling quantitative proteomic
technology to reveal biomarkers in mice exposed to perfluorooctane
sulfonate (PFOS).Environmental science & technology, 46(21), 12170-
12177.
Tan, N. S., Michalik, L., Desvergne, B., Wahli, W. 2005. Multiple expression
control mechanisms of peroxisome proliferator-activated receptors and
their target genes. J Steroid Biochem Mol Biol, 93(2–5):99–105.
Tang. D., Li, T. Y., Liu, J. J., Chen, Y. H., Qu, L., Perera, F. P. 2006. PAH-DNA
adducts in cord blood and fetal and child development in a Chinese cohort.
Environ Health Perspect. 114(8): 1297–1300
Tao, F., Gonzalez-Flecha, B., & Kobzik, L. 2003. Reactive oxygen species in
pulmonary inflammation by ambient particulates. Free Radical Biology
and Medicine, 35(4), 327-340.
Thibodeaux, J. R., Hanson, R. G., Rogers, J. M., Grey, B. E., Barbee, B. D.,
Richards, J. H, et al. 2003. Exposure to perfluorooctane sulfonate during
pregnancy in rat and mouse. I: maternal and prenatal evaluations. Toxicol
Sci.74:369–81.
Tie, X., Wu, D., & Brasseur, G. 2009. Lung cancer mortality and exposure to
atmospheric aerosol particles in Guangzhou, China. Atmospheric
Environment, 43(14), 2375-2377.
Tien, E. S., Hannon, D. B., Thompson, J. T., Vanden Heuvel, J. P. 2006.
Examination of liganddependent coactivator recruitment by peroxisome
proliferator-activated receptor-alpha (PPARalpha). PPAR
Res;2006:69612.

169
Tittlemier, S. A., Pepper, K., Seymour, C., Moisey, J., Bronsson, R., Cao, X. L.,
Dabeka, R. W. 2007. Dietary exposure of Canadians to perfluorinated
carboxylates and perfluorooctane sulfonate via consumption of meat, fish
and fast food items prepared in their packaging. J. Agric. Food Chem. 55,
3203–3210.
Touloumi, G., Katsouyanni, K., Zmirou, D., Schwartz, J., Spix, C., de Leon, A. P.,
& Ponka, A. 1997. Short-term effects of ambient oxidant exposure on
mortality: a combined analysis within the APHEA project. American
journal of epidemiology, 146(2), 177-185.
Trasande, L, Landrigan, P. J, Schechter, C. 2005. Public health and economic
consequences of methyl mercury toxicity to the developing brain. Environ
Health Perspect.113(5):590–596
Tse, W. K. F., Sun, J., Zhang, H., Law, A. Y. S., Yeung, B. H. Y., Chow, S. C., &
Wong, C. K. C. 2013. Transcriptomic and iTRAQ proteomic approaches
reveal novel short-term hyperosmotic stress responsive proteins in the gill
of the Japanese eel (Anguilla japonica). Journal of proteomics, 89, 81-94.
Tseng, W. P. 1977. Effects and dose-response relationships of skin cancer and
black foot disease with arsenic. Environ Health Perspect.19:109–119
UNEP, 2009. The conference of the parties 4 of the Stockholm Convention (COP
4) in Geneva placed perfluorooctane sulfonate and perfluorooctane
sulfonyl fluoride (PFOS and PFOSF) in Annex B. Available from:
http://chm.pops.int/.
United Nations Economic Commission for Europe (UNECE), 1998. ECE/EB[Z].
Air/60.
Upham, B. L., Deocampo, N. D., Wurl, B., Trosko. 1998. J. E. Int. J. Cancer, 78,
491-495.
USEPA, 1996b. Method 3620B: Florisil Cleanup.US Environmental Protection
Agency, Washington, DC.
USEPA, 1996c. Method 8270C: Semivolatile Organic Compounds by Gas
Chroma- tography/Mass Spectrometry (GC/MS). US Environmental
Protection Agency, Washington, DC.
USEPA, 2013. National Ambient Air Quality Standards for Particulate Matter.
http:// www.gpo.gov/fdsys/pkg/FR-2013-01-15/pdf/2012-30946.pdf.

170
USEPA. 1998. Particulate Matter Research Needs for Human Health Risk
Assessment to Support Future Reviews of the National Ambient Air
Quality Standards for Particulate Matter, January 15, EPA Report
EPA/600/R-97/132F, Office of Research and Development, Research
Triangle Park, NC.
USEPA. 2004. Air Quality Criteria for Particulate Matter. Fourth External Review
Draft, EPA Report, EPA/600/P-99/002. Office of Research and
Development, Research Triangle Park, NC.
Val, S., Martinon, L., Cachier, H., Yahyaoui, A., Marfaing, H., Baeza-Squiban,
A., 2011. Role of size and composition of traffic and agricultural aerosols
in the molecular responses triggered in airway epithelial cells. Inhal
Toxicol 23, 627-640.
Valavanidis, A., Fiotakis, K., & Vlachogianni, T. 2008. Airborne particulate
matter and human health: toxicological assessment and importance of size
and composition of particles for oxidative damage and carcinogenic
mechanisms. Journal of Environmental Science and Health, Part C, 26(4),
339-362.
Vasilakos, C., Levi, N., Maggos, T., Hatzianestis, J., Michopoulos, J., Helmis, C.,
2007. Gas-particle concentration and characterization of sources of PAHs
in the atmosphere of a suburban area in Athens, Greece. J Hazard Mater
140, 45-51.
Vestreng, V., Klein, H. 2002. Emission data reported to UNECE/ EMEP: Quality
Assurance and Trend Analysis and Presentation of WebDab. MSC-W
Status Report 2002[C]. EMEP-MSC-W Note 1/ 2002. Meteorological
Synthesizing Centre-West. Oslo, Norway
Villeneuve, A. L., Blankenship, J. P., Giesy M. S., Denison, W. G. Helferich
(Eds.). 1998. Interactions between environmental xenobiotics and estrogen
receptor-mediated responses Toxicant–Receptor Interactions, Taylor and
Francis, Philadelphia, PA, USA , pp. 69–99
Vineis, P., Forastier,e F., Hoer. G., Lipsett, M. 2004. Outdoor air pollution and
lung cancer: recent epidemiological evidence. International Journal on
Cancer; 111:647–652.
Vineis, P., Hoek, G., Krzyzanowski, M., Vigna‐Taglianti, F., Veglia, F., Airoldi,
L., & Riboli, E. 2006. Air pollution and risk of lung cancer in a

171
prospective study in Europe. International journal of cancer, 119(1), 169-
174.
Wallington, T. J., Hurley, M. D., Xia, J., Wuebbles, D. J., Sillman, S., Ito, A.,
Penner, J. E., Ellis, D. A., Martin, J., Mabury, S. A., Nielsen, O. J.,
Sulbaek Andersen, M. P., 2006. Formation of C7F15COOH (PFOA) and
other perfluorocarboxylic acids during the atmospheric oxidation of 8:2
fluorotelomer alcohol. Environmental Science & Technology 40, 924e930.
Wan, H. T., Zhao, Y. G., Wei, X., Hui, K. Y., Giesy, J. P., & Wong, C. K. 2012.
PFOS-induced hepatic steatosis, the mechanistic actions on β-oxidation
and lipid transport. Biochimica et Biophysica Acta (BBA)-General
Subjects, 1820(7), 1092-1101.
Wan, Y., Yuan-yuan, L., Wei, X., Jun, C., Zi-quan, L., Huai-cai Zeng, L., Zhang
et al. 2010. "Alterations in tumor biomarker GSTP gene methylation
patterns induced by prenatal exposure to PFOS." Toxicology 274, no. 1:
57-64.
Wang, C. S., Hartsuck, J. A. 1993. Bile salt-activated lipase. A multiple function
lipolytic enzyme Biochim. Biophys. Acta, 166, pp. 1–19
Wang, C. S., Martindale, M. E., King, M. M., Tang, J. 1989. Bile-saltactivated
lipase: effect on kitten growth rate Am. J. Clin. Nutr, 49, pp. 457–463
Wang, D., He, L., Wei, S., Feng, X. 2006. Estimation of mercury emission from
different sources to atmosphere in Chongqing, China. Sci Total Environ.
366(2 3):722–728
Wang, H., Fu, L., Zhou, Y., Du, X., & Ge, W. 2010. Trends in vehicular
emissions in China's mega cities from 1995 to 2005. Environmental
Pollution, 158(2), 394-400.
Wang, M. and You, J. 2012. Mass spectrometry for protein quantification in
biomarker discovery. Methods Mol Biol, 815:199–225.
Wang, X., Cheng, H., Xu, X., Zhuang, G., Zhao, C., 2008. A wintertime study of
polycyclic aromatic hydrocarbons in PM (2.5) and PM (2.5-10) in Beijing:
assessment of energy structure conversion. J Hazard Mater 157, 47-56.
Wang, X., Wang, C. S., Tang, J., Dyda, F., & Zhang, X. C. 1997. The crystal
structure of bovine bile salt activated lipase: insights into the bile salt
activation mechanism. Structure, 5(9), 1209-1218.

172
Watkinson, W. P., Campen, M. J., Dreher, K. L., Su, W.Y., Kodavanti, U. P.,
Highfill, J. W. Costa, D. L. 2000. Thermoregulatory effects following
exposure to particulate matter in healthy and cardiopulmonary-
compromised rats. J. Therm. Biol. 25:131-137.
Watts, J. 2006. Doctors blame air pollution for China‘s asthma increases.
Lancet.368 (9537):719–720
Weather. org, 2015. Weather history, climate records and average. Retrieved on 4
May2015fromhttp://www.weather.org/weatherorg_records_and_averages.
htm.
Wenzel, S. E. 1997. Arachidonic acid metabolites: mediators of inflammation in
asthma. Pharmacotherapy: The Journal of Human Pharmacology and Drug
Therapy, 17(1P2), 3S-12S.
Whitcomb, D. C., & Lowe, M. E. 2007. Human pancreatic digestive
enzymes.Digestive diseases and sciences, 52(1), 1-17.
Whitcomb, D. C., 1999. Early trypsinogen activation in acute pancreatitis.
Gastroenterology 116:770–773.
WHO, UNDP, 2001. Environment and People‘s Health in China. WHO, UNDP,
Geneva/New York.
Whyatt, R. M., Jedrychowski, W., Hemminki, K., et al. 2001. Biomarkers of
polycyclic aromatic hydrocarbon-DNA damage and cigarette smoke
exposures in paired maternal and newborn blood samples as a measure of
differential susceptibility. Cancer Epidemiol Biomarkers Prev.10(6):581–
588
World Bank. 1997.China: Air, Land, and Water. Washington, DC: World Bank.
World Bank. 2007. Cost of Pollution in China. Washington, DC: World Bank.
World Health Organization, & World Health Organization. Regional Office for
Europe. 2006. Air quality guidelines: global update 2005: particulate
matter, ozone, nitrogen dioxide, and sulfur dioxide.World Health
Organization.
World Health Organization. 2002. The World Health Report – Reducing Risks to
Health, Promoting Healthy Life, Report, ISBN-13 9789241562072.
Wouters, E. F. 2005. Local and systemic inflammation in chronic obstructive
pulmonary disease. Proceedings of the American Thoracic Society, 2(1),
26-33.

173
Wright, H. T. 1993. Introns and higher-order structure in the evolution of serpins.
J. Mol. Evol, 36:136–143.
Xia, T., Kovochich, M., Nel, A. 2006. The role of reactive oxygen species and
oxidative stress in mediating particulate matter injury. Clinical,
Occupational and Environmental Medicine 2006; 5:817–836.
Xiao, G., Liu, Y. E, Gentz, R, et al. 1999. Suppression of breast cancer growth
and metastasis by a serpin myoepithelium-derived serine proteinase
inhibitor expressed in the mammary myoepithelial cells. Proc Natl Acad
Sci USA. 96(7):3700–3705. [PubMed: 10097100]
Xie, S., Wang, T., Liu, S., Jones, K. C., Sweetman, A. J., & Lu, Y. 2013.
Industrial source identification and emission estimation of perfluorooctane
sulfonate in China. Environment international, 52, 1-8.
Yamashita, N., So, M. K., Miyake, Y., Yeung, W. Y., Ho, Y. M., Taniyasu, S.,
Rostkowski, P., Zhou, B. S., Shi, X. J., Wang, J. X., Giesy, J. P., Yu, H.,
Lam, P. K. S., 2007. Perfluorinated compounds in the Pearl River and
Yangtze River of China. Chemosphere 68, 2085e2095.
Yamashita, N., Yeung, L. W. Y., Miyake, Y., Taniyasu, S., Wang, Y., Yu, H. X.,
So, M. K., Jiang, G.B., Wu, Y. N., Li, J. G., Giesy, J. P., Lam, P. K. S.,
2007. Perfluorinated compounds and total and extractable organic fluorine
in human blood samples from China. Environmental Science &
Technology 42, 8140e8145.
Yan, X.Y., T. Ohara, and H. Akimoto. 2006. Bottom-up estimate of biomass
burning in mainland China. Atmos. Environ. 40(27):5262–5273.
doi:10.1016/ j.atmosenv.2006.04.040
Yeung, L. W., Miyake, Y., Taniyasu, S., Wang, Y., Yu, H., So, M. K., & Lam, P.
K. 2008. Perfluorinated compounds and total and extractable organic
fluorine in human blood samples from China. Environmental science &
technology, 42(21), 8140-8145.
Young, C. J., Furdui, V. I., Franklin, J., Koerner, R. M., Muir, D. C. G., Mabury,
S. A., 2007. Perfluorinated acids in arctic snow: new evidence for
atmospheric formation. Environmental Science & Technology 41,
3455e3461.
174
Yu, L., Mai, B., Meng, X., Bi, X., Sheng, G., Fu, J., & Peng, P. A. 2006. Particle-
bound polychlorinated dibenzo-p-dioxins and dibenzofurans in the
atmosphere of Guangzhou, China. Atmospheric Environment, 40(1), 96-
108.
Zhang, H., Zhao, C., Li, X., et al. 2010b. Study of monocyte membrane proteome
perturbation during lipopolysaccharide-induced tolerance using iTRAQ-
based quantitative proteomic approach. Proteomics, 10:2780–9.
Zhang, J. J., Hu, W., Wei, F., Wu, G., Korn, L. R., Chapman R. S. 2002.
Children's respiratory morbidity prevalence in relation to air pollution in
four Chinese cities. Environ Health Perspect, 110:961–7.
Zhang, J. J., Smith, K. R., 2007. Household air pollution from coal and biomass
fuels in China: measurements, health impacts, and interventions. Environ
Health Perspect 115, 848-855.
Zhang, J. J., Smith, K. R., 2007. Household air pollution from coal and biomass
fuels in China: measurements, health impacts, and interventions. Environ
Health Perspect 115, 848-855.
Zhang, L., Liu, J., Hu, J., Liu, C., Guo, W., Wang, Q., & Wang, H. 2012. The
inventory of sources, environmental releases and risk assessment for
perfluorooctane sulfonate in China. Environmental Pollution, 165, 193-
198.
Zhang, M. Q, Zhu, Y. C, Deng, R. W. 2002. Evaluation of mercury emissions to
the atmosphere from coal combustion, China. Ambio.31(6):482–484.
Zhang, T., Sun, H. W., Wu, Q., Zhang, X. Z., Yun, S. H., & Kannan, K. 2010a.
Perfluorochemicals in meat, eggs and indoor dust in China: assessment of
sources and pathways of human exposure to perfluorochemicals.
Environmental science & technology, 44(9), 3572-3579.
Zhang, Y., Tao, S., Shen, H., & Ma, J. 2009. Inhalation exposure to ambient
polycyclic aromatic hydrocarbons and lung cancer risk of Chinese
population. Proceedings of the National Academy of Sciences, 106(50),
21063-21067.
Zhao, D., & Sun, B. 1986. Atmospheric pollution from coal combustion in China.
Journal of the Air Pollution Control Association, 36(4), 371-374.

175
Zhao, X., Wan. Z., Chen, G., Zhu, H., Jiang, S., Yao. J. 2002. Genotoxic activity
of extractable organic matter from urban airborne particles in Shanghai,
China. Mutat Res.514(1–2):177–192
Zhao, Y. G., Wan, H. T., Law, A. Y., Wei, X., Huang, Y. Q., Giesy, J. P., &
Wong, C. K. 2011. Risk assessment for human consumption of
perfluorinated compound-contaminated freshwater and marine fish from
Hong Kong and Xiamen. Chemosphere, 85(2), 277-283.
Zhao, Y. G., Wan, H. T., Law, A. Y., Wei, X., Huang, Y. Q., Giesy, J. P., ... &
Wong, C. K. 2011. Risk assessment for human consumption of
perfluorinated compound-contaminated freshwater and marine fish from
Hong Kong and Xiamen. Chemosphere, 85(2), 277-283.
Zhao, Y., Wang, S., Duan, L., Lei, Y., Cao, P., & Hao, J. 2008. Primary air
pollutant emissions of coal-fired power plants in China: Current status and
future prediction. Atmospheric Environment, 42(36), 8442-8452.
Zheng, M., Salmon, L. G., Schauer, J. J., Zeng, L., Kiang, C. S., Zhang, Y., &
Cass, G. R. 2005. Seasonal trends in PM2. 5 source contributions in
Beijing, China. Atmospheric Environment, 39(22), 3967-3976.
Zhifang, C., Qinfang, Q., & Xiangqian, F. 1998. A study on environmental
pollution monitoring and occupational health in the capital iron and steel
company, Beijing, China, using nuclear and related analytical techniques.
Zhou, J., Wang, T., Huang, Y., Mao, T., & Zhong, N. 2005. Size distribution of
polycyclic aromatic hydrocarbons in urban and suburban sites of Beijing,
China. Chemosphere, 61(6), 792-799.
Zoete, V., Grosdidier, A., Michielin, O. 2007. Peroxisome proliferator-activated
receptor structures: ligand specificity, molecular switch and interactions
with regulators. Biochim Biophys Acta 1771: 915–25.

176
CURRICULUM VITAE
Academic qualifications of the thesis author, BILLAH Md. Baki
- Received the Bachelor of Science in Zoology from Jahangirnagar
University, Savar, Dhaka, Bangladesh, 2006.
- Received the degree of Master of Science (M.Sc) in Zoology from
Jahangirnagar University, Savar, Dhaka, Bangladesh, 2007.
August 2015