Embed Size (px)
Citation preview

Homework Assignments – Math 122-01/02 – Spring 2016
Textbook: Calder & Calder, Technical Mathematics with Calculus, 6th Edition, Wiley, Inc. (ISBN-10: 0470464720, ISBN-13: 978-0470464724)
Assignment 1 Due date : Friday, January 22 Section 5.1, Page 159: #1-4, 10, 11, 14; Section 5.2, Page 163: Find the slope and y -intercept, and then plot the line in problems: #2, 4; Find vertex, axis of symmetry, focus, focal width, and then plot the parabola in: #6, 8; Section 4.1, Page 143: #2, 3, 7, 8; Section 4.2, Page 151: #3, 4, 6, 13, 14, 15, 29, 30, 32, 34;
Required Additional Exercises #1 – 5 (below).
Instructions In problems 1-3, plot the function and indicate its domain and range.
1. f ( x ) = ⎪⎩
⎪⎨⎧
≤≤+
<≤
52 1
20
xifx
xifx 2. f ( x ) =
⎪⎪⎩
⎪⎪⎨
⎧
≤≤−
<<
52 3
20 1
4
2xifx
xifx 3. f ( x ) =
x
|x|for all 0≠x .
4. Determine the value of f [ f ( x ) ] for the function f in problem 3 above. 5. Find the exact coordinates of the square DEFG inscribed in ABC given that A = ( 0 , 0 ) , B = ( 2 , 4 ) and C = ( 5 , 0 ).
Assignment 2 Due date : Monday, February 1 Section 23.1, Page 745: #2, 3, 7, 8, 9, 14, 15, 17, 18, 23, 25, 26, 38.
Required Additional Exercises #1 – 4 (below).
1. (a) Sketch a graph of the function: f ( x ) = ⎩⎨⎧
>
≤−
0 1
0 1
xif
xifx .
(b) Use the formula for f from part (a) to determine the value of each of the following limits, if they exists.
(i) )(lim0
xfx −→
(ii) )(lim0
xfx +→
(iii) )(lim0
xfx→
2. (a) Sketch a graph of the function: f ( x ) =
⎪⎪⎩
⎪⎪⎨
⎧
>−
=
<≤−
−<−
1 4
1 4
11
1 2
xifx
xif
xifx
xifx
.
(b) Use the formula for f from part (a) to determine the value of each of the following limits, if they exists.
(i) )(lim1
xfx −−→
(ii) )(lim1
xf x +−→
(iii) )(lim1
xfx −→
(iv) )(lim1
xfx −→
(v) )(lim1
xfx +→
(vi) )(lim1
xfx→

3
Assignm D
S U
p T
i
R
In In A
3. A graph of th
(a) State the d
(b) Use the gr
( i ) lim1
gx +−→
(iv) lim0
gx −→
4. (a) Write a p shown in
(b) State the
(c) Determin
ment 3 Due date : MSection 23.3Use the methodproblems: #1, To find the slop
in each of the fo Required Adnstructions n problems 1 -4,
Assume that each
1.
3.
e function y = g
domain and rang
raph to determine
)(xg (ii) lim1 x −−→
)(xg (v) lim0 x→
piecewise definitin the figure.
domain and ran
ne the limits: lim x→
Monday, Feb3, Page 758:d of Example 14, 6, 8, 9, 11, 1
pe of the graph
dd
following probl
dditional Ex
estimate the sloph rectangle in the
g ( x ) is shown in
ge of g .
e each of the lim
)(xg−
(iii) limx→
)(m0
xg+
(vi) lix→
on for the functi
nge of g .
)(m1
xg+
, (lim1
xgx −→
bruary 8 : 4, Page 751, to 12.
h of y = f ( x )
)a(fdxdy
ax
′==
lems: #13, 15
xercises
pe of the curve at grid has dimens
n the figure.
its:
)(m1
xg−
)(m0
xg→
.
on y = g ( x )
)x .
find the deriva
at the given va
xa(flimx Δ
Δ+=
→Δ
0
5, 17, 19.
#1 – 7 (below
t the point P. sion 1 × 1.
2.
4.
ative of y = f (
alue, x = a, eva
x)a(f)x
Δ−
w).
( x ) in each of
aluate the limit
f the following
t:
5. Assign one of the following descriptors to each point A, B, C, D, E, F in the figure:
• large positive slope • small positive slope • zero slope • negative slope with small magnitude • negative slope with large magnitude.
6. Estimate the value of f ’ (1) in the figure below. 7. Find the equation of the tangent line to y = f (x) at the point P in the figure below.
Assignment 4 Due date : Wednesday, February 17
Exercises #1 – 12.
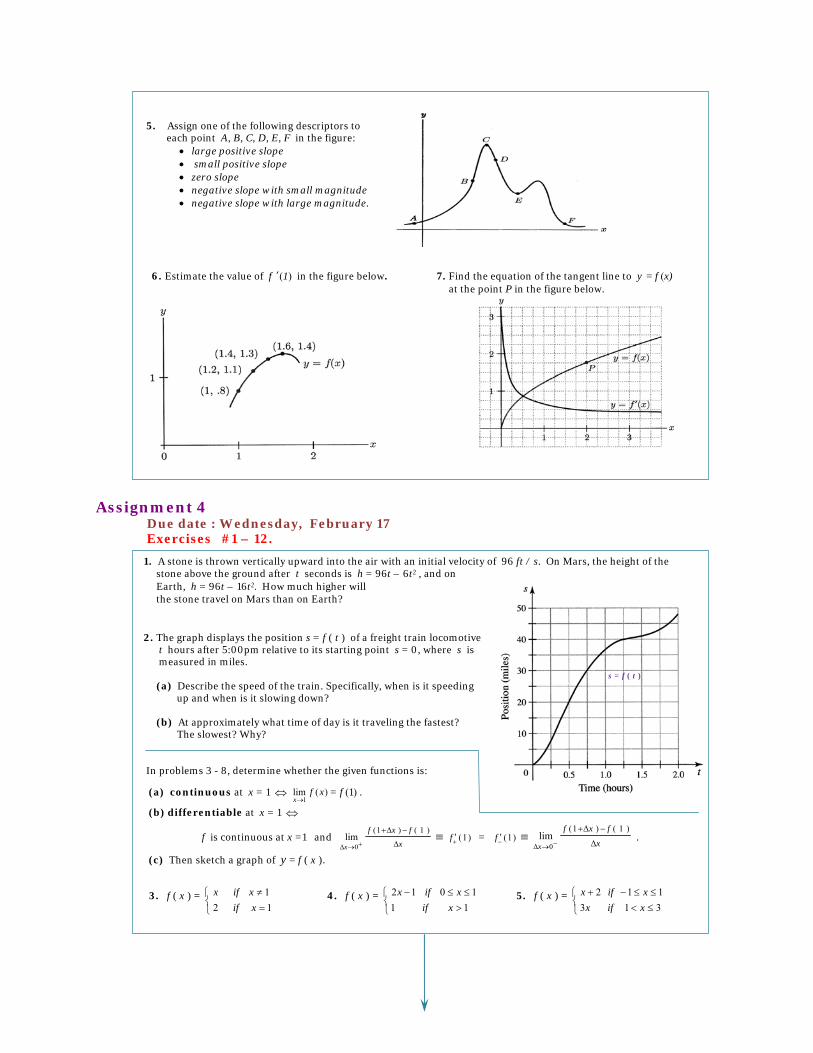
1. A stone is thrown vertically upward into the air with an initial velocity of 96 ft / s. On Mars, the height of the stone above the ground after t seconds is h = 96t – 6t2 , and on Earth, h = 96t – 16t2. How much higher will the stone travel on Mars than on Earth? 2. The graph displays the position s = f ( t ) of a freight train locomotive t hours after 5:00pm relative to its starting point s = 0, where s is measured in miles. (a) Describe the speed of the train. Specifically, when is it speeding up and when is it slowing down? (b) At approximately what time of day is it traveling the fastest? The slowest? Why? In problems 3 - 8, determine whether the given functions is:
(a) continuous at x = 1 ⇔ )(lim1
xfx→
= f (1) .
(b) differentiable at x = 1 ⇔
f is continuous at x =1 and x
f x f
x Δ
)1( )Δ 1 (
0Δlim
−+
+→≡ ) 1 (+′f = ) 1 (−′f ≡
x
f x f
x Δ
)1( )Δ 1 (
0Δlim
−+
−→ .
(c) Then sketch a graph of y = f ( x ).
3. f ( x ) = ⎩⎨⎧
=≠
1 2 1
xifxifx 4. f ( x ) =
⎩⎨⎧
>≤≤−1 1
10 12 xif
xifx 5. f ( x ) = ⎩⎨⎧
≤<≤≤−+
31 3 11 2
xifxxifx
s = f ( t )

6. f ( x ) = ⎪⎩
⎪⎨⎧
≤≤−<≤−31 1
11 -1 2
xifxxifx 7. f ( x ) =
⎪⎩
⎪⎨⎧
≤≤−<≤−31 23 11 3
xifxxifx 8. f ( x ) =
⎪⎩
⎪⎨⎧
=
≠−
1 0
1 1
1
xif
xifx
In problems 9 and 10, f is defined for all x except for one value, c. If possible, assign a value to f at c in order to make f continuous at c.
9. f ( x ) = 4
122
+−+
xxx , x ≠ –4 10. f ( x ) =
xx 36)6( 2 −+ , x ≠ 0
11. For what number a will the function f ( x ) = ⎪⎩
⎪⎨⎧
>≤+−
1 1 )( 2
xifaxifaax be both continuous and
differentiable at x = 1 ? Sketch the graph of y = f ( x ) using this particular value of a. 12. Explain in words why the function described in each case below is either continuous everywhere on its domain, or if instead, it possesses discontinuities. Then sketch a rough graph of the function.
(a) The temperature, T, (as a function of time) of a pitcher of ice water left to stand on a table for several hours in a 70o F room.
(b) The cost, C, (as a function of time) for parking at the Millennium Park Garage, 5 S. Columbus Drive, in downtown Chicago for anywhere from 0 to 24 hours. The parking rates are: $22 for 0 to 90 minutes $28 for 90 minutes to 2 hours $32 for 2 hours to 8 hours $39 for 8 to 24 hours.
Assignment 5 Due date : Friday, February 26 Section 23.4, Page 764: #1, 2, 8, 12, 13, 18, 20, 22, 28, 35, 46, 49, 61. Section 23.5, Page 769: #2, 9, 13, 17, 20, 31. Section 23.6, Page 775: #2, 13, 14, 17, 21, 25, 30, 31, 33, 37, 38, 43.
Required Additional Exercises #1 – 2 (below).
1. The acceleration due to gravity, g, varies with height above the surface of the earth in a certain way. If you go down below the surface of the earth, then g varies in a different way. It can be shown that g is given by:
⎪⎪⎩
⎪⎪⎨
⎧
≥
<≤=
Rrforr
GM
RrforR
GMr
rg
0 ) (
2
3
where R is the radius of the earth, M is the mass of the earth, G is the gravitational constant, and r is the
distance to the center of the earth. (a) Sketch a graph of g against r for r > 0.
(Note: Since r is the independent variable, you should measure r along the horizontal axis.)
(b) Is g continuous at r = R ? Explain your answer.
(c) Compute the piecewise formula for g’( r ) and investigate whether or not g is differentiable at r = R . 2. Look at the graph of f ( x ) = ( ) 2 1 2 00010 .x + in the figure. This graph appears to have a sharp corner at x = 0. Does it? Is f differentiable at x = 0 ? Justify your answers.

Hx 2 + y 2L 2 = x 2 - y 2
x
y
Assignment 6 Due date : Monday, March 7 Section 23.7, Page 782: #15, 16, 20, 21, 23, 24, 25, 26, 27, 28, 39.
Required Additional Exercises # 1 – 16 (below).
Instructions: In problems 1 – 15, find the derivative of y in each case.
1. y = 3)72( −x 2. y = 42 )13( +x 3. y = 4)94( 3 xx −
4. y = 322 )1( )3( xx −+ 5. y = 322 )9( x− 6. y = x23 −
7. y = 3 2 729 ++ xx 8. y = 122+− xx 9. y =
2
3 12
x
x −
10. y = 1
1
−
+
x
x 11. y =
1
562
+
−
x
x 12. y =
xx
x
23
322
−
+
13. y = 4
2 1⎟⎟⎠
⎞⎜⎜⎝
⎛+ xx 14. y = 52 )1( −xx 15. y =
12)14(
2
3
+
−
xx
16. Use calculus to find the coordinates of the two points along the graph of y = x2 whose tangent lines pass through point P = ( 1 , - 3 ). Then sketch a graph which displays both the parabola and its tangent lines which intersect at P. Also, determine the angles of inclinations of these tangent lines. (Recall, m = tan α, if α is the inclination of the line with slope m.)
Assignment 7 Due date : Monday, March 21 Exercises # 1 – 4 (below).
Refer to the lecture notes: http://mypages.iit.edu/~maslanka/ImplicitDiff.pdf and http://mypages.iit.edu/~maslanka/PolarConversion.pdf for details on implicit differentiation, the conversion of equations from rectangular to polar coordinates, and plotting in polar coordinates. 1. (a) Use implicit differentiation to find the slope and inclination of the tangent line
to the graph of the cardioid: ( x 2 + y 2 + y ) 2 = x 2 + y 2
at the points P = ( 1 , 0 ) and Q = ( - 1 , 0 ).
(b) Set x = r cos θ and y = r sin θ in the equation from (a) and simplify it, to obtain the
polar equation of the cardioid: r = 1 - sin θ .
(c) Sketch a careful graph which displays the cardioid and its tangent lines at P and Q. 2. (a) Use implicit differentiation to find the slope and inclination of the tangent line
to the graph of the circle: ( x - 1 ) 2 + y 2 = 1
at the point P = ( 21 ,
23 ).
(b) Set x = r cos θ and y = r sin θ in the equation from (a) and simplify it, to obtain the
polar equation of the circle: r = 2 cos θ .
(c) Sketch a careful graph which displays the circle and its tangent line at P. 3. (a) Use implicit differentiation to find the slope and inclination of the tangent line
to the graph of the parabola: y 2 = 4 x
at the points P = ( 1 , 2 ) and Q = ( 4 , - 4 ).
(b) Set x = r cos θ and y = r sin θ in the equation from (a) and simplify it, to obtain the
polar equation of the cardioid: r = 4 cot θ csc θ .
(c) Sketch a careful graph which displays the parabola and its tangent lines at P and Q.
4. (a) Use implicit differentiation to find dxdy
for the lemniscate: ( x 2 + y 2 ) 2 = x 2 - y 2 .
(b) Set x = r cos θ and y = r sin θ in the
equation from (a) and simplify it, to
obtain the polar equation of the lemniscate.

Assignment 8 Due date : Monday, March 28 Section 25.4 Page 835: #6, 8, 10, 13. Required Additional Exercises # 1 – 16 (below).
Refer to the lecture notes (http://mypages.iit.edu/~maslanka/ExtremeValues.pdf) for details on relative and absolute extreme values and associated theorems and results.
On Relative and Absolute Extreme Values and Critical Numbers
1. Explain the difference between an absolute minimum and a relative minimum value.
2. Suppose that f is a continuous function defined on the closed interval [a , b].
(a) What theorem guarantees the existence of an absolute maximum value and an absolute minimum value for f ?
(b) What steps would you take to find those absolute extreme values?
In problem 3 – 5, sketch the graph of any function f that is continuous on [1, 5] and has the indicated properties. (You do not need to specify the definition of the function, f. )
3. Absolute minimum at 2, absolute maximum at 3, relative minimum at 4.
4. Absolute maximum at 5, absolute minimum at 2, relative maximum at 3, relative minima at 2 and 4.
5. f has no relative maximum or minimum but 2 and 4 are critical numbers.
Recall that c is a critical number for f ⇔ c is in the interior of dom( f ) and either f ’ (c)= 0 or f ’ (c) does not exist.
6. (a) Sketch the graph of a function that has a relative maximum at 2 and is differentiable at 2.
(b) Sketch the graph of a function that has a relative maximum at 2 and is continuous but not differentiable at 2.
(c) Sketch the graph of a function that has a relative maximum at 2 and is discontinuous at 2.
In problems 7 – 10 sketch the graph of f over the indicated interval. Then locate all absolute and relative maximum and minimum values of f that exist.
7. f (x) = 8 – 3 x , x > 1 8. f (x) = x 2, –1 < x < 2
9. f (x) = x 2, –1 < x < 2 10. f (x) = 1/x , 0 < x < 2
In problems 11 – 16 find all critical numbers for the function, all the intervals on which f is increasing or decreasing, and all relative and absolute extreme values. Then use this information to help you sketch a graph of y = f (x).
11. f (x ) = x 4– 2 x
2 + 1 12. f (x) = x 4 – 2 x
3
13. f ( x ) = x 3 + 3 x
2 – 24 x 14. f (x) = | 2 x + 3 |
15. f (x) = x 3 – 3 x + 1 16. f (x) = 3 x ⋅ (8 – x)

Extra Credit Problem
It was shown in class that the closed cylindrical can of maximal volume that may be constructed to have surface area: SA
must have radius: r = units and height: h = 2 units.
Thus, the dimensions of the cylindrical can will be optimized if and only if 2. Now suppose that the following additional constraint is imposed on this optimization problem: The curved side and the circular top and bottom of the cylindrical can must be cut from rectangular sheets of metal. Thus, to minimize waste in the construction process, the side will be formed from a single rectangular sheet having dimensions: 2 π r × h and the discs for the top and bottom will be cut from another sheet of metal having dimensions: 2 r × 4 r. Assume that the excess material from the second sheet used to form the circular bases must be scrapped and cannot be reused. In this scenario, use calculus to prove that the cylinder of largest volume that can be constructed out of the two rectangular sheets having a combined surface area of: SA = 8 + 2 r h must have base radius r and height h related by the formula:
2.55 .
Assignment 9 Due date : Wednesday, April 6 Section 25.4 Page 836: #17, 21, 23, 29.
Section 29.1 Page 947: #2, 3, 4, 7, 11, 12, 19, 26, 29, 36. Required Additional Exercises # 1 – 7 below.
In problems 1 – 6 find all extreme points and all inflection points for the graph of the function. Then find all the intervals on which f is increasing, decreasing, concave up, and concave down and sketch a graph of y = f (x). (Note that problems 1 – 5 were initially examined in the previous assignment.)
1. f (x ) = x 4 – 2 x 2 + 1 2. f (x) = x 4 – 2 x 3
3. f ( x ) = x 3 + 3 x 2 – 24 x 4. f (x) = x3 – 3 x + 1
5. f (x) = 3 x ( 8 – x ) 6. f (x) = 23 / 1
x + 3 /2
x 7. A marble of radius r, 0 < r < 4 , is dropped into a container having the shape of a circular cylinder. The base of the container has radius 4. What is the radius of the marble that requires the most water to cover it completely? Recall that VSphere
34 = π r 3 .

Extra Credit Problem
Two rectangles are to be inscribed in identical right triangles having sides of lengths 6, 8, and 10 units. The rectangles are to be oriented as in the figures below. Find the dimensions of both rectangles assuming that they each have maximal area. Hint: This problem may be solved using similar triangles.
Exam 2 Review Problem Set : (http://mypages.iit.edu/~maslanka/Math122Rvw2.pdf ) Exam 2 Review Topics : (http://mypages.iit.edu/~maslanka/Math122E2Tpcs.pdf ) . . . . . . . . . . Date for Midterm Exam 2 . . . . . . . Wednesday, April 6th . . . . . . . . . . . . . Assignment 10 Due date : Monday, April 18 Section 29.2 Page 951: #1, 4, 9, 12, 13, 21, 26, 27. Required Additional Exercises # 1 – 3 below.
In problems 1 – 3 do the following:
(a) Sketch a rectangular plot of the given equation in the θ r – plane over the indicated θ interval.
(b) Sketch a polar graph of the equation in the x y – plane, where x = r cos θ, y = r sin θ.
(c) Find the slope and inclination of the tangent line to the polar curve at the point
P = ( x , y ) = ( r ⋅cos , r ⋅sin ) by using the formula: //
.
(Refer to the notes at http://mypages.iit.edu/~maslanka/PolarTangents.pdf for reference on this topic.)
1. r = ; < θ < 2 π 2. r = 1 + sin θ ; 0 < θ < 2 π 3. r = 2 sin (3 θ ) ; 0 < θ < π
Assignment 11
Due date : Monday, April 25 Section 26.1 Page 850: #3, 7, 12, 19, 22, 27, 31, 35, 36, 38, 39. Section 26.2 Page 857: #1, 3, 6, 7, 8, 10, 17, 20, 21, 24. Section 26.3 Page 862: #2, 3, 8, 13, 14,17. Section 29.7 Page 973: #1, 2, 9, 10, 19.
Required Additional Exercises # 1 – 3 below.
In problems 1 – 3 the graph of a function f is displayed. Sketch the graph of an antiderivative function, F, in each case. Include an analysis of the intervals on which F is increasing/decreasing and concave up/down based on your knowledge of f = F ’ . 1. 2. 3.
y

xO L
y
Assignment 12 Due date : At Final Exam – NO EXTENSIONS Section 26.4 Page 866: #2, 5, 6, 9, 11, 12, 13. Section 26.6 Page 874: # 1, 6, 13.
Section 29.7 Page 974: # 27, 29.
Required Additional Exercises # 1 – 7 below.
1. A uniform horizontal beam of length L having a simple point support at its left end and a fixed support at its right end will be distorted, due to its own weight, into a curve: y = f (x) as shown in the figure . This curve is called the deflection curve of the beam and it satisfies the differential equation:
E ⋅ I 4
4
dxyd = w along with the four boundary conditions:
y ( 0 ) = 0, y ’’( 0 ) = 0 y ( L ) = 0, y ’( L ) = 0 By substituting each boundary condition into either equation (2), (3) or (4) from page 2 of the article: http://mypages.iit.edu/~maslanka/BeamDeflection.pdf and then solving for the coefficients, C i , i = 1, 2, 3, 4, verify that the beam’s equation is:
y = EI
w48
[ xLLxx 334 32 +− ] Mean Value Theorem: If F is continuous on the closed interval [a, b] and differentiable on the open interval (a, b) then there must exist at least one number c in (a, b) for which
F ’ (c) = ab
F(a)F(b)
−
−
In problems 2 and 3 do the following: (a) Apply the Mean Value Theorem to the function:
F ( x ) = x3 – 3x
on the indicated interval I to find all numbers, c, in the interior of I , which satisfy the conclusion of this theorem. I.e., find all numbers c interior to I for which the average change in F over I is equal to the instantaneous rate of change in F at c. (b) Sketch a graph of the function y = F (x) on the interval I and interpret your results from part (a) geometrically in terms of the appropriate tangent and secant lines to your graphs.
2. I = [ 0 , +2 ] 3. I = [ –1 , +1 ] In problems 4 – 7 use the definite integral to find the area of the shaded region in each case. 4. 5. 6. 7.