Embed Size (px)
Citation preview

Homer Fund Campaign Store ReportReport prepared by HR Reporting & AnalyticsData as of 11/3/2017
DIVISION REGION DISTRICT HR Store Nbr Finance Store Nbr Participants Headcount PART%DC DISTRIBUTION CENTERS DCA2 WEST REGION RDC Total
RDC1 C. SOMMER Total50875639564156425643
50875639564156425643
1,875 2,398 78.2%1,875 2,398 78.2%
422 532 79.3%287 388 74.0%374 539 69.4%610 661 92.3%182 278 65.5%

Homer Fund Campaign Store ReportReport prepared by HR Reporting & AnalyticsData as of 11/3/2017
DIVISION REGION DISTRICT HR Store Nbr Finance Store Nbr Participants Headcount PART%DC DISTRIBUTION CENTERS DCA3 WEST REGION SDC Total
SDC1 P. MARCOUX Total51545158536355655645565057525852
51545158536355655645565057525852
875 1,009 86.7%875 1,009 86.7%
1 2 50.0%1 1 100.0%
100 114 87.7%99 113 87.6%
280 314 89.2%78 100 78.0%
105 133 78.9%211 232 90.9%

Homer Fund Campaign Store ReportReport prepared by HR Reporting & AnalyticsData as of 11/3/2017
DIVISION REGION DISTRICT HR Store Nbr Finance Store Nbr Participants Headcount PART%DC DISTRIBUTION CENTERS DCA5 BDC PLATFORM REGION Total
BDC2 K. DENNIS Total5171529352965320539153955441549655605580559555985673567656955698578157975798579958835890595159825994
5171529352965320539153955441549655605580559555985673567656955698578157975798579958835890595159825994
350 363 96.4%350 363 96.4%16 17 94.1%
9 11 81.8%12 12 100.0%
8 8 100.0%14 14 100.0%
9 9 100.0%10 11 90.9%14 14 100.0%11 11 100.0%23 27 85.2%10 10 100.0%
7 7 100.0%11 11 100.0%11 11 100.0%14 15 93.3%16 16 100.0%17 18 94.4%11 11 100.0%15 15 100.0%10 11 90.9%26 27 96.3%
6 7 85.7%32 32 100.0%17 17 100.0%21 21 100.0%

Homer Fund Campaign Store ReportReport prepared by HR Reporting & AnalyticsData as of 11/3/2017
DIVISION REGION DISTRICT HR Store Nbr Finance Store Nbr Participants Headcount PART%DC DISTRIBUTION CENTERS DCA7 EAST REGION SDC Total
SDC7 M. MCDADE Total50785149515051515156536259205965
50785149515051515156536259205965
837 893 93.7%837 893 93.7%34 35 97.1%
104 118 88.1%291 325 89.5%56 58 96.6%
2 2 100.0%138 139 99.3%83 85 97.6%
129 131 98.5%

Homer Fund Campaign Store ReportReport prepared by HR Reporting & AnalyticsData as of 11/3/2017
DIVISION REGION DISTRICT HR Store Nbr Finance Store Nbr Participants Headcount PART%DC DISTRIBUTION CENTERS DCA8 NORTH REGION RDC Total
RDC8 S. JOHNSTONE Total5030503450845089512052215851
5030503450845089512052215851
2,622 3,039 86.3%2,622 3,039 86.3%
324 349 92.8%413 457 90.4%368 422 87.2%346 396 87.4%461 480 96.0%303 400 75.8%407 535 76.1%
Homer Fund Campaign Store ReportReport prepared by HR Reporting & AnalyticsData as of 11/3/2017
DIVISION REGION DISTRICT HR Store Nbr Finance Store Nbr Participants Headcount PART%DC DISTRIBUTION CENTERS DCA9 SOUTH REGION RDC Total
RDC9 J. GROTE Total5023502450855086508853315520
5023502450855086508853315520
2,135 2,493 85.6%2,135 2,493 85.6%
289 306 94.4%275 316 87.0%538 677 79.5%354 429 82.5%265 327 81.0%
3 3 100.0%411 435 94.5%

Homer Fund Campaign Store ReportReport prepared by HR Reporting & AnalyticsData as of 11/3/2017
DIVISION REGION DISTRICT HR Store Nbr Finance Store Nbr Participants Headcount PART%HO HOME OFFICE 06HO WESTERN NON-STORE Total
06A5 PAC MTN/DESERT G&ATotal04RA04RB04RC04RE04RF04RG05RK06A515RB15RC15RD15RE44RC
9602961896219628964996589625969696249632964196449639
1,143 1,426 80.2%1,143 1,426 80.2%
61 84 72.6%100 120 83.3%92 124 74.2%81 113 71.7%97 113 85.8%
102 129 79.1%90 112 80.4%
1 1 100.0%90 112 80.4%96 126 76.2%
117 143 81.8%117 129 90.7%99 120 82.5%

Homer Fund Campaign Store ReportReport prepared by HR Reporting & AnalyticsData as of 11/3/2017
DIVISION REGION DISTRICT HR Store Nbr Finance Store Nbr Participants Headcount PART%HO HOME OFFICE 06HO WESTERN NON-STORE Total
06A3 PAC NORTHWEST G&ATotal06A331RA40RA40RD40RE44RB47RA47RB47RD47RE47RH
96959645961296469651962996039616963696489654
929 1,173 79.2%929 1,173 79.2%
1 1 100.0%45 67 67.2%
120 141 85.1%94 133 70.7%89 106 84.0%89 101 88.1%
130 166 78.3%102 131 77.9%88 111 79.3%67 84 79.8%
104 132 78.8%

Homer Fund Campaign Store ReportReport prepared by HR Reporting & AnalyticsData as of 11/3/2017
DIVISION REGION DISTRICT HR Store Nbr Finance Store Nbr Participants Headcount PART%HO HOME OFFICE 06HO WESTERN NON-STORE Total
06A1 PACIFIC CENTRAL G&ATotal04RD06A106RC06RH06RS06RX66RA66RD66RG66RH
9626969896089619962396359643964296559657
1,167 1,381 84.5%1,167 1,381 84.5%
138 153 90.2%1 1 100.0%
118 150 78.7%136 151 90.1%119 144 82.6%150 169 88.8%115 136 84.6%150 193 77.7%126 149 84.6%114 135 84.4%

Homer Fund Campaign Store ReportReport prepared by HR Reporting & AnalyticsData as of 11/3/2017
DIVISION REGION DISTRICT HR Store Nbr Finance Store Nbr Participants Headcount PART%HO HOME OFFICE 06HO WESTERN NON-STORE Total
06A4 PACIFIC NORTH G&A Total06A406RB06RJ06RK06RL06RM06RR06RY40RB44RA44RD66RE
969796049611961396159614963896349627961796569652
1,149 1,440 79.8%1,149 1,440 79.8%
0 1 0.0%127 153 83.0%101 113 89.4%130 152 85.5%90 107 84.1%
119 167 71.3%87 129 67.4%
116 141 82.3%66 89 74.2%
117 142 82.4%104 134 77.6%92 112 82.1%

Homer Fund Campaign Store ReportReport prepared by HR Reporting & AnalyticsData as of 11/3/2017
DIVISION REGION DISTRICT HR Store Nbr Finance Store Nbr Participants Headcount PART%HO HOME OFFICE 06HO WESTERN NON-STORE Total
06A2 PACIFIC SOUTH G&A Total06A206RD06RE06RG06RN06RW06RZ17RB17RG66RF
9699960796069605962296339637964748919653
1,026 1,249 82.1%1,026 1,249 82.1%
1 1 100.0%131 178 73.6%98 112 87.5%
129 156 82.7%102 135 75.6%135 158 85.4%189 228 82.9%104 135 77.0%25 26 96.2%
112 120 93.3%

Homer Fund Campaign Store ReportReport prepared by HR Reporting & AnalyticsData as of 11/3/2017
DIVISION REGION DISTRICT HR Store Nbr Finance Store Nbr Participants Headcount PART%HO HOME OFFICE 52HO SOUTHERN NON-STORE Total
05A2 GULF G&A Total03RD05A205RC05RD05RF05RH05RM05RQ05RR05RU05RW
99949293992499189934993399069977995599679969
1,028 1,263 81.4%1,028 1,263 81.4%
94 118 79.7%1 1 100.0%
102 132 77.3%85 105 81.0%
105 135 77.8%124 167 74.3%122 152 80.3%102 132 77.3%85 94 90.4%
108 111 97.3%100 116 86.2%

Homer Fund Campaign Store ReportReport prepared by HR Reporting & AnalyticsData as of 11/3/2017
DIVISION REGION DISTRICT HR Store Nbr Finance Store Nbr Participants Headcount PART%HO HOME OFFICE 52HO SOUTHERN NON-STORE Total
01A1 MIDSOUTH FIELD G&A Total01A101RA01RB01RC01RD01RE01RF01RH01RI01RJ01RL03RA03RB05RN07RB29RA99RC
92959901990299739923997499319929999199789995990499479975992199359988
1,376 1,663 82.7%1,376 1,663 82.7%
1 1 100.0%100 131 76.3%96 106 90.6%
126 138 91.3%86 105 81.9%96 116 82.8%82 95 86.3%
109 156 69.9%70 97 72.2%97 107 90.7%91 106 85.8%84 103 81.6%76 89 85.4%92 113 81.4%83 102 81.4%72 81 88.9%15 17 88.2%

Homer Fund Campaign Store ReportReport prepared by HR Reporting & AnalyticsData as of 11/3/2017
DIVISION REGION DISTRICT HR Store Nbr Finance Store Nbr Participants Headcount PART%HO HOME OFFICE 52HO SOUTHERN NON-STORE Total
01A2 SOUTH ATLANTIC G&ATotal01A207RA07RC07RG23RA36RA36RE36RF36RI36RJ36RL36RM46RB
9296994399389201990399149949995299639976999899969942
1,083 1,335 81.1%1,083 1,335 81.1%
1 1 100.0%70 109 64.2%
102 120 85.0%59 84 70.2%
111 132 84.1%101 114 88.6%90 128 70.3%82 107 76.6%96 115 83.5%82 91 90.1%77 82 93.9%96 113 85.0%
116 139 83.5%

Homer Fund Campaign Store ReportReport prepared by HR Reporting & AnalyticsData as of 11/3/2017
DIVISION REGION DISTRICT HR Store Nbr Finance Store Nbr Participants Headcount PART%HO HOME OFFICE 52HO SOUTHERN NON-STORE Total
02A4 SOUTH FLORIDA/PR G&ATotal02A402RB02RC02RF02RH02RI02RL02RQ02RU82RA
9298992799549908992699289946998199828900
869 1,062 81.8%869 1,062 81.8%
1 1 100.0%103 127 81.1%111 135 82.2%105 120 87.5%136 169 80.5%107 133 80.5%85 101 84.2%79 97 81.4%
125 160 78.1%17 19 89.5%

Homer Fund Campaign Store ReportReport prepared by HR Reporting & AnalyticsData as of 11/3/2017
DIVISION REGION DISTRICT HR Store Nbr Finance Store Nbr Participants Headcount PART%HO HOME OFFICE 52HO SOUTHERN NON-STORE Total
02A2 SOUTHEAST G&A Total02A202RA02RD02RE02RJ02RK02RM02RN02RO02RT36RC
92979907991199129937994199489957989999729919
1,070 1,314 81.4%1,070 1,314 81.4%
1 1 100.0%121 140 86.4%117 135 86.7%135 166 81.3%118 142 83.1%136 183 74.3%85 107 79.4%98 124 79.0%
100 119 84.0%78 93 83.9%81 104 77.9%
Homer Fund Campaign Store ReportReport prepared by HR Reporting & AnalyticsData as of 11/3/2017
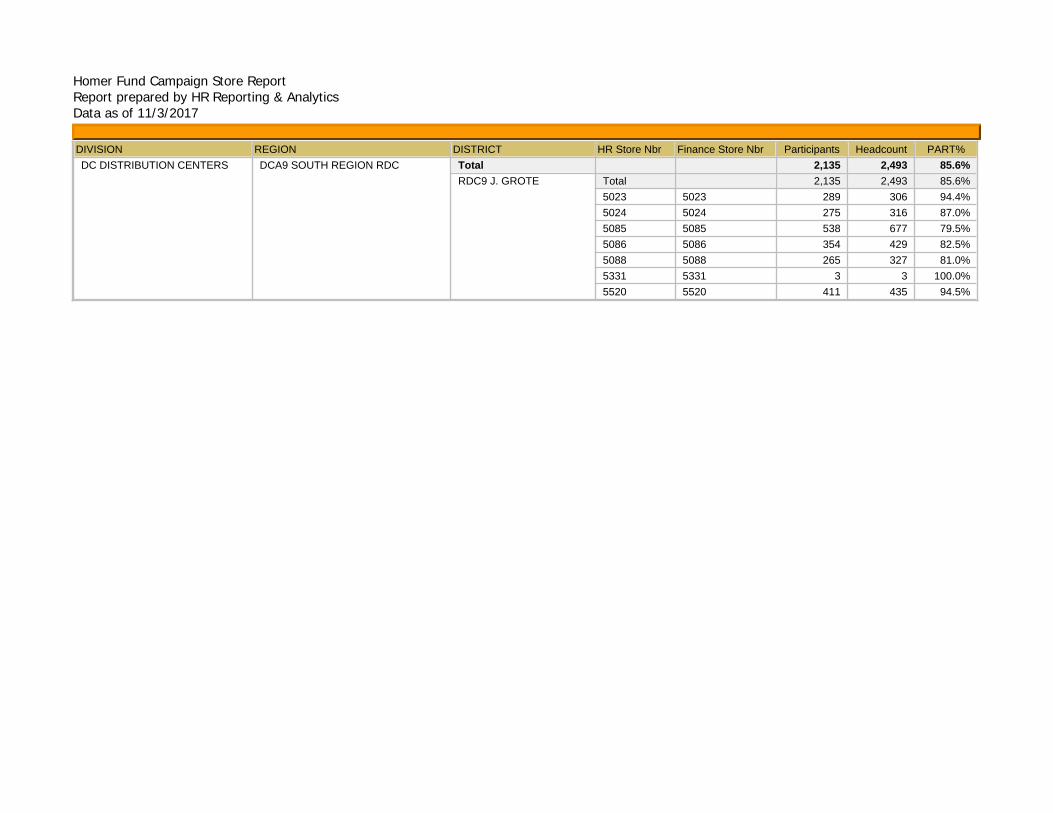
DIVISION REGION DISTRICT HR Store Nbr Finance Store Nbr Participants Headcount PART%HO HOME OFFICE 52HO SOUTHERN NON-STORE Total
05A1 SOUTHWEST G&A Total03RC05A105RA05RB05RE05RI05RJ05RL05RP05RT05RX05RY14RC30RJ
99929299993999059965993299519917995399669958998599939979
1,095 1,274 85.9%1,095 1,274 85.9%
96 105 91.4%0 1 0.0%
101 114 88.6%84 97 86.6%79 87 90.8%97 115 84.3%81 94 86.2%88 105 83.8%95 107 88.8%67 80 83.8%80 103 77.7%72 87 82.8%64 82 78.0%91 97 93.8%

Homer Fund Campaign Store ReportReport prepared by HR Reporting & AnalyticsData as of 11/3/2017
DIVISION REGION DISTRICT HR Store Nbr Finance Store Nbr Participants Headcount PART%HO HOME OFFICE 89HO NORTHERN NON-STORE Total
08A1 CENTRAL G&A Total08A119RA19RB19RC19RD19RF19RG19RI28RG30RA30RC
98919411941294179423946594739487943494219438
916 1,179 77.7%916 1,179 77.7%
1 1 100.0%100 123 81.3%87 103 84.5%
136 213 63.8%70 91 76.9%93 112 83.0%92 117 78.6%88 99 88.9%90 115 78.3%84 101 83.2%75 104 72.1%

Homer Fund Campaign Store ReportReport prepared by HR Reporting & AnalyticsData as of 11/3/2017
DIVISION REGION DISTRICT HR Store Nbr Finance Store Nbr Participants Headcount PART%HO HOME OFFICE 89HO NORTHERN NON-STORE Total
09A1 MIDATLANTIC G&A Total09A125RA25RB25RC25RD25RE41RA41RD41RG46RA46RC46RD
929499139920994599569968944894059936991599629983
1,097 1,376 79.7%1,097 1,376 79.7%
1 1 100.0%93 101 92.1%
140 159 88.1%94 116 81.0%
102 120 85.0%96 124 77.4%81 94 86.2%92 129 71.3%75 115 65.2%
110 136 80.9%100 133 75.2%113 148 76.4%

Homer Fund Campaign Store ReportReport prepared by HR Reporting & AnalyticsData as of 11/3/2017
DIVISION REGION DISTRICT HR Store Nbr Finance Store Nbr Participants Headcount PART%HO HOME OFFICE 89HO NORTHERN NON-STORE Total
08A6 MIDWEST G&A Total08A619RE20RA27RA27RC27RD27RE27RG27RH27RM30RH
98969445947094589407947894679468945594929464
809 965 83.8%809 965 83.8%
1 1 100.0%57 76 75.0%56 68 82.4%
101 123 82.1%104 119 87.4%85 99 85.9%83 92 90.2%88 99 88.9%74 80 92.5%88 119 73.9%72 89 80.9%

Homer Fund Campaign Store ReportReport prepared by HR Reporting & AnalyticsData as of 11/3/2017
DIVISION REGION DISTRICT HR Store Nbr Finance Store Nbr Participants Headcount PART%HO HOME OFFICE 89HO NORTHERN NON-STORE Total
09A2 NEW ENGLAND G&A Total09A226RB26RC26RD26RE26RF26RG26RH26RI26RJ26RM26RQ62RA62RC
98939476941994169424944394499431947594639476949194069472
1,045 1,363 76.7%1,045 1,363 76.7%
1 1 100.0%76 94 80.9%91 106 85.8%67 105 63.8%75 107 70.1%95 108 88.0%85 114 74.6%98 115 85.2%78 137 56.9%81 107 75.7%12 15 80.0%
116 125 92.8%88 116 75.9%82 113 72.6%

Homer Fund Campaign Store ReportReport prepared by HR Reporting & AnalyticsData as of 11/3/2017
DIVISION REGION DISTRICT HR Store Nbr Finance Store Nbr Participants Headcount PART%HO HOME OFFICE 89HO NORTHERN NON-STORE Total
09A3 NJ METRO G&A Total09A309RE09RI09RJ09RK12RF12RH12RK41RB41RE41RJ
98959428945194799480942794509462941494399493
858 1,010 85.0%858 1,010 85.0%
1 1 100.0%80 100 80.0%
103 109 94.5%97 115 84.3%97 114 85.1%72 84 85.7%81 101 80.2%
105 112 93.8%91 111 82.0%68 80 85.0%63 83 75.9%

Homer Fund Campaign Store ReportReport prepared by HR Reporting & AnalyticsData as of 11/3/2017
DIVISION REGION DISTRICT HR Store Nbr Finance Store Nbr Participants Headcount PART%HO HOME OFFICE 89HO NORTHERN NON-STORE Total
08A3 NORTHERN PLAINS G&ATotal08A328RA28RB28RE28RF28RH28RI30RD30RE30RI49RD49RF49RH
9892944694259461948294159477944294549474944194539488
834 1,055 79.1%834 1,055 79.1%
1 1 100.0%83 92 90.2%61 82 74.4%68 85 80.0%60 88 68.2%59 85 69.4%82 89 92.1%93 103 90.3%80 98 81.6%59 73 80.8%66 95 69.5%67 81 82.7%55 83 66.3%

Homer Fund Campaign Store ReportReport prepared by HR Reporting & AnalyticsData as of 11/3/2017
DIVISION REGION DISTRICT HR Store Nbr Finance Store Nbr Participants Headcount PART%HO HOME OFFICE 89HO NORTHERN NON-STORE Total
09A5 NY METRO G&A Total09A509RA09RC09RF09RH12RA12RB12RE12RL12RM12RO61RA
989494029401943294569410940894229437948194949484
884 1,173 75.4%884 1,173 75.4%
1 1 100.0%62 82 75.6%78 87 89.7%64 73 87.7%
116 161 72.0%55 87 63.2%67 86 77.9%86 116 74.1%98 130 75.4%92 126 73.0%94 117 80.3%71 107 66.4%

Homer Fund Campaign Store ReportReport prepared by HR Reporting & AnalyticsData as of 11/3/2017
DIVISION REGION DISTRICT HR Store Nbr Finance Store Nbr Participants Headcount PART%HO HOME OFFICE 89HO NORTHERN NON-STORE Total
08A4 OHIO VALLEY G&A Total08A412RC12RD12RG12RI38RA38RB38RC41RC41RF41RI49RC49RE49RG49RI
989094039418943594579426943094449922995994899433944794839490
1,202 1,434 83.8%1,202 1,434 83.8%
1 1 100.0%110 124 88.7%80 103 77.7%86 113 76.1%80 93 86.0%84 90 93.3%91 105 86.7%84 86 97.7%94 112 83.9%84 101 83.2%99 116 85.3%77 97 79.4%85 96 88.5%87 111 78.4%60 86 69.8%

Homer Fund Campaign Store ReportReport prepared by HR Reporting & AnalyticsData as of 11/3/2017
DIVISION REGION DISTRICT HR Store Nbr Finance Store Nbr Participants Headcount PART%ND NORTHERN DIVISION 08A1 CENTRAL REGION Total
19RA B. LYONS Total19021907191319221926193819411981198769818431
19021907191319221926193819411981198769818431
1,241 1,559 79.6%1,241 1,559 79.6%
163 192 84.9%149 176 84.7%149 186 80.1%91 115 79.1%
111 147 75.5%95 124 76.6%89 126 70.6%
142 166 85.5%80 110 72.7%79 99 79.8%93 118 78.8%

Homer Fund Campaign Store ReportReport prepared by HR Reporting & AnalyticsData as of 11/3/2017
DIVISION REGION DISTRICT HR Store Nbr Finance Store Nbr Participants Headcount PART%ND NORTHERN DIVISION 08A1 CENTRAL REGION Total
19RF C. REASONOVA Total1901190819091935193619371955200120302036
1901190819091935193619371955200120302036
1,170 1,279 91.5%1,170 1,279 91.5%
146 159 91.8%124 139 89.2%114 119 95.8%111 124 89.5%134 134 100.0%120 130 92.3%126 138 91.3%106 113 93.8%96 117 82.1%93 106 87.7%

Homer Fund Campaign Store ReportReport prepared by HR Reporting & AnalyticsData as of 11/3/2017
DIVISION REGION DISTRICT HR Store Nbr Finance Store Nbr Participants Headcount PART%ND NORTHERN DIVISION 08A1 CENTRAL REGION Total
19RG G. HUTCHINSON Total1905191619171918191919421943196419826701
1905191619171918191919421943196419826701
1,359 1,529 88.9%1,359 1,529 88.9%
143 154 92.9%160 175 91.4%109 129 84.5%165 184 89.7%157 158 99.4%102 131 77.9%124 143 86.7%118 125 94.4%149 166 89.8%132 164 80.5%

Homer Fund Campaign Store ReportReport prepared by HR Reporting & AnalyticsData as of 11/3/2017
DIVISION REGION DISTRICT HR Store Nbr Finance Store Nbr Participants Headcount PART%ND NORTHERN DIVISION 08A1 CENTRAL REGION Total
28RG J. GIRVES Total19041920192719281934194019441948195219561969
19041920192719281934194019441948195219561969
1,070 1,373 77.9%1,070 1,373 77.9%
122 146 83.6%99 126 78.6%
124 149 83.2%91 118 77.1%94 107 87.9%88 131 67.2%87 109 79.8%98 121 81.0%92 141 65.2%79 101 78.2%96 124 77.4%

Homer Fund Campaign Store ReportReport prepared by HR Reporting & AnalyticsData as of 11/3/2017
DIVISION REGION DISTRICT HR Store Nbr Finance Store Nbr Participants Headcount PART%ND NORTHERN DIVISION 08A1 CENTRAL REGION Total
19RD J. MORRIS Total190619321967198319841989682269196987
190619321967198319841989682269196987
924 1,163 79.4%924 1,163 79.4%97 134 72.4%99 120 82.5%87 116 75.0%
122 153 79.7%91 116 78.4%
107 131 81.7%95 123 77.2%
150 169 88.8%76 101 75.2%

Homer Fund Campaign Store ReportReport prepared by HR Reporting & AnalyticsData as of 11/3/2017
DIVISION REGION DISTRICT HR Store Nbr Finance Store Nbr Participants Headcount PART%ND NORTHERN DIVISION 08A1 CENTRAL REGION Total
30RC K. LONGWELL Total300230043007301030143018303230338994
300230043007301030143018303230338994
902 1,157 78.0%902 1,157 78.0%128 169 75.7%91 115 79.1%
116 145 80.0%135 179 75.4%83 113 73.5%91 116 78.4%83 103 80.6%95 104 91.3%80 113 70.8%

Homer Fund Campaign Store ReportReport prepared by HR Reporting & AnalyticsData as of 11/3/2017
DIVISION REGION DISTRICT HR Store Nbr Finance Store Nbr Participants Headcount PART%ND NORTHERN DIVISION 08A1 CENTRAL REGION Total
19RC M. ROMERO Total19031911191219141950196119741976198019868598
19031911191219141950196119741976198019868598
1,663 2,130 78.1%1,663 2,130 78.1%
149 210 71.0%137 178 77.0%189 245 77.1%216 271 79.7%165 213 77.5%125 140 89.3%140 164 85.4%116 118 98.3%151 194 77.8%143 208 68.8%132 189 69.8%

Homer Fund Campaign Store ReportReport prepared by HR Reporting & AnalyticsData as of 11/3/2017
DIVISION REGION DISTRICT HR Store Nbr Finance Store Nbr Participants Headcount PART%ND NORTHERN DIVISION 08A1 CENTRAL REGION Total
19RI S. ESPARZA Total1851191519241973301130133034692069618430
1851191519241973301130133034692069618430
924 1,199 77.1%924 1,199 77.1%74 93 79.6%
102 134 76.1%85 114 74.6%79 116 68.1%
148 187 79.1%97 129 75.2%96 118 81.4%87 97 89.7%84 116 72.4%72 95 75.8%

Homer Fund Campaign Store ReportReport prepared by HR Reporting & AnalyticsData as of 11/3/2017
DIVISION REGION DISTRICT HR Store Nbr Finance Store Nbr Participants Headcount PART%ND NORTHERN DIVISION 08A1 CENTRAL REGION Total
19RB S. KUMAR Total1921193919571962197519771978688769236925
1921193919571962197519771978688769236925
1,002 1,211 82.7%1,002 1,211 82.7%
103 138 74.6%123 141 87.2%99 121 81.8%96 120 80.0%
111 127 87.4%81 97 83.5%83 102 81.4%85 106 80.2%
110 113 97.3%111 146 76.0%

Homer Fund Campaign Store ReportReport prepared by HR Reporting & AnalyticsData as of 11/3/2017
DIVISION REGION DISTRICT HR Store Nbr Finance Store Nbr Participants Headcount PART%ND NORTHERN DIVISION 08A1 CENTRAL REGION Total
30RA S. PHILP Total300130033009301530223025302730363037
300130033009301530223025302730363037
915 1,187 77.1%915 1,187 77.1%109 139 78.4%109 124 87.9%101 135 74.8%93 132 70.5%
106 139 76.3%119 156 76.3%72 89 80.9%92 109 84.4%
114 164 69.5%

Homer Fund Campaign Store ReportReport prepared by HR Reporting & AnalyticsData as of 11/3/2017
DIVISION REGION DISTRICT HR Store Nbr Finance Store Nbr Participants Headcount PART%ND NORTHERN DIVISION 08A3 NORTHERN PLAINS REGION Total
28RA C. INNES Total280428062808281228212825284028442845
280428062808281228212825284028442845
918 1,192 77.0%918 1,192 77.0%112 137 81.8%141 177 79.7%111 161 68.9%95 141 67.4%95 103 92.2%97 128 75.8%70 97 72.2%76 103 73.8%
121 145 83.4%

Homer Fund Campaign Store ReportReport prepared by HR Reporting & AnalyticsData as of 11/3/2017
DIVISION REGION DISTRICT HR Store Nbr Finance Store Nbr Participants Headcount PART%ND NORTHERN DIVISION 08A3 NORTHERN PLAINS REGION Total
28RI D. BUSCH Total280528092813282628292833284128434905
280528092813282628292833284128434905
861 1,124 76.6%861 1,124 76.6%101 138 73.2%101 130 77.7%101 126 80.2%107 135 79.3%70 102 68.6%
109 143 76.2%90 127 70.9%89 120 74.2%93 103 90.3%

Homer Fund Campaign Store ReportReport prepared by HR Reporting & AnalyticsData as of 11/3/2017
DIVISION REGION DISTRICT HR Store Nbr Finance Store Nbr Participants Headcount PART%ND NORTHERN DIVISION 08A3 NORTHERN PLAINS REGION Total
28RB E. BURG Total280128022803280728102820282828474935
280128022803280728102820282828474935
834 1,098 76.0%834 1,098 76.0%110 140 78.6%72 106 67.9%92 118 78.0%
141 179 78.8%106 135 78.5%73 109 67.0%95 121 78.5%70 101 69.3%75 89 84.3%

Homer Fund Campaign Store ReportReport prepared by HR Reporting & AnalyticsData as of 11/3/2017
DIVISION REGION DISTRICT HR Store Nbr Finance Store Nbr Participants Headcount PART%ND NORTHERN DIVISION 08A3 NORTHERN PLAINS REGION Total
49RH J. BAUMANN Total49104912491849194923492449254940
49104912491849194923492449254940
716 925 77.4%716 925 77.4%99 131 75.6%95 149 63.8%89 129 69.0%80 109 73.4%
134 142 94.4%74 94 78.7%76 92 82.6%69 79 87.3%

Homer Fund Campaign Store ReportReport prepared by HR Reporting & AnalyticsData as of 11/3/2017
DIVISION REGION DISTRICT HR Store Nbr Finance Store Nbr Participants Headcount PART%ND NORTHERN DIVISION 08A3 NORTHERN PLAINS REGION Total
28RH K. STOLL Total281128172818283028312834284237013703
281128172818283028312834284237013703
709 884 80.2%709 884 80.2%96 120 80.0%67 92 72.8%83 99 83.8%79 95 83.2%88 100 88.0%84 97 86.6%65 80 81.3%72 93 77.4%75 108 69.4%

Homer Fund Campaign Store ReportReport prepared by HR Reporting & AnalyticsData as of 11/3/2017
DIVISION REGION DISTRICT HR Store Nbr Finance Store Nbr Participants Headcount PART%ND NORTHERN DIVISION 08A3 NORTHERN PLAINS REGION Total
49RF L. LOBELLO Total277549034915492049284929493049314942
277549034915492049284929493049314942
703 908 77.4%703 908 77.4%68 91 74.7%82 94 87.2%74 101 73.3%
108 137 78.8%79 110 71.8%81 99 81.8%69 88 78.4%63 87 72.4%79 101 78.2%

Homer Fund Campaign Store ReportReport prepared by HR Reporting & AnalyticsData as of 11/3/2017
DIVISION REGION DISTRICT HR Store Nbr Finance Store Nbr Participants Headcount PART%ND NORTHERN DIVISION 08A3 NORTHERN PLAINS REGION Total
28RF L. MCCARTY Total210121032104210721082111211321152832
210121032104210721082111211321152832
792 926 85.5%792 926 85.5%81 87 93.1%93 121 76.9%85 98 86.7%77 99 77.8%82 105 78.1%98 110 89.1%84 97 86.6%
122 131 93.1%70 78 89.7%

Homer Fund Campaign Store ReportReport prepared by HR Reporting & AnalyticsData as of 11/3/2017
DIVISION REGION DISTRICT HR Store Nbr Finance Store Nbr Participants Headcount PART%ND NORTHERN DIVISION 08A3 NORTHERN PLAINS REGION Total
28RE M. BELFORD Total2109211432013202320332043206320832094301
2109211432013202320332043206320832094301
909 1,171 77.6%909 1,171 77.6%79 104 76.0%93 107 86.9%84 106 79.2%
103 139 74.1%118 136 86.8%101 136 74.3%92 108 85.2%66 102 64.7%90 123 73.2%83 110 75.5%

Homer Fund Campaign Store ReportReport prepared by HR Reporting & AnalyticsData as of 11/3/2017
DIVISION REGION DISTRICT HR Store Nbr Finance Store Nbr Participants Headcount PART%ND NORTHERN DIVISION 08A3 NORTHERN PLAINS REGION Total
30RE M. HINCK Total300630083016301930213024302630298460
300630083016301930213024302630298460
1,007 1,213 83.0%1,007 1,213 83.0%
149 158 94.3%96 121 79.3%95 131 72.5%
106 126 84.1%147 192 76.6%117 132 88.6%114 134 85.1%78 98 79.6%
105 121 86.8%

Homer Fund Campaign Store ReportReport prepared by HR Reporting & AnalyticsData as of 11/3/2017
DIVISION REGION DISTRICT HR Store Nbr Finance Store Nbr Participants Headcount PART%ND NORTHERN DIVISION 08A3 NORTHERN PLAINS REGION Total
30RD S. EDWARDS Total220122022203220922112213221622188984
220122022203220922112213221622188984
1,039 1,231 84.4%1,039 1,231 84.4%
118 126 93.7%123 147 83.7%127 153 83.0%138 169 81.7%95 132 72.0%
117 136 86.0%104 132 78.8%147 147 100.0%70 89 78.7%

Homer Fund Campaign Store ReportReport prepared by HR Reporting & AnalyticsData as of 11/3/2017
DIVISION REGION DISTRICT HR Store Nbr Finance Store Nbr Participants Headcount PART%ND NORTHERN DIVISION 08A3 NORTHERN PLAINS REGION Total
30RI T. HODGES Total2204220522072214221722192221
2204220522072214221722192221
654 797 82.1%654 797 82.1%135 143 94.4%98 121 81.0%90 115 78.3%87 90 96.7%
105 112 93.8%71 106 67.0%68 110 61.8%

Homer Fund Campaign Store ReportReport prepared by HR Reporting & AnalyticsData as of 11/3/2017
DIVISION REGION DISTRICT HR Store Nbr Finance Store Nbr Participants Headcount PART%ND NORTHERN DIVISION 08A3 NORTHERN PLAINS REGION Total
49RD W. LAPPIN Total490249064907490949114916492149264941
490249064907490949114916492149264941
934 1,154 80.9%934 1,154 80.9%108 126 85.7%118 141 83.7%72 111 64.9%
143 163 87.7%96 114 84.2%97 126 77.0%82 118 69.5%
103 115 89.6%115 140 82.1%

Homer Fund Campaign Store ReportReport prepared by HR Reporting & AnalyticsData as of 11/3/2017
DIVISION REGION DISTRICT HR Store Nbr Finance Store Nbr Participants Headcount PART%ND NORTHERN DIVISION 08A4 OHIO VALLEY REGION Total
12RD A. PAGLIARO Total124412461247126412731278615961616168
124412461247126412731278615961616168
1,037 1,272 81.5%1,037 1,272 81.5%
128 162 79.0%119 156 76.3%133 154 86.4%122 145 84.1%118 146 80.8%139 168 82.7%91 110 82.7%91 109 83.5%96 122 78.7%

Homer Fund Campaign Store ReportReport prepared by HR Reporting & AnalyticsData as of 11/3/2017
DIVISION REGION DISTRICT HR Store Nbr Finance Store Nbr Participants Headcount PART%ND NORTHERN DIVISION 08A4 OHIO VALLEY REGION Total
41RC J. GAGE Total4117412341294135413941484152415941608433
4117412341294135413941484152415941608433
1,049 1,311 80.0%1,049 1,311 80.0%
124 145 85.5%134 160 83.8%83 119 69.7%
119 149 79.9%93 117 79.5%
103 135 76.3%106 130 81.5%111 129 86.0%115 135 85.2%61 92 66.3%

Homer Fund Campaign Store ReportReport prepared by HR Reporting & AnalyticsData as of 11/3/2017
DIVISION REGION DISTRICT HR Store Nbr Finance Store Nbr Participants Headcount PART%ND NORTHERN DIVISION 08A4 OHIO VALLEY REGION Total
12RC J. KINDER Total12231239124112521259126212631269128961606173
12231239124112521259126212631269128961606173
1,199 1,400 85.6%1,199 1,400 85.6%
87 111 78.4%118 144 81.9%111 122 91.0%122 149 81.9%140 146 95.9%116 118 98.3%123 170 72.4%118 118 100.0%86 110 78.2%87 113 77.0%91 99 91.9%

Homer Fund Campaign Store ReportReport prepared by HR Reporting & AnalyticsData as of 11/3/2017
DIVISION REGION DISTRICT HR Store Nbr Finance Store Nbr Participants Headcount PART%ND NORTHERN DIVISION 08A4 OHIO VALLEY REGION Total
38RB J. LERCH Total3803381738203827383538473866387568576930
3803381738203827383538473866387568576930
1,121 1,297 86.4%1,121 1,297 86.4%
124 142 87.3%145 164 88.4%162 184 88.0%101 125 80.8%101 117 86.3%80 102 78.4%71 84 84.5%
107 131 81.7%123 135 91.1%107 113 94.7%

Homer Fund Campaign Store ReportReport prepared by HR Reporting & AnalyticsData as of 11/3/2017
DIVISION REGION DISTRICT HR Store Nbr Finance Store Nbr Participants Headcount PART%ND NORTHERN DIVISION 08A4 OHIO VALLEY REGION Total
41RF J. MILLAY Total411541164126412841364156417241764180
411541164126412841364156417241764180
974 1,168 83.4%974 1,168 83.4%128 146 87.7%121 141 85.8%113 146 77.4%86 106 81.1%
158 186 84.9%102 128 79.7%84 100 84.0%
101 115 87.8%81 100 81.0%
Homer Fund Campaign Store ReportReport prepared by HR Reporting & AnalyticsData as of 11/3/2017
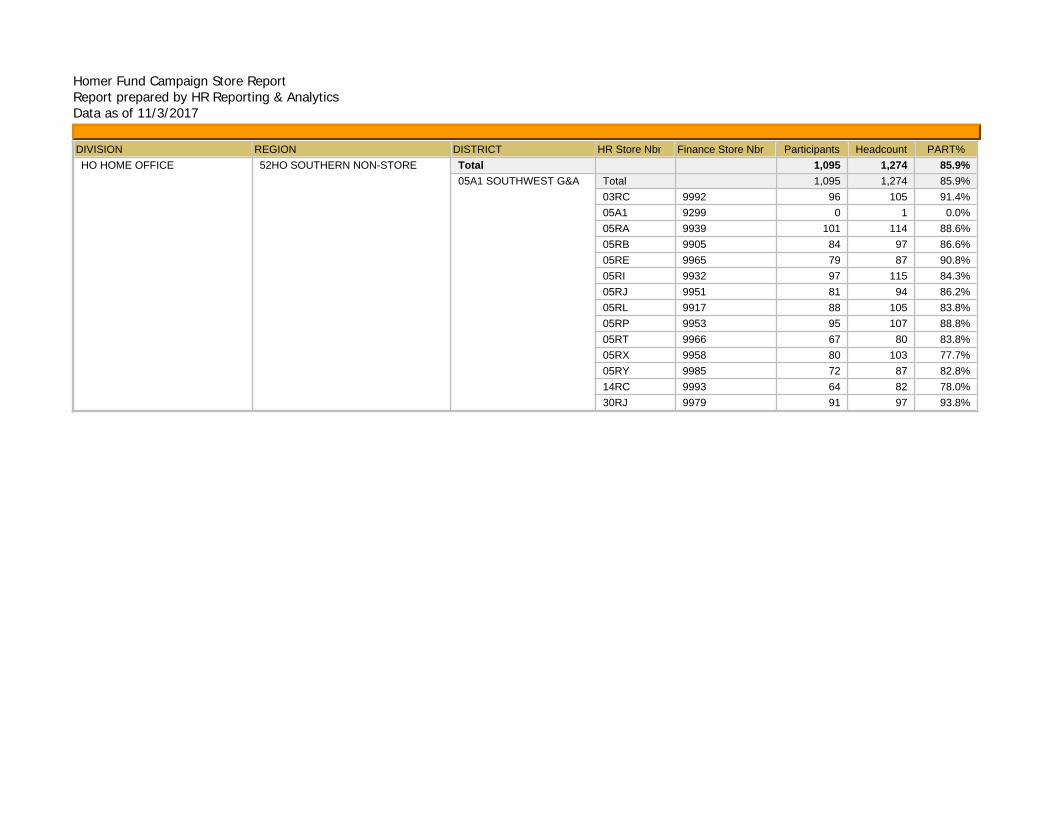
DIVISION REGION DISTRICT HR Store Nbr Finance Store Nbr Participants Headcount PART%ND NORTHERN DIVISION 08A4 OHIO VALLEY REGION Total
41RI J. MILLER Total3804380638153818382438423852385969318981
3804380638153818382438423852385969318981
1,199 1,442 83.1%1,199 1,442 83.1%
122 136 89.7%137 156 87.8%131 161 81.4%146 174 83.9%88 116 75.9%
135 156 86.5%106 144 73.6%79 104 76.0%
141 155 91.0%114 140 81.4%

Homer Fund Campaign Store ReportReport prepared by HR Reporting & AnalyticsData as of 11/3/2017
DIVISION REGION DISTRICT HR Store Nbr Finance Store Nbr Participants Headcount PART%ND NORTHERN DIVISION 08A4 OHIO VALLEY REGION Total
38RA M. COLLINS Total380938103830383338413846386038823888
380938103830383338413846386038823888
996 1,168 85.3%996 1,168 85.3%140 165 84.8%141 160 88.1%129 154 83.8%126 137 92.0%84 113 74.3%90 119 75.6%94 110 85.5%
106 108 98.1%86 102 84.3%

Homer Fund Campaign Store ReportReport prepared by HR Reporting & AnalyticsData as of 11/3/2017
DIVISION REGION DISTRICT HR Store Nbr Finance Store Nbr Participants Headcount PART%ND NORTHERN DIVISION 08A4 OHIO VALLEY REGION Total
38RC M. MCCARTHY Total380538083838387738864124413041694178
380538083838387738864124413041694178
854 974 87.7%854 974 87.7%121 138 87.7%92 108 85.2%82 91 90.1%91 102 89.2%
111 114 97.4%90 111 81.1%83 87 95.4%95 116 81.9%89 107 83.2%

Homer Fund Campaign Store ReportReport prepared by HR Reporting & AnalyticsData as of 11/3/2017
DIVISION REGION DISTRICT HR Store Nbr Finance Store Nbr Participants Headcount PART%ND NORTHERN DIVISION 08A4 OHIO VALLEY REGION Total
49RG P HAITSCH Total230623232324381238143822383238443863
230623232324381238143822383238443863
1,090 1,374 79.3%1,090 1,374 79.3%
141 194 72.7%112 116 96.6%103 139 74.1%154 175 88.0%100 145 69.0%144 175 82.3%135 182 74.2%108 129 83.7%93 119 78.2%

Homer Fund Campaign Store ReportReport prepared by HR Reporting & AnalyticsData as of 11/3/2017
DIVISION REGION DISTRICT HR Store Nbr Finance Store Nbr Participants Headcount PART%ND NORTHERN DIVISION 08A4 OHIO VALLEY REGION Total
12RG R. BERTONE Total1228123012311233123412681286128761546169
1228123012311233123412681286128761546169
1,117 1,461 76.5%1,117 1,461 76.5%
132 183 72.1%120 156 76.9%119 150 79.3%115 151 76.2%154 200 77.0%103 135 76.3%102 130 78.5%118 151 78.1%77 106 72.6%77 99 77.8%

Homer Fund Campaign Store ReportReport prepared by HR Reporting & AnalyticsData as of 11/3/2017
DIVISION REGION DISTRICT HR Store Nbr Finance Store Nbr Participants Headcount PART%ND NORTHERN DIVISION 08A4 OHIO VALLEY REGION Total
49RE R. KALP Total381338213823385438553856385738613868
381338213823385438553856385738613868
858 1,092 78.6%858 1,092 78.6%103 128 80.5%101 129 78.3%100 125 80.0%95 123 77.2%94 121 77.7%77 107 72.0%
109 135 80.7%93 124 75.0%86 100 86.0%

Homer Fund Campaign Store ReportReport prepared by HR Reporting & AnalyticsData as of 11/3/2017
DIVISION REGION DISTRICT HR Store Nbr Finance Store Nbr Participants Headcount PART%ND NORTHERN DIVISION 08A4 OHIO VALLEY REGION Total
49RI S. GARDNER Total38193831384338623867387238896954
38193831384338623867387238896954
757 910 83.2%757 910 83.2%115 143 80.4%85 128 66.4%78 92 84.8%80 98 81.6%94 98 95.9%94 110 85.5%73 89 82.0%
138 152 90.8%

Homer Fund Campaign Store ReportReport prepared by HR Reporting & AnalyticsData as of 11/3/2017
DIVISION REGION DISTRICT HR Store Nbr Finance Store Nbr Participants Headcount PART%ND NORTHERN DIVISION 08A4 OHIO VALLEY REGION Total
49RC S. OURS Total381138163825382838363883388538874803
381138163825382838363883388538874803
951 1,067 89.1%951 1,067 89.1%117 119 98.3%113 135 83.7%132 139 95.0%129 141 91.5%106 128 82.8%92 95 96.8%84 107 78.5%
101 109 92.7%77 94 81.9%

Homer Fund Campaign Store ReportReport prepared by HR Reporting & AnalyticsData as of 11/3/2017
DIVISION REGION DISTRICT HR Store Nbr Finance Store Nbr Participants Headcount PART%ND NORTHERN DIVISION 08A4 OHIO VALLEY REGION Total
12RI T. HAGE Total123512361254125761536155617468468996
123512361254125761536155617468468996
881 1,063 82.9%881 1,063 82.9%107 124 86.3%155 196 79.1%92 129 71.3%
106 128 82.8%94 117 80.3%80 98 81.6%83 90 92.2%85 92 92.4%79 89 88.8%

Homer Fund Campaign Store ReportReport prepared by HR Reporting & AnalyticsData as of 11/3/2017
DIVISION REGION DISTRICT HR Store Nbr Finance Store Nbr Participants Headcount PART%ND NORTHERN DIVISION 08A6 MIDWEST REGION Total
30RH B. PLANTENBERG Total2011201220142017201820192026203420378918
2011201220142017201820192026203420378918
925 1,095 84.5%925 1,095 84.5%110 122 90.2%94 104 90.4%93 122 76.2%70 94 74.5%
102 119 85.7%97 108 89.8%
113 123 91.9%72 88 81.8%90 116 77.6%84 99 84.8%
Homer Fund Campaign Store ReportReport prepared by HR Reporting & AnalyticsData as of 11/3/2017
DIVISION REGION DISTRICT HR Store Nbr Finance Store Nbr Participants Headcount PART%ND NORTHERN DIVISION 08A6 MIDWEST REGION Total
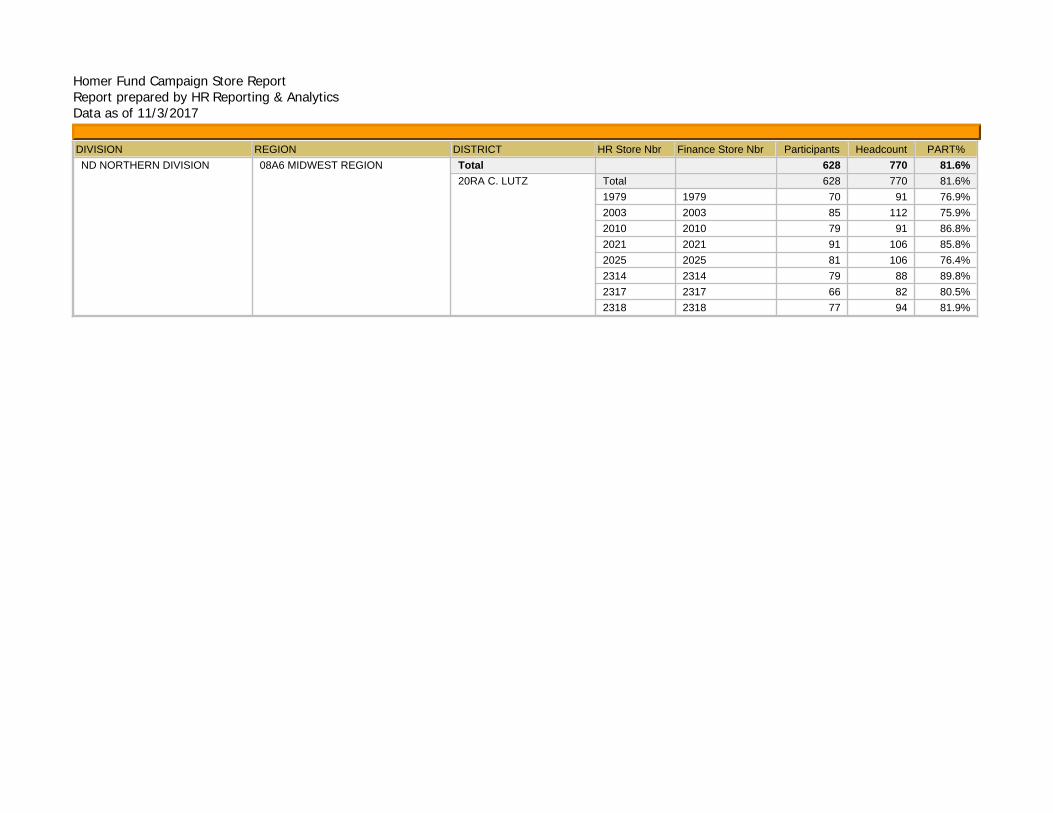
20RA C. LUTZ Total19792003201020212025231423172318
19792003201020212025231423172318
628 770 81.6%628 770 81.6%70 91 76.9%85 112 75.9%79 91 86.8%91 106 85.8%81 106 76.4%79 88 89.8%66 82 80.5%77 94 81.9%

Homer Fund Campaign Store ReportReport prepared by HR Reporting & AnalyticsData as of 11/3/2017
DIVISION REGION DISTRICT HR Store Nbr Finance Store Nbr Participants Headcount PART%ND NORTHERN DIVISION 08A6 MIDWEST REGION Total
27RA D. LEONARD Total2701270427112729273127432757276427732781
2701270427112729273127432757276427732781
1,249 1,561 80.0%1,249 1,561 80.0%
135 157 86.0%122 155 78.7%121 151 80.1%123 147 83.7%158 177 89.3%92 124 74.2%
113 157 72.0%130 155 83.9%98 135 72.6%
157 203 77.3%

Homer Fund Campaign Store ReportReport prepared by HR Reporting & AnalyticsData as of 11/3/2017
DIVISION REGION DISTRICT HR Store Nbr Finance Store Nbr Participants Headcount PART%ND NORTHERN DIVISION 08A6 MIDWEST REGION Total
27RE D. MANDEVILLE Total2714271627172733273627392763276527722779
2714271627172733273627392763276527722779
1,028 1,114 92.3%1,028 1,114 92.3%
101 105 96.2%100 107 93.5%123 132 93.2%85 87 97.7%
116 136 85.3%104 110 94.5%111 128 86.7%96 103 93.2%
100 107 93.5%92 99 92.9%

Homer Fund Campaign Store ReportReport prepared by HR Reporting & AnalyticsData as of 11/3/2017
DIVISION REGION DISTRICT HR Store Nbr Finance Store Nbr Participants Headcount PART%ND NORTHERN DIVISION 08A6 MIDWEST REGION Total
27RG G. MCFARREN Total2709271027382789380138073848385838646821
2709271027382789380138073848385838646821
987 1,176 83.9%987 1,176 83.9%93 116 80.2%
115 137 83.9%92 111 82.9%
128 130 98.5%87 110 79.1%
102 127 80.3%93 114 81.6%82 94 87.2%85 102 83.3%
110 135 81.5%

Homer Fund Campaign Store ReportReport prepared by HR Reporting & AnalyticsData as of 11/3/2017
DIVISION REGION DISTRICT HR Store Nbr Finance Store Nbr Participants Headcount PART%ND NORTHERN DIVISION 08A6 MIDWEST REGION Total
27RM J. GIATTINO Total2703272127222724273727412742274427512762
2703272127222724273727412742274427512762
1,140 1,381 82.5%1,140 1,381 82.5%
125 134 93.3%129 142 90.8%89 131 67.9%
101 126 80.2%122 133 91.7%117 147 79.6%144 182 79.1%108 134 80.6%92 118 78.0%
113 134 84.3%

Homer Fund Campaign Store ReportReport prepared by HR Reporting & AnalyticsData as of 11/3/2017
DIVISION REGION DISTRICT HR Store Nbr Finance Store Nbr Participants Headcount PART%ND NORTHERN DIVISION 08A6 MIDWEST REGION Total
27RH M. ANZARUT Total272627322747275227552759276027692782
272627322747275227552759276027692782
851 927 91.8%851 927 91.8%121 128 94.5%84 97 86.6%87 103 84.5%89 101 88.1%
100 104 96.2%82 94 87.2%
102 103 99.0%90 94 95.7%96 103 93.2%

Homer Fund Campaign Store ReportReport prepared by HR Reporting & AnalyticsData as of 11/3/2017
DIVISION REGION DISTRICT HR Store Nbr Finance Store Nbr Participants Headcount PART%ND NORTHERN DIVISION 08A6 MIDWEST REGION Total
19RE M. CRAMER Total200920232024203327282766276827702785
200920232024203327282766276827702785
775 965 80.3%775 965 80.3%99 120 82.5%90 107 84.1%74 104 71.2%85 103 82.5%97 129 75.2%88 103 85.4%74 95 77.9%89 110 80.9%79 94 84.0%

Homer Fund Campaign Store ReportReport prepared by HR Reporting & AnalyticsData as of 11/3/2017
DIVISION REGION DISTRICT HR Store Nbr Finance Store Nbr Participants Headcount PART%ND NORTHERN DIVISION 08A6 MIDWEST REGION Total
27RC M. KERRIGAN Total2702270627072708271827272734274027582776
2702270627072708271827272734274027582776
1,315 1,516 86.7%1,315 1,516 86.7%
143 150 95.3%138 167 82.6%157 176 89.2%120 127 94.5%128 166 77.1%119 146 81.5%99 134 73.9%
132 152 86.8%163 173 94.2%116 125 92.8%

Homer Fund Campaign Store ReportReport prepared by HR Reporting & AnalyticsData as of 11/3/2017
DIVISION REGION DISTRICT HR Store Nbr Finance Store Nbr Participants Headcount PART%ND NORTHERN DIVISION 08A6 MIDWEST REGION Total
27RD R. SANIGA Total2715272027232725274827542761276727712780
2715272027232725274827542761276727712780
1,129 1,233 91.6%1,129 1,233 91.6%
123 136 90.4%132 141 93.6%136 145 93.8%121 136 89.0%114 126 90.5%95 105 90.5%
112 131 85.5%85 87 97.7%95 105 90.5%
116 121 95.9%

Homer Fund Campaign Store ReportReport prepared by HR Reporting & AnalyticsData as of 11/3/2017
DIVISION REGION DISTRICT HR Store Nbr Finance Store Nbr Participants Headcount PART%ND NORTHERN DIVISION 09A1 MID ATLANTIC REGION Total
41RA A. MAZZOLA Total41024104413241434145415841634187
41024104413241434145415841634187
1,042 1,175 88.7%1,042 1,175 88.7%
152 158 96.2%142 157 90.4%122 152 80.3%160 175 91.4%117 138 84.8%114 137 83.2%107 118 90.7%128 140 91.4%

Homer Fund Campaign Store ReportReport prepared by HR Reporting & AnalyticsData as of 11/3/2017
DIVISION REGION DISTRICT HR Store Nbr Finance Store Nbr Participants Headcount PART%ND NORTHERN DIVISION 09A1 MID ATLANTIC REGION Total
41RD B. DENNISON Total41014103410941124134415041666866
41014103410941124134415041666866
1,273 1,462 87.1%1,273 1,462 87.1%
137 185 74.1%151 163 92.6%160 178 89.9%224 278 80.6%123 143 86.0%204 206 99.0%155 181 85.6%119 128 93.0%

Homer Fund Campaign Store ReportReport prepared by HR Reporting & AnalyticsData as of 11/3/2017
DIVISION REGION DISTRICT HR Store Nbr Finance Store Nbr Participants Headcount PART%ND NORTHERN DIVISION 09A1 MID ATLANTIC REGION Total
25RA B. MUNGUL Total25022504250625102565257625772587
25022504250625102565257625772587
1,039 1,195 86.9%1,039 1,195 86.9%
116 128 90.6%146 168 86.9%151 175 86.3%108 124 87.1%137 163 84.0%103 122 84.4%130 149 87.2%148 166 89.2%

Homer Fund Campaign Store ReportReport prepared by HR Reporting & AnalyticsData as of 11/3/2017
DIVISION REGION DISTRICT HR Store Nbr Finance Store Nbr Participants Headcount PART%ND NORTHERN DIVISION 09A1 MID ATLANTIC REGION Total
25RD H. COLLAZO Total16011602160316041605160816102561257868438440
16011602160316041605160816102561257868438440
1,200 1,316 91.2%1,200 1,316 91.2%
126 147 85.7%118 144 81.9%119 131 90.8%103 119 86.6%123 124 99.2%99 99 100.0%99 110 90.0%99 99 100.0%
114 122 93.4%90 102 88.2%
110 119 92.4%

Homer Fund Campaign Store ReportReport prepared by HR Reporting & AnalyticsData as of 11/3/2017
DIVISION REGION DISTRICT HR Store Nbr Finance Store Nbr Participants Headcount PART%ND NORTHERN DIVISION 09A1 MID ATLANTIC REGION Total
25RE J. EMGE Total250325052507256625792580258125846945
250325052507256625792580258125846945
1,261 1,411 89.4%1,261 1,411 89.4%
137 158 86.7%207 221 93.7%150 159 94.3%154 172 89.5%162 192 84.4%112 119 94.1%111 129 86.0%129 150 86.0%99 111 89.2%

Homer Fund Campaign Store ReportReport prepared by HR Reporting & AnalyticsData as of 11/3/2017
DIVISION REGION DISTRICT HR Store Nbr Finance Store Nbr Participants Headcount PART%ND NORTHERN DIVISION 09A1 MID ATLANTIC REGION Total
46RC J. ZUNIGA Total25512552255425552558256325642583
25512552255425552558256325642583
1,321 1,599 82.6%1,321 1,599 82.6%
158 174 90.8%125 156 80.1%119 164 72.6%127 157 80.9%305 313 97.4%108 149 72.5%173 240 72.1%206 246 83.7%

Homer Fund Campaign Store ReportReport prepared by HR Reporting & AnalyticsData as of 11/3/2017
DIVISION REGION DISTRICT HR Store Nbr Finance Store Nbr Participants Headcount PART%ND NORTHERN DIVISION 09A1 MID ATLANTIC REGION Total
46RD L. HARTLEY Total46014602460546084639464046418551
46014602460546084639464046418551
1,301 1,490 87.3%1,301 1,490 87.3%
167 194 86.1%119 136 87.5%194 202 96.0%222 277 80.1%147 156 94.2%139 183 76.0%193 195 99.0%120 147 81.6%

Homer Fund Campaign Store ReportReport prepared by HR Reporting & AnalyticsData as of 11/3/2017
DIVISION REGION DISTRICT HR Store Nbr Finance Store Nbr Participants Headcount PART%ND NORTHERN DIVISION 09A1 MID ATLANTIC REGION Total
46RA M. BOBBITT Total4603460446074617462046374638464846608552
4603460446074617462046374638464846608552
1,337 1,465 91.3%1,337 1,465 91.3%
131 169 77.5%202 221 91.4%115 124 92.7%214 228 93.9%99 103 96.1%
106 108 98.1%128 146 87.7%126 133 94.7%93 109 85.3%
123 124 99.2%

Homer Fund Campaign Store ReportReport prepared by HR Reporting & AnalyticsData as of 11/3/2017
DIVISION REGION DISTRICT HR Store Nbr Finance Store Nbr Participants Headcount PART%ND NORTHERN DIVISION 09A1 MID ATLANTIC REGION Total
25RB P. GINNETTI Total2509251125502559256025674618462146474805
2509251125502559256025674618462146474805
1,447 1,644 88.0%1,447 1,644 88.0%
225 248 90.7%113 136 83.1%214 257 83.3%121 132 91.7%201 212 94.8%107 119 89.9%88 100 88.0%
141 162 87.0%143 160 89.4%94 118 79.7%

Homer Fund Campaign Store ReportReport prepared by HR Reporting & AnalyticsData as of 11/3/2017
DIVISION REGION DISTRICT HR Store Nbr Finance Store Nbr Participants Headcount PART%ND NORTHERN DIVISION 09A1 MID ATLANTIC REGION Total
41RG T. MCCARTHY Total41064114411941214137414241814188
41064114411941214137414241814188
1,101 1,210 91.0%1,101 1,210 91.0%
109 129 84.5%179 184 97.3%122 152 80.3%103 114 90.4%136 146 93.2%149 159 93.7%151 165 91.5%152 161 94.4%

Homer Fund Campaign Store ReportReport prepared by HR Reporting & AnalyticsData as of 11/3/2017
DIVISION REGION DISTRICT HR Store Nbr Finance Store Nbr Participants Headcount PART%ND NORTHERN DIVISION 09A1 MID ATLANTIC REGION Total
25RC W. SHUELL Total250125572562257125752582258985488550
250125572562257125752582258985488550
1,054 1,299 81.1%1,054 1,299 81.1%
109 132 82.6%127 150 84.7%113 131 86.3%106 126 84.1%119 152 78.3%134 170 78.8%142 172 82.6%107 136 78.7%97 130 74.6%

Homer Fund Campaign Store ReportReport prepared by HR Reporting & AnalyticsData as of 11/3/2017
DIVISION REGION DISTRICT HR Store Nbr Finance Store Nbr Participants Headcount PART%ND NORTHERN DIVISION 09A2 NEW ENGLAND REGION Total
26RJ B. KINNEY Total3402340634073408348534884501450245518539
3402340634073408348534884501450245518539
959 1,130 84.9%959 1,130 84.9%94 113 83.2%
101 123 82.1%85 94 90.4%86 102 84.3%
125 146 85.6%100 134 74.6%118 143 82.5%94 96 97.9%81 95 85.3%75 84 89.3%

Homer Fund Campaign Store ReportReport prepared by HR Reporting & AnalyticsData as of 11/3/2017
DIVISION REGION DISTRICT HR Store Nbr Finance Store Nbr Participants Headcount PART%ND NORTHERN DIVISION 09A2 NEW ENGLAND REGION Total
26RQ B. WILLIAMS Total260726092651266926712672267426812684
260726092651266926712672267426812684
1,197 1,495 80.1%1,197 1,495 80.1%
115 145 79.3%113 141 80.1%148 179 82.7%202 238 84.9%112 164 68.3%114 141 80.9%143 173 82.7%127 159 79.9%123 155 79.4%

Homer Fund Campaign Store ReportReport prepared by HR Reporting & AnalyticsData as of 11/3/2017
DIVISION REGION DISTRICT HR Store Nbr Finance Store Nbr Participants Headcount PART%ND NORTHERN DIVISION 09A2 NEW ENGLAND REGION Total
62RA H. MALAK Total6201620262036208621762236225623362358473
6201620262036208621762236225623362358473
1,098 1,283 85.6%1,098 1,283 85.6%
99 114 86.8%120 135 88.9%104 117 88.9%94 99 94.9%
110 130 84.6%121 152 79.6%138 145 95.2%110 131 84.0%111 139 79.9%91 121 75.2%

Homer Fund Campaign Store ReportReport prepared by HR Reporting & AnalyticsData as of 11/3/2017
DIVISION REGION DISTRICT HR Store Nbr Finance Store Nbr Participants Headcount PART%ND NORTHERN DIVISION 09A2 NEW ENGLAND REGION Total
26RC J. CARR Total2614262326532663268634043405340934898931
2614262326532663268634043405340934898931
1,194 1,437 83.1%1,194 1,437 83.1%
170 191 89.0%120 146 82.2%112 165 67.9%124 133 93.2%137 184 74.5%126 139 90.6%100 108 92.6%122 137 89.1%99 119 83.2%84 115 73.0%

Homer Fund Campaign Store ReportReport prepared by HR Reporting & AnalyticsData as of 11/3/2017
DIVISION REGION DISTRICT HR Store Nbr Finance Store Nbr Participants Headcount PART%ND NORTHERN DIVISION 09A2 NEW ENGLAND REGION Total
26RF J. PHILLIPS Total24012403240424052406240724082409241024122414
24012403240424052406240724082409241024122414
1,050 1,284 81.8%1,050 1,284 81.8%
90 111 81.1%117 142 82.4%87 109 79.8%78 132 59.1%
102 117 87.2%100 120 83.3%100 109 91.7%73 81 90.1%91 110 82.7%94 115 81.7%
118 138 85.5%

Homer Fund Campaign Store ReportReport prepared by HR Reporting & AnalyticsData as of 11/3/2017
DIVISION REGION DISTRICT HR Store Nbr Finance Store Nbr Participants Headcount PART%ND NORTHERN DIVISION 09A2 NEW ENGLAND REGION Total
26RH J. WORRELL Total2610261926242662267626782682268384528923
2610261926242662267626782682268384528923
1,226 1,451 84.5%1,226 1,451 84.5%
154 154 100.0%87 101 86.1%
125 143 87.4%148 158 93.7%142 185 76.8%119 143 83.2%133 165 80.6%109 145 75.2%102 127 80.3%107 130 82.3%

Homer Fund Campaign Store ReportReport prepared by HR Reporting & AnalyticsData as of 11/3/2017
DIVISION REGION DISTRICT HR Store Nbr Finance Store Nbr Participants Headcount PART%ND NORTHERN DIVISION 09A2 NEW ENGLAND REGION Total
26RE K. CHAMBERLAND Total265942794280428242834284428542864287
265942794280428242834284428542864287
1,057 1,229 86.0%1,057 1,229 86.0%
147 164 89.6%103 119 86.6%103 116 88.8%115 138 83.3%135 147 91.8%99 138 71.7%
145 177 81.9%107 118 90.7%103 112 92.0%

Homer Fund Campaign Store ReportReport prepared by HR Reporting & AnalyticsData as of 11/3/2017
DIVISION REGION DISTRICT HR Store Nbr Finance Store Nbr Participants Headcount PART%ND NORTHERN DIVISION 09A2 NEW ENGLAND REGION Total
26RG L. CORELLI Total2603260526112612261326152650267326772680
2603260526112612261326152650267326772680
1,214 1,543 78.7%1,214 1,543 78.7%
97 123 78.9%155 183 84.7%121 143 84.6%143 191 74.9%98 130 75.4%
117 159 73.6%121 149 81.2%149 186 80.1%105 134 78.4%108 145 74.5%

Homer Fund Campaign Store ReportReport prepared by HR Reporting & AnalyticsData as of 11/3/2017
DIVISION REGION DISTRICT HR Store Nbr Finance Store Nbr Participants Headcount PART%ND NORTHERN DIVISION 09A2 NEW ENGLAND REGION Total
26RI R.LUNDY Total26022608266526672670267926888979
26022608266526672670267926888979
1,162 1,517 76.6%1,162 1,517 76.6%
166 221 75.1%126 162 77.8%134 175 76.6%196 250 78.4%127 156 81.4%145 220 65.9%126 159 79.2%142 174 81.6%

Homer Fund Campaign Store ReportReport prepared by HR Reporting & AnalyticsData as of 11/3/2017
DIVISION REGION DISTRICT HR Store Nbr Finance Store Nbr Participants Headcount PART%ND NORTHERN DIVISION 09A2 NEW ENGLAND REGION Total
62RC S. LONGMOORE Total487862066209621262136218622662296236
487862066209621262136218622662296236
1,274 1,432 89.0%1,274 1,432 89.0%
100 118 84.7%176 187 94.1%158 186 84.9%181 205 88.3%160 168 95.2%127 138 92.0%110 140 78.6%135 140 96.4%127 150 84.7%

Homer Fund Campaign Store ReportReport prepared by HR Reporting & AnalyticsData as of 11/3/2017
DIVISION REGION DISTRICT HR Store Nbr Finance Store Nbr Participants Headcount PART%ND NORTHERN DIVISION 09A2 NEW ENGLAND REGION Total
26RD S. THOMAS Total620762106214621562206221622862306234
620762106214621562206221622862306234
1,072 1,277 83.9%1,072 1,277 83.9%
146 180 81.1%133 159 83.6%140 166 84.3%128 146 87.7%142 181 78.5%99 108 91.7%
113 133 85.0%97 106 91.5%74 98 75.5%

Homer Fund Campaign Store ReportReport prepared by HR Reporting & AnalyticsData as of 11/3/2017
DIVISION REGION DISTRICT HR Store Nbr Finance Store Nbr Participants Headcount PART%ND NORTHERN DIVISION 09A2 NEW ENGLAND REGION Total
26RB S. WHITEHOUSE Total2668268534013403348034813482348434863487
2668268534013403348034813482348434863487
1,282 1,519 84.4%1,282 1,519 84.4%
137 162 84.6%130 165 78.8%148 170 87.1%98 126 77.8%
125 175 71.4%129 144 89.6%150 161 93.2%141 141 100.0%100 122 82.0%124 153 81.0%

Homer Fund Campaign Store ReportReport prepared by HR Reporting & AnalyticsData as of 11/3/2017
DIVISION REGION DISTRICT HR Store Nbr Finance Store Nbr Participants Headcount PART%ND NORTHERN DIVISION 09A3 NJ METRO REGION Total
09RE C. LILLISTON Total09020907091209200933094909510969
09020907091209200933094909510969
1,119 1,304 85.8%1,119 1,304 85.8%
139 159 87.4%130 148 87.8%138 179 77.1%138 159 86.8%139 148 93.9%150 188 79.8%147 170 86.5%138 153 90.2%

Homer Fund Campaign Store ReportReport prepared by HR Reporting & AnalyticsData as of 11/3/2017
DIVISION REGION DISTRICT HR Store Nbr Finance Store Nbr Participants Headcount PART%ND NORTHERN DIVISION 09A3 NJ METRO REGION Total
12RH C. PASSERELLI Total1217125112611271128461788456
1217125112611271128461788456
1,037 1,252 82.8%1,037 1,252 82.8%
109 141 77.3%158 194 81.4%185 198 93.4%148 189 78.3%113 135 83.7%122 133 91.7%202 262 77.1%

Homer Fund Campaign Store ReportReport prepared by HR Reporting & AnalyticsData as of 11/3/2017
DIVISION REGION DISTRICT HR Store Nbr Finance Store Nbr Participants Headcount PART%ND NORTHERN DIVISION 09A3 NJ METRO REGION Total
12RK C. WILKIE Total091709290930094009420943094609740975
091709290930094009420943094609740975
1,247 1,382 90.2%1,247 1,382 90.2%
143 180 79.4%124 147 84.4%157 159 98.7%174 180 96.7%153 164 93.3%136 142 95.8%130 144 90.3%123 143 86.0%107 123 87.0%

Homer Fund Campaign Store ReportReport prepared by HR Reporting & AnalyticsData as of 11/3/2017
DIVISION REGION DISTRICT HR Store Nbr Finance Store Nbr Participants Headcount PART%ND NORTHERN DIVISION 09A3 NJ METRO REGION Total
41RB D. AMATO Total093141054108411841224127414041736956
093141054108411841224127414041736956
1,216 1,365 89.1%1,216 1,365 89.1%
128 129 99.2%117 130 90.0%124 151 82.1%158 181 87.3%146 162 90.1%146 155 94.2%183 210 87.1%116 128 90.6%98 119 82.4%

Homer Fund Campaign Store ReportReport prepared by HR Reporting & AnalyticsData as of 11/3/2017
DIVISION REGION DISTRICT HR Store Nbr Finance Store Nbr Participants Headcount PART%ND NORTHERN DIVISION 09A3 NJ METRO REGION Total
09RK D. BARBOS Total090609090919092509410947095309620984
090609090919092509410947095309620984
1,310 1,490 87.9%1,310 1,490 87.9%
191 217 88.0%142 161 88.2%172 190 90.5%161 187 86.1%123 149 82.6%184 199 92.5%100 118 84.7%118 138 85.5%119 131 90.8%

Homer Fund Campaign Store ReportReport prepared by HR Reporting & AnalyticsData as of 11/3/2017
DIVISION REGION DISTRICT HR Store Nbr Finance Store Nbr Participants Headcount PART%ND NORTHERN DIVISION 09A3 NJ METRO REGION Total
41RJ D. BUSSIERE Total41104131414141644171418568418955
41104131414141644171418568418955
829 983 84.3%829 983 84.3%133 156 85.3%164 196 83.7%91 105 86.7%70 89 78.7%96 107 89.7%96 101 95.0%81 104 77.9%98 125 78.4%

Homer Fund Campaign Store ReportReport prepared by HR Reporting & AnalyticsData as of 11/3/2017
DIVISION REGION DISTRICT HR Store Nbr Finance Store Nbr Participants Headcount PART%ND NORTHERN DIVISION 09A3 NJ METRO REGION Total
12RF D. HAGEN Total12071227124212501266416261726176
12071227124212501266416261726176
801 989 81.0%801 989 81.0%93 120 77.5%78 102 76.5%
110 143 76.9%133 155 85.8%116 146 79.5%91 104 87.5%97 125 77.6%83 94 88.3%

Homer Fund Campaign Store ReportReport prepared by HR Reporting & AnalyticsData as of 11/3/2017
DIVISION REGION DISTRICT HR Store Nbr Finance Store Nbr Participants Headcount PART%ND NORTHERN DIVISION 09A3 NJ METRO REGION Total
09RI M. SALTARELLI Total090309160918092609440957096109816911
090309160918092609440957096109816911
1,214 1,455 83.4%1,214 1,455 83.4%
133 153 86.9%133 166 80.1%144 187 77.0%146 179 81.6%117 148 79.1%140 155 90.3%118 134 88.1%156 184 84.8%127 149 85.2%

Homer Fund Campaign Store ReportReport prepared by HR Reporting & AnalyticsData as of 11/3/2017
DIVISION REGION DISTRICT HR Store Nbr Finance Store Nbr Participants Headcount PART%ND NORTHERN DIVISION 09A3 NJ METRO REGION Total
41RE R. HOMMERBOCKER Total4113412041254138414941684177
4113412041254138414941684177
746 838 89.0%746 838 89.0%111 130 85.4%122 135 90.4%105 120 87.5%120 124 96.8%81 97 83.5%94 108 87.0%
113 124 91.1%

Homer Fund Campaign Store ReportReport prepared by HR Reporting & AnalyticsData as of 11/3/2017
DIVISION REGION DISTRICT HR Store Nbr Finance Store Nbr Participants Headcount PART%ND NORTHERN DIVISION 09A3 NJ METRO REGION Total
09RJ S. LABADY Total091409210927093909700976098209896917
091409210927093909700976098209896917
1,189 1,428 83.3%1,189 1,428 83.3%
147 171 86.0%126 148 85.1%140 173 80.9%132 157 84.1%114 135 84.4%136 183 74.3%112 119 94.1%163 209 78.0%119 133 89.5%

Homer Fund Campaign Store ReportReport prepared by HR Reporting & AnalyticsData as of 11/3/2017
DIVISION REGION DISTRICT HR Store Nbr Finance Store Nbr Participants Headcount PART%ND NORTHERN DIVISION 09A5 METRO NY REGION Total
09RC A. SINGH Total0901090809100959096509778475
0901090809100959096509778475
1,103 1,309 84.3%1,103 1,309 84.3%
153 196 78.1%169 219 77.2%142 170 83.5%203 213 95.3%133 147 90.5%128 142 90.1%175 222 78.8%

Homer Fund Campaign Store ReportReport prepared by HR Reporting & AnalyticsData as of 11/3/2017
DIVISION REGION DISTRICT HR Store Nbr Finance Store Nbr Participants Headcount PART%ND NORTHERN DIVISION 09A5 METRO NY REGION Total
09RA F. LONGOBARDI Total090409220932095009630983
090409220932095009630983
785 1,081 72.6%785 1,081 72.6%131 167 78.4%121 218 55.5%142 169 84.0%133 173 76.9%124 151 82.1%134 203 66.0%

Homer Fund Campaign Store ReportReport prepared by HR Reporting & AnalyticsData as of 11/3/2017
DIVISION REGION DISTRICT HR Store Nbr Finance Store Nbr Participants Headcount PART%ND NORTHERN DIVISION 09A5 METRO NY REGION Total
12RE F. RAMIREZ Total12081215121612386152
12081215121612386152
916 1,305 70.2%916 1,305 70.2%212 311 68.2%213 311 68.5%159 197 80.7%137 203 67.5%195 283 68.9%

Homer Fund Campaign Store ReportReport prepared by HR Reporting & AnalyticsData as of 11/3/2017
DIVISION REGION DISTRICT HR Store Nbr Finance Store Nbr Participants Headcount PART%ND NORTHERN DIVISION 09A5 METRO NY REGION Total
12RM M. BELLO Total1225124912561281615061586957
1225124912561281615061586957
1,135 1,441 78.8%1,135 1,441 78.8%
180 266 67.7%179 192 93.2%209 269 77.7%141 174 81.0%131 173 75.7%120 147 81.6%175 220 79.5%

Homer Fund Campaign Store ReportReport prepared by HR Reporting & AnalyticsData as of 11/3/2017
DIVISION REGION DISTRICT HR Store Nbr Finance Store Nbr Participants Headcount PART%ND NORTHERN DIVISION 09A5 METRO NY REGION Total
12RB M. ESPOSITO Total1202121112721285616769558466
1202121112721285616769558466
1,011 1,205 83.9%1,011 1,205 83.9%
159 193 82.4%155 183 84.7%166 184 90.2%141 169 83.4%123 152 80.9%128 156 82.1%139 168 82.7%

Homer Fund Campaign Store ReportReport prepared by HR Reporting & AnalyticsData as of 11/3/2017
DIVISION REGION DISTRICT HR Store Nbr Finance Store Nbr Participants Headcount PART%ND NORTHERN DIVISION 09A5 METRO NY REGION Total
12RL P. IAQUINTA Total1206121312181267127461058465
1206121312181267127461058465
1,162 1,620 71.7%1,162 1,620 71.7%
176 249 70.7%166 288 57.6%183 216 84.7%149 206 72.3%148 241 61.4%195 237 82.3%145 183 79.2%

Homer Fund Campaign Store ReportReport prepared by HR Reporting & AnalyticsData as of 11/3/2017
DIVISION REGION DISTRICT HR Store Nbr Finance Store Nbr Participants Headcount PART%ND NORTHERN DIVISION 09A5 METRO NY REGION Total
09RH R. ODDO Total1212122112451248620468776891
1212122112451248620468776891
1,490 1,681 88.6%1,490 1,681 88.6%
206 232 88.8%163 198 82.3%216 229 94.3%274 280 97.9%265 291 91.1%213 265 80.4%153 186 82.3%

Homer Fund Campaign Store ReportReport prepared by HR Reporting & AnalyticsData as of 11/3/2017
DIVISION REGION DISTRICT HR Store Nbr Finance Store Nbr Participants Headcount PART%ND NORTHERN DIVISION 09A5 METRO NY REGION Total
61RA R. WICKKISER Total091561756177684569036905
091561756177684569036905
1,041 1,451 71.7%1,041 1,451 71.7%
303 398 76.1%227 390 58.2%201 296 67.9%106 144 73.6%92 108 85.2%
112 115 97.4%

Homer Fund Campaign Store ReportReport prepared by HR Reporting & AnalyticsData as of 11/3/2017
DIVISION REGION DISTRICT HR Store Nbr Finance Store Nbr Participants Headcount PART%ND NORTHERN DIVISION 09A5 METRO NY REGION Total
12RO S. LEIGHTON Total121412201255127768446928
121412201255127768446928
1,136 1,436 79.1%1,136 1,436 79.1%
207 243 85.2%250 307 81.4%213 335 63.6%168 205 82.0%137 171 80.1%161 175 92.0%
Homer Fund Campaign Store ReportReport prepared by HR Reporting & AnalyticsData as of 11/3/2017
DIVISION REGION DISTRICT HR Store Nbr Finance Store Nbr Participants Headcount PART%ND NORTHERN DIVISION 09A5 METRO NY REGION Total
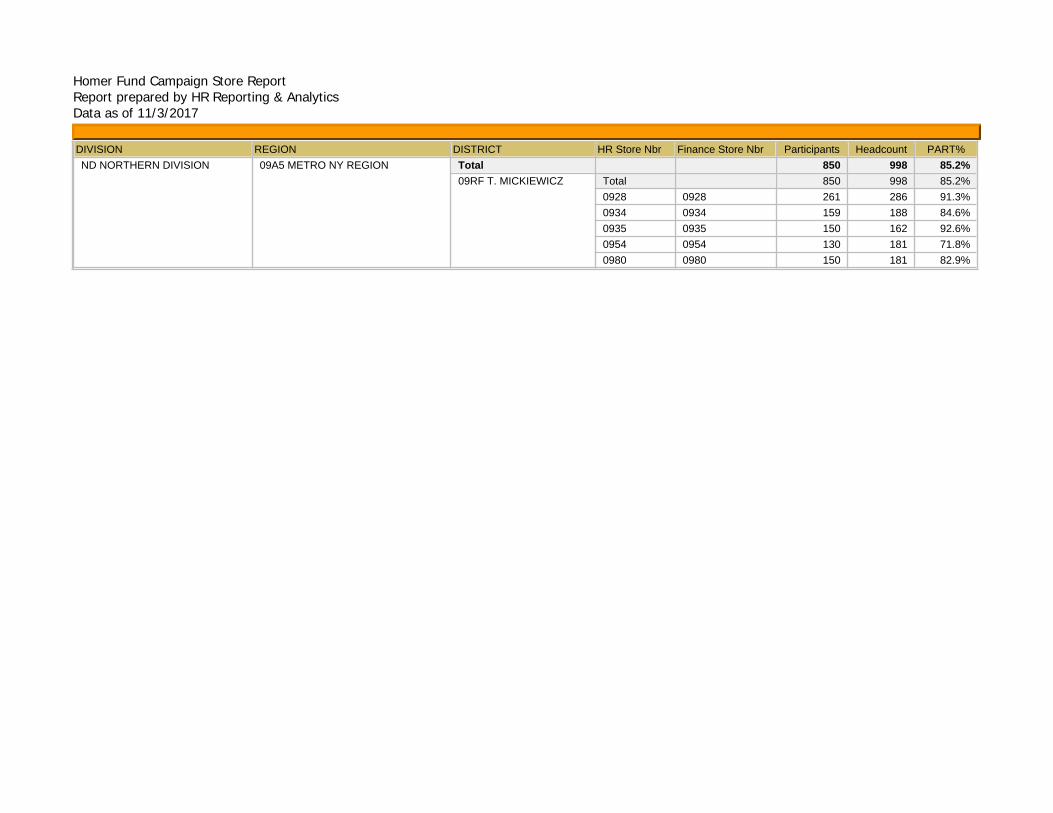
09RF T. MICKIEWICZ Total09280934093509540980
09280934093509540980
850 998 85.2%850 998 85.2%261 286 91.3%159 188 84.6%150 162 92.6%130 181 71.8%150 181 82.9%

Homer Fund Campaign Store ReportReport prepared by HR Reporting & AnalyticsData as of 11/3/2017
DIVISION REGION DISTRICT HR Store Nbr Finance Store Nbr Participants Headcount PART%ND NORTHERN DIVISION 09A5 METRO NY REGION Total
12RA Y. STUBBS Total1209122212291258126512828958
1209122212291258126512828958
901 1,200 75.1%901 1,200 75.1%112 133 84.2%165 212 77.8%93 150 62.0%
159 216 73.6%134 185 72.4%140 175 80.0%98 129 76.0%

Homer Fund Campaign Store ReportReport prepared by HR Reporting & AnalyticsData as of 11/3/2017
DIVISION REGION DISTRICT HR Store Nbr Finance Store Nbr Participants Headcount PART%RL REVERSE LOGISTICS RLA1 REVERSE LOGISTICS REG Total
69RA REVERSE LOGISTICS Total86158616861786668680
86158616861786668680
979 1,209 81.0%979 1,209 81.0%238 342 69.6%295 383 77.0%392 425 92.2%26 28 92.9%28 31 90.3%

Homer Fund Campaign Store ReportReport prepared by HR Reporting & AnalyticsData as of 11/3/2017
DIVISION REGION DISTRICT HR Store Nbr Finance Store Nbr Participants Headcount PART%SD SOUTHERN DIVISION 01A1 MIDSOUTH REGION Total
01RI B. REICK Total0136016008060809081308160817088368898527
0136016008060809081308160817088368898527
948 1,118 84.8%948 1,118 84.8%141 150 94.0%107 127 84.3%78 98 79.6%
100 108 92.6%102 115 88.7%105 114 92.1%99 132 75.0%87 116 75.0%42 66 63.6%87 92 94.6%

Homer Fund Campaign Store ReportReport prepared by HR Reporting & AnalyticsData as of 11/3/2017
DIVISION REGION DISTRICT HR Store Nbr Finance Store Nbr Participants Headcount PART%SD SOUTHERN DIVISION 01A1 MIDSOUTH REGION Total
01RB D. PEEBLES Total0132013301390143015168616940694169428924
0132013301390143015168616940694169428924
1,069 1,268 84.3%1,069 1,268 84.3%
97 121 80.2%96 115 83.5%
108 128 84.4%113 142 79.6%165 185 89.2%103 115 89.6%104 122 85.2%112 122 91.8%76 111 68.5%95 107 88.8%

Homer Fund Campaign Store ReportReport prepared by HR Reporting & AnalyticsData as of 11/3/2017
DIVISION REGION DISTRICT HR Store Nbr Finance Store Nbr Participants Headcount PART%SD SOUTHERN DIVISION 01A1 MIDSOUTH REGION Total
01RJ E. TUMMINGS Total01100126012801290144016501721774177569798584
01100126012801290144016501721774177569798584
1,058 1,297 81.6%1,058 1,297 81.6%
92 122 75.4%128 150 85.3%109 132 82.6%103 118 87.3%104 127 81.9%95 112 84.8%82 107 76.6%76 102 74.5%91 114 79.8%
105 123 85.4%73 90 81.1%

Homer Fund Campaign Store ReportReport prepared by HR Reporting & AnalyticsData as of 11/3/2017
DIVISION REGION DISTRICT HR Store Nbr Finance Store Nbr Participants Headcount PART%SD SOUTHERN DIVISION 01A1 MIDSOUTH REGION Total
03RA F. WEBB Total03490359036203680371037803830385
03490359036203680371037803830385
1,079 1,209 89.2%1,079 1,209 89.2%
200 248 80.6%155 165 93.9%146 160 91.3%113 122 92.6%87 96 90.6%
114 121 94.2%94 124 75.8%
170 173 98.3%

Homer Fund Campaign Store ReportReport prepared by HR Reporting & AnalyticsData as of 11/3/2017
DIVISION REGION DISTRICT HR Store Nbr Finance Store Nbr Participants Headcount PART%SD SOUTHERN DIVISION 01A1 MIDSOUTH REGION Total
01RH G. DEMARINIS Total0115011701180121013001540159174969866996
0115011701180121013001540159174969866996
1,332 1,652 80.6%1,332 1,652 80.6%
106 161 65.8%141 179 78.8%167 182 91.8%166 243 68.3%169 196 86.2%103 133 77.4%128 179 71.5%143 161 88.8%204 213 95.8%
5 5 100.0%

Homer Fund Campaign Store ReportReport prepared by HR Reporting & AnalyticsData as of 11/3/2017
DIVISION REGION DISTRICT HR Store Nbr Finance Store Nbr Participants Headcount PART%SD SOUTHERN DIVISION 01A1 MIDSOUTH REGION Total
07RB J. COGDELL Total0703070407250727072907370779290384698916
0703070407250727072907370779290384698916
1,043 1,182 88.2%1,043 1,182 88.2%
122 146 83.6%120 128 93.8%128 139 92.1%85 92 92.4%90 102 88.2%87 113 77.0%65 66 98.5%
122 137 89.1%100 116 86.2%124 143 86.7%

Homer Fund Campaign Store ReportReport prepared by HR Reporting & AnalyticsData as of 11/3/2017
DIVISION REGION DISTRICT HR Store Nbr Finance Store Nbr Participants Headcount PART%SD SOUTHERN DIVISION 01A1 MIDSOUTH REGION Total
05RN J. HICKINGBOTTOM Total0357036003630367037003740375037603800389
0357036003630367037003740375037603800389
1,109 1,267 87.5%1,109 1,267 87.5%
169 187 90.4%107 111 96.4%82 95 86.3%
108 145 74.5%99 119 83.2%80 93 86.0%
166 175 94.9%97 107 90.7%
130 142 91.5%71 93 76.3%

Homer Fund Campaign Store ReportReport prepared by HR Reporting & AnalyticsData as of 11/3/2017
DIVISION REGION DISTRICT HR Store Nbr Finance Store Nbr Participants Headcount PART%SD SOUTHERN DIVISION 01A1 MIDSOUTH REGION Total
01RL J. KING Total01370742074307700803080408120884088817698577
01370742074307700803080408120884088817698577
1,127 1,312 85.9%1,127 1,312 85.9%
102 115 88.7%113 132 85.6%98 117 83.8%95 118 80.5%
118 137 86.1%148 162 91.4%81 104 77.9%92 106 86.8%99 105 94.3%85 102 83.3%96 114 84.2%

Homer Fund Campaign Store ReportReport prepared by HR Reporting & AnalyticsData as of 11/3/2017
DIVISION REGION DISTRICT HR Store Nbr Finance Store Nbr Participants Headcount PART%SD SOUTHERN DIVISION 01A1 MIDSOUTH REGION Total
01RA K. TOVEY Total0105013101470149016101751754175518566978
0105013101470149016101751754175518566978
1,119 1,414 79.1%1,119 1,414 79.1%
116 130 89.2%117 169 69.2%107 130 82.3%129 153 84.3%133 156 85.3%111 147 75.5%92 134 68.7%
106 136 77.9%101 126 80.2%107 133 80.5%

Homer Fund Campaign Store ReportReport prepared by HR Reporting & AnalyticsData as of 11/3/2017
DIVISION REGION DISTRICT HR Store Nbr Finance Store Nbr Participants Headcount PART%SD SOUTHERN DIVISION 01A1 MIDSOUTH REGION Total
29RA K. WILLIAMS Total036629022906290729092912291329142917
036629022906290729092912291329142917
932 1,038 89.8%932 1,038 89.8%119 141 84.4%98 103 95.1%
108 108 100.0%102 119 85.7%117 128 91.4%92 103 89.3%91 93 97.8%84 114 73.7%
121 129 93.8%

Homer Fund Campaign Store ReportReport prepared by HR Reporting & AnalyticsData as of 11/3/2017
DIVISION REGION DISTRICT HR Store Nbr Finance Store Nbr Participants Headcount PART%SD SOUTHERN DIVISION 01A1 MIDSOUTH REGION Total
01RC M. CHAPMAN Total010601110116014601530156176317776943
010601110116014601530156176317776943
1,166 1,378 84.6%1,166 1,378 84.6%
93 108 86.1%215 224 96.0%130 147 88.4%111 138 80.4%110 143 76.9%141 175 80.6%152 160 95.0%105 155 67.7%109 128 85.2%

Homer Fund Campaign Store ReportReport prepared by HR Reporting & AnalyticsData as of 11/3/2017
DIVISION REGION DISTRICT HR Store Nbr Finance Store Nbr Participants Headcount PART%SD SOUTHERN DIVISION 01A1 MIDSOUTH REGION Total
03RB R. LEBLANC Total0347035203580365037303862901290529102915
0347035203580365037303862901290529102915
994 1,213 81.9%994 1,213 81.9%100 139 71.9%97 98 99.0%
117 166 70.5%86 112 76.8%
124 124 100.0%83 108 76.9%
118 127 92.9%75 106 70.8%
101 122 82.8%93 111 83.8%

Homer Fund Campaign Store ReportReport prepared by HR Reporting & AnalyticsData as of 11/3/2017
DIVISION REGION DISTRICT HR Store Nbr Finance Store Nbr Participants Headcount PART%SD SOUTHERN DIVISION 01A1 MIDSOUTH REGION Total
01RD S. HOOD Total0805081008180866087508770880088108820887
0805081008180866087508770880088108820887
1,043 1,253 83.2%1,043 1,253 83.2%
108 122 88.5%103 109 94.5%100 109 91.7%77 101 76.2%
103 130 79.2%93 130 71.5%
120 131 91.6%120 171 70.2%102 125 81.6%117 125 93.6%

Homer Fund Campaign Store ReportReport prepared by HR Reporting & AnalyticsData as of 11/3/2017
DIVISION REGION DISTRICT HR Store Nbr Finance Store Nbr Participants Headcount PART%SD SOUTHERN DIVISION 01A1 MIDSOUTH REGION Total
01RF U. OPENE Total0114012301270138014801570164017868486977
0114012301270138014801570164017868486977
897 1,241 72.3%897 1,241 72.3%76 116 65.5%
101 140 72.1%89 111 80.2%75 108 69.4%92 131 70.2%
111 152 73.0%125 164 76.2%65 102 63.7%73 100 73.0%90 117 76.9%

Homer Fund Campaign Store ReportReport prepared by HR Reporting & AnalyticsData as of 11/3/2017
DIVISION REGION DISTRICT HR Store Nbr Finance Store Nbr Participants Headcount PART%SD SOUTHERN DIVISION 01A1 MIDSOUTH REGION Total
01RE W. SALEMI Total013401450152017417481750176417716888698084128413
013401450152017417481750176417716888698084128413
1,145 1,362 84.1%1,145 1,362 84.1%
125 172 72.7%113 134 84.3%102 123 82.9%107 135 79.3%59 67 88.1%
104 132 78.8%112 114 98.2%87 109 79.8%68 72 94.4%85 104 81.7%73 89 82.0%
110 111 99.1%

Homer Fund Campaign Store ReportReport prepared by HR Reporting & AnalyticsData as of 11/3/2017
DIVISION REGION DISTRICT HR Store Nbr Finance Store Nbr Participants Headcount PART%SD SOUTHERN DIVISION 01A2 SOUTH ATLANTIC REGION Total
36RM A. AMO Total36153616362036313632363436443647365236613663
36153616362036313632363436443647365236613663
1,316 1,577 83.4%1,316 1,577 83.4%
112 134 83.6%114 134 85.1%146 157 93.0%93 125 74.4%
125 160 78.1%138 167 82.6%122 150 81.3%130 150 86.7%141 162 87.0%91 113 80.5%
104 125 83.2%

Homer Fund Campaign Store ReportReport prepared by HR Reporting & AnalyticsData as of 11/3/2017
DIVISION REGION DISTRICT HR Store Nbr Finance Store Nbr Participants Headcount PART%SD SOUTHERN DIVISION 01A2 SOUTH ATLANTIC REGION Total
36RE B. BOAEN Total1104110511081119112411261127112911303625363736456918
1104110511081119112411261127112911303625363736456918
1,414 1,695 83.4%1,414 1,695 83.4%
107 134 79.9%101 111 91.0%78 101 77.2%
106 132 80.3%116 144 80.6%114 141 80.9%140 154 90.9%119 152 78.3%84 107 78.5%
131 165 79.4%109 112 97.3%117 124 94.4%92 118 78.0%

Homer Fund Campaign Store ReportReport prepared by HR Reporting & AnalyticsData as of 11/3/2017
DIVISION REGION DISTRICT HR Store Nbr Finance Store Nbr Participants Headcount PART%SD SOUTHERN DIVISION 01A2 SOUTH ATLANTIC REGION Total
46RB D. MCCOURT Total365046124613461446154619462246264635464346504656
365046124613461446154619462246264635464346504656
1,530 1,751 87.4%1,530 1,751 87.4%
107 127 84.3%139 147 94.6%121 135 89.6%145 168 86.3%169 205 82.4%137 158 86.7%106 132 80.3%159 182 87.4%98 116 84.5%
149 158 94.3%93 101 92.1%
107 122 87.7%

Homer Fund Campaign Store ReportReport prepared by HR Reporting & AnalyticsData as of 11/3/2017
DIVISION REGION DISTRICT HR Store Nbr Finance Store Nbr Participants Headcount PART%SD SOUTHERN DIVISION 01A2 SOUTH ATLANTIC REGION Total
07RC J. BISPING Total070107020724072807300731073607390740074407734658
070107020724072807300731073607390740074407734658
1,340 1,502 89.2%1,340 1,502 89.2%
96 117 82.1%94 99 94.9%
145 156 92.9%121 136 89.0%165 174 94.8%115 124 92.7%117 126 92.9%94 112 83.9%
117 141 83.0%88 108 81.5%
101 109 92.7%87 100 87.0%

Homer Fund Campaign Store ReportReport prepared by HR Reporting & AnalyticsData as of 11/3/2017
DIVISION REGION DISTRICT HR Store Nbr Finance Store Nbr Participants Headcount PART%SD SOUTHERN DIVISION 01A2 SOUTH ATLANTIC REGION Total
36RJ J. SIMMONS Total111611211122360936263629364836558580
111611211122360936263629364836558580
1,079 1,167 92.5%1,079 1,167 92.5%
124 140 88.6%116 125 92.8%159 167 95.2%120 134 89.6%130 136 95.6%151 168 89.9%90 93 96.8%
103 108 95.4%86 96 89.6%

Homer Fund Campaign Store ReportReport prepared by HR Reporting & AnalyticsData as of 11/3/2017
DIVISION REGION DISTRICT HR Store Nbr Finance Store Nbr Participants Headcount PART%SD SOUTHERN DIVISION 01A2 SOUTH ATLANTIC REGION Total
36RL J. STRIZ Total011911061109111011121114111717478913
011911061109111011121114111717478913
930 1,112 83.6%930 1,112 83.6%107 132 81.1%83 118 70.3%
110 127 86.6%91 100 91.0%
105 125 84.0%120 148 81.1%118 128 92.2%95 118 80.5%
101 116 87.1%

Homer Fund Campaign Store ReportReport prepared by HR Reporting & AnalyticsData as of 11/3/2017
DIVISION REGION DISTRICT HR Store Nbr Finance Store Nbr Participants Headcount PART%SD SOUTHERN DIVISION 01A2 SOUTH ATLANTIC REGION Total
07RG K. NEWELL Total07070720072607330735074507760778
07070720072607330735074507760778
971 1,096 88.6%971 1,096 88.6%162 169 95.9%90 117 76.9%
113 116 97.4%112 144 77.8%117 123 95.1%97 111 87.4%
125 144 86.8%155 172 90.1%

Homer Fund Campaign Store ReportReport prepared by HR Reporting & AnalyticsData as of 11/3/2017
DIVISION REGION DISTRICT HR Store Nbr Finance Store Nbr Participants Headcount PART%SD SOUTHERN DIVISION 01A2 SOUTH ATLANTIC REGION Total
36RI M. FORMAN Total360436053610362736333641365146094628463446558493
360436053610362736333641365146094628463446558493
1,352 1,542 87.7%1,352 1,542 87.7%
131 153 85.6%155 170 91.2%127 160 79.4%90 110 81.8%
125 135 92.6%106 120 88.3%110 121 90.9%92 103 89.3%
106 113 93.8%99 111 89.2%
124 148 83.8%87 98 88.8%

Homer Fund Campaign Store ReportReport prepared by HR Reporting & AnalyticsData as of 11/3/2017
DIVISION REGION DISTRICT HR Store Nbr Finance Store Nbr Participants Headcount PART%SD SOUTHERN DIVISION 01A2 SOUTH ATLANTIC REGION Total
36RA M. GILREATH Total3601360236033606360736083628363836393640364236463662
3601360236033606360736083628363836393640364236463662
1,392 1,641 84.8%1,392 1,641 84.8%
106 123 86.2%117 131 89.3%105 130 80.8%112 124 90.3%104 120 86.7%136 179 76.0%109 125 87.2%104 117 88.9%83 107 77.6%
120 136 88.2%84 98 85.7%
108 123 87.8%104 128 81.3%

Homer Fund Campaign Store ReportReport prepared by HR Reporting & AnalyticsData as of 11/3/2017
DIVISION REGION DISTRICT HR Store Nbr Finance Store Nbr Participants Headcount PART%SD SOUTHERN DIVISION 01A2 SOUTH ATLANTIC REGION Total
07RA N. ROHDERT Total072107220723073207340747074807720775
072107220723073207340747074807720775
1,042 1,220 85.4%1,042 1,220 85.4%
116 145 80.0%129 150 86.0%156 180 86.7%205 249 82.3%92 130 70.8%62 65 95.4%71 71 100.0%
100 104 96.2%111 126 88.1%

Homer Fund Campaign Store ReportReport prepared by HR Reporting & AnalyticsData as of 11/3/2017
DIVISION REGION DISTRICT HR Store Nbr Finance Store Nbr Participants Headcount PART%SD SOUTHERN DIVISION 01A2 SOUTH ATLANTIC REGION Total
23RA R. YOUNG Total2002201623012302230323052307231323152316480148028429
2002201623012302230323052307231323152316480148028429
1,604 1,811 88.6%1,604 1,811 88.6%
110 137 80.3%150 162 92.6%129 145 89.0%103 128 80.5%109 131 83.2%156 178 87.6%148 158 93.7%141 160 88.1%160 176 90.9%118 127 92.9%105 107 98.1%69 93 74.2%
106 109 97.2%

Homer Fund Campaign Store ReportReport prepared by HR Reporting & AnalyticsData as of 11/3/2017
DIVISION REGION DISTRICT HR Store Nbr Finance Store Nbr Participants Headcount PART%SD SOUTHERN DIVISION 01A2 SOUTH ATLANTIC REGION Total
36RF T. CONNOLLY Total46114616462446274631463246334645465346544659
46114616462446274631463246334645465346544659
1,156 1,396 82.8%1,156 1,396 82.8%
100 128 78.1%91 115 79.1%
108 126 85.7%132 166 79.5%119 135 88.1%125 150 83.3%99 119 83.2%99 109 90.8%
124 148 83.8%73 94 77.7%86 106 81.1%

Homer Fund Campaign Store ReportReport prepared by HR Reporting & AnalyticsData as of 11/3/2017
DIVISION REGION DISTRICT HR Store Nbr Finance Store Nbr Participants Headcount PART%SD SOUTHERN DIVISION 02A2 SOUTHEAST REGION Total
02RM A. GHANY Total0801080208630865630163686377685369328472
0801080208630865630163686377685369328472
1,030 1,197 86.0%1,030 1,197 86.0%
84 106 79.2%94 104 90.4%
102 129 79.1%102 126 81.0%100 124 80.6%111 119 93.3%103 125 82.4%111 122 91.0%119 126 94.4%104 116 89.7%

Homer Fund Campaign Store ReportReport prepared by HR Reporting & AnalyticsData as of 11/3/2017
DIVISION REGION DISTRICT HR Store Nbr Finance Store Nbr Participants Headcount PART%SD SOUTHERN DIVISION 02A2 SOUTHEAST REGION Total
02RK E. GONZALEZ Total02440245025502560273027918551863631963278528
02440245025502560273027918551863631963278528
1,772 1,996 88.8%1,772 1,996 88.8%
198 209 94.7%178 198 89.9%189 222 85.1%186 192 96.9%153 161 95.0%195 228 85.5%128 144 88.9%118 150 78.7%170 203 83.7%124 154 80.5%133 135 98.5%

Homer Fund Campaign Store ReportReport prepared by HR Reporting & AnalyticsData as of 11/3/2017
DIVISION REGION DISTRICT HR Store Nbr Finance Store Nbr Participants Headcount PART%SD SOUTHERN DIVISION 02A2 SOUTHEAST REGION Total
02RJ J. CANNON Total023302620263026402876323633463356349636369368531
023302620263026402876323633463356349636369368531
1,640 1,834 89.4%1,640 1,834 89.4%
99 129 76.7%135 141 95.7%155 155 100.0%153 153 100.0%170 189 89.9%117 133 88.0%187 224 83.5%114 144 79.2%143 161 88.8%137 154 89.0%142 154 92.2%88 97 90.7%

Homer Fund Campaign Store ReportReport prepared by HR Reporting & AnalyticsData as of 11/3/2017
DIVISION REGION DISTRICT HR Store Nbr Finance Store Nbr Participants Headcount PART%SD SOUTHERN DIVISION 02A2 SOUTHEAST REGION Total
02RT K. TAWNEY Total0140015502540808177017736303637469598446
0140015502540808177017736303637469598446
1,021 1,149 88.9%1,021 1,149 88.9%
107 119 89.9%78 96 81.3%
155 170 91.2%85 99 85.9%82 86 95.3%87 105 82.9%
120 134 89.6%116 121 95.9%85 99 85.9%
106 120 88.3%

Homer Fund Campaign Store ReportReport prepared by HR Reporting & AnalyticsData as of 11/3/2017
DIVISION REGION DISTRICT HR Store Nbr Finance Store Nbr Participants Headcount PART%SD SOUTHERN DIVISION 02A2 SOUTHEAST REGION Total
02RN M. RODRIGUEZ Total0203024302486305631163246340637163806951
0203024302486305631163246340637163806951
1,390 1,528 91.0%1,390 1,528 91.0%
92 109 84.4%143 155 92.3%150 154 97.4%162 167 97.0%129 153 84.3%166 173 96.0%125 151 82.8%107 122 87.7%161 172 93.6%155 172 90.1%

Homer Fund Campaign Store ReportReport prepared by HR Reporting & AnalyticsData as of 11/3/2017
DIVISION REGION DISTRICT HR Store Nbr Finance Store Nbr Participants Headcount PART%SD SOUTHERN DIVISION 02A2 SOUTHEAST REGION Total
02RO P. DIXON Total0253027002780281185463326864686584478929
0253027002780281185463326864686584478929
1,340 1,440 93.1%1,340 1,440 93.1%
129 150 86.0%104 114 91.2%100 101 99.0%184 184 100.0%91 119 76.5%
156 159 98.1%94 102 92.2%
148 160 92.5%193 199 97.0%141 152 92.8%

Homer Fund Campaign Store ReportReport prepared by HR Reporting & AnalyticsData as of 11/3/2017
DIVISION REGION DISTRICT HR Store Nbr Finance Store Nbr Participants Headcount PART%SD SOUTHERN DIVISION 02A2 SOUTHEAST REGION Total
02RE S. GASKINS Total0238024702570288028963046321635763616364
0238024702570288028963046321635763616364
1,712 1,869 91.6%1,712 1,869 91.6%
122 135 90.4%186 198 93.9%246 259 95.0%165 192 85.9%152 173 87.9%147 165 89.1%175 204 85.8%220 222 99.1%133 143 93.0%166 178 93.3%

Homer Fund Campaign Store ReportReport prepared by HR Reporting & AnalyticsData as of 11/3/2017
DIVISION REGION DISTRICT HR Store Nbr Finance Store Nbr Participants Headcount PART%SD SOUTHERN DIVISION 02A2 SOUTHEAST REGION Total
36RC T. COLEMAN Total0122016301700179110311151118112017728954
0122016301700179110311151118112017728954
1,172 1,361 86.1%1,172 1,361 86.1%
108 140 77.1%97 105 92.4%
173 192 90.1%111 134 82.8%114 121 94.2%154 158 97.5%119 148 80.4%106 129 82.2%101 114 88.6%89 120 74.2%

Homer Fund Campaign Store ReportReport prepared by HR Reporting & AnalyticsData as of 11/3/2017
DIVISION REGION DISTRICT HR Store Nbr Finance Store Nbr Participants Headcount PART%SD SOUTHERN DIVISION 02A2 SOUTHEAST REGION Total
02RD V. SMALL Total023202610265026663286331635063676375685168698926
023202610265026663286331635063676375685168698926
1,752 1,897 92.4%1,752 1,897 92.4%
115 138 83.3%155 177 87.6%126 138 91.3%163 179 91.1%153 167 91.6%139 150 92.7%182 191 95.3%146 149 98.0%169 175 96.6%121 132 91.7%147 162 90.7%136 139 97.8%

Homer Fund Campaign Store ReportReport prepared by HR Reporting & AnalyticsData as of 11/3/2017
DIVISION REGION DISTRICT HR Store Nbr Finance Store Nbr Participants Headcount PART%SD SOUTHERN DIVISION 02A2 SOUTHEAST REGION Total
02RA W. RAYA Total014102260272027563466351636563696890692169356974
014102260272027563466351636563696890692169356974
1,567 1,799 87.1%1,567 1,799 87.1%
106 120 88.3%166 174 95.4%176 187 94.1%114 135 84.4%167 190 87.9%124 152 81.6%150 167 89.8%124 154 80.5%118 130 90.8%97 115 84.3%
116 122 95.1%109 153 71.2%

Homer Fund Campaign Store ReportReport prepared by HR Reporting & AnalyticsData as of 11/3/2017
DIVISION REGION DISTRICT HR Store Nbr Finance Store Nbr Participants Headcount PART%SD SOUTHERN DIVISION 02A4 SOUTH FLORIDA/PR REGION Total
02RB C. FRAGA Total020902220258028463266329634163536852
020902220258028463266329634163536852
1,391 1,731 80.4%1,391 1,731 80.4%
168 207 81.2%162 206 78.6%154 190 81.1%174 212 82.1%158 217 72.8%135 170 79.4%145 188 77.1%131 153 85.6%164 188 87.2%

Homer Fund Campaign Store ReportReport prepared by HR Reporting & AnalyticsData as of 11/3/2017
DIVISION REGION DISTRICT HR Store Nbr Finance Store Nbr Participants Headcount PART%SD SOUTHERN DIVISION 02A4 SOUTH FLORIDA/PR REGION Total
02RL C. MANGINO Total021302340260028363366381687168788545
021302340260028363366381687168788545
1,119 1,362 82.2%1,119 1,362 82.2%
140 167 83.8%163 186 87.6%110 135 81.5%105 141 74.5%145 163 89.0%124 169 73.4%98 125 78.4%87 123 70.7%
147 153 96.1%

Homer Fund Campaign Store ReportReport prepared by HR Reporting & AnalyticsData as of 11/3/2017
DIVISION REGION DISTRICT HR Store Nbr Finance Store Nbr Participants Headcount PART%SD SOUTHERN DIVISION 02A4 SOUTH FLORIDA/PR REGION Total
02RF J. BEESINGI Total020102680276028063486373695069758444
020102680276028063486373695069758444
1,552 2,008 77.3%1,552 2,008 77.3%
143 180 79.4%167 215 77.7%182 235 77.4%196 241 81.3%171 224 76.3%179 225 79.6%142 183 77.6%173 244 70.9%199 261 76.2%

Homer Fund Campaign Store ReportReport prepared by HR Reporting & AnalyticsData as of 11/3/2017
DIVISION REGION DISTRICT HR Store Nbr Finance Store Nbr Participants Headcount PART%SD SOUTHERN DIVISION 02A4 SOUTH FLORIDA/PR REGION Total
02RI J. LOPEZ Total022002210274631463206330637663796934
022002210274631463206330637663796934
1,365 1,722 79.3%1,365 1,722 79.3%
191 230 83.0%124 143 86.7%183 243 75.3%166 200 83.0%138 180 76.7%143 186 76.9%156 162 96.3%154 233 66.1%110 145 75.9%

Homer Fund Campaign Store ReportReport prepared by HR Reporting & AnalyticsData as of 11/3/2017
DIVISION REGION DISTRICT HR Store Nbr Finance Store Nbr Participants Headcount PART%SD SOUTHERN DIVISION 02A4 SOUTH FLORIDA/PR REGION Total
02RH M. VEGA Total020702776302630663136343635563786856
020702776302630663136343635563786856
1,681 2,060 81.6%1,681 2,060 81.6%
206 250 82.4%280 315 88.9%105 170 61.8%201 233 86.3%108 167 64.7%232 289 80.3%214 221 96.8%199 256 77.7%136 159 85.5%

Homer Fund Campaign Store ReportReport prepared by HR Reporting & AnalyticsData as of 11/3/2017
DIVISION REGION DISTRICT HR Store Nbr Finance Store Nbr Participants Headcount PART%SD SOUTHERN DIVISION 02A4 SOUTH FLORIDA/PR REGION Total
02RU R. RODRIGUEZ Total02080249025102856310631263226372
02080249025102856310631263226372
1,456 1,816 80.2%1,456 1,816 80.2%
173 204 84.8%167 191 87.4%199 267 74.5%183 214 85.5%259 297 87.2%119 147 81.0%157 263 59.7%199 233 85.4%

Homer Fund Campaign Store ReportReport prepared by HR Reporting & AnalyticsData as of 11/3/2017
DIVISION REGION DISTRICT HR Store Nbr Finance Store Nbr Participants Headcount PART%SD SOUTHERN DIVISION 02A4 SOUTH FLORIDA/PR REGION Total
02RC T. CRAWFORD Total02040205021802246315631663256356
02040205021802246315631663256356
1,504 1,675 89.8%1,504 1,675 89.8%
177 193 91.7%200 234 85.5%163 179 91.1%212 236 89.8%151 182 83.0%219 238 92.0%190 193 98.4%192 220 87.3%

Homer Fund Campaign Store ReportReport prepared by HR Reporting & AnalyticsData as of 11/3/2017
DIVISION REGION DISTRICT HR Store Nbr Finance Store Nbr Participants Headcount PART%SD SOUTHERN DIVISION 02A4 SOUTH FLORIDA/PR REGION Total
02RQ W. CORK Total02020206021063396872697682018622
02020206021063396872697682018622
1,284 1,552 82.7%1,284 1,552 82.7%
191 208 91.8%237 331 71.6%162 173 93.6%162 198 81.8%132 172 76.7%133 194 68.6%143 147 97.3%124 129 96.1%

Homer Fund Campaign Store ReportReport prepared by HR Reporting & AnalyticsData as of 11/3/2017
DIVISION REGION DISTRICT HR Store Nbr Finance Store Nbr Participants Headcount PART%SD SOUTHERN DIVISION 05A1 SOUTHWEST REGION Total
05RY A. BRYANT Total035603640381051365146545657965808540
035603640381051365146545657965808540
931 1,050 88.7%931 1,050 88.7%120 122 98.4%109 137 79.6%85 102 83.3%86 92 93.5%
138 156 88.5%106 114 93.0%110 124 88.7%92 103 89.3%85 100 85.0%

Homer Fund Campaign Store ReportReport prepared by HR Reporting & AnalyticsData as of 11/3/2017
DIVISION REGION DISTRICT HR Store Nbr Finance Store Nbr Participants Headcount PART%SD SOUTHERN DIVISION 05A1 SOUTHWEST REGION Total
14RC E. MARY Total140114021405140614071411141285378919
140114021405140614071411141285378919
900 1,058 85.1%900 1,058 85.1%140 174 80.5%101 109 92.7%87 112 77.7%
104 110 94.5%98 123 79.7%90 95 94.7%95 108 88.0%81 106 76.4%
104 121 86.0%

Homer Fund Campaign Store ReportReport prepared by HR Reporting & AnalyticsData as of 11/3/2017
DIVISION REGION DISTRICT HR Store Nbr Finance Store Nbr Participants Headcount PART%SD SOUTHERN DIVISION 05A1 SOUTHWEST REGION Total
05RL G. TAVARES Total053105390550055305566537655465898951
053105390550055305566537655465898951
1,215 1,353 89.8%1,215 1,353 89.8%
134 141 95.0%127 144 88.2%151 171 88.3%137 143 95.8%121 136 89.0%173 194 89.2%82 108 75.9%
152 161 94.4%138 155 89.0%

Homer Fund Campaign Store ReportReport prepared by HR Reporting & AnalyticsData as of 11/3/2017
DIVISION REGION DISTRICT HR Store Nbr Finance Store Nbr Participants Headcount PART%SD SOUTHERN DIVISION 05A1 SOUTHWEST REGION Total
05RE J. CONSTANTINO Total390139063908391139143917391865526831
390139063908391139143917391865526831
956 1,051 91.0%956 1,051 91.0%127 131 96.9%95 114 83.3%
123 133 92.5%116 120 96.7%100 101 99.0%96 109 88.1%80 94 85.1%
103 107 96.3%116 142 81.7%

Homer Fund Campaign Store ReportReport prepared by HR Reporting & AnalyticsData as of 11/3/2017
DIVISION REGION DISTRICT HR Store Nbr Finance Store Nbr Participants Headcount PART%SD SOUTHERN DIVISION 05A1 SOUTHWEST REGION Total
05RB J. LEWIS Total0542056105626515657165836593680768208521
0542056105626515657165836593680768208521
1,073 1,193 89.9%1,073 1,193 89.9%
143 159 89.9%126 145 86.9%143 158 90.5%122 138 88.4%106 119 89.1%94 98 95.9%16 26 61.5%97 105 92.4%
102 115 88.7%124 130 95.4%

Homer Fund Campaign Store ReportReport prepared by HR Reporting & AnalyticsData as of 11/3/2017
DIVISION REGION DISTRICT HR Store Nbr Finance Store Nbr Participants Headcount PART%SD SOUTHERN DIVISION 05A1 SOUTHWEST REGION Total
05RI K. LEITZ Total0527055105640589650365046555655765626833
0527055105640589650365046555655765626833
1,320 1,478 89.3%1,320 1,478 89.3%
112 129 86.8%125 142 88.0%151 162 93.2%169 182 92.9%111 137 81.0%148 157 94.3%125 136 91.9%110 138 79.7%118 137 86.1%151 158 95.6%

Homer Fund Campaign Store ReportReport prepared by HR Reporting & AnalyticsData as of 11/3/2017
DIVISION REGION DISTRICT HR Store Nbr Finance Store Nbr Participants Headcount PART%SD SOUTHERN DIVISION 05A1 SOUTHWEST REGION Total
05RP K. MOORE Total052905370541055405636520653465688438
052905370541055405636520653465688438
1,143 1,250 91.4%1,143 1,250 91.4%
146 166 88.0%117 123 95.1%176 176 100.0%112 134 83.6%140 156 89.7%93 102 91.2%
136 138 98.6%101 122 82.8%122 133 91.7%

Homer Fund Campaign Store ReportReport prepared by HR Reporting & AnalyticsData as of 11/3/2017
DIVISION REGION DISTRICT HR Store Nbr Finance Store Nbr Participants Headcount PART%SD SOUTHERN DIVISION 05A1 SOUTHWEST REGION Total
05RT K. PRUITT Total140314041409141022203012303830428445
140314041409141022203012303830428445
888 1,001 88.7%888 1,001 88.7%93 104 89.4%94 109 86.2%
101 101 100.0%74 87 85.1%94 116 81.0%
128 144 88.9%93 103 90.3%
104 111 93.7%107 126 84.9%

Homer Fund Campaign Store ReportReport prepared by HR Reporting & AnalyticsData as of 11/3/2017
DIVISION REGION DISTRICT HR Store Nbr Finance Store Nbr Participants Headcount PART%SD SOUTHERN DIVISION 05A1 SOUTHWEST REGION Total
05RA M. AKINS Total0507053005520555650568046816681785178976
0507053005520555650568046816681785178976
1,336 1,507 88.7%1,336 1,507 88.7%
148 160 92.5%102 124 82.3%159 168 94.6%172 184 93.5%126 141 89.4%157 210 74.8%169 175 96.6%86 103 83.5%
108 116 93.1%109 126 86.5%

Homer Fund Campaign Store ReportReport prepared by HR Reporting & AnalyticsData as of 11/3/2017
DIVISION REGION DISTRICT HR Store Nbr Finance Store Nbr Participants Headcount PART%SD SOUTHERN DIVISION 05A1 SOUTHWEST REGION Total
03RC O. DELAVEGA Total050505220523350535103515351668278523
050505220523350535103515351668278523
1,057 1,184 89.3%1,057 1,184 89.3%
142 153 92.8%172 190 90.5%123 139 88.5%104 111 93.7%94 110 85.5%85 102 83.3%72 88 81.8%
139 157 88.5%126 134 94.0%

Homer Fund Campaign Store ReportReport prepared by HR Reporting & AnalyticsData as of 11/3/2017
DIVISION REGION DISTRICT HR Store Nbr Finance Store Nbr Participants Headcount PART%SD SOUTHERN DIVISION 05A1 SOUTHWEST REGION Total
05RJ S. MAURICE Total051805190528650265136566658868096840
051805190528650265136566658868096840
1,151 1,281 89.9%1,151 1,281 89.9%
105 118 89.0%113 113 100.0%114 153 74.5%141 172 82.0%164 167 98.2%96 107 89.7%
100 110 90.9%137 157 87.3%181 184 98.4%

Homer Fund Campaign Store ReportReport prepared by HR Reporting & AnalyticsData as of 11/3/2017
DIVISION REGION DISTRICT HR Store Nbr Finance Store Nbr Participants Headcount PART%SD SOUTHERN DIVISION 05A1 SOUTHWEST REGION Total
30RJ S. STANDEFER Total390239033904390739093913391539198922
390239033904390739093913391539198922
967 1,127 85.8%967 1,127 85.8%121 127 95.3%92 104 88.5%
136 152 89.5%113 119 95.0%128 143 89.5%111 140 79.3%98 113 86.7%90 118 76.3%78 111 70.3%

Homer Fund Campaign Store ReportReport prepared by HR Reporting & AnalyticsData as of 11/3/2017
DIVISION REGION DISTRICT HR Store Nbr Finance Store Nbr Participants Headcount PART%SD SOUTHERN DIVISION 05A1 SOUTHWEST REGION Total
05RX T. CARPENTER Total052405400587653365486549657265816814
052405400587653365486549657265816814
1,132 1,308 86.5%1,132 1,308 86.5%
136 136 100.0%137 144 95.1%114 131 87.0%103 137 75.2%142 151 94.0%145 163 89.0%125 128 97.7%112 135 83.0%118 183 64.5%

Homer Fund Campaign Store ReportReport prepared by HR Reporting & AnalyticsData as of 11/3/2017
DIVISION REGION DISTRICT HR Store Nbr Finance Store Nbr Participants Headcount PART%SD SOUTHERN DIVISION 05A2 GULF REGION Total
05RD B. BELL Total058105820586058865446547655168188437
058105820586058865446547655168188437
1,117 1,322 84.5%1,117 1,322 84.5%
124 137 90.5%152 169 89.9%129 163 79.1%120 152 78.9%131 147 89.1%103 121 85.1%132 154 85.7%117 136 86.0%109 143 76.2%

Homer Fund Campaign Store ReportReport prepared by HR Reporting & AnalyticsData as of 11/3/2017
DIVISION REGION DISTRICT HR Store Nbr Finance Store Nbr Participants Headcount PART%SD SOUTHERN DIVISION 05A2 GULF REGION Total
05RM B. LICZWEK Total05660577057805846525654365586567680668596985
05660577057805846525654365586567680668596985
1,641 2,032 80.8%1,641 2,032 80.8%
195 254 76.8%171 243 70.4%119 153 77.8%185 201 92.0%171 176 97.2%100 133 75.2%101 129 78.3%151 192 78.6%198 222 89.2%119 143 83.2%131 186 70.4%

Homer Fund Campaign Store ReportReport prepared by HR Reporting & AnalyticsData as of 11/3/2017
DIVISION REGION DISTRICT HR Store Nbr Finance Store Nbr Participants Headcount PART%SD SOUTHERN DIVISION 05A2 GULF REGION Total
03RD J. FARMER Total0526057465176530653965466564657465846587
0526057465176530653965466564657465846587
1,187 1,510 78.6%1,187 1,510 78.6%
125 197 63.5%107 158 67.7%110 112 98.2%134 141 95.0%99 134 73.9%
114 168 67.9%127 138 92.0%127 159 79.9%125 171 73.1%119 132 90.2%

Homer Fund Campaign Store ReportReport prepared by HR Reporting & AnalyticsData as of 11/3/2017
DIVISION REGION DISTRICT HR Store Nbr Finance Store Nbr Participants Headcount PART%SD SOUTHERN DIVISION 05A2 GULF REGION Total
05RF J. MURABITO Total05010565056918321853185965016507650965608419
05010565056918321853185965016507650965608419
1,429 1,800 79.4%1,429 1,800 79.4%
110 132 83.3%151 203 74.4%166 205 81.0%88 122 72.1%
129 163 79.1%114 153 74.5%128 186 68.8%105 128 82.0%150 211 71.1%147 147 100.0%141 150 94.0%

Homer Fund Campaign Store ReportReport prepared by HR Reporting & AnalyticsData as of 11/3/2017
DIVISION REGION DISTRICT HR Store Nbr Finance Store Nbr Participants Headcount PART%SD SOUTHERN DIVISION 05A2 GULF REGION Total
05RU J. REED Total0503058065296550655665766832698869898520
0503058065296550655665766832698869898520
1,224 1,403 87.2%1,224 1,403 87.2%
162 171 94.7%154 159 96.9%164 178 92.1%139 150 92.7%108 129 83.7%83 110 75.5%80 96 83.3%
121 129 93.8%96 131 73.3%
117 150 78.0%

Homer Fund Campaign Store ReportReport prepared by HR Reporting & AnalyticsData as of 11/3/2017
DIVISION REGION DISTRICT HR Store Nbr Finance Store Nbr Participants Headcount PART%SD SOUTHERN DIVISION 05A2 GULF REGION Total
05RW M. PAYNE Total0504050965266532653865856808683068638439
0504050965266532653865856808683068638439
1,291 1,422 90.8%1,291 1,422 90.8%
126 142 88.7%138 157 87.9%126 139 90.6%147 156 94.2%162 183 88.5%112 132 84.8%124 136 91.2%121 125 96.8%122 123 99.2%113 129 87.6%

Homer Fund Campaign Store ReportReport prepared by HR Reporting & AnalyticsData as of 11/3/2017
DIVISION REGION DISTRICT HR Store Nbr Finance Store Nbr Participants Headcount PART%SD SOUTHERN DIVISION 05A2 GULF REGION Total
05RH M. PUCKETT Total051465316542655365636570657568396892841884548995
051465316542655365636570657568396892841884548995
1,638 1,832 89.4%1,638 1,832 89.4%
103 112 92.0%111 135 82.2%157 187 84.0%135 143 94.4%116 133 87.2%196 217 90.3%109 120 90.8%161 187 86.1%215 234 91.9%88 102 86.3%
111 123 90.2%136 139 97.8%

Homer Fund Campaign Store ReportReport prepared by HR Reporting & AnalyticsData as of 11/3/2017
DIVISION REGION DISTRICT HR Store Nbr Finance Store Nbr Participants Headcount PART%SD SOUTHERN DIVISION 05A2 GULF REGION Total
05RR N. GONZALEZ Total05060516652165286540657769848519
05060516652165286540657769848519
976 1,135 86.0%976 1,135 86.0%127 139 91.4%98 121 81.0%
130 136 95.6%117 141 83.0%124 146 84.9%144 155 92.9%113 131 86.3%123 166 74.1%

Homer Fund Campaign Store ReportReport prepared by HR Reporting & AnalyticsData as of 11/3/2017
DIVISION REGION DISTRICT HR Store Nbr Finance Store Nbr Participants Headcount PART%SD SOUTHERN DIVISION 05A2 GULF REGION Total
05RQ P. JOHNSON Total0534057105856506651265616586682868386860
0534057105856506651265616586682868386860
1,408 1,809 77.8%1,408 1,809 77.8%
160 248 64.5%110 145 75.9%152 164 92.7%140 186 75.3%146 170 85.9%152 247 61.5%155 176 88.1%161 168 95.8%109 130 83.8%123 175 70.3%

Homer Fund Campaign Store ReportReport prepared by HR Reporting & AnalyticsData as of 11/3/2017
DIVISION REGION DISTRICT HR Store Nbr Finance Store Nbr Participants Headcount PART%SD SOUTHERN DIVISION 05A2 GULF REGION Total
05RC R. HINSON Total0508056805766510651665236559657868198518
0508056805766510651665236559657868198518
1,372 1,706 80.4%1,372 1,706 80.4%
128 176 72.7%181 211 85.8%125 160 78.1%144 201 71.6%192 219 87.7%150 191 78.5%127 138 92.0%110 127 86.6%140 178 78.7%75 105 71.4%

Homer Fund Campaign Store ReportReport prepared by HR Reporting & AnalyticsData as of 11/3/2017
DIVISION REGION DISTRICT HR Store Nbr Finance Store Nbr Participants Headcount PART%WC WESTERN DIVISION 06A1 PACIFIC CENTRAL REGION Total
66RD J. CASTILLO Total100210101039104810616611661666896855
100210101039104810616611661666896855
1,908 2,113 90.3%1,908 2,113 90.3%
219 220 99.5%133 148 89.9%174 231 75.3%268 268 100.0%147 170 86.5%316 339 93.2%283 321 88.2%245 262 93.5%123 154 79.9%

Homer Fund Campaign Store ReportReport prepared by HR Reporting & AnalyticsData as of 11/3/2017
DIVISION REGION DISTRICT HR Store Nbr Finance Store Nbr Participants Headcount PART%WC WESTERN DIVISION 06A1 PACIFIC CENTRAL REGION Total
06RX J. CRUZ Total060906120653105510706613663266446661
060906120653105510706613663266446661
1,821 1,902 95.7%1,821 1,902 95.7%
243 251 96.8%140 148 94.6%129 134 96.3%159 159 100.0%168 172 97.7%268 298 89.9%199 200 99.5%239 249 96.0%276 291 94.8%

Homer Fund Campaign Store ReportReport prepared by HR Reporting & AnalyticsData as of 11/3/2017
DIVISION REGION DISTRICT HR Store Nbr Finance Store Nbr Participants Headcount PART%WC WESTERN DIVISION 06A1 PACIFIC CENTRAL REGION Total
66RA J. FLORES Total101210311040105266236638664066626681
101210311040105266236638664066626681
1,220 1,457 83.7%1,220 1,457 83.7%
122 167 73.1%93 121 76.9%
176 200 88.0%151 162 93.2%142 170 83.5%153 166 92.2%124 170 72.9%145 186 78.0%114 115 99.1%

Homer Fund Campaign Store ReportReport prepared by HR Reporting & AnalyticsData as of 11/3/2017
DIVISION REGION DISTRICT HR Store Nbr Finance Store Nbr Participants Headcount PART%WC WESTERN DIVISION 06A1 PACIFIC CENTRAL REGION Total
06RC J. SICKINGER Total06491845661766296654666366738463
06491845661766296654666366738463
1,412 1,551 91.0%1,412 1,551 91.0%
175 191 91.6%172 176 97.7%167 193 86.5%211 267 79.0%178 180 98.9%136 154 88.3%245 249 98.4%128 141 90.8%

Homer Fund Campaign Store ReportReport prepared by HR Reporting & AnalyticsData as of 11/3/2017
DIVISION REGION DISTRICT HR Store Nbr Finance Store Nbr Participants Headcount PART%WC WESTERN DIVISION 06A1 PACIFIC CENTRAL REGION Total
04RD L. CAYLOR Total3301330233033305330633073308331433153316331833223324
3301330233033305330633073308331433153316331833223324
1,611 1,787 90.2%1,611 1,787 90.2%
122 152 80.3%127 136 93.4%154 173 89.0%143 154 92.9%152 152 100.0%113 132 85.6%136 155 87.7%114 116 98.3%119 132 90.2%122 136 89.7%128 131 97.7%94 110 85.5%87 108 80.6%

Homer Fund Campaign Store ReportReport prepared by HR Reporting & AnalyticsData as of 11/3/2017
DIVISION REGION DISTRICT HR Store Nbr Finance Store Nbr Participants Headcount PART%WC WESTERN DIVISION 06A1 PACIFIC CENTRAL REGION Total
06RS L. DIAZ Total060706080654068406891037661066276684
060706080654068406891037661066276684
1,507 1,649 91.4%1,507 1,649 91.4%
137 170 80.6%181 186 97.3%147 157 93.6%151 152 99.3%111 142 78.2%187 201 93.0%257 267 96.3%192 205 93.7%144 169 85.2%

Homer Fund Campaign Store ReportReport prepared by HR Reporting & AnalyticsData as of 11/3/2017
DIVISION REGION DISTRICT HR Store Nbr Finance Store Nbr Participants Headcount PART%WC WESTERN DIVISION 06A1 PACIFIC CENTRAL REGION Total
66RH M. CORTEZ Total0663066410141073108010861088661566186946842684278529
0663066410141073108010861088661566186946842684278529
1,569 1,766 88.8%1,569 1,766 88.8%
154 171 90.1%163 173 94.2%135 157 86.0%108 124 87.1%87 112 77.7%
134 151 88.7%98 116 84.5%
116 132 87.9%123 138 89.1%104 104 100.0%113 121 93.4%109 120 90.8%125 147 85.0%

Homer Fund Campaign Store ReportReport prepared by HR Reporting & AnalyticsData as of 11/3/2017
DIVISION REGION DISTRICT HR Store Nbr Finance Store Nbr Participants Headcount PART%WC WESTERN DIVISION 06A1 PACIFIC CENTRAL REGION Total
66RG M. MILLANPONCE Total0638066510501060106410891844665166876834683568836972
0638066510501060106410891844665166876834683568836972
1,602 1,704 94.0%1,602 1,704 94.0%
121 121 100.0%133 143 93.0%124 137 90.5%135 154 87.7%144 158 91.1%99 104 95.2%
126 129 97.7%153 155 98.7%135 142 95.1%125 133 94.0%108 111 97.3%127 129 98.4%72 88 81.8%

Homer Fund Campaign Store ReportReport prepared by HR Reporting & AnalyticsData as of 11/3/2017
DIVISION REGION DISTRICT HR Store Nbr Finance Store Nbr Participants Headcount PART%WC WESTERN DIVISION 06A1 PACIFIC CENTRAL REGION Total
06RH S. BARAHONA Total061106180620064810051062185866146670
061106180620064810051062185866146670
1,568 1,772 88.5%1,568 1,772 88.5%
159 178 89.3%216 247 87.4%266 277 96.0%137 173 79.2%146 168 86.9%168 201 83.6%155 164 94.5%176 200 88.0%145 164 88.4%

Homer Fund Campaign Store ReportReport prepared by HR Reporting & AnalyticsData as of 11/3/2017
DIVISION REGION DISTRICT HR Store Nbr Finance Store Nbr Participants Headcount PART%WC WESTERN DIVISION 06A2 PACIFIC SOUTH REGION Total
06RE A. MENDIETA Total066710131059663066376874697185268987
066710131059663066376874697185268987
1,143 1,453 78.7%1,143 1,453 78.7%
132 145 91.0%164 208 78.8%101 117 86.3%133 173 76.9%141 185 76.2%112 135 83.0%112 144 77.8%142 189 75.1%106 157 67.5%

Homer Fund Campaign Store ReportReport prepared by HR Reporting & AnalyticsData as of 11/3/2017
DIVISION REGION DISTRICT HR Store Nbr Finance Store Nbr Participants Headcount PART%WC WESTERN DIVISION 06A2 PACIFIC SOUTH REGION Total
66RF K. KASNER Total0601061606681028108410876619666568758988
0601061606681028108410876619666568758988
1,551 1,728 89.8%1,551 1,728 89.8%
132 147 89.8%129 156 82.7%151 181 83.4%198 206 96.1%183 183 100.0%114 147 77.6%211 231 91.3%155 165 93.9%143 165 86.7%135 147 91.8%

Homer Fund Campaign Store ReportReport prepared by HR Reporting & AnalyticsData as of 11/3/2017
DIVISION REGION DISTRICT HR Store Nbr Finance Store Nbr Participants Headcount PART%WC WESTERN DIVISION 06A2 PACIFIC SOUTH REGION Total
06RW K. NOTO-CARLOS Total06150647107266396643664766506657689369526965
06150647107266396643664766506657689369526965
1,652 2,024 81.6%1,652 2,024 81.6%
119 148 80.4%123 158 77.8%125 150 83.3%159 203 78.3%222 266 83.5%163 204 79.9%167 202 82.7%158 183 86.3%146 162 90.1%113 154 73.4%157 194 80.9%

Homer Fund Campaign Store ReportReport prepared by HR Reporting & AnalyticsData as of 11/3/2017
DIVISION REGION DISTRICT HR Store Nbr Finance Store Nbr Participants Headcount PART%WC WESTERN DIVISION 06A2 PACIFIC SOUTH REGION Total
06RZ M. ASTORINO Total06580659067106730674068010301032103418486634
06580659067106730674068010301032103418486634
2,134 2,618 81.5%2,134 2,618 81.5%
156 176 88.6%257 305 84.3%173 206 84.0%159 182 87.4%223 272 82.0%249 317 78.5%124 136 91.2%189 280 67.5%126 161 78.3%292 328 89.0%186 255 72.9%

Homer Fund Campaign Store ReportReport prepared by HR Reporting & AnalyticsData as of 11/3/2017
DIVISION REGION DISTRICT HR Store Nbr Finance Store Nbr Participants Headcount PART%WC WESTERN DIVISION 06A2 PACIFIC SOUTH REGION Total
06RG M. RIVERA Total0660066906791018105310746612665666798949
0660066906791018105310746612665666798949
1,581 1,804 87.6%1,581 1,804 87.6%
197 240 82.1%153 188 81.4%198 206 96.1%149 171 87.1%158 173 91.3%139 157 88.5%147 172 85.5%159 170 93.5%148 194 76.3%133 133 100.0%

Homer Fund Campaign Store ReportReport prepared by HR Reporting & AnalyticsData as of 11/3/2017
DIVISION REGION DISTRICT HR Store Nbr Finance Store Nbr Participants Headcount PART%WC WESTERN DIVISION 06A2 PACIFIC SOUTH REGION Total
17RB R. JOANOU Total17011702170317041705170617108453
17011702170317041705170617108453
1,350 1,683 80.2%1,350 1,683 80.2%
337 395 85.3%157 222 70.7%200 206 97.1%105 126 83.3%109 157 69.4%122 183 66.7%175 189 92.6%145 205 70.7%

Homer Fund Campaign Store ReportReport prepared by HR Reporting & AnalyticsData as of 11/3/2017
DIVISION REGION DISTRICT HR Store Nbr Finance Store Nbr Participants Headcount PART%WC WESTERN DIVISION 06A2 PACIFIC SOUTH REGION Total
06RD T. JENKINS Total060306060614107718406628664666646668668069638525
060306060614107718406628664666646668668069638525
1,641 2,110 77.8%1,641 2,110 77.8%
125 176 71.0%169 193 87.6%133 178 74.7%133 170 78.2%133 176 75.6%102 123 82.9%163 194 84.0%178 234 76.1%121 147 82.3%138 188 73.4%148 200 74.0%98 131 74.8%

Homer Fund Campaign Store ReportReport prepared by HR Reporting & AnalyticsData as of 11/3/2017
DIVISION REGION DISTRICT HR Store Nbr Finance Store Nbr Participants Headcount PART%WC WESTERN DIVISION 06A2 PACIFIC SOUTH REGION Total
06RN T. PFINGSTON Total06100645068306871083185766456683687668846960
06100645068306871083185766456683687668846960
1,494 1,645 90.8%1,494 1,645 90.8%
121 143 84.6%143 155 92.3%133 151 88.1%167 178 93.8%122 149 81.9%138 155 89.0%143 144 99.3%120 136 88.2%114 133 85.7%147 148 99.3%146 153 95.4%

Homer Fund Campaign Store ReportReport prepared by HR Reporting & AnalyticsData as of 11/3/2017
DIVISION REGION DISTRICT HR Store Nbr Finance Store Nbr Participants Headcount PART%WC WESTERN DIVISION 06A3 PACIFIC NORTHWEST REGION Total
40RE A. LOPEZ-SZPAK Total4003400840094019402040284029403240348557
4003400840094019402040284029403240348557
1,041 1,210 86.0%1,041 1,210 86.0%
106 130 81.5%121 145 83.4%115 123 93.5%95 112 84.8%77 101 76.2%90 104 86.5%
109 129 84.5%86 100 86.0%
141 146 96.6%101 120 84.2%

Homer Fund Campaign Store ReportReport prepared by HR Reporting & AnalyticsData as of 11/3/2017
DIVISION REGION DISTRICT HR Store Nbr Finance Store Nbr Participants Headcount PART%WC WESTERN DIVISION 06A3 PACIFIC NORTHWEST REGION Total
40RD B. KUBIN Total40014002400640104015401840304031472747394746
40014002400640104015401840304031472747394746
1,318 1,604 82.2%1,318 1,604 82.2%
159 178 89.3%171 189 90.5%116 149 77.9%122 167 73.1%109 140 77.9%146 184 79.3%114 127 89.8%72 92 78.3%99 137 72.3%
116 120 96.7%94 121 77.7%

Homer Fund Campaign Store ReportReport prepared by HR Reporting & AnalyticsData as of 11/3/2017
DIVISION REGION DISTRICT HR Store Nbr Finance Store Nbr Participants Headcount PART%WC WESTERN DIVISION 06A3 PACIFIC NORTHWEST REGION Total
40RA D. LARSEN Total40044007401340144017402340264040471847254738
40044007401340144017402340264040471847254738
1,489 1,803 82.6%1,489 1,803 82.6%
117 142 82.4%131 156 84.0%192 219 87.7%141 174 81.0%174 244 71.3%89 110 80.9%97 107 90.7%
157 201 78.1%158 203 77.8%118 127 92.9%115 120 95.8%

Homer Fund Campaign Store ReportReport prepared by HR Reporting & AnalyticsData as of 11/3/2017
DIVISION REGION DISTRICT HR Store Nbr Finance Store Nbr Participants Headcount PART%WC WESTERN DIVISION 06A3 PACIFIC NORTHWEST REGION Total
47RE E. WALKER Total1301130213031304893889398940
1301130213031304893889398940
644 805 80.0%644 805 80.0%97 124 78.2%92 113 81.4%91 118 77.1%
114 130 87.7%94 114 82.5%70 100 70.0%86 106 81.1%

Homer Fund Campaign Store ReportReport prepared by HR Reporting & AnalyticsData as of 11/3/2017
DIVISION REGION DISTRICT HR Store Nbr Finance Store Nbr Participants Headcount PART%WC WESTERN DIVISION 06A3 PACIFIC NORTHWEST REGION Total
47RB J. ECCLES Total47014708470947204724472847404742474785628964
47014708470947204724472847404742474785628964
1,127 1,434 78.6%1,127 1,434 78.6%
113 141 80.1%102 115 88.7%115 141 81.6%126 162 77.8%98 124 79.0%
114 143 79.7%105 113 92.9%87 125 69.6%
106 132 80.3%81 128 63.3%80 110 72.7%

Homer Fund Campaign Store ReportReport prepared by HR Reporting & AnalyticsData as of 11/3/2017
DIVISION REGION DISTRICT HR Store Nbr Finance Store Nbr Participants Headcount PART%WC WESTERN DIVISION 06A3 PACIFIC NORTHWEST REGION Total
47RH J. LUTES Total4712471347154716472647414745856185638998
4712471347154716472647414745856185638998
1,071 1,400 76.5%1,071 1,400 76.5%
151 192 78.6%129 200 64.5%132 143 92.3%92 124 74.2%94 127 74.0%
105 122 86.1%103 131 78.6%83 125 66.4%81 103 78.6%
101 133 75.9%

Homer Fund Campaign Store ReportReport prepared by HR Reporting & AnalyticsData as of 11/3/2017
DIVISION REGION DISTRICT HR Store Nbr Finance Store Nbr Participants Headcount PART%WC WESTERN DIVISION 06A3 PACIFIC NORTHWEST REGION Total
31RA J. WALLIS Total310131023103310431053106
310131023103310431053106
504 691 72.9%504 691 72.9%81 126 64.3%81 113 71.7%95 115 82.6%80 126 63.5%77 104 74.0%90 107 84.1%

Homer Fund Campaign Store ReportReport prepared by HR Reporting & AnalyticsData as of 11/3/2017
DIVISION REGION DISTRICT HR Store Nbr Finance Store Nbr Participants Headcount PART%WC WESTERN DIVISION 06A3 PACIFIC NORTHWEST REGION Total
47RD L. STOCKER Total1803180818104714471947324735474347488966
1803180818104714471947324735474347488966
1,030 1,222 84.3%1,030 1,222 84.3%
151 152 99.3%99 119 83.2%73 103 70.9%
147 169 87.0%121 165 73.3%98 109 89.9%99 119 83.2%
100 110 90.9%69 88 78.4%73 88 83.0%

Homer Fund Campaign Store ReportReport prepared by HR Reporting & AnalyticsData as of 11/3/2017
DIVISION REGION DISTRICT HR Store Nbr Finance Store Nbr Participants Headcount PART%WC WESTERN DIVISION 06A3 PACIFIC NORTHWEST REGION Total
47RA M. CARY Total47024703470447054706470747114722472347378944
47024703470447054706470747114722472347378944
1,368 1,815 75.4%1,368 1,815 75.4%
134 173 77.5%119 159 74.8%93 136 68.4%
105 161 65.2%166 229 72.5%120 170 70.6%161 189 85.2%102 126 81.0%128 168 76.2%106 146 72.6%134 158 84.8%

Homer Fund Campaign Store ReportReport prepared by HR Reporting & AnalyticsData as of 11/3/2017
DIVISION REGION DISTRICT HR Store Nbr Finance Store Nbr Participants Headcount PART%WC WESTERN DIVISION 06A3 PACIFIC NORTHWEST REGION Total
44RB T. CANTWELL Total180118021804180518061807180940258941
180118021804180518061807180940258941
941 1,154 81.5%941 1,154 81.5%96 130 73.8%
130 144 90.3%90 124 72.6%
115 117 98.3%104 140 74.3%87 104 83.7%96 135 71.1%92 114 80.7%
131 146 89.7%

Homer Fund Campaign Store ReportReport prepared by HR Reporting & AnalyticsData as of 11/3/2017
DIVISION REGION DISTRICT HR Store Nbr Finance Store Nbr Participants Headcount PART%WC WESTERN DIVISION 06A4 PACIFIC NORTH REGION Total
06RY G. COZY Total06360650065106521085666966756688696685718597
06360650065106521085666966756688696685718597
1,541 1,767 87.2%1,541 1,767 87.2%
149 160 93.1%151 179 84.4%128 154 83.1%121 130 93.1%129 147 87.8%148 171 86.5%139 180 77.2%134 153 87.6%164 183 89.6%89 101 88.1%
189 209 90.4%

Homer Fund Campaign Store ReportReport prepared by HR Reporting & AnalyticsData as of 11/3/2017
DIVISION REGION DISTRICT HR Store Nbr Finance Store Nbr Participants Headcount PART%WC WESTERN DIVISION 06A4 PACIFIC NORTH REGION Total
06RR G. NICHOLAS Total0622100910691843186166216677696769688572
0622100910691843186166216677696769688572
1,273 1,553 82.0%1,273 1,553 82.0%
100 134 74.6%148 159 93.1%117 137 85.4%172 198 86.9%133 155 85.8%113 145 77.9%90 120 75.0%
152 186 81.7%151 195 77.4%97 124 78.2%

Homer Fund Campaign Store ReportReport prepared by HR Reporting & AnalyticsData as of 11/3/2017
DIVISION REGION DISTRICT HR Store Nbr Finance Store Nbr Participants Headcount PART%WC WESTERN DIVISION 06A4 PACIFIC NORTH REGION Total
44RA J. ALVAREZ Total440244034407440944124413441644174418442044214422
440244034407440944124413441644174418442044214422
1,489 1,816 82.0%1,489 1,816 82.0%
155 168 92.3%144 184 78.3%162 176 92.0%121 165 73.3%105 124 84.7%161 190 84.7%144 190 75.8%132 170 77.6%90 126 71.4%92 117 78.6%
102 125 81.6%81 81 100.0%

Homer Fund Campaign Store ReportReport prepared by HR Reporting & AnalyticsData as of 11/3/2017
DIVISION REGION DISTRICT HR Store Nbr Finance Store Nbr Participants Headcount PART%WC WESTERN DIVISION 06A4 PACIFIC NORTH REGION Total
06RJ J. CRAIL Total063306370641065710431379665266678408
063306370641065710431379665266678408
1,192 1,365 87.3%1,192 1,365 87.3%
162 190 85.3%120 144 83.3%143 172 83.1%169 188 89.9%118 127 92.9%156 171 91.2%131 134 97.8%111 138 80.4%82 101 81.2%

Homer Fund Campaign Store ReportReport prepared by HR Reporting & AnalyticsData as of 11/3/2017
DIVISION REGION DISTRICT HR Store Nbr Finance Store Nbr Participants Headcount PART%WC WESTERN DIVISION 06A4 PACIFIC NORTH REGION Total
44RD J. TANNER Total44014406440844104411441444154419600385668583
44014406440844104411441444154419600385668583
1,220 1,498 81.4%1,220 1,498 81.4%
115 139 82.7%128 154 83.1%101 140 72.1%119 153 77.8%148 163 90.8%97 115 84.3%99 139 71.2%
111 121 91.7%74 89 83.1%94 131 71.8%
134 154 87.0%

Homer Fund Campaign Store ReportReport prepared by HR Reporting & AnalyticsData as of 11/3/2017
DIVISION REGION DISTRICT HR Store Nbr Finance Store Nbr Participants Headcount PART%WC WESTERN DIVISION 06A4 PACIFIC NORTH REGION Total
66RE L. STEVENS Total0625062906300635101710416636667266786964
0625062906300635101710416636667266786964
1,261 1,579 79.9%1,261 1,579 79.9%
137 178 77.0%103 138 74.6%119 150 79.3%132 157 84.1%148 200 74.0%142 156 91.0%106 137 77.4%154 187 82.4%109 132 82.6%111 144 77.1%

Homer Fund Campaign Store ReportReport prepared by HR Reporting & AnalyticsData as of 11/3/2017
DIVISION REGION DISTRICT HR Store Nbr Finance Store Nbr Participants Headcount PART%WC WESTERN DIVISION 06A4 PACIFIC NORTH REGION Total
06RL M. SPATES Total101910681846660966496682849285248975
101910681846660966496682849285248975
976 1,166 83.7%976 1,166 83.7%108 133 81.2%92 119 77.3%98 122 80.3%
137 148 92.6%137 167 82.0%146 158 92.4%92 107 86.0%66 93 71.0%
100 119 84.0%

Homer Fund Campaign Store ReportReport prepared by HR Reporting & AnalyticsData as of 11/3/2017
DIVISION REGION DISTRICT HR Store Nbr Finance Store Nbr Participants Headcount PART%WC WESTERN DIVISION 06A4 PACIFIC NORTH REGION Total
06RM S. KUBIAK Total062806320639064006421092660366356655
062806320639064006421092660366356655
1,455 1,647 88.3%1,455 1,647 88.3%
211 213 99.1%140 179 78.2%167 184 90.8%107 139 77.0%194 215 90.2%182 182 100.0%149 164 90.9%136 185 73.5%169 186 90.9%

Homer Fund Campaign Store ReportReport prepared by HR Reporting & AnalyticsData as of 11/3/2017
DIVISION REGION DISTRICT HR Store Nbr Finance Store Nbr Participants Headcount PART%WC WESTERN DIVISION 06A4 PACIFIC NORTH REGION Total
40RB S. MITCHELL Total33043309331033113312331333208560
33043309331033113312331333208560
858 1,033 83.1%858 1,033 83.1%122 149 81.9%85 101 84.2%96 125 76.8%
151 151 100.0%98 127 77.2%
120 131 91.6%81 112 72.3%
105 137 76.6%

Homer Fund Campaign Store ReportReport prepared by HR Reporting & AnalyticsData as of 11/3/2017
DIVISION REGION DISTRICT HR Store Nbr Finance Store Nbr Participants Headcount PART%WC WESTERN DIVISION 06A4 PACIFIC NORTH REGION Total
06RB S. REEVES Total066210011003100610201022184266016620666066746947
066210011003100610201022184266016620666066746947
1,556 1,840 84.6%1,556 1,840 84.6%
108 149 72.5%109 128 85.2%123 145 84.8%116 144 80.6%115 146 78.8%134 174 77.0%139 159 87.4%130 143 90.9%187 199 94.0%99 123 80.5%
180 196 91.8%116 134 86.6%

Homer Fund Campaign Store ReportReport prepared by HR Reporting & AnalyticsData as of 11/3/2017
DIVISION REGION DISTRICT HR Store Nbr Finance Store Nbr Participants Headcount PART%WC WESTERN DIVISION 06A4 PACIFIC NORTH REGION Total
06RK T. GUDAS Total062706340643064410071044107613806604
062706340643064410071044107613806604
1,472 1,716 85.8%1,472 1,716 85.8%
260 292 89.0%183 224 81.7%179 191 93.7%116 152 76.3%213 236 90.3%127 144 88.2%146 170 85.9%102 126 81.0%146 181 80.7%

Homer Fund Campaign Store ReportReport prepared by HR Reporting & AnalyticsData as of 11/3/2017
DIVISION REGION DISTRICT HR Store Nbr Finance Store Nbr Participants Headcount PART%WC WESTERN DIVISION 06A5 PAC MTN/DESERT REGION Total
15RE B. PABST Total1504151015111516151815311538154015411542
1504151015111516151815311538154015411542
1,275 1,509 84.5%1,275 1,509 84.5%
148 157 94.3%128 142 90.1%97 118 82.2%
131 195 67.2%144 171 84.2%121 158 76.6%131 151 86.8%161 196 82.1%122 125 97.6%92 96 95.8%

Homer Fund Campaign Store ReportReport prepared by HR Reporting & AnalyticsData as of 11/3/2017
DIVISION REGION DISTRICT HR Store Nbr Finance Store Nbr Participants Headcount PART%WC WESTERN DIVISION 06A5 PAC MTN/DESERT REGION Total
04RC C. BROWN Total0404040604150417045604690470047104738582
0404040604150417045604690470047104738582
1,484 1,617 91.8%1,484 1,617 91.8%
202 221 91.4%148 163 90.8%169 183 92.3%126 139 90.6%130 146 89.0%176 184 95.7%105 118 89.0%119 139 85.6%190 194 97.9%119 130 91.5%

Homer Fund Campaign Store ReportReport prepared by HR Reporting & AnalyticsData as of 11/3/2017
DIVISION REGION DISTRICT HR Store Nbr Finance Store Nbr Participants Headcount PART%WC WESTERN DIVISION 06A5 PAC MTN/DESERT REGION Total
15RC C. WHITE Total1502150315061517152115241546154715481552
1502150315061517152115241546154715481552
1,318 1,657 79.5%1,318 1,657 79.5%
179 257 69.6%141 199 70.9%88 123 71.5%
136 153 88.9%110 148 74.3%124 160 77.5%165 191 86.4%136 140 97.1%131 151 86.8%108 135 80.0%

Homer Fund Campaign Store ReportReport prepared by HR Reporting & AnalyticsData as of 11/3/2017
DIVISION REGION DISTRICT HR Store Nbr Finance Store Nbr Participants Headcount PART%WC WESTERN DIVISION 06A5 PAC MTN/DESERT REGION Total
04RA D. KING Total04030416042104230442044604520482
04030416042104230442044604520482
832 997 83.5%832 997 83.5%82 98 83.7%
126 138 91.3%91 120 75.8%95 125 76.0%
101 107 94.4%105 120 87.5%117 146 80.1%115 143 80.4%

Homer Fund Campaign Store ReportReport prepared by HR Reporting & AnalyticsData as of 11/3/2017
DIVISION REGION DISTRICT HR Store Nbr Finance Store Nbr Participants Headcount PART%WC WESTERN DIVISION 06A5 PAC MTN/DESERT REGION Total
44RC D. LANSDEN Total1507151315141520152215251535153715491550
1507151315141520152215251535153715491550
1,113 1,421 78.3%1,113 1,421 78.3%
123 171 71.9%119 146 81.5%98 170 57.6%
102 129 79.1%149 158 94.3%88 121 72.7%91 109 83.5%
112 128 87.5%126 154 81.8%105 135 77.8%

Homer Fund Campaign Store ReportReport prepared by HR Reporting & AnalyticsData as of 11/3/2017
DIVISION REGION DISTRICT HR Store Nbr Finance Store Nbr Participants Headcount PART%WC WESTERN DIVISION 06A5 PAC MTN/DESERT REGION Total
15RB D. LATAILLE Total1512151515291544154532106001600260046005
1512151515291544154532106001600260046005
1,010 1,271 79.5%1,010 1,271 79.5%
139 178 78.1%126 172 73.3%140 188 74.5%131 164 79.9%87 88 98.9%91 94 96.8%81 107 75.7%70 95 73.7%67 94 71.3%78 91 85.7%

Homer Fund Campaign Store ReportReport prepared by HR Reporting & AnalyticsData as of 11/3/2017
DIVISION REGION DISTRICT HR Store Nbr Finance Store Nbr Participants Headcount PART%WC WESTERN DIVISION 06A5 PAC MTN/DESERT REGION Total
15RD D. VASQUEZ Total1501150515081509151915231526152815321551
1501150515081509151915231526152815321551
1,524 1,794 84.9%1,524 1,794 84.9%
162 190 85.3%173 190 91.1%108 145 74.5%131 153 85.6%178 198 89.9%142 160 88.8%169 204 82.8%136 159 85.5%176 225 78.2%149 170 87.6%

Homer Fund Campaign Store ReportReport prepared by HR Reporting & AnalyticsData as of 11/3/2017
DIVISION REGION DISTRICT HR Store Nbr Finance Store Nbr Participants Headcount PART%WC WESTERN DIVISION 06A5 PAC MTN/DESERT REGION Total
04RF E. HAGSTROM Total040204130424044104530455045904830485
040204130424044104530455045904830485
1,224 1,423 86.0%1,224 1,423 86.0%
120 135 88.9%107 135 79.3%135 141 95.7%142 164 86.6%137 138 99.3%135 152 88.8%107 125 85.6%176 228 77.2%165 205 80.5%

Homer Fund Campaign Store ReportReport prepared by HR Reporting & AnalyticsData as of 11/3/2017
DIVISION REGION DISTRICT HR Store Nbr Finance Store Nbr Participants Headcount PART%WC WESTERN DIVISION 06A5 PAC MTN/DESERT REGION Total
04RE J. MCCORD Total040104050464046804720475048004886948
040104050464046804720475048004886948
1,173 1,458 80.5%1,173 1,458 80.5%
143 155 92.3%129 159 81.1%130 171 76.0%184 203 90.6%112 148 75.7%118 169 69.8%168 186 90.3%107 128 83.6%82 139 59.0%

Homer Fund Campaign Store ReportReport prepared by HR Reporting & AnalyticsData as of 11/3/2017
DIVISION REGION DISTRICT HR Store Nbr Finance Store Nbr Participants Headcount PART%WC WESTERN DIVISION 06A5 PAC MTN/DESERT REGION Total
04RB J. WILLIAMS Total0408041004140443044504670478048104868488
0408041004140443044504670478048104868488
1,208 1,501 80.5%1,208 1,501 80.5%
110 137 80.3%178 219 81.3%130 159 81.8%81 112 72.3%76 106 71.7%
136 168 81.0%126 160 78.8%114 157 72.6%168 180 93.3%89 103 86.4%

Homer Fund Campaign Store ReportReport prepared by HR Reporting & AnalyticsData as of 11/3/2017
DIVISION REGION DISTRICT HR Store Nbr Finance Store Nbr Participants Headcount PART%WC WESTERN DIVISION 06A5 PAC MTN/DESERT REGION Total
04RG R. TILTON Total0411042004220447045704580476047704896862
0411042004220447045704580476047704896862
1,371 1,478 92.8%1,371 1,478 92.8%
100 121 82.6%151 170 88.8%122 123 99.2%123 130 94.6%127 133 95.5%107 112 95.5%120 137 87.6%250 258 96.9%124 145 85.5%147 149 98.7%

Homer Fund Campaign Store ReportReport prepared by HR Reporting & AnalyticsData as of 11/3/2017
DIVISION REGION DISTRICT HR Store Nbr Finance Store Nbr Participants Headcount PART%WC WESTERN DIVISION 06A5 PAC MTN/DESERT REGION Total
05RK TBD-05RK Total1534350135023503350435073508351135143517
1534350135023503350435073508351135143517
1,080 1,328 81.3%1,080 1,328 81.3%
83 130 63.8%138 167 82.6%141 164 86.0%127 167 76.0%100 117 85.5%126 156 80.8%98 98 100.0%77 96 80.2%92 120 76.7%98 113 86.7%

Homer Fund Campaign Store ReportReport prepared by HR Reporting & AnalyticsData as of 11/3/2017
DIVISION REGION DISTRICT HR Store Nbr Finance Store Nbr Participants Headcount PART%YW YOUR OTHER WAREHOUSE DIVISIONYWA1 YOUR OTHER WHSE REGION Total
67RA W. BLAIR Total393860066007670767606777
393860066007670767606777
1,255 1,327 94.6%1,255 1,327 94.6%
79 80 98.8%48 48 100.0%
262 263 99.6%501 527 95.1%41 42 97.6%
324 367 88.3%

Homer Fund Campaign Store ReportReport prepared by HR Reporting & AnalyticsData as of 11/3/2017
DIVISION REGION DIST_NM Participants Headcount PART%DC DISTRIBUTION CENTERS DCA2 WEST REGION RDC Total
C. SOMMER1,875 2,398 78.2%1,875 2,398 78.2%
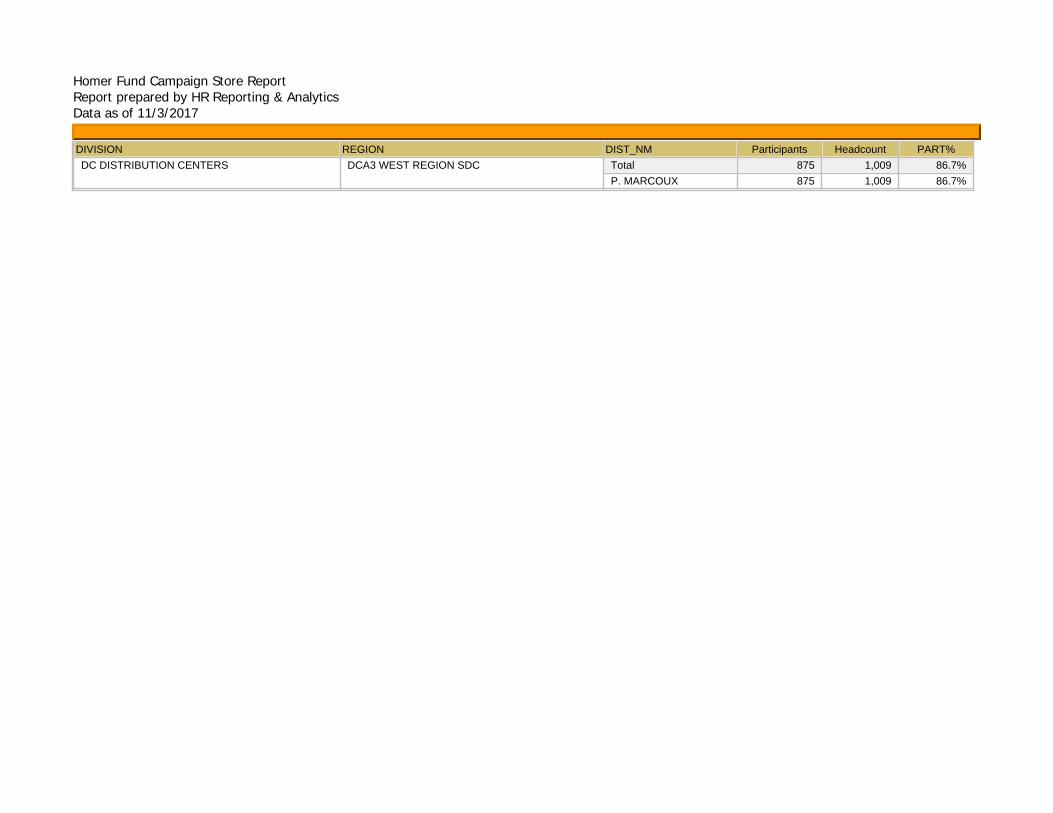
Homer Fund Campaign Store ReportReport prepared by HR Reporting & AnalyticsData as of 11/3/2017
DIVISION REGION DIST_NM Participants Headcount PART%DC DISTRIBUTION CENTERS DCA3 WEST REGION SDC Total
P. MARCOUX875 1,009 86.7%875 1,009 86.7%

Homer Fund Campaign Store ReportReport prepared by HR Reporting & AnalyticsData as of 11/3/2017
DIVISION REGION DIST_NM Participants Headcount PART%DC DISTRIBUTION CENTERS DCA5 BDC PLATFORM REGION Total
K. DENNIS350 363 96.4%350 363 96.4%

Homer Fund Campaign Store ReportReport prepared by HR Reporting & AnalyticsData as of 11/3/2017
DIVISION REGION DIST_NM Participants Headcount PART%DC DISTRIBUTION CENTERS DCA7 EAST REGION SDC Total
M. MCDADE837 893 93.7%837 893 93.7%

Homer Fund Campaign Store ReportReport prepared by HR Reporting & AnalyticsData as of 11/3/2017
DIVISION REGION DIST_NM Participants Headcount PART%DC DISTRIBUTION CENTERS DCA8 NORTH REGION RDC Total
S. JOHNSTONE2,622 3,039 86.3%2,622 3,039 86.3%

Homer Fund Campaign Store ReportReport prepared by HR Reporting & AnalyticsData as of 11/3/2017
DIVISION REGION DIST_NM Participants Headcount PART%DC DISTRIBUTION CENTERS DCA9 SOUTH REGION RDC Total
J. GROTE2,135 2,493 85.6%2,135 2,493 85.6%

Homer Fund Campaign Store ReportReport prepared by HR Reporting & AnalyticsData as of 11/3/2017
DIVISION REGION DIST_NM Participants Headcount PART%HO HOME OFFICE 06HO WESTERN NON-STORE Total
PAC MTN/DESERT G&APAC NORTHWEST G&APACIFIC CENTRAL G&APACIFIC NORTH G&APACIFIC SOUTH G&A
5,414 6,669 81.2%1,143 1,426 80.2%
929 1,173 79.2%1,167 1,381 84.5%1,149 1,440 79.8%1,026 1,249 82.1%

Homer Fund Campaign Store ReportReport prepared by HR Reporting & AnalyticsData as of 11/3/2017
DIVISION REGION DIST_NM Participants Headcount PART%HO HOME OFFICE 52HO SOUTHERN NON-STORE Total
GULF G&AMIDSOUTH FIELD G&ASOUTH ATLANTIC G&ASOUTH FLORIDA/PR G&ASOUTHEAST G&ASOUTHWEST G&A
6,521 7,911 82.4%1,028 1,263 81.4%1,376 1,663 82.7%1,083 1,335 81.1%
869 1,062 81.8%1,070 1,314 81.4%1,095 1,274 85.9%
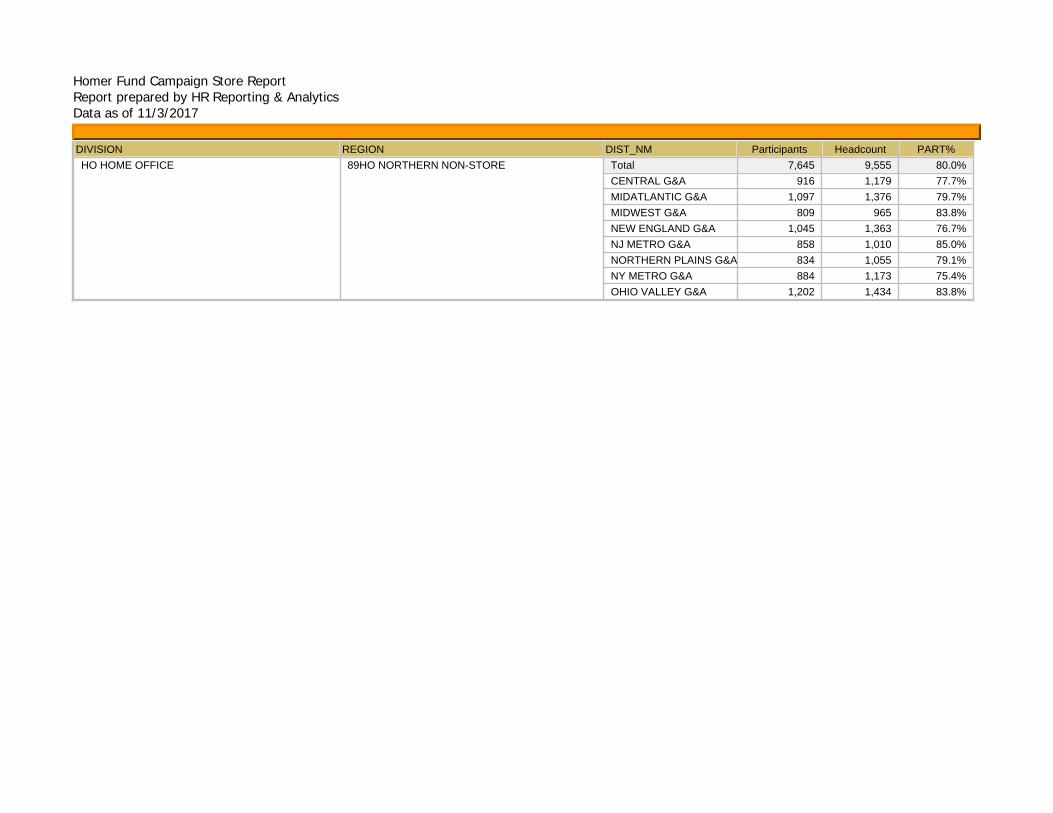
Homer Fund Campaign Store ReportReport prepared by HR Reporting & AnalyticsData as of 11/3/2017
DIVISION REGION DIST_NM Participants Headcount PART%HO HOME OFFICE 89HO NORTHERN NON-STORE Total
CENTRAL G&AMIDATLANTIC G&AMIDWEST G&ANEW ENGLAND G&ANJ METRO G&ANORTHERN PLAINS G&ANY METRO G&AOHIO VALLEY G&A
7,645 9,555 80.0%916 1,179 77.7%
1,097 1,376 79.7%809 965 83.8%
1,045 1,363 76.7%858 1,010 85.0%834 1,055 79.1%884 1,173 75.4%
1,202 1,434 83.8%

Homer Fund Campaign Store ReportReport prepared by HR Reporting & AnalyticsData as of 11/3/2017
DIVISION REGION DIST_NM Participants Headcount PART%ND NORTHERN DIVISION 08A1 CENTRAL REGION Total
B. LYONSC. REASONOVAG. HUTCHINSONJ. GIRVESJ. MORRISK. LONGWELLM. ROMEROS. ESPARZAS. KUMARS. PHILP
11,170 13,787 81.0%1,241 1,559 79.6%1,170 1,279 91.5%1,359 1,529 88.9%1,070 1,373 77.9%
924 1,163 79.4%902 1,157 78.0%
1,663 2,130 78.1%924 1,199 77.1%
1,002 1,211 82.7%915 1,187 77.1%

Homer Fund Campaign Store ReportReport prepared by HR Reporting & AnalyticsData as of 11/3/2017
DIVISION REGION DIST_NM Participants Headcount PART%ND NORTHERN DIVISION 08A3 NORTHERN PLAINS REGION Total
C. INNESD. BUSCHE. BURGJ. BAUMANNK. STOLLL. LOBELLOL. MCCARTYM. BELFORDM. HINCKS. EDWARDST. HODGESW. LAPPIN
10,076 12,623 79.8%918 1,192 77.0%861 1,124 76.6%834 1,098 76.0%716 925 77.4%709 884 80.2%703 908 77.4%792 926 85.5%909 1,171 77.6%
1,007 1,213 83.0%1,039 1,231 84.4%
654 797 82.1%934 1,154 80.9%

Homer Fund Campaign Store ReportReport prepared by HR Reporting & AnalyticsData as of 11/3/2017
DIVISION REGION DIST_NM Participants Headcount PART%ND NORTHERN DIVISION 08A4 OHIO VALLEY REGION Total
A. PAGLIAROJ. GAGEJ. KINDERJ. LERCHJ. MILLAYJ. MILLERM. COLLINSM. MCCARTHYP HAITSCHR. BERTONER. KALPS. GARDNERS. OURST. HAGE
14,083 16,999 82.8%1,037 1,272 81.5%1,049 1,311 80.0%1,199 1,400 85.6%1,121 1,297 86.4%
974 1,168 83.4%1,199 1,442 83.1%
996 1,168 85.3%854 974 87.7%
1,090 1,374 79.3%1,117 1,461 76.5%
858 1,092 78.6%757 910 83.2%951 1,067 89.1%881 1,063 82.9%

Homer Fund Campaign Store ReportReport prepared by HR Reporting & AnalyticsData as of 11/3/2017
DIVISION REGION DIST_NM Participants Headcount PART%ND NORTHERN DIVISION 08A6 MIDWEST REGION Total
B. PLANTENBERGC. LUTZD. LEONARDD. MANDEVILLEG. MCFARRENJ. GIATTINOM. ANZARUTM. CRAMERM. KERRIGANR. SANIGA
10,027 11,738 85.4%925 1,095 84.5%628 770 81.6%
1,249 1,561 80.0%1,028 1,114 92.3%
987 1,176 83.9%1,140 1,381 82.5%
851 927 91.8%775 965 80.3%
1,315 1,516 86.7%1,129 1,233 91.6%

Homer Fund Campaign Store ReportReport prepared by HR Reporting & AnalyticsData as of 11/3/2017
DIVISION REGION DIST_NM Participants Headcount PART%ND NORTHERN DIVISION 09A1 MID ATLANTIC REGION Total
A. MAZZOLAB. DENNISONB. MUNGULH. COLLAZOJ. EMGEJ. ZUNIGAL. HARTLEYM. BOBBITTP. GINNETTIT. MCCARTHYW. SHUELL
13,376 15,266 87.6%1,042 1,175 88.7%1,273 1,462 87.1%1,039 1,195 86.9%1,200 1,316 91.2%1,261 1,411 89.4%1,321 1,599 82.6%1,301 1,490 87.3%1,337 1,465 91.3%1,447 1,644 88.0%1,101 1,210 91.0%1,054 1,299 81.1%

Homer Fund Campaign Store ReportReport prepared by HR Reporting & AnalyticsData as of 11/3/2017
DIVISION REGION DIST_NM Participants Headcount PART%ND NORTHERN DIVISION 09A2 NEW ENGLAND REGION Total
B. KINNEYB. WILLIAMSH. MALAKJ. CARRJ. PHILLIPSJ. WORRELLK. CHAMBERLANDL. CORELLIR.LUNDYS. LONGMOORES. THOMASS. WHITEHOUSE
13,785 16,597 83.1%959 1,130 84.9%
1,197 1,495 80.1%1,098 1,283 85.6%1,194 1,437 83.1%1,050 1,284 81.8%1,226 1,451 84.5%1,057 1,229 86.0%1,214 1,543 78.7%1,162 1,517 76.6%1,274 1,432 89.0%1,072 1,277 83.9%1,282 1,519 84.4%

Homer Fund Campaign Store ReportReport prepared by HR Reporting & AnalyticsData as of 11/3/2017
DIVISION REGION DIST_NM Participants Headcount PART%ND NORTHERN DIVISION 09A3 NJ METRO REGION Total
C. LILLISTONC. PASSERELLIC. WILKIED. AMATOD. BARBOSD. BUSSIERED. HAGENM. SALTARELLIR. HOMMERBOCKERS. LABADY
10,708 12,486 85.8%1,119 1,304 85.8%1,037 1,252 82.8%1,247 1,382 90.2%1,216 1,365 89.1%1,310 1,490 87.9%
829 983 84.3%801 989 81.0%
1,214 1,455 83.4%746 838 89.0%
1,189 1,428 83.3%

Homer Fund Campaign Store ReportReport prepared by HR Reporting & AnalyticsData as of 11/3/2017
DIVISION REGION DIST_NM Participants Headcount PART%ND NORTHERN DIVISION 09A5 METRO NY REGION Total
A. SINGHF. LONGOBARDIF. RAMIREZM. BELLOM. ESPOSITOP. IAQUINTAR. ODDOR. WICKKISERS. LEIGHTONT. MICKIEWICZY. STUBBS
11,530 14,727 78.3%1,103 1,309 84.3%
785 1,081 72.6%916 1,305 70.2%
1,135 1,441 78.8%1,011 1,205 83.9%1,162 1,620 71.7%1,490 1,681 88.6%1,041 1,451 71.7%1,136 1,436 79.1%
850 998 85.2%901 1,200 75.1%

Homer Fund Campaign Store ReportReport prepared by HR Reporting & AnalyticsData as of 11/3/2017
DIVISION REGION DIST_NM Participants Headcount PART%RL REVERSE LOGISTICS RLA1 REVERSE LOGISTICS REG Total
REVERSE LOGISTICS979 1,209 81.0%979 1,209 81.0%

Homer Fund Campaign Store ReportReport prepared by HR Reporting & AnalyticsData as of 11/3/2017
DIVISION REGION DIST_NM Participants Headcount PART%SD SOUTHERN DIVISION 01A1 MIDSOUTH REGION Total
B. REICKD. PEEBLESE. TUMMINGSF. WEBBG. DEMARINISJ. COGDELLJ. HICKINGBOTTOMJ. KINGK. TOVEYK. WILLIAMSM. CHAPMANR. LEBLANCS. HOODU. OPENEW. SALEMI
16,061 19,204 83.6%948 1,118 84.8%
1,069 1,268 84.3%1,058 1,297 81.6%1,079 1,209 89.2%1,332 1,652 80.6%1,043 1,182 88.2%1,109 1,267 87.5%1,127 1,312 85.9%1,119 1,414 79.1%
932 1,038 89.8%1,166 1,378 84.6%
994 1,213 81.9%1,043 1,253 83.2%
897 1,241 72.3%1,145 1,362 84.1%

Homer Fund Campaign Store ReportReport prepared by HR Reporting & AnalyticsData as of 11/3/2017
DIVISION REGION DIST_NM Participants Headcount PART%SD SOUTHERN DIVISION 01A2 SOUTH ATLANTIC REGION Total
A. AMOB. BOAEND. MCCOURTJ. BISPINGJ. SIMMONSJ. STRIZK. NEWELLM. FORMANM. GILREATHN. ROHDERTR. YOUNGT. CONNOLLY
15,126 17,510 86.4%1,316 1,577 83.4%1,414 1,695 83.4%1,530 1,751 87.4%1,340 1,502 89.2%1,079 1,167 92.5%
930 1,112 83.6%971 1,096 88.6%
1,352 1,542 87.7%1,392 1,641 84.8%1,042 1,220 85.4%1,604 1,811 88.6%1,156 1,396 82.8%

Homer Fund Campaign Store ReportReport prepared by HR Reporting & AnalyticsData as of 11/3/2017
DIVISION REGION DIST_NM Participants Headcount PART%SD SOUTHERN DIVISION 02A2 SOUTHEAST REGION Total
A. GHANYE. GONZALEZJ. CANNONK. TAWNEYM. RODRIGUEZP. DIXONS. GASKINST. COLEMANV. SMALLW. RAYA
14,396 16,070 89.6%1,030 1,197 86.0%1,772 1,996 88.8%1,640 1,834 89.4%1,021 1,149 88.9%1,390 1,528 91.0%1,340 1,440 93.1%1,712 1,869 91.6%1,172 1,361 86.1%1,752 1,897 92.4%1,567 1,799 87.1%

Homer Fund Campaign Store ReportReport prepared by HR Reporting & AnalyticsData as of 11/3/2017
DIVISION REGION DIST_NM Participants Headcount PART%SD SOUTHERN DIVISION 02A4 SOUTH FLORIDA/PR REGION Total
C. FRAGAC. MANGINOJ. BEESINGIJ. LOPEZM. VEGAR. RODRIGUEZT. CRAWFORDW. CORK
11,352 13,926 81.5%1,391 1,731 80.4%1,119 1,362 82.2%1,552 2,008 77.3%1,365 1,722 79.3%1,681 2,060 81.6%1,456 1,816 80.2%1,504 1,675 89.8%1,284 1,552 82.7%

Homer Fund Campaign Store ReportReport prepared by HR Reporting & AnalyticsData as of 11/3/2017
DIVISION REGION DIST_NM Participants Headcount PART%SD SOUTHERN DIVISION 05A1 SOUTHWEST REGION Total
A. BRYANTE. MARYG. TAVARESJ. CONSTANTINOJ. LEWISK. LEITZK. MOOREK. PRUITTM. AKINSO. DELAVEGAS. MAURICES. STANDEFERT. CARPENTER
14,069 15,841 88.8%931 1,050 88.7%900 1,058 85.1%
1,215 1,353 89.8%956 1,051 91.0%
1,073 1,193 89.9%1,320 1,478 89.3%1,143 1,250 91.4%
888 1,001 88.7%1,336 1,507 88.7%1,057 1,184 89.3%1,151 1,281 89.9%
967 1,127 85.8%1,132 1,308 86.5%

Homer Fund Campaign Store ReportReport prepared by HR Reporting & AnalyticsData as of 11/3/2017
DIVISION REGION DIST_NM Participants Headcount PART%SD SOUTHERN DIVISION 05A2 GULF REGION Total
B. BELLB. LICZWEKJ. FARMERJ. MURABITOJ. REEDM. PAYNEM. PUCKETTN. GONZALEZP. JOHNSONR. HINSON
13,283 15,971 83.2%1,117 1,322 84.5%1,641 2,032 80.8%1,187 1,510 78.6%1,429 1,800 79.4%1,224 1,403 87.2%1,291 1,422 90.8%1,638 1,832 89.4%
976 1,135 86.0%1,408 1,809 77.8%1,372 1,706 80.4%

Homer Fund Campaign Store ReportReport prepared by HR Reporting & AnalyticsData as of 11/3/2017
DIVISION REGION DIST_NM Participants Headcount PART%WC WESTERN DIVISION 06A1 PACIFIC CENTRAL REGION Total
J. CASTILLOJ. CRUZJ. FLORESJ. SICKINGERL. CAYLORL. DIAZM. CORTEZM. MILLANPONCES. BARAHONA
14,218 15,701 90.6%1,908 2,113 90.3%1,821 1,902 95.7%1,220 1,457 83.7%1,412 1,551 91.0%1,611 1,787 90.2%1,507 1,649 91.4%1,569 1,766 88.8%1,602 1,704 94.0%1,568 1,772 88.5%

Homer Fund Campaign Store ReportReport prepared by HR Reporting & AnalyticsData as of 11/3/2017
DIVISION REGION DIST_NM Participants Headcount PART%WC WESTERN DIVISION 06A2 PACIFIC SOUTH REGION Total
A. MENDIETAK. KASNERK. NOTO-CARLOSM. ASTORINOM. RIVERAR. JOANOUT. JENKINST. PFINGSTON
12,546 15,065 83.3%1,143 1,453 78.7%1,551 1,728 89.8%1,652 2,024 81.6%2,134 2,618 81.5%1,581 1,804 87.6%1,350 1,683 80.2%1,641 2,110 77.8%1,494 1,645 90.8%
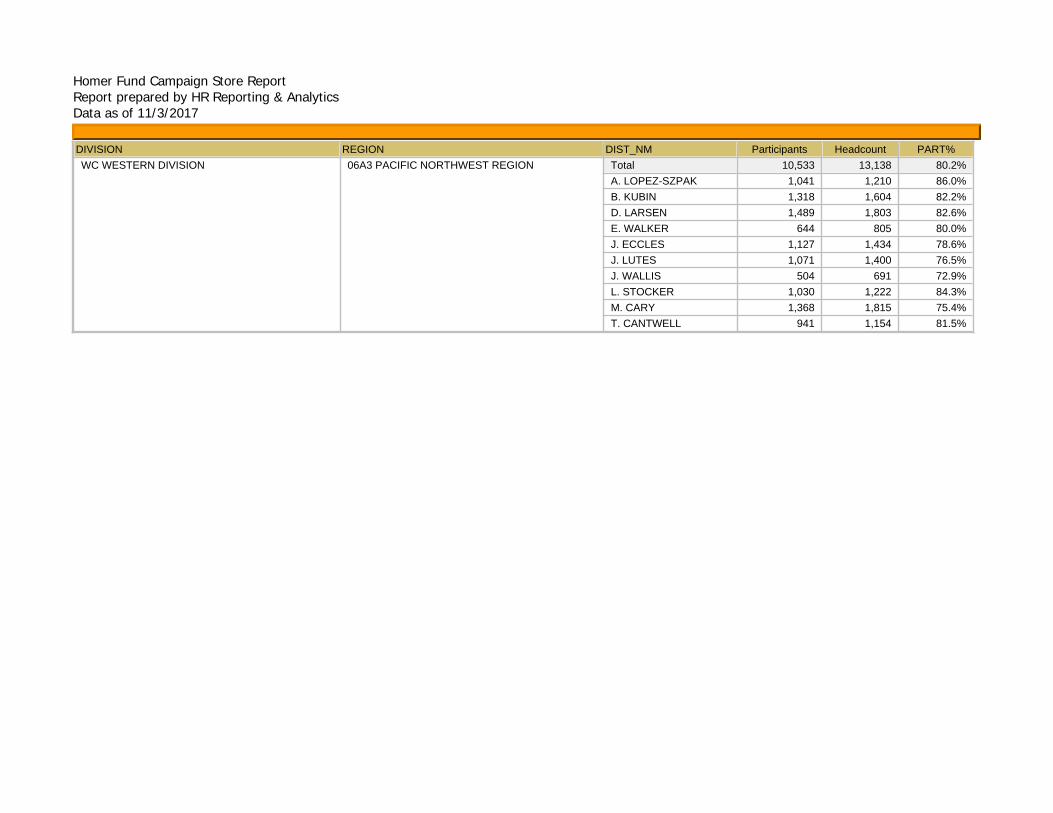
Homer Fund Campaign Store ReportReport prepared by HR Reporting & AnalyticsData as of 11/3/2017
DIVISION REGION DIST_NM Participants Headcount PART%WC WESTERN DIVISION 06A3 PACIFIC NORTHWEST REGION Total
A. LOPEZ-SZPAKB. KUBIND. LARSENE. WALKERJ. ECCLESJ. LUTESJ. WALLISL. STOCKERM. CARYT. CANTWELL
10,533 13,138 80.2%1,041 1,210 86.0%1,318 1,604 82.2%1,489 1,803 82.6%
644 805 80.0%1,127 1,434 78.6%1,071 1,400 76.5%
504 691 72.9%1,030 1,222 84.3%1,368 1,815 75.4%
941 1,154 81.5%

Homer Fund Campaign Store ReportReport prepared by HR Reporting & AnalyticsData as of 11/3/2017
DIVISION REGION DIST_NM Participants Headcount PART%WC WESTERN DIVISION 06A4 PACIFIC NORTH REGION Total
G. COZYG. NICHOLASJ. ALVAREZJ. CRAILJ. TANNERL. STEVENSM. SPATESS. KUBIAKS. MITCHELLS. REEVEST. GUDAS
14,293 16,980 84.2%1,541 1,767 87.2%1,273 1,553 82.0%1,489 1,816 82.0%1,192 1,365 87.3%1,220 1,498 81.4%1,261 1,579 79.9%
976 1,166 83.7%1,455 1,647 88.3%
858 1,033 83.1%1,556 1,840 84.6%1,472 1,716 85.8%

Homer Fund Campaign Store ReportReport prepared by HR Reporting & AnalyticsData as of 11/3/2017
DIVISION REGION DIST_NM Participants Headcount PART%WC WESTERN DIVISION 06A5 PAC MTN/DESERT REGION Total
B. PABSTC. BROWNC. WHITED. KINGD. LANSDEND. LATAILLED. VASQUEZE. HAGSTROMJ. MCCORDJ. WILLIAMSR. TILTONTBD-05RK
14,612 17,454 83.7%1,275 1,509 84.5%1,484 1,617 91.8%1,318 1,657 79.5%
832 997 83.5%1,113 1,421 78.3%1,010 1,271 79.5%1,524 1,794 84.9%1,224 1,423 86.0%1,173 1,458 80.5%1,208 1,501 80.5%1,371 1,478 92.8%1,080 1,328 81.3%

Homer Fund Campaign Store ReportReport prepared by HR Reporting & AnalyticsData as of 11/3/2017
DIVISION REGION DIST_NM Participants Headcount PART%YW YOUR OTHER WAREHOUSE DIVISION YWA1 YOUR OTHER WHSE REGION Total
W. BLAIR1,255 1,327 94.6%1,255 1,327 94.6%


![Fisher NotchFlo DST - emerson.com · notchflo dst d103036x0cn ˘ 80.2:022 2019 ] 8 ^ 2 ˇˆ ˙˝ ˛˚˜ ! cl 600 3 :](https://img.dokumen.tips/doc/110x75/5fc9e4aa42449c547531b3be/fisher-notchflo-dst-notchflo-dst-d103036x0cn-802022-2019-8-2-.jpg)